
Abstract
The 2022 Qatar World Cup was conducted under unique circumstances, setting it apart from previous editions due to schedule and rule modifications. This study aimed to evaluate the physical demand of teams in terms of running disparities between the 2018 and 2022 World Cups. Match performance data were obtained from the official websites of the 2018 Russia World Cup (n = 988 observations) and the 2022 Qatar World Cup (n = 826 observations). Match outcomes included losses (n = 729 player observations), draws (n = 339 player observations), or wins (n = 746 player observations). Players in all positions covered a greater distance during the 2022 World Cup compared to the 2018 edition. When examining the interaction between Cup and Outcome, only total distance covered (F = 5.831, p = 0.003) and distance covered walking (F = 15.488, p < 0.001) showed statistical differences. These findings elucidate that more total distance was covered during draws, with higher values observed in the 2022 World Cup. Thus, the study concludes that the 2022 Qatar FIFA World Cup presented a higher physical match demand compared to the 2018 Russia FIFA World Cup.
Introduction
Match analysis has been used for a long time in the sports science area. 1 This tool describes match performances using individual and team data, indicating higher or lower values linked to on-field achievements. 2 In football, performance is associated with physical, technical, and tactical actions. 3
Several studies about physical demand of football players are typically conducted during FIFA World Cups.4–14 Over time, it has been shown that various unique factors can influence physical demand, such as changes in rules,10,15 players’ genotype, load monitoring, and cooperation among coaches and sport scientists could be some of these contributing factors. 6 For example, rule changes, such as the implementation of VAR (Video Assistant Referee), may have reduced the number of high-velocity actions in 2018 World Cup, 10 as well as the distance covered (total and per minute) in La Liga matches. 16 These findings may be related to the game's dynamics with VAR intervention. However, total distance covered was higher with VAR in World Cup matches, 17 indicating the complexity of analysing rule changes.
The 2022 Qatar World Cup was conducted under unique conditions that may distinguish it from previous editions, with changes in the schedule and rules. After the COVID outbreak, concerned with reducing physical load and minimizing the risk of injuries, the International Board promoted a change increasing the number of substitutions, from 3 to 5 players for each team who can be switched. 18 This change helped teams to maintain or increase physical match demand.15,19,20 The increased substitution options and the utilization of more rested players during the match may be related to this scenario.19,20
Another unique aspect of the 2022 Qatar World Cup was its scheduling during November and December, aimed at avoiding high temperatures during the Northern Hemisphere summer in Qatar. Consequently, most of the athletes were in the midst of the clubs’ calendar season, unlike previous World Cups. This alteration in the calendar alone could influence players’ physical demand, as various studies suggest that the accumulation of matches over a short period and the fatigue generated by the players at their club leagues may lead to incomplete recoveries.6,21–23
Given the unique conditions of Qatar World Cup compared to previous editions, it allows for the examination of the substitution rule change and the impact of calendar season changes on physical demand, potentially informing improvements for future events. Additionally, it may assist clubs in developing training protocols for competitions based on the substitutions management and the timing of matches throughout the year. Therefore, the aim of this study was to analyse the physical demands of matches from the 2018 and 2022 World Cups. It was hypothesized that there would be higher physical demand for the 2022 World Cup due to the impact of the substitution's rules change and period of the football season.
Material and methods
Match data
Match performance data were retrieved from the official website of 2018 Russia World Cup and 2022 Qatar World Cup. Sixty-one matches were analysed in the 2018 World Cup (n = 988 players observations), since three matches (i.e., Colombia vs Japan; Egypt vs Uruguay; Peru vs Denmark) were excluded from analysis due to FIFA reports not providing one of the dependent variables. In the 2022 Qatar World Cup, sixty-four matches were analysed (n = 826 players observations). Only performances of players who completed the entire match were included.
Dependent variables
Match running performance
For the 2018 World Cup, the data provider company utilized a real-time optical tracking system (STATS, SportVU). This system operated at 25 frames per second, with each frame providing the player's coordinates on the field (x and y). A recent study reported acceptable positional accuracy of this tracking system (56 ± 16 cm) compared to the goal-standard system (VICON motion capture system). 24 For the 2022 World Cup, games were analysed using a multicamera computerised tracking system (TRACAB, Chyron Hego).
Running performance variables (dependent variables) measured in meters (m) included: total distance covered (TD), distance covered walking (Z1: 0–7.0 km·h−1), distance covered in moderate speed running (Z2: 7.1–15.0 km·h−1), distance covered in high speed running (Z3: 15.1–20.0 km·h−1), distance covered in very high speed running (Z4: 20.1–25.0 km·h−1), and distance covered sprinting (Z5: > 25.0 km·h−1). In addition, recorded were the frequency of sprints (i.e., number of actions above 25.0 km·h−1) and top speeds achieved during play (km·h−1).
Independent variables
Player position
The playing positions were analysed differently for each World Cup by the data provider company. In the 2018 World Cup, the positions analysed were goalkeeper, central defenders, external defenders, central midfielders, external midfielders, and forwards. In contrast, for the 2022 World Cup, the positions were grouped into goalkeeper, defender, midfielder, and forward. To ensure consistency, we combined central and external defenders, as well as central and external midfielders. Consequently, our analysis focused on four playing positions: 1) goalkeepers (GK = 247 players’ observations), 2) defenders (DF = 827 players’ observations), 3) midfielders (MF = 549 players’ observations) and 4) forwards (FW = 191 players’ observations). In the 2018 Russia World Cup were analysed 122 goalkeepers, 430 defenders, 337 midfielders, and 99 forwards players’ observations, while in the 2022 Qatar World Cup were analysed 125 goalkeepers, 397 defenders, 212 midfielders, and 92 forwards players’ observations.
Match outcome
Match outcome was the result of each match, including matches losses (n = 729 players’ observations), draws (n = 339 players’ observations) and wins (n = 746 players’ observations). During playoffs, matches with decision by penalties, the outcome was considered as a draw. In the 2018 Russia World Cup and 2022 Qatar World Cup, four and five matches were decided by penalties, respectively.
Team formation
Playing formation was determined by two researchers and qualified coaches by the Brazilian Soccer Confederation according to player distribution over the entire 90-min of match-play (i.e., tactical line-up and actual formation reported by FIFA. A total of six playing formations were analysed: i) 1‒4‒2‒3‒1 (n = 585 players observations); ii) 1‒4‒3‒2‒1 (n = 99 players observations); iii) 1‒3‒4‒3 (n = 174 players observations); iv) 1‒4‒3‒3 (n = 462 players observations); v) 1‒4‒4‒2 (n = 239 players observations); and vi) 1‒3‒5‒2 (n = 158 players observations). Two playing formations were excluded owing to insufficient sample sizes (i.e., 1‒5‒3‒2, n = 60 players observations; 1‒5‒2‒2‒1, n = 37 players observations).
Statistical analysis
Data normality was verified using the Kolmogorov–Smirnov test and homogeneity of variance was used Levene test. Data were presented as mean and standard deviation. We used the Mann-Whitney U test to compare the number of substitutions and physical demands during 2018 Russia World Cup and 2022 Qatar World Cup. In addition, we calculated the effect size (ES), and we adopted Cohen's criteria for interpreting these analyses (>0.2 small; > 0.50, moderate; > 0.80 large; > 1.30 very large). We performed two-way analyses of variance (World Cup [2018 and 2022] factor; and Position [GK, DF, MD and FW], Match Outcome [Loss, Draw and Win], Team formation [1‒4‒2‒3‒1, 1‒4‒3‒2‒1, 1‒3‒4‒3, 1‒4‒3‒3, 1‒4‒4‒2 and 1‒3‒5‒2] factors) to compare the physical demands during the match. All null-hypothesis statistical analyses were carried out using IBM SPSS Statistics for Windows, version 21.0 (IBM Corp., Armonk, NY, USA). For all statistics, we set the significance level at 5%.
Results
The total number of substitutions during the 2018 and 2022 World Cups (considering the matches analysed here) were 375 and 586 substitutions, respectively. In addition, Figure 1 shows that the mean of substitutions was significantly (p < 0.05, ES = -2.92) higher for 2022 World Cup (9.2 ± 1.4) compared to 2018 World Cup (5.9 ± 0.8). Table 1 shows that the total distance covered increased from the 2018 to the 2022 World Cup, with zones 1, 2 and 4 also showing increases in 2022. The number of sprints and top speeds achieved by players in the 2022 World Cup has significantly increased compared to the 2018 World Cup.
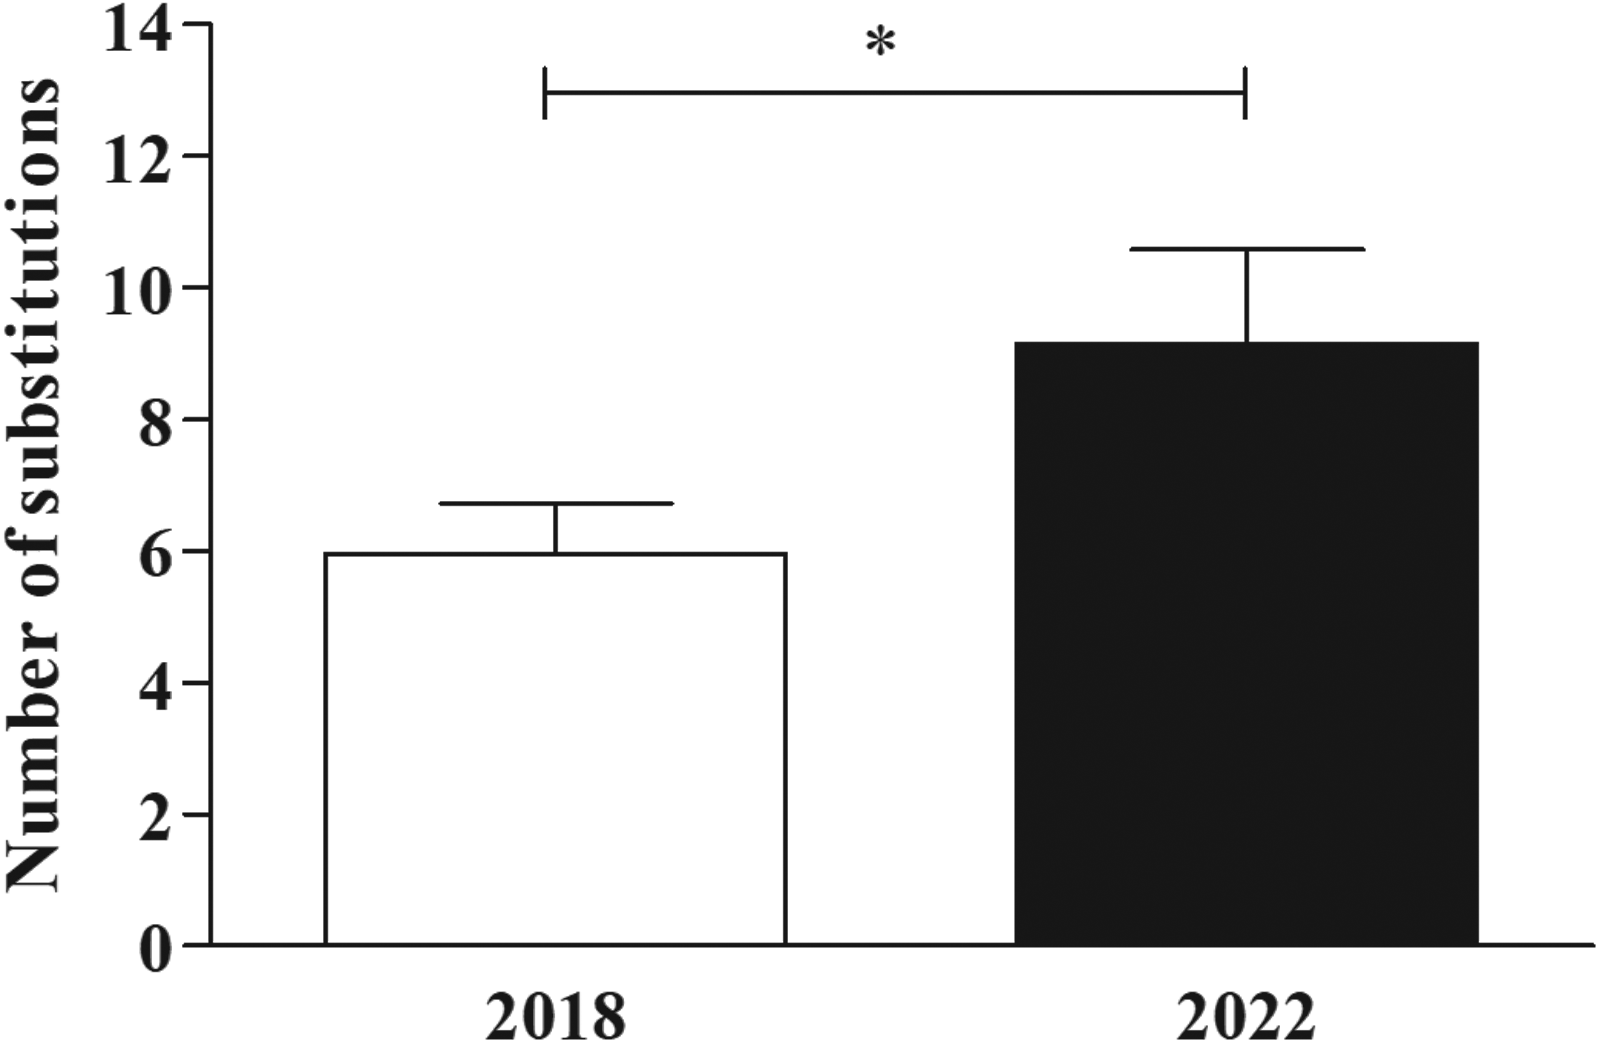
Comparison between 2018 Russia FIFA World Cup and 2022 Qatar FIFA World Cup for number of substitutions.
Means and standard deviation for physical demands during 2018 Russia FIFA World Cup and 2022 Qatar FIFA World Cup.
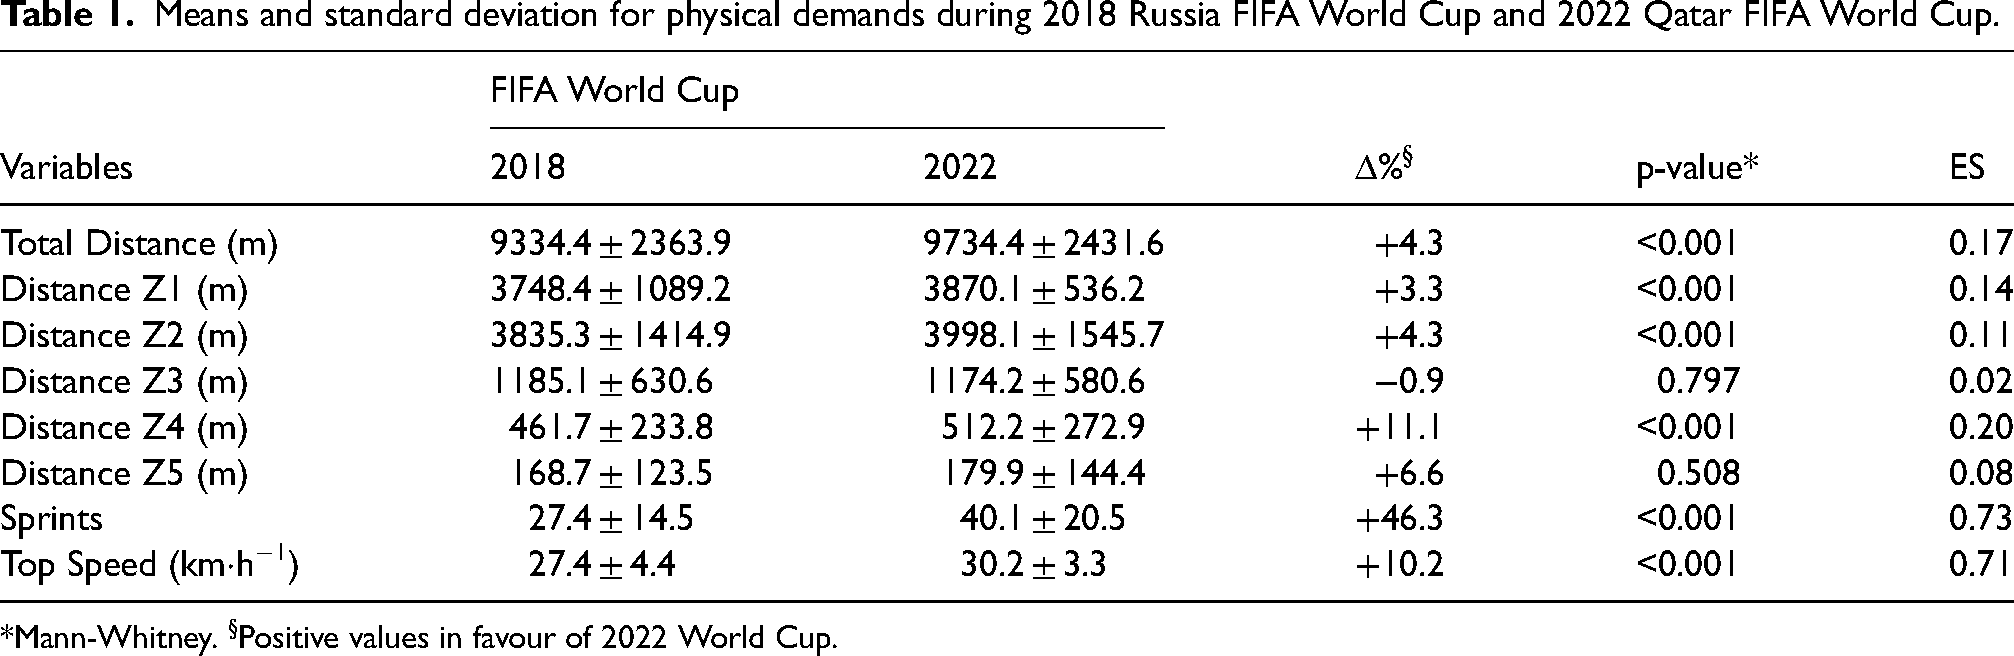
*Mann-Whitney. §Positive values in favour of 2022 World Cup.
Table 2 presents comparative data from the 2018 to the 2022 World Cup by player positions. All player positions (GK, DF, MD and FW) exhibited greater distances covered during the 2022 compared to the 2018 World Cup. In both tournaments, MD covered greater distances than GK, DF and FW. A significant interaction was observed for distance zones (Z1, Z2, Z3 and Z4), indicating that during the 2022 World Cup, higher distances were covered in speeds zones: Z1 (0–7.0 km·h−1) for GK, Z2 (7.1–15.0 km·h−1) for DF and MD, Z3 (15.1–20.0 km·h−1) for MD and FW, Z4 (20.1–25.0 km·h−1) for DF, MD and FW compared to the 2018 World Cup. Additionally, significant interactions were observed for sprints (F = 33.846, p < 0.001) and top speed (F = 36.674, p < 0.001). During the 2022 World Cup, a higher number of sprints were performed by DF, MD and FW compared to 2018 World Cup, and top speeds achieved during matches were higher for all positions in 2022. Regarding player positions, as expected, MD and FW reached a higher number of sprints in both competitions. Conversely, regarding top speeds achieved during matches, DF exhibited similar results to MD and FW.
Means and standard deviation for physical demands to players positions during 2018 Russia FIFA World Cup and 2022 Qatar FIFA World Cup.
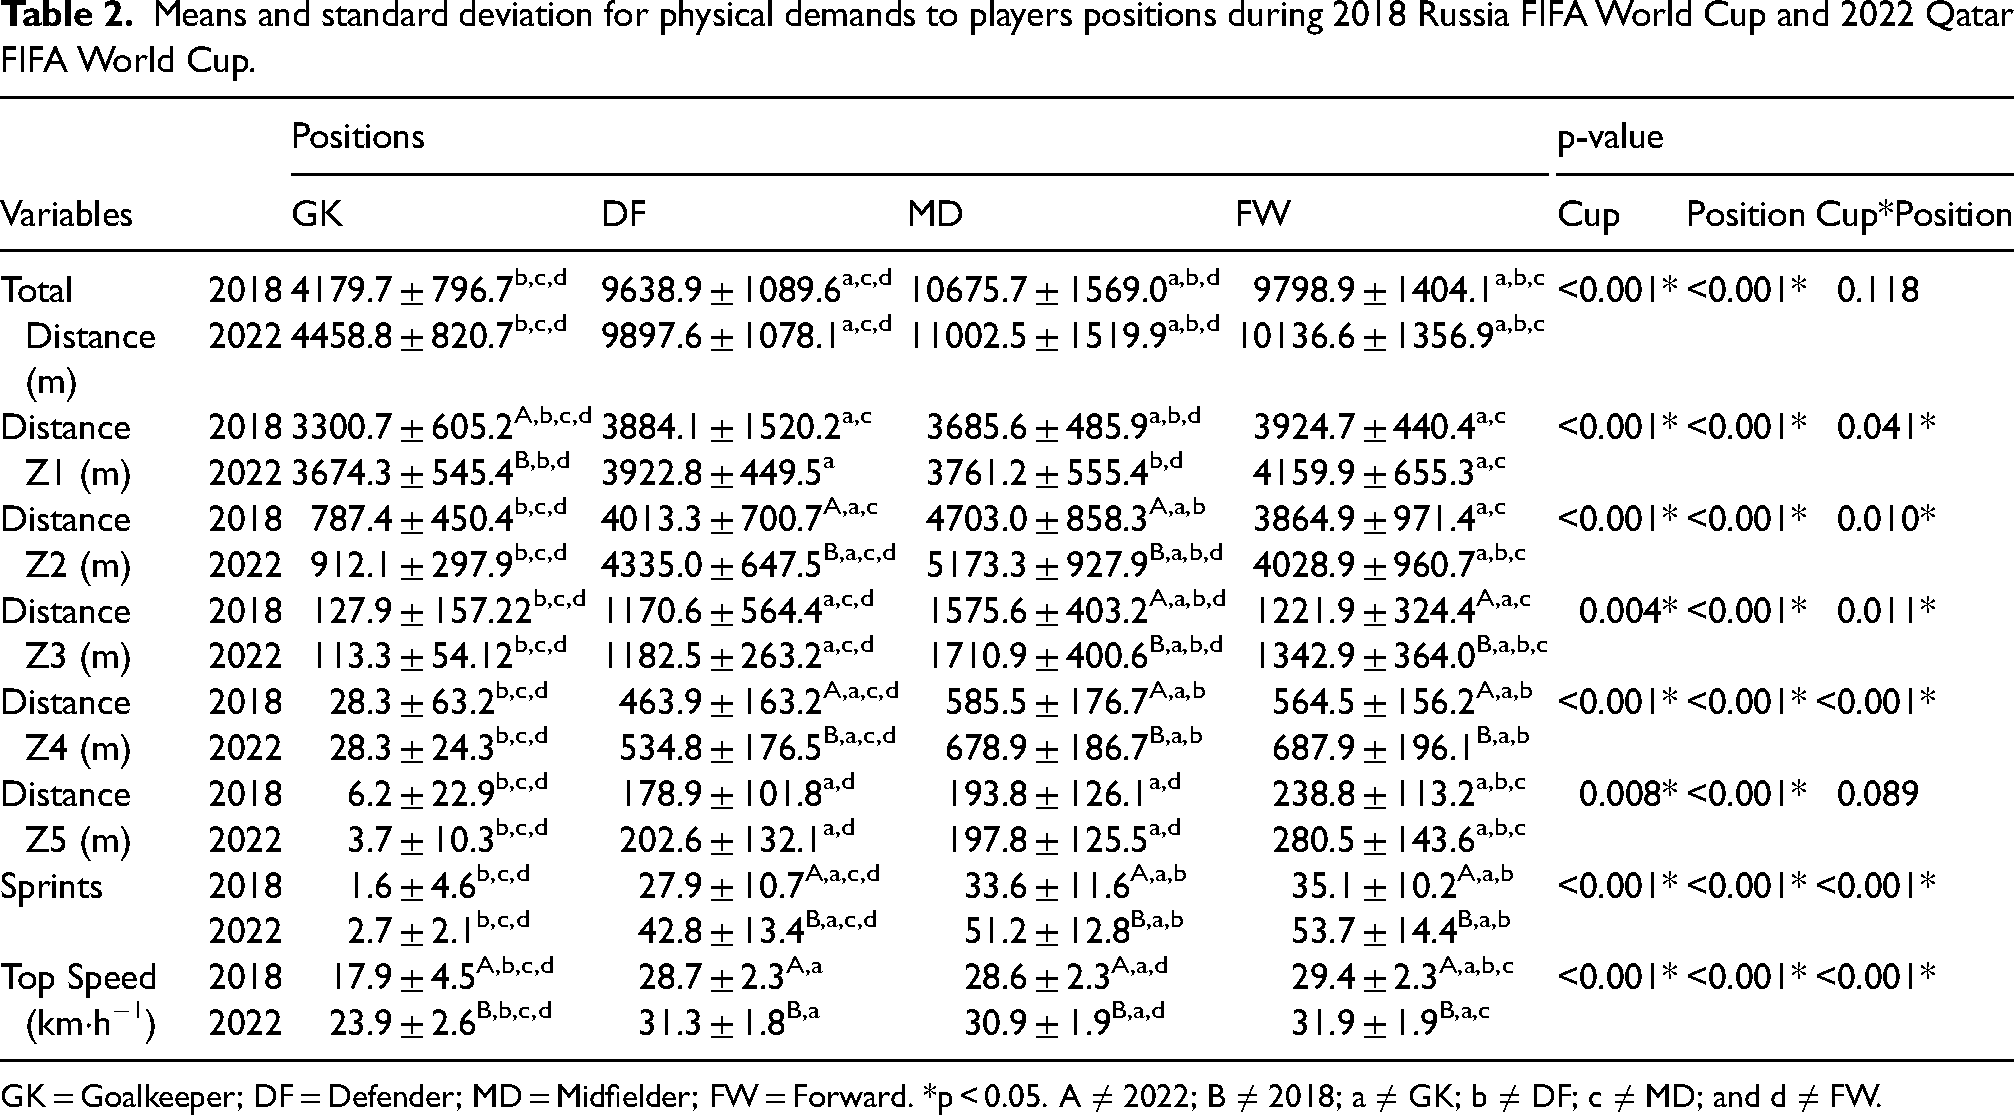
GK = Goalkeeper; DF = Defender; MD = Midfielder; FW = Forward. *p < 0.05. A ≠ 2022; B ≠ 2018; a ≠ GK; b ≠ DF; c ≠ MD; and d ≠ FW.
In Table 3, the physical demands data between the 2018 and 2022 World Cups regarding match outcomes are presented. Distance covered in Z3 is the only exception, showing no statistical differences (p > 0.05) between World Cups. However, when analysing the interaction Cup*Outcome, only total distance covered (F = 5.831, p = 0.003) and distance covered in Z1 (F = 15.488, p < 0.001) presented statistical differences. This indicates that more total distance was covered during draws, with higher values for the 2022 World Cup. In addition, more meters were covered at Z1 during draws for both World Cups, with higher values again noted for the 2022 World Cup.
Means and standard deviation for physical demands to match outcome during 2018 Russia FIFA World Cup and 2022 Qatar FIFA World Cup.
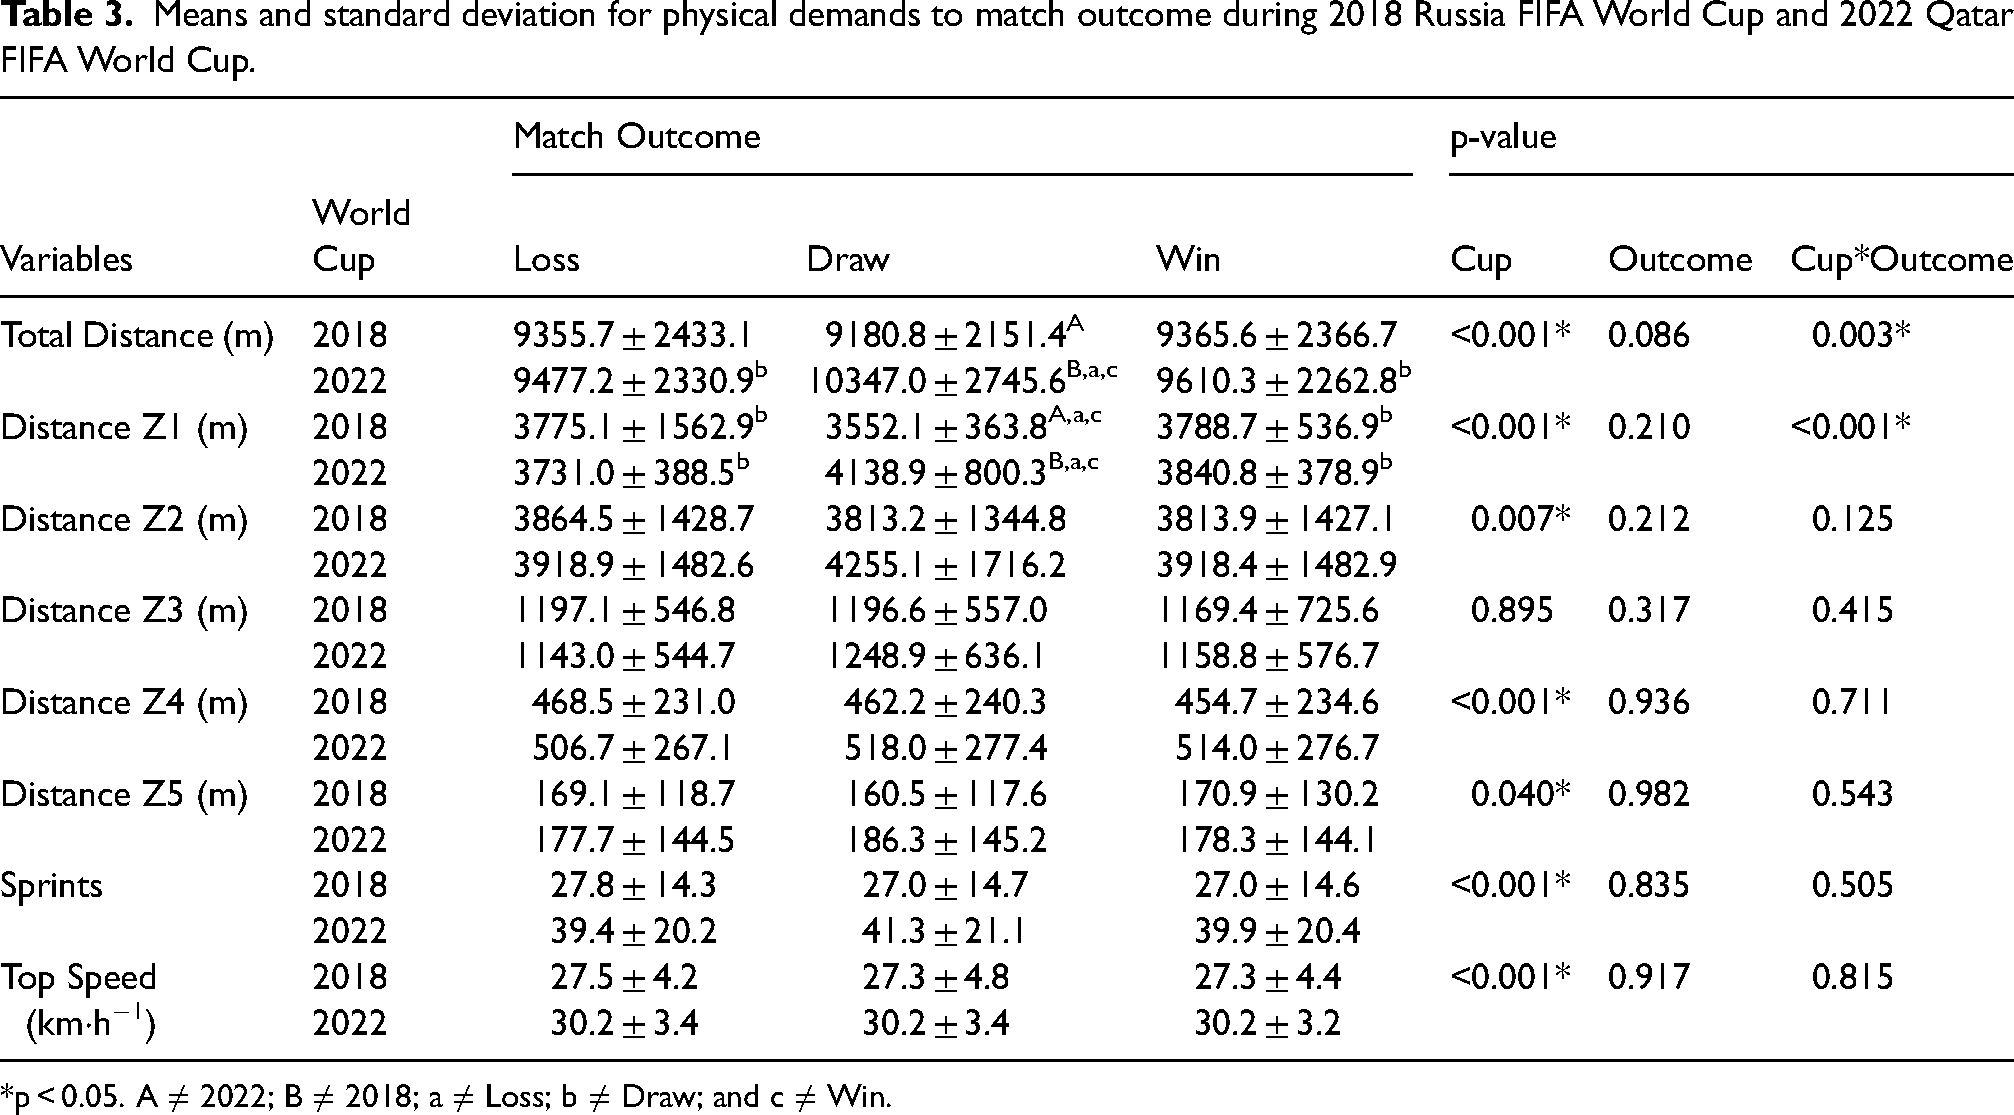
*p < 0.05. A ≠ 2022; B ≠ 2018; a ≠ Loss; b ≠ Draw; and c ≠ Win.
Regarding team formation, it is possible to observe from Table 4 that statistical differences (p < 0.05) were only found between World Cup analyses, independent of and not related to team formation variables. Total distance covered, distance covered at Z4, Z5, number of sprints and top speed achieved all showed higher values at the 2022 World Cup.
Means and standard deviation for physical demands to team formation during 2018 Russia FIFA World Cup and 2022 Qatar FIFA World Cup.
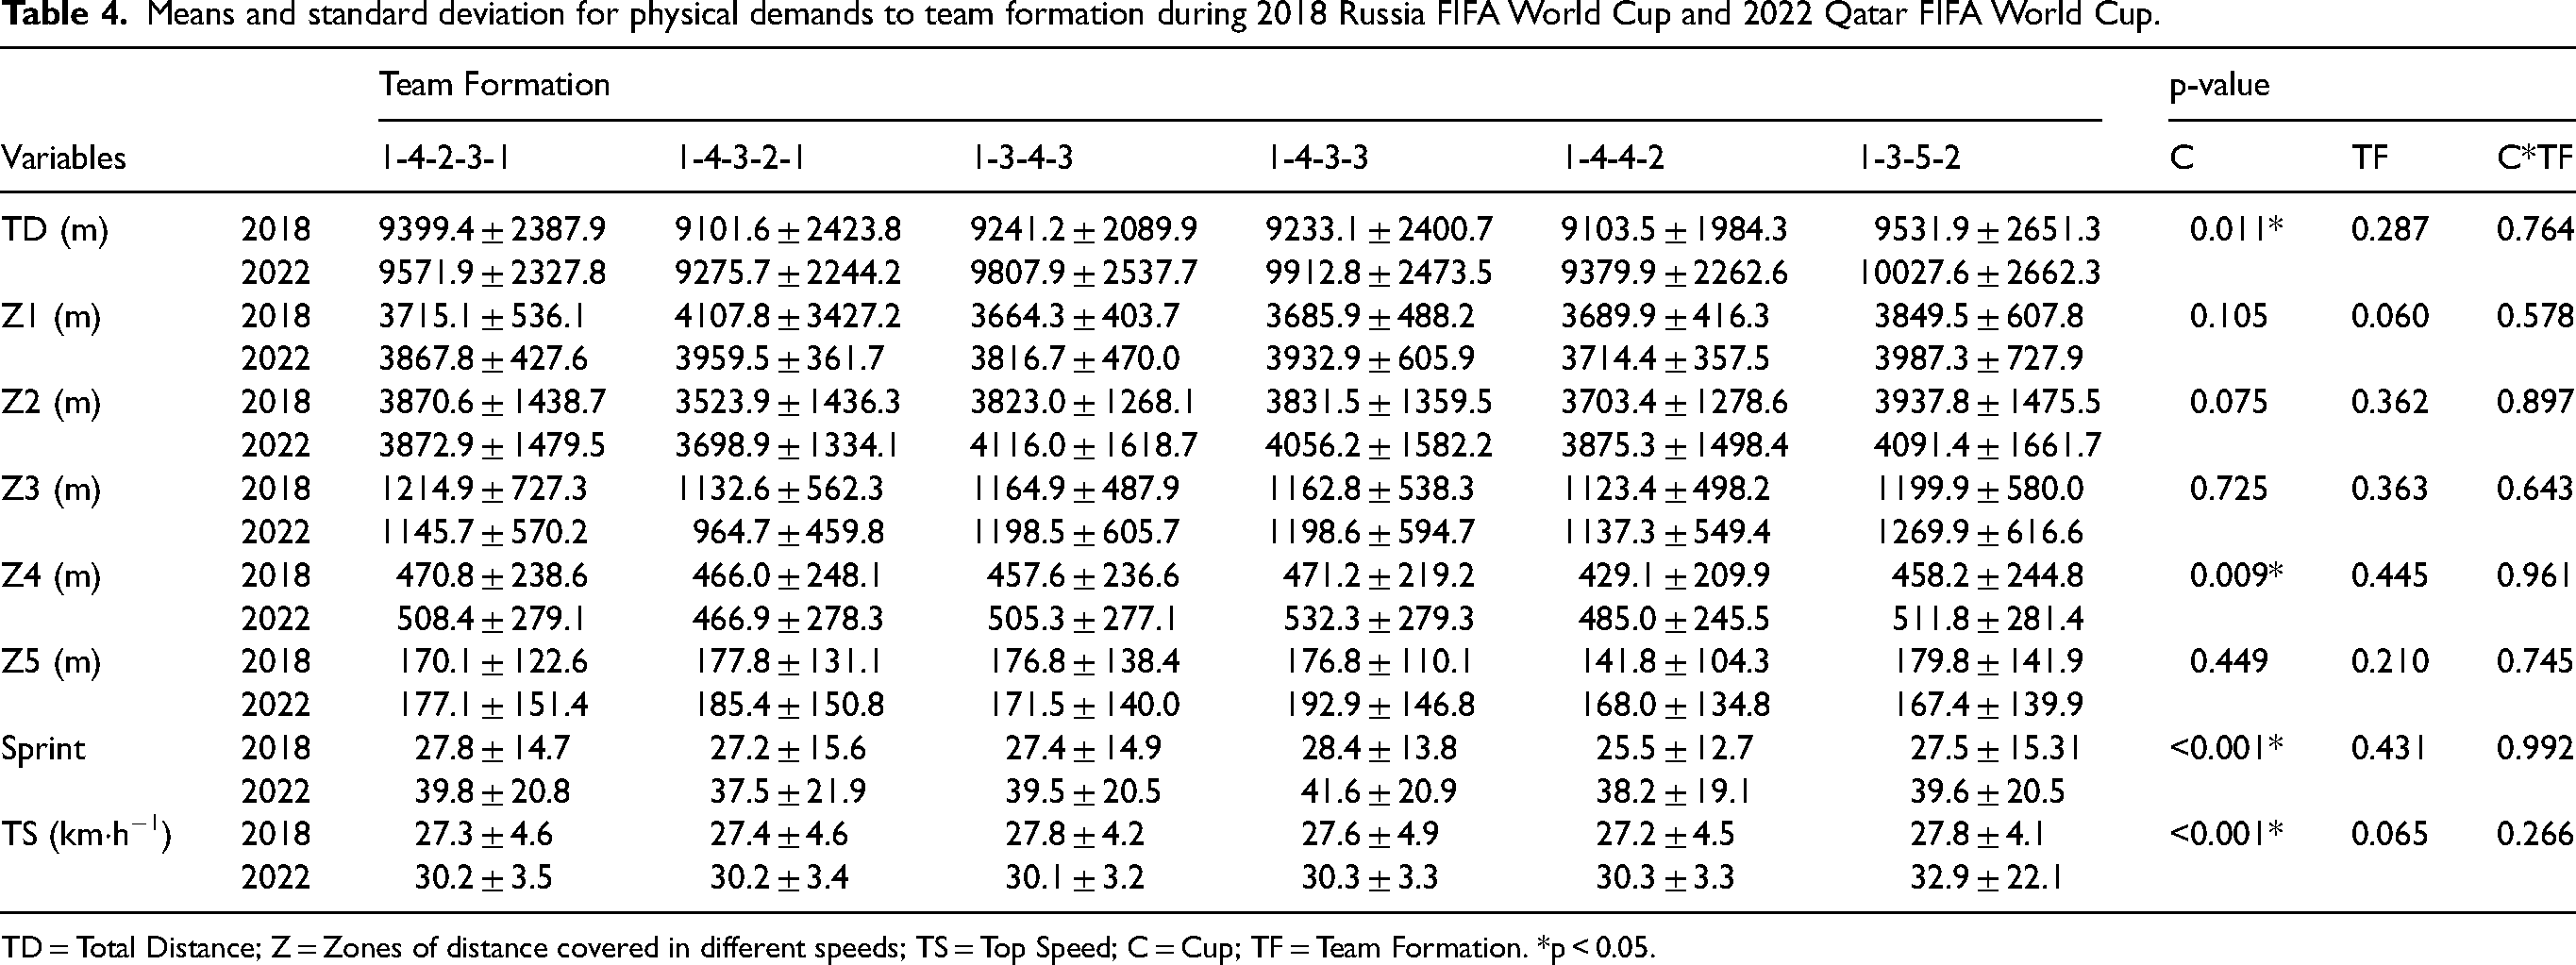
TD = Total Distance; Z = Zones of distance covered in different speeds; TS = Top Speed; C = Cup; TF = Team Formation. *p < 0.05.
Discussion
Our aim in the present study was to compare the match physical demands from the 2018 to the 2022 World Cups. We found that total distance covered, distance covered in different speeds zones, number of sprints, and top speed achieved during matches were higher in the 2022 compared to the 2018 World Cup. It is noteworthy that the 2022 World Cup provided some unique conditions. In comparison with previous editions, the number of substitutions changed from 3 to 5 players for each team, and the competition was held during November and December, whereas the previous editions occurred during June and July, in the middle and the end of the club's calendar season, respectively.
Previous studies aimed to compare physical demand during matches with new rule of five substitutions and matches with three substitutions per team.19,20 López-Valenciano et al. 19 observed Spanish professional players (LaLiga Santander, seasons 2019–2020 and 2020–2021) and found that after the new substitution rule, players enhanced their running performance and teams covered greater distances at speeds ≥21 km·h−1. Ruscello et al. 20 observed Italian players (Italian League Serie A, seasons 2017–2018, 2018–2019, 2020–2021 and 2021–2022), and showed an increase in sprinting performance. Similar results were found in the present study, with total distance covered, distance covered in different speeds (Z1, Z2 and Z4), number of sprints, and top speed presenting higher values during the 2022 World Cup (five substitutions rule) than the 2018 World Cup (three substitutions rule). Interestingly, we analysed only players who completed the match, and similarly López-Valencio et al., 19 we found improvements in running performance only for starting players, suggesting that the new substitution rule can collectively increase the distance covered at high speeds, thus leading the match to a higher demand. On the other hand, careful analysis must be taken regarding the approach by Bradley, 25 who noted much longer game durations compared to Russia 2018. Nonetheless, when the data were adjusted based on the number of minutes played, tournament differences still stood at 9–12% at higher intensities in his analysis. The improvement in physical performance may be related to the possible game strategy enabled by the five substitutions, allowing coaches to keep players well-rested during regular playing time. 19
In addition, the World Cup being held in the middle of the calendar season (Europe Leagues) for the most players is an important factor to consider. Seasonal variations in physical demand have been reported.26–29 In the Bundesliga, the total distance covered by players decreases significantly towards the end of the season compared to the beginning and middle of the season. 27 Morgans et al. 28 also showed that the total distance covered by players from England Championship League (ECL) was higher during the middle than at the end of the season. Furthermore, for the ECL, higher sprint distance, sprint frequency, high intensity distance, and high intensity frequency were observed during the beginning of the season compared to the middle and end of the season. 29 The reduction in performance towards the end of the season can be attributed to accumulated fatigue and short recovery time between matches due to congested competitions schedules.27,29,30 With that perspective, since the Qatar World Cup was held during the middle of the Europe season (where most of the players who reached the final stages played), competitive congestion seems not to have negatively influenced performance. 23 Therefore, part of the higher physical demand reached by players during the 2022 FIFA World Cup compared to 2018 edition can be attributed to the timing of the competitions (mid-season vs end of season), allowing even higher metrics. 23
In addition, large effect sizes were observed for number of sprints and top speed, indicating higher values for 2022 FIFA World Cup than 2018 edition. The new rule allowing five substitutions appears to increase high-intensity stimuli during matches.19,20 Therefore, coaches may be able to reduce players’ physical stress throughout the season, and training plans could be designed considering the increased rotation of players during matches (i.e., the possibility of five substitutions). Consequently, there may be an increase in high-intensity demands during both training and matches in this new scenario.
Several studies have been demonstrated the match physical demands of player positions.30–34 In general, midfielders and forwards exhibit higher physical demand during football matches than defenders. For the 2022 World Cup, it was identified here and by Bradley 34 that total distance covered, distance covered in different speeds zones, number of sprints, and top speed achieved during matches were higher for midfielders and/or forwards compared to defenders in both FIFA World Cup editions. However, in our analysis of the 2022 FIFA World Cup, all positions showed higher values for the number of sprints and top speed achieved during matches compared to 2018 FIFA World Cup. These results indicate an increase in high-intensity performance during the 2022 FIFA World Cup. Additionally, Santos et al. 35 suggested that goalkeepers have recently played an important role in the football matches. Besides their critical relevance in the defensive actions of the team, goalkeepers also participate in the offensive process through effective short and long passes. 35 Keep this in mind, nowadays the goalkeeper plays a key role in determining the outcome of a match, through both individual and collective actions. Therefore, this role requires the enhancement of technical skills and the development of the ability to apply them effectively within the tactical context of the game. 36 In other words, a goalkeeper's offensive actions often involve receiving late passes from teammates and using foot-based technical skills to support team offensive construction, particularly along the side flanks. 37 This evolution can help to explain the increase in top speed reached by goalkeepers from the 2018 to the 2022 FIFA World Cup.
The present study observed a small impact of match outcome on physical demand in both World Cups. Only total distance covered and distance covered in the Z1 (0–7.0 km·h−1) showed higher values when the match finished in a draw compared to losses and wins in the 2022 FIFA World Cup. Therefore, although higher values were observed for physical parameters in the 2022 FIFA World Cup compared to the 2018 edition, teams that won, lost or drew had similar values for these parameters in both competitions. The higher total distance covered for matches finished in a draw, can be related to other studies have shown effect of match outcomes on the physical demand.38,39 When a team is winning, it is suggested that players may not utilize their maximum physical capacity. In contrast, when a team is losing, higher physical demands are often observed as players intensify their efforts to recover from an unfavourable result.39,40 Additionally, we suggest that when the score is level, both teams are likely to push for a win, resulting in increased physical demands during the match. Factors other than physical demand, such as goal efficiency and pass accuracy, may have a greater influence on match success. 41 Therefore, caution is necessary when analyzing the mutual influence of match outcomes on running performance indicators.
Team formation did not affect the physical demand in either FIFA World Cups. According to Aquino et al., 42 in the 2018 FIFA World Cup, team formation affected ball possession and social network analysis (i.e., in degree, out degree, betweenness centrality, clustering coefficients, density and completed passes). Bradley et al. 43 analysed the English FA Premier League (season 2006–07) and concluded that physical demand was not affected by team formation. However, the authors demonstrated that high-intensity running performance could be influenced by team formation, depending on whether teams were in possession of the ball or not. Noteworthy, the choice of team formation and the level of ball possession (low, medium, high or very high percentage) can influence the physical variables, such as TD, high speed running distance and high metabolic load distance (distance covered with a power consumption above 25.5 W/kg). 44 In the present study, the absence of an effect of team formation on physical demands may be associated with the lack of ball possession analysis.
In this study, a limitation was that different data providers were used in the 2018 and 2022 FIFA World Cup (SportVU and TRACAB, respectively). Therefore, comparisons of the physical demands between World Cups should be analysed with caution, however both systems used multi-camera optical tracking operating at 25 Hz, so software change should not impair analyses, since differentiation for speed zones were used the same in both tournaments with the aim to compare them. 45 Changes were made to improve and contextualize the tactical team and players behaviours’, which was not the direct aim of this analysis. Furthermore, we did not consider the influence of match importance (e.g., group phase or play-offs), weather conditions, score-line progression and quality of the opposition in our analysis.
Considering the present findings, future studies could integrate technical-tactical metrics, such as ball possession and pressing intensity with analyses of how team formation influences physical demands. Additionally, future research may benefit from incorporating technical and tactical analyses aimed at comparing different FIFA World Cup editions. The use of multivariate models will also be critical for controlling potential confounding variables, such as match importance, weather conditions, score-line progression, and opponent quality.
Conclusion
The present study demonstrated that 2022 Qatar FIFA World Cup exhibited higher physical match demands than the 2018 Russia FIFA World Cup. This difference may be attributed to the new substitutions rule, which changed from three to five substitutions per team, and competition date, as the Qatar Cup and Russia Cup were held in the middle and end of the European Leagues’ seasons, respectively. All player positions showed higher values for physical match demands in the 2022 FIFA World Cup compared to the 2018 edition. Noteworthy, in the 2022 FIFA World Cup, goalkeepers appeared to increase their participation in matches, as higher physical demands were observed compared to the 2018 FIFA World Cups. Finally, match outcome and team formation had a small impact on physical match demands.
Footnotes
Data availability
Declaration of conflicting interests
The author(s) declared no potential conflicts of interest with respect to the research, authorship, and/or publication of this article.
Funding
The author(s) disclosed receipt of the following financial support for the research, authorship, and/or publication of this article: We would like to thank Secretaria Nacional do Futebol e Direitos do Torcedor of Ministério do Esporte for supporting this project through the Programa Academia e Futebol (TED N° 9/2021/SNFDT/MC/SEESP, process number 71000.003446/2021-77).