
Abstract
Successful execution of Complex 1, a sequence of fundamental volleyball game actions, is widely recognised as a prerequisite for victory. This study investigated the impact of spatiotemporal characteristics of volleyball game actions (reception, setting) within Complex 1 on subsequent attack performance in high-level men's volleyball in 36 high-level men's volleyball matches from the 2021 Olympic Games (n = 20) and European Championship (n = 16), encompassing 4425 attacks. The reception zone and trajectory, middle attacker (MA) threat (presence and position), setting zone and tempo, and attack zone concerning attack outcome (win, loss, continuation) were analysed. Chi-square tests revealed significant associations (p < 0.001) between attack performance and setting zone (V = 0.156), setting tempo (V = 0.130), attack zone (V = 0.095), and the presence of an MA threat (V = 0.180). Conversely, reception zone, reception trajectory and MA threat position (p > 0.05) showed no significant impact. Log-linear modelling highlighted substantial two-way interactions between the attack zone, setting tempo, and setting zone with attack performance (p < .023 – p < 0.001). Concerning, multiple correspondence analysis, the first two dimensions, accounting for 87.92% of the total variance, illustrate the primary relationships within the data, confirming that successful attacks were linked to specific setting zones (A2, A3, B2, B3), faster tempos, attacks from zones 3 and 6, and the presence of an MA threat. These findings underscore the interconnectedness of game actions within Complex 1. At the highest level of competition, not only must individual game actions be executed precisely, but the coordination of multiple players’ actions is crucial to optimise attack performance.
Introduction
Volleyball is a complex sport characterised by the interplay of various fundamental technical game actions. 1 These game actions, including serve, serve's reception, setting, attack, block, and defence, are interconnected and influence one another during a match. 2 Without including aces or missed serves, every volleyball rally follows a specific sequence of these six basic game actions. 3 Nishijima et al. 4 proposed a two-phase structure for volleyball: the attack after service reception and the attack after defence. The attack after-service reception, encompassing reception, setting, and attacking, has been identified as a critical sequence (complex 1) that can significantly impact the outcome of a match. 3 Research has shown that the attack after serve reception is generally more effective than the attack after the defence, particularly in men's volleyball, in terms of both success rates and point-to-error ratios.5,6
Regarding the initial game action in the sequence, serve reception, Peña and Casals 7 posit that the outcome of a volleyball match can be significantly impacted by the ratio of successful to unsuccessful receptions. Corroborating this finding, Patsiaouras et al. 8 observed a direct correlation between a lower ratio of reception errors and an increased likelihood of victory. The setter executes the subsequent action, setting, whose primary objective is to exploit the opponent's defensive weaknesses and align them with the offensive strengths of his team. 9 The setting's quality and speed (tempo) directly influence the offensive player's ability to showcase their game actions. 10 On the other hand, middle blockers who actively use their attacking abilities -referred to here as middle attackers (MA)- contribute to the setter's offensive strategy by threatening or pretending to attack in every phase, aiming to surprise the opponent, regardless of whether they receive a setting. 11 Therefore every reception directed towards the setter under ideal conditions enables the MA to move accordingly. 12 Finally, the attacking player seeks to score a point by directing the ball into the opponent's court. 13 The attack constitutes the most significant source of points for a team, particularly in complex 1 due to the increased distance from the service line to the receivers, allowing for more strategic planning and coordination between the setter and attackers.14,15
While prior research has indicated the link between reception quality and subsequent attack effectiveness,2,6–8,16–18 and the link between the reception area and spike performance, 19 a critical gap remains in the existing comprehension of how the precise spatial delivery of the reception shapes offensive opportunities. To truly decode the intricacies of attack performance in complex I, it is essential to move beyond general reception quality and delve into a more granular analysis of reception landing points across the court. Regarding the role of the middle attacker a study by Sapena Peiro et al. 20 highlighted the crucial interplay between setting zones and middle attackers in defining attack zones that extend beyond mere availability in the offensive scheme it did not consider the influence of the reception zone. Therefore, to achieve a deeper understanding of the complex interplay between initial ball placement (reception zone), the delivery area of the reception (setting zone), middle blocker dynamics, and the attack performance in complex I, a study employing a more detailed court mapping methodology is crucial. This approach will enable the decoding of the relationships between specific reception zones, setting zones, the dynamic movement patterns of the middle blocker, and ultimately, the effectiveness of attacks originating from complex I, offering valuable insights for both tactical analysis and performance optimisation.
This study hypothesised that analysing the spatiotemporal characteristics of reception (zone and trajectory), setting (zone and tempo), and the movement of the MA would reveal differences in the outcome of subsequent attacks. Specifically, the investigation aimed to determine a) whether spatiotemporal characteristics of prior actions within the attack-after-serve-reception sequence (Complex 1) influence performance in high-level men's volleyball and b) which specific spatiotemporal aspects of Complex 1 are associated with successful outcomes.
Methods
Sample
The study focused on high-level men's volleyball matches, specifically those played at the top level of international competitions. A total of 36 matches were analysed, encompassing 20 from the 2021 Olympic Games (OG) and 16 from the final stages of the 2021 European Championship. For the analysis of the OG 2021, all matches involving teams ranked within the top eight positions at the final ranking were included, encompassing the pool stage, quarterfinals, semi-finals, and finals. Concerning the European Championship, the analysis focused on all matches played following the pool stage, specifically the Round of 16, quarterfinals, semi-finals, and finals. The consistently highly competitive level of the European Championship is supported by the observation that European national teams have demonstrated superior performance compared to teams from other continents, as evidenced by the ranking of at least six European teams within the top 12 at the World Championships since 2010. 21
These matches featured the highest-ranked teams in each tournament, ensuring a sample of elite-level competition. The analysis encompassed a total of N = 4447 attacks following reception. This methodological approach allowed for an in-depth examination of offensive strategies and tactics employed in high-performance men's volleyball.
Measures
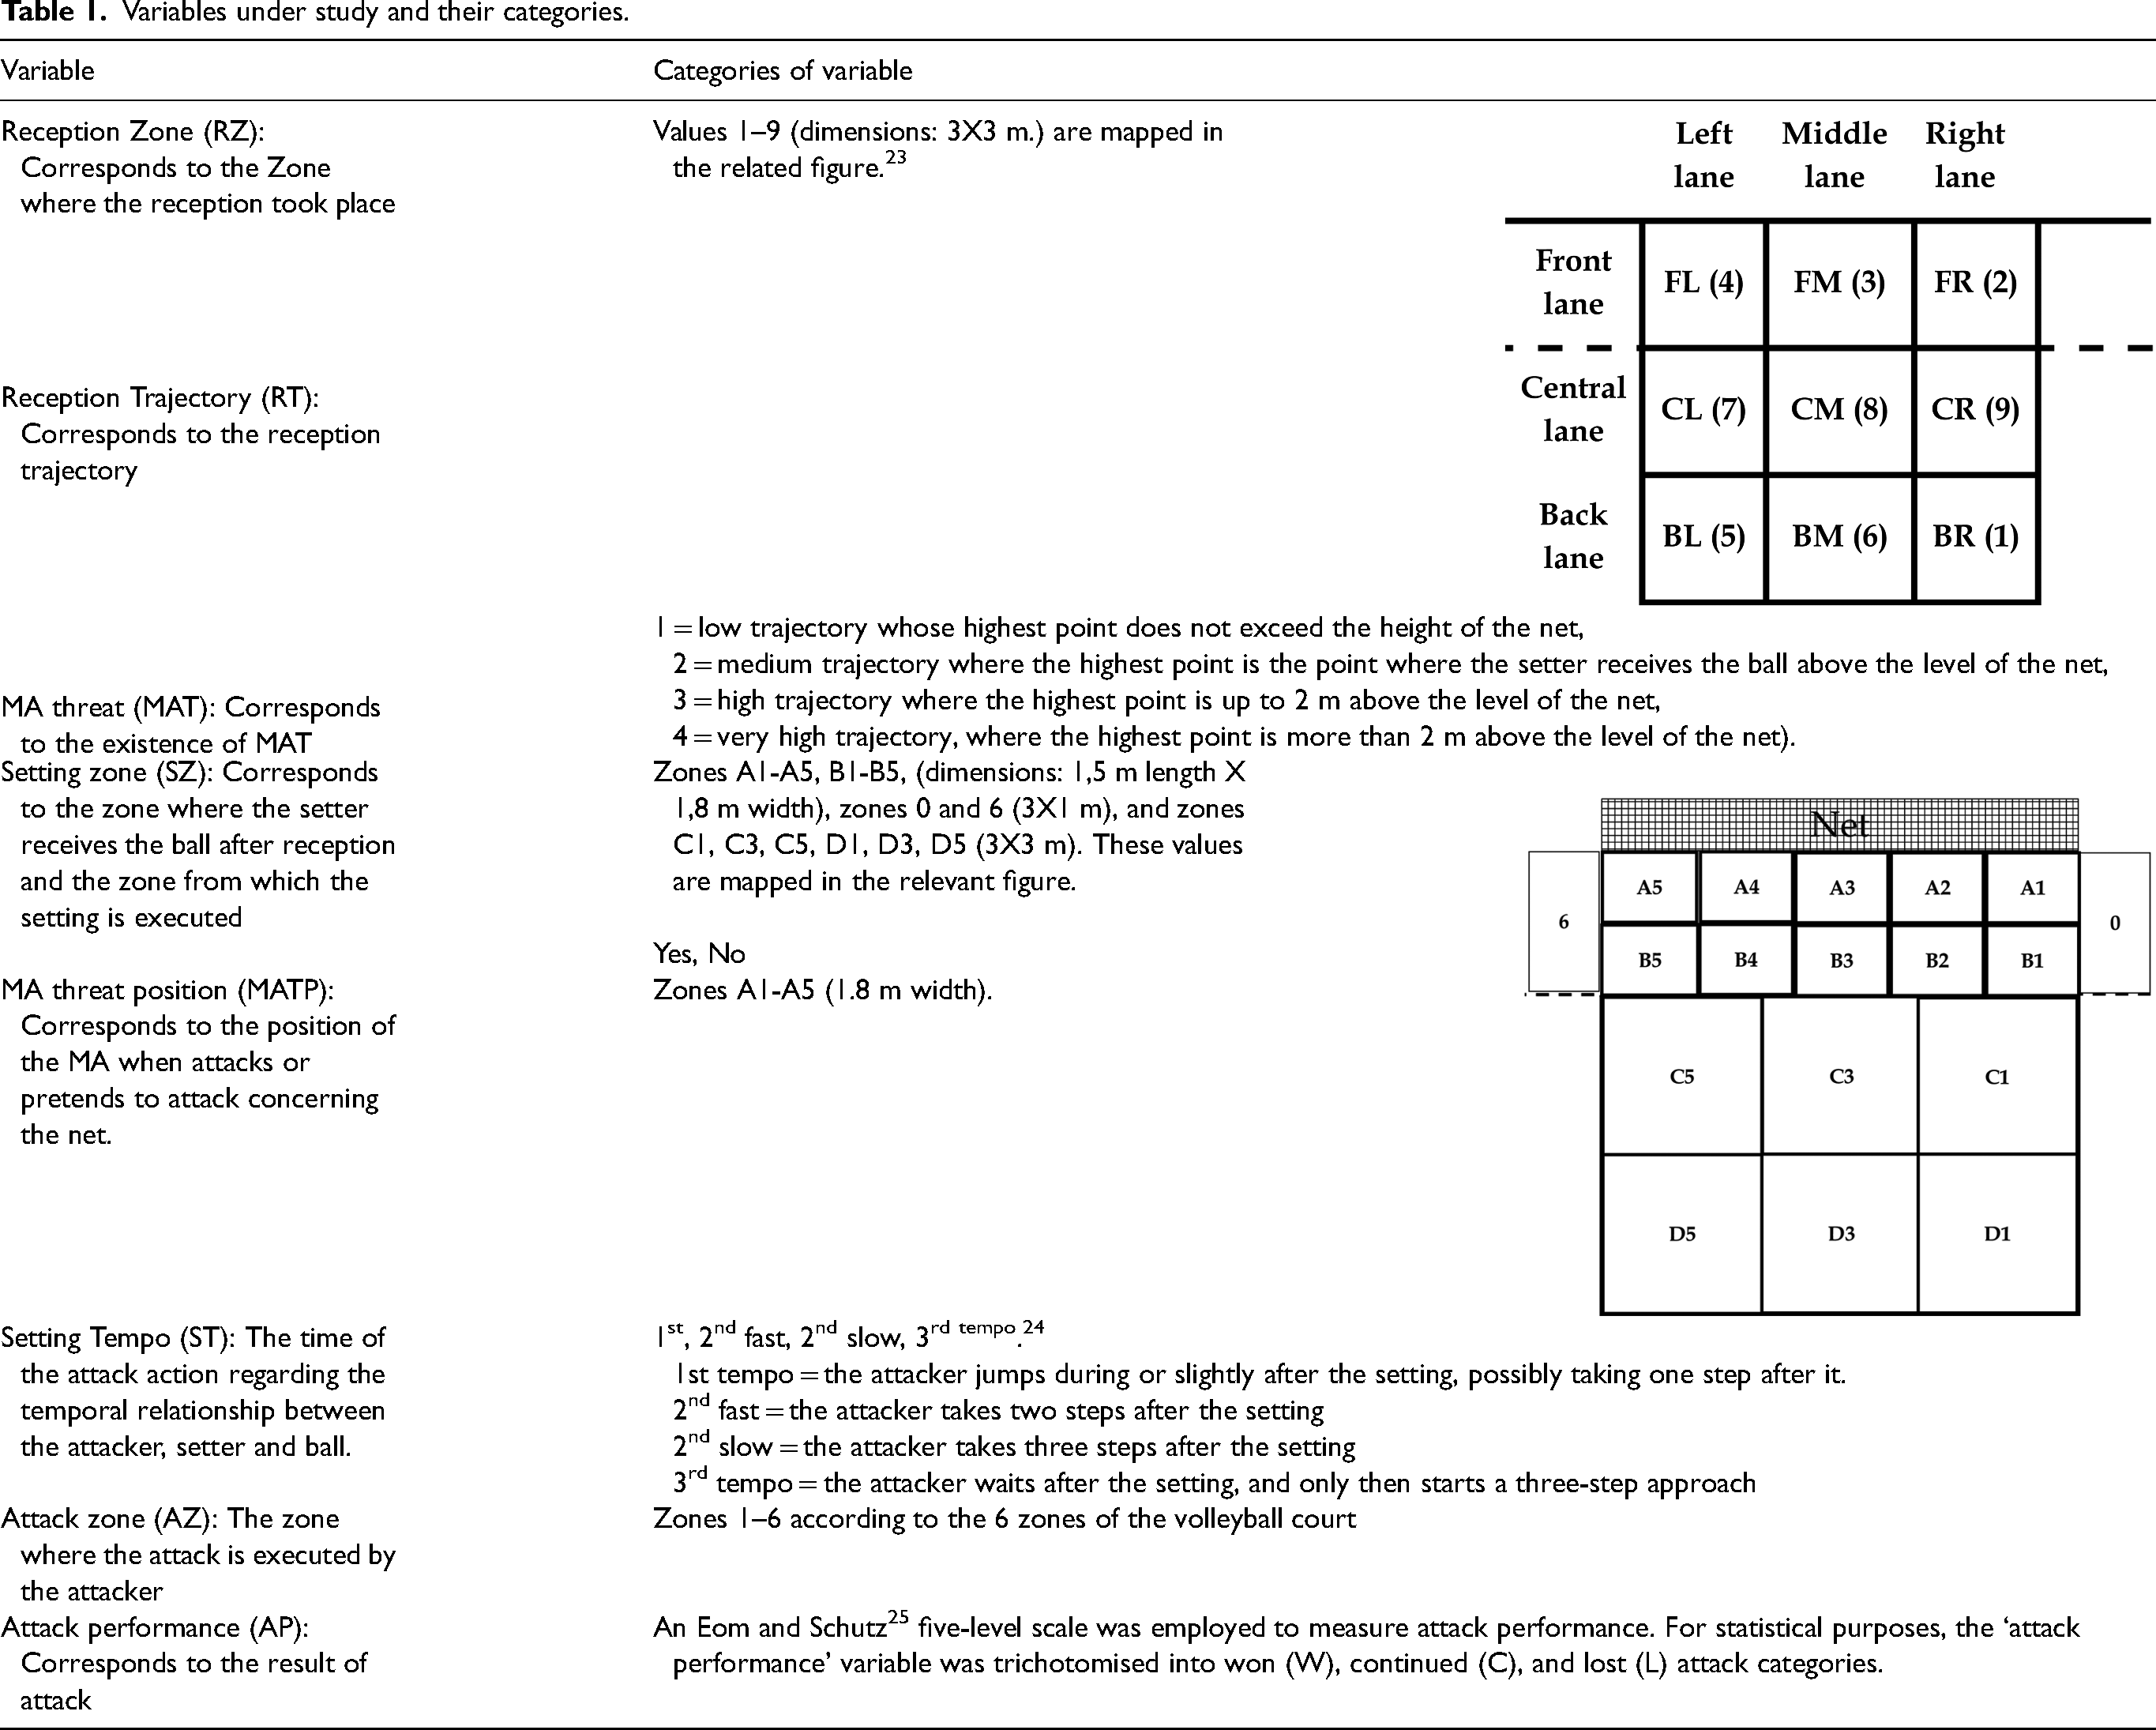
For this investigation, video recordings of volleyball matches were analysed from a fixed camera positioned behind the baseline. Observations and data collection were conducted using a laptop computer and a standardised protocol implemented in Microsoft Excel. A detailed observational method 22 was employed to capture various aspects of offensive actions, including the zone and trajectory of the reception; the presence or absence of an MA threat movement; the point of that threat; the setting zone and tempo; the attack zone; and the quality of the attack performance. Table 1 presents a comprehensive list of the studied variables and their corresponding categories.
Variables under study and their categories.
Procedure
Before data collection, observers underwent training using Kinovea software 26 (https://kinovea.org/). This software facilitated their familiarisation with the offensive zone of the volleyball court, enhancing their ability to accurately record game events. Training employed game footage from the same competition, but from a different phase (group stage) to ensure content similarity but avoid familiarity with the specific games used for analysis.
To assess inter-rater reliability, two of the authors independently observed and recorded data for a representative sample (>10%, 4 games, N = 543 attacks following reception) following established protocols. 27 This process was repeated after a 15-day interval to minimise potential learning effects from the initial viewing. Intra-observer reliability was evaluated using Cohen's kappa (κ) indices. 28 Microsoft Excel spreadsheets were used to create double-entry evaluation tables and weighting coefficient tables 29 for calculating Cohen's κ and weighted Cohen's κ 30 for each variable. The “Real Statistics Resource Pack" 31 add-on facilitated the calculation of Cohen's κ indices within the Excel environment.
Analysis revealed high intra-observer reliability. Variables recorded on a nominal scale with non-adjacent values yielded a Cohen's κ of 0.932, while those on a nominal scale with adjacent values or ordinal scale 29 achieved an Adjusted Cohen's κ of 0.875. 32 Inter-observer reliability also demonstrated strong agreement. For nominal scale variables with non-adjacent and nominal scale with adjacent values or ordinal scale, Cohen's κ and Adjusted Cohen's κ were 0.945 and 0.823, respectively. The grading system by Altman 33 categorised these values (>0.80) as acceptable for all variable types. Based on these results, the reliability of the observers’ recordings is confirmed.
Statistical analysis
To examine the relationship between attack performance variables and spatiotemporal variables of the CI game action items, a chi-square (χ²) test of independence was employed. Cramer's V was calculated to quantify the effect size, with values of 0.1, 0.3, and 0.5 representing small, medium, and large effects, respectively. 34 To examine the specific combinations of variable categories that contributed most to the association after rejecting the null hypothesis of independence, two-way contingency tables were visualised using mosaic plots. In these plots, the width and height of the tiles represent the relative frequencies of the variables being studied. Colour coding and tile edges indicate the absolute size and sign of each cell residual. Additionally, fixed cutoffs of ±2 and ±4 were used to shade cells that were individually significant at approximately α = 0.05 and α = 0.001 levels, respectively. These visual features of mosaic plots facilitate the assessment of the association structure between the variables. 35
To further investigate the relationships among the variables, log-linear modelling was employed. 36 This statistical technique enables the simultaneous examination of the effects of multiple variables and their interactions within a contingency table. The optimal model was determined using a backward elimination procedure, starting with the saturated model and progressively removing non-significant terms. The term with the least detrimental impact on model fit (as indicated by the highest p-value) was eliminated at each step. Given the potential for issues analogous to multicollinearity arising from high interdependence among categorical variables in log-linear analysis, Cramer's V was employed to assess the strength of association between predictor variables. Variables exhibiting a Cramer's V coefficient exceeding 0.25 were identified as demonstrating a substantial degree of association.37,38 Based on this criterion, these predictor variables were included in the model.
Additionally, to visualise the associations between the variables, multiple correspondence analysis (MCA) was conducted on the survey data for all seasons. 39 MCA is a multivariate statistical technique that graphically represents the information contained in a multiway contingency table.
The analyses of two-way contingency tables were performed using the R statistical software, with the vcd package40,41 being utilised. Log-linear modelling and MCA were conducted with SPSS 29.0.
Results
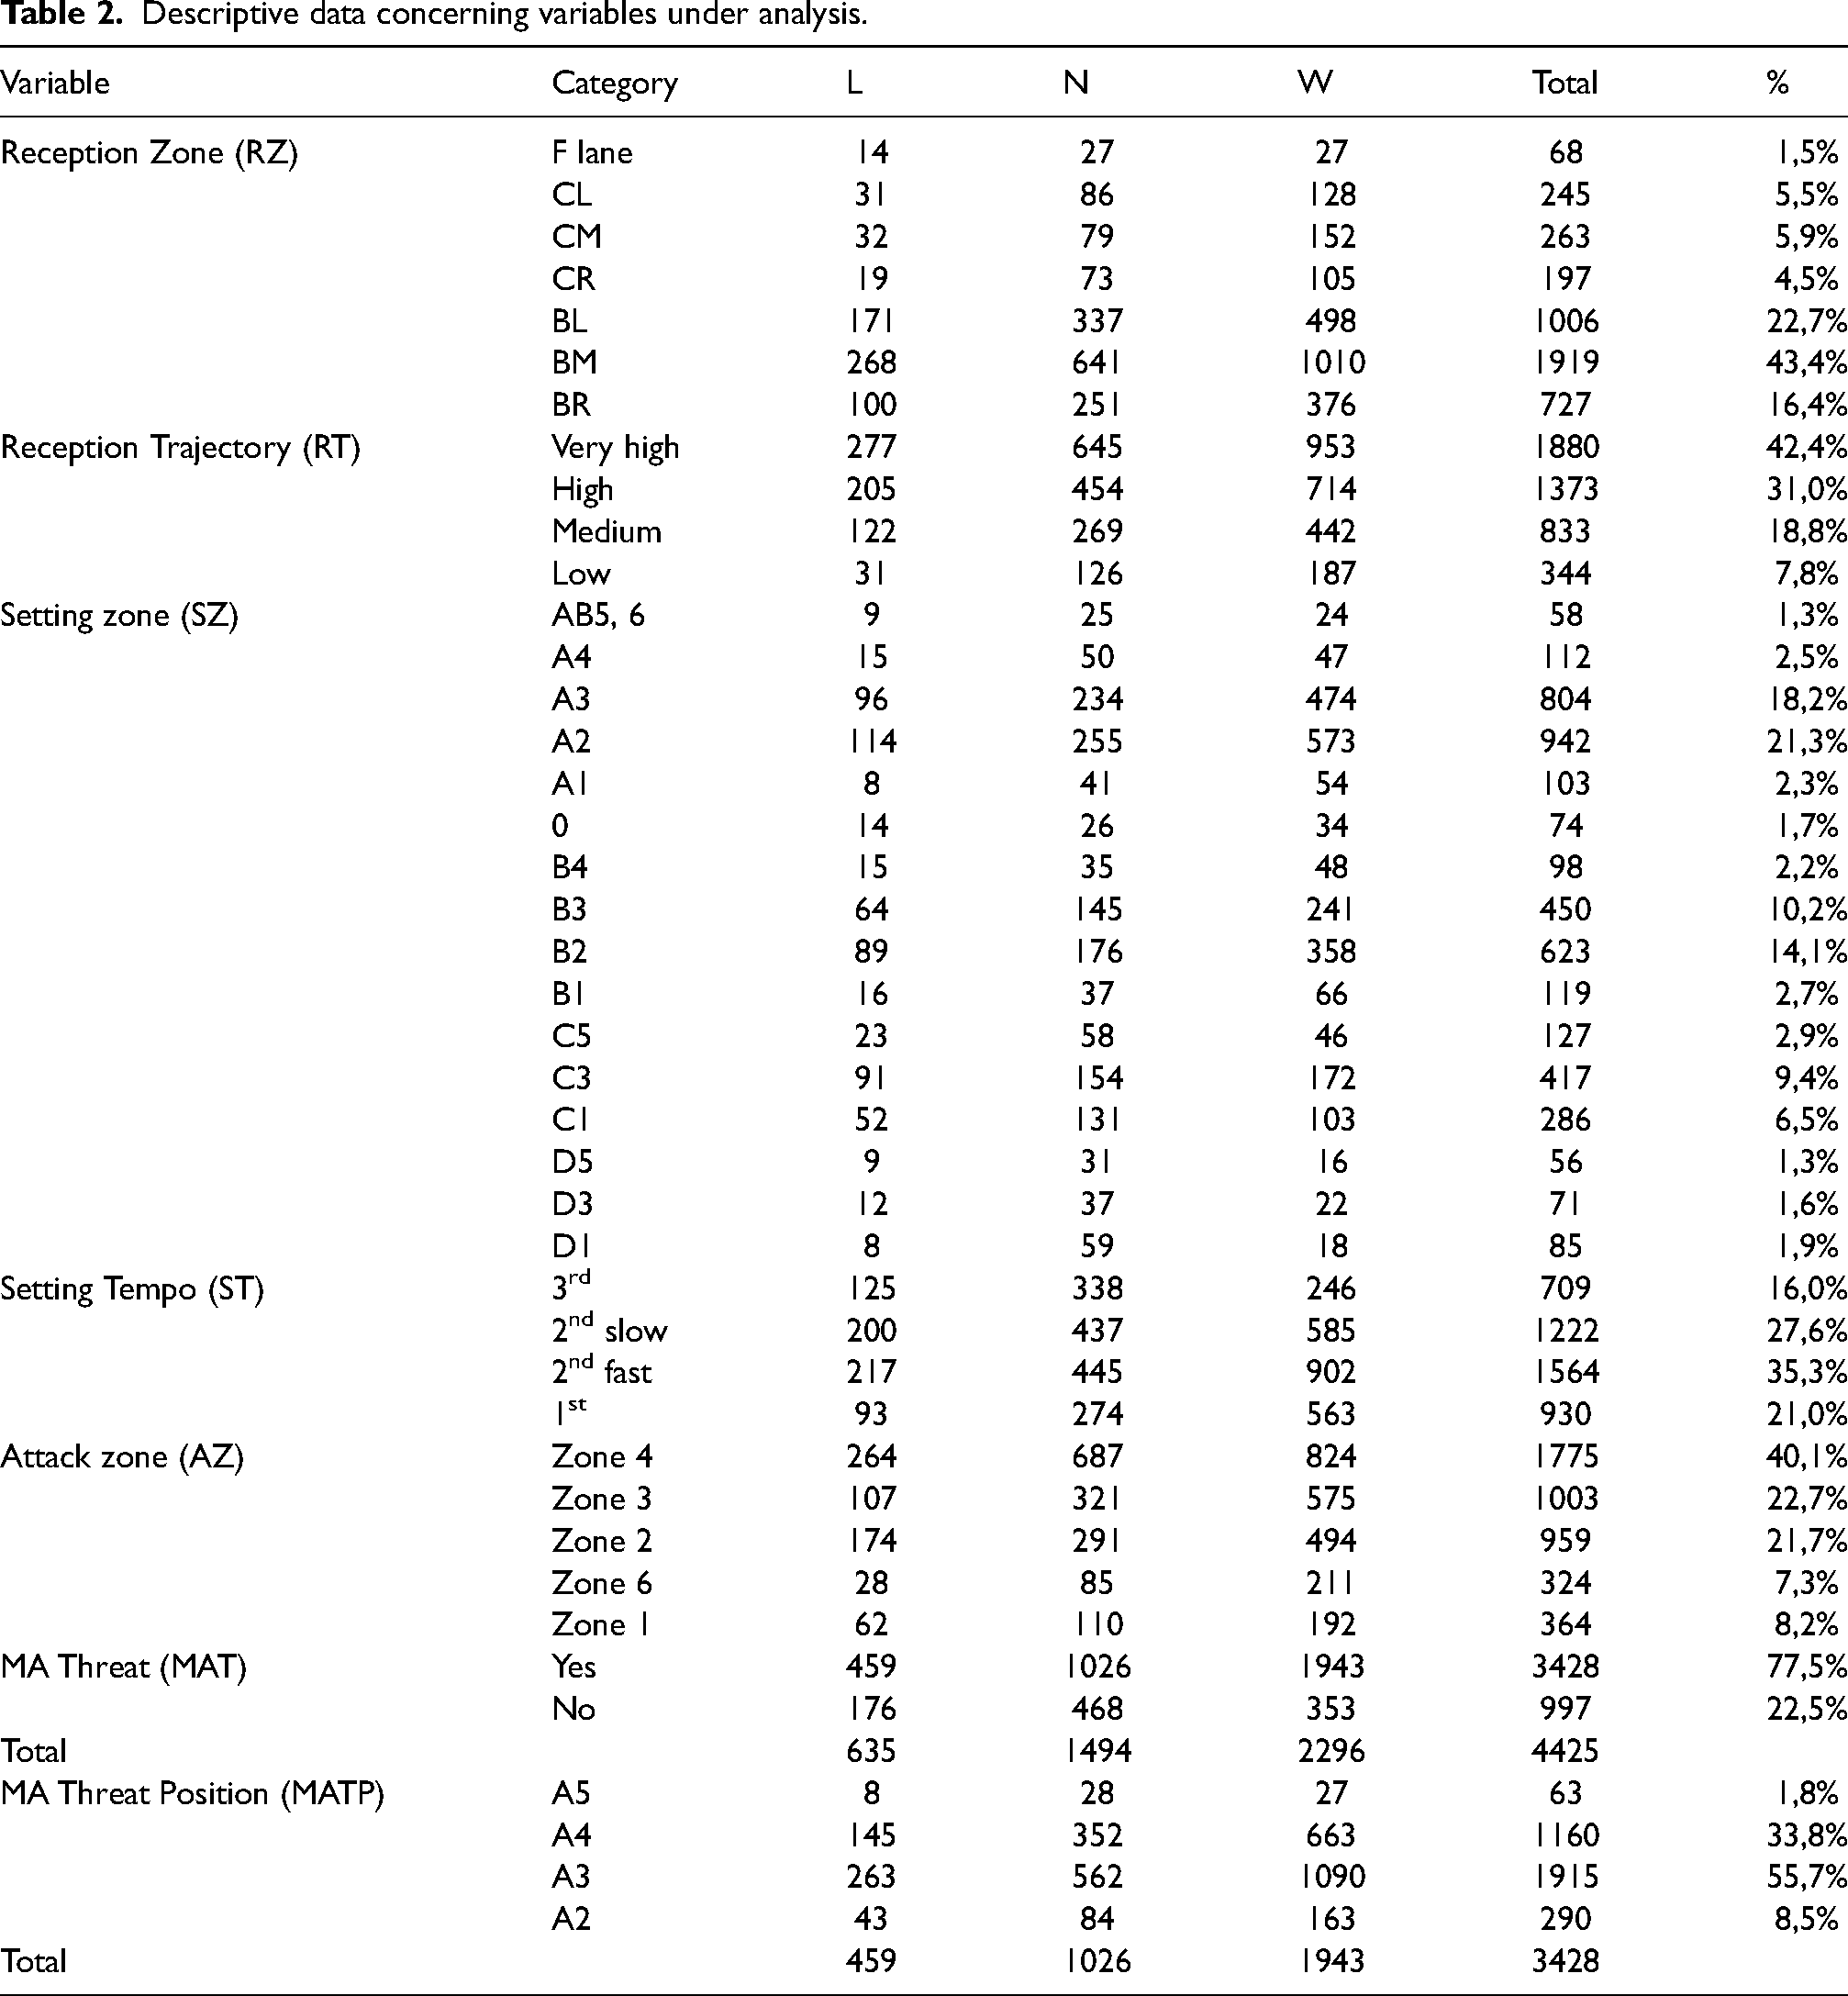
Given their low frequency of occurrence, attacks from attack zone 5 (n = 13, < 0.5%) and attacks after an MA movement to the A1 area (n = 9, 0.3%) were deemed statistically insignificant and consequently excluded from further analysis. This resulted in a final sample size of N = 4.425 attacks. Furthermore, due to the limited frequency of specific spatial zone occurrences, a targeted consolidation of these zones was implemented. More detailed, the reception zones FL (N = 34, 0.8%), FM (N = 23, 0.5%), and FR (N = 11, 0.2%) were merged in the Flane zone and the Setting zone 6 (N = 28, 0.7%), A5 (N = 21 0.5%), and B5 (N = 9, 0.2%) were merged in AB5,6 zone, due to the almost equal abilities to organise offensive play. The frequencies of reported data of independent variables as well as chi-square analyses are presented in Table 2 and Table 3. The structure of the relationships revealed by mosaic plots (Figure 1) is described in the following.
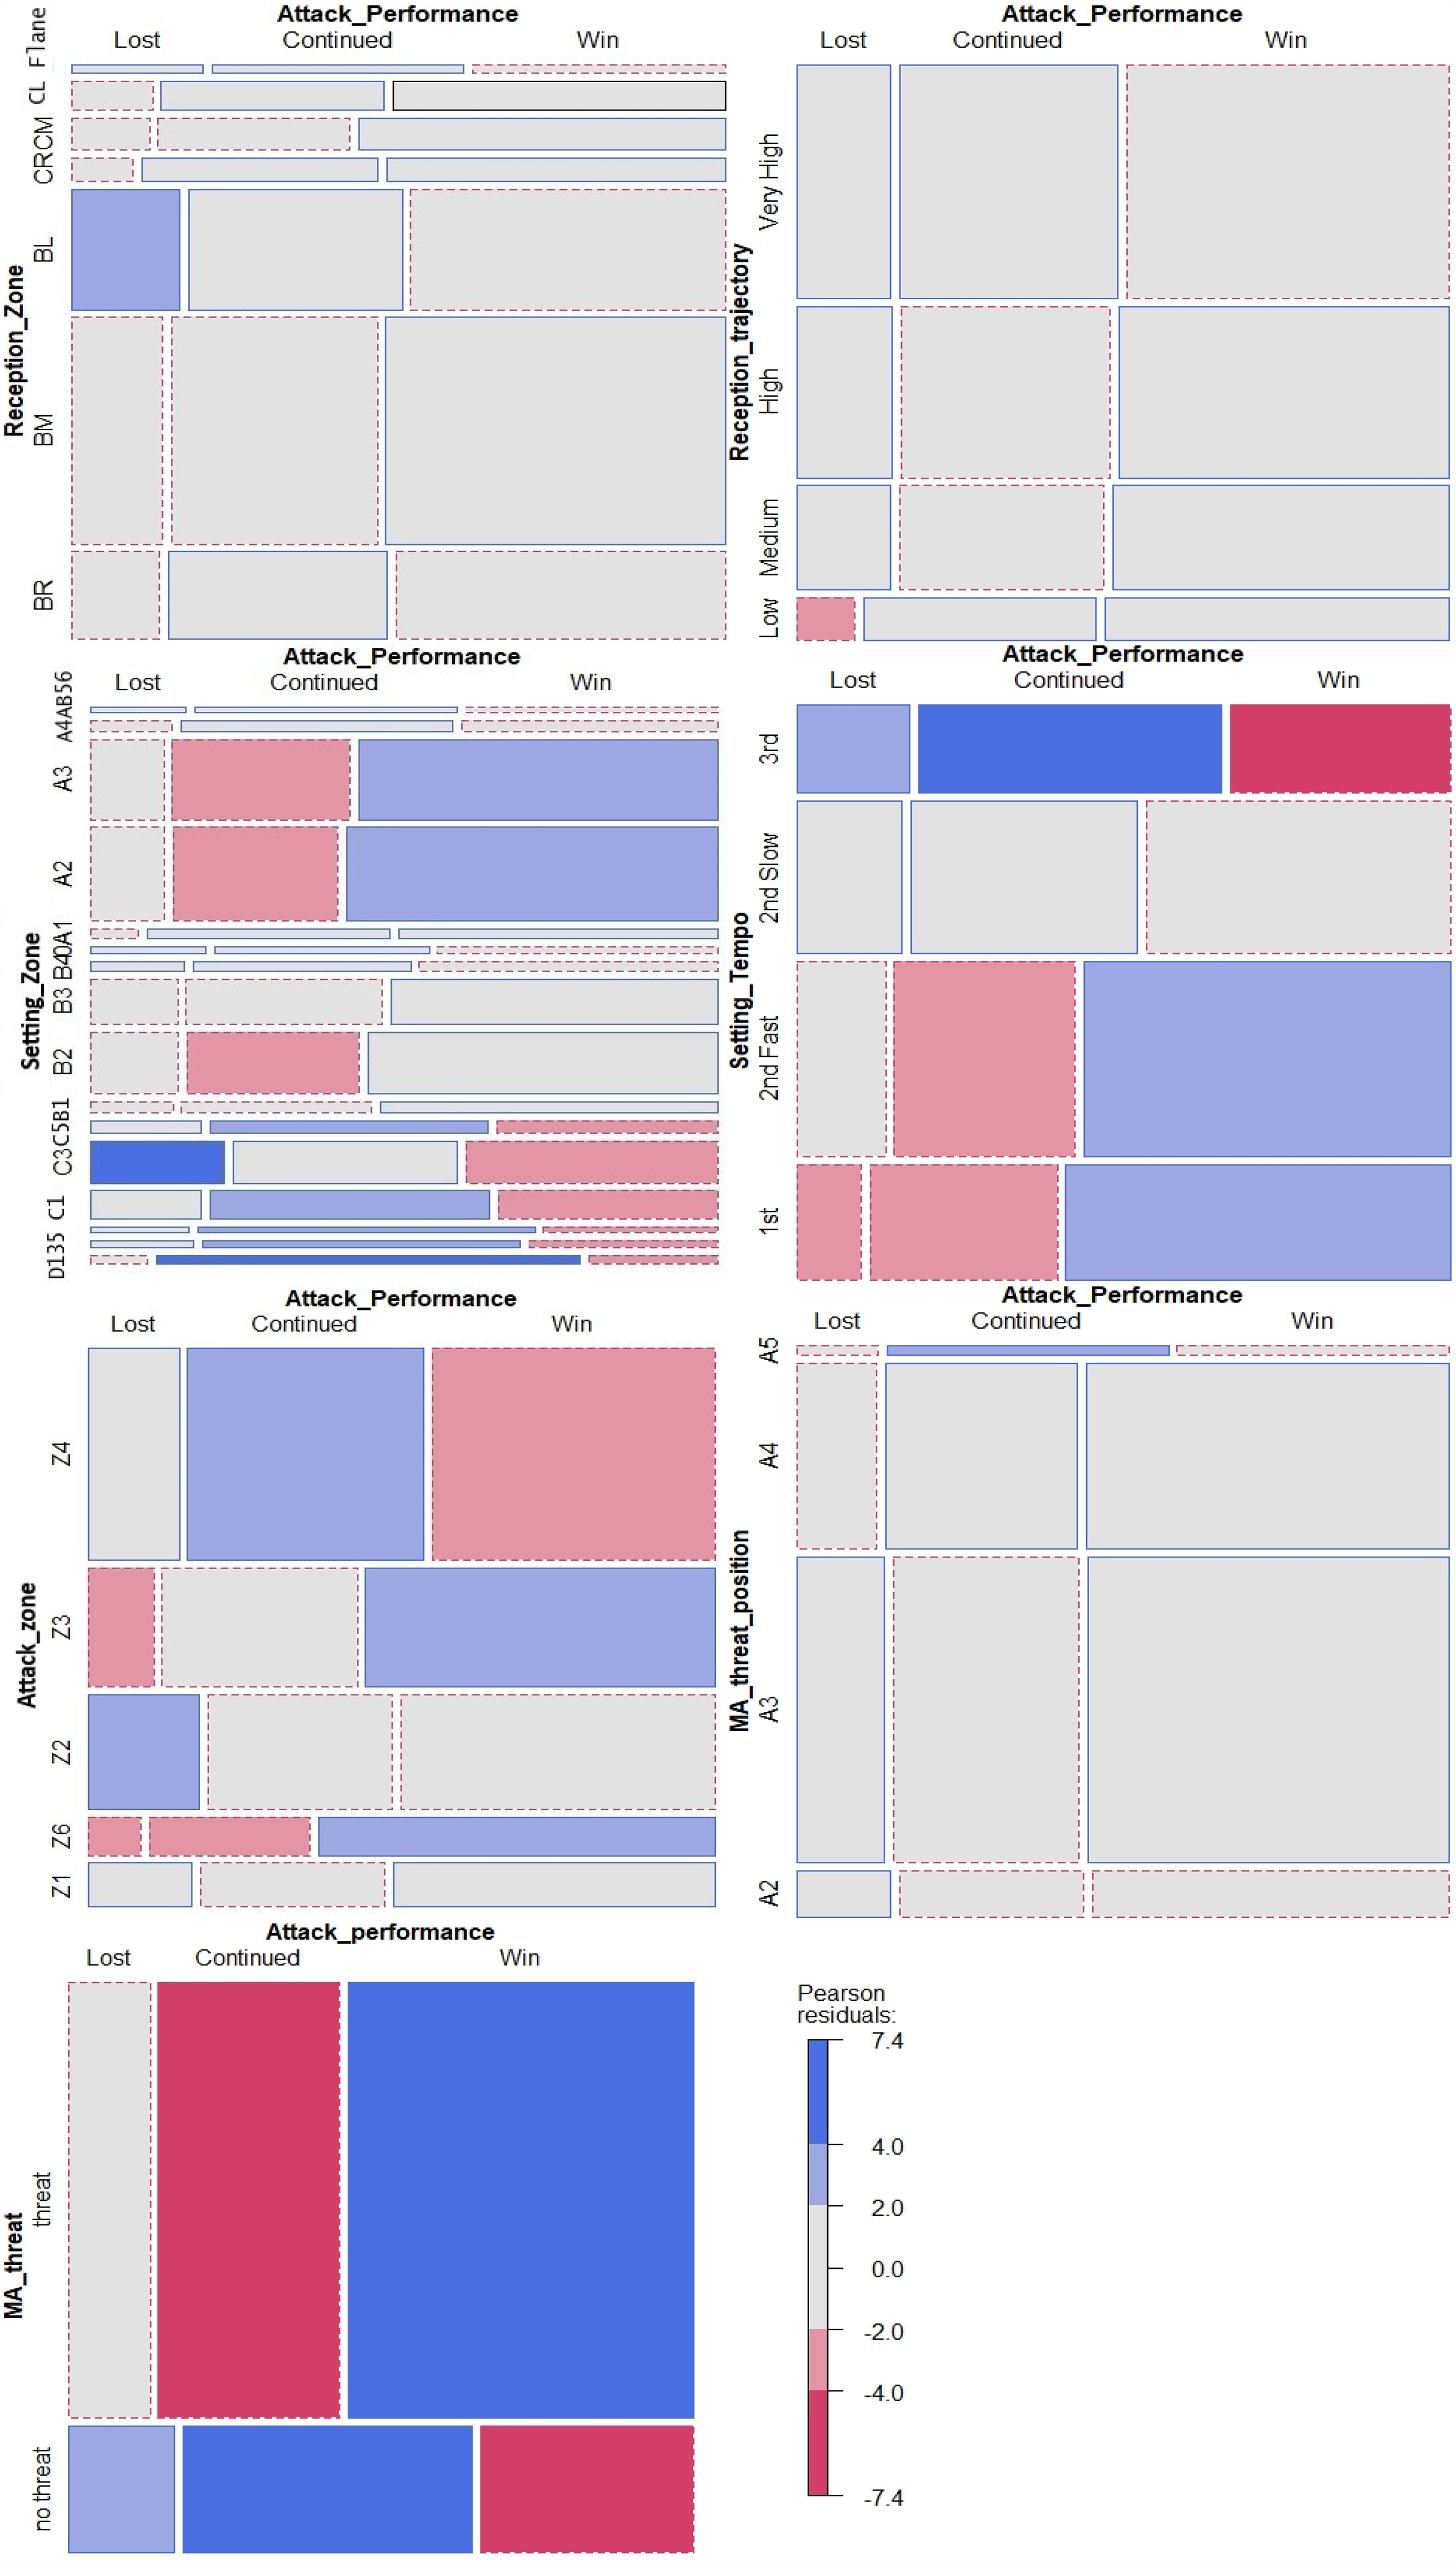
Mosaic plots of the two-way contingency tables of spatiotemporal and tactic characteristics.
Descriptive data concerning variables under analysis.
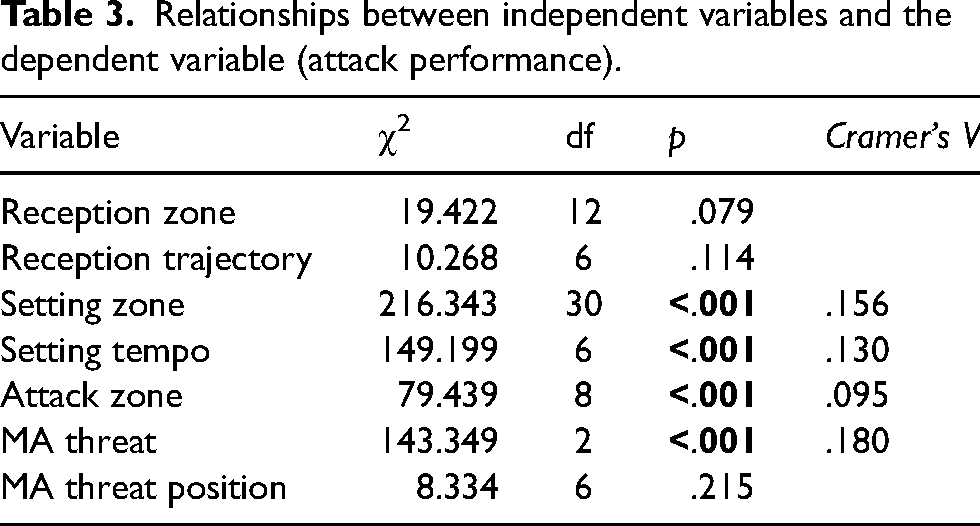
Relationships between independent variables and the dependent variable (attack performance).
Attack performance concerning the reception zone
From the analysed receptions 82.5% (N = 3.652) occurred in the back lane and 1.5% (N = 68) in the front lane. Win attacks were more frequent following receptions in the centre of the court (CM) area (N = 152, 57.8%) compared to the less frequent in the front lane (F lane) (N = 27, 39.7%). Conversely, lost attacks were more likely to occur after receptions in the front lane (N = 14, 20.6%). An independence test revealed no significant association between reception location and attack outcome (χ2 = 19.422, df = 12, p = 0.079). Even if no significant association was found between the two variables, the adjusted residuals analysis revealed that the observed frequency of lost attacks following receptions at the BL area (AdjRes = 2.7) was higher than the expected frequency.
Attack performance concerning the reception trajectory
Analysis of reception trajectory and attack outcome revealed a non-significant association (χ² = 10.286, df = 6, p = 0.114). Win attacks were more common after low receptions (N = 187, 54.4%) than very high trajectories (N = 953, 50.8%). Conversely, lost attacks were observed more frequently following high reception trajectories (N = 205, 14.9%) than low trajectories (N = 31, 9.0%). Additionally, the adjusted residuals revealed that the observed frequency of lost attacks following a low trajectory (AdjRes = −2.9) was lower than expected.
Attack performance concerning the setting zone
The higher rate of win attacks was revealed when the reception was directed to the A2 area (N = 573, 60.8%) and the lower one when the reception was directed to the D1 area (N = 18, 21.2%). The percentages of the win attacks per area of the setting zone are presented in Figure 2. Concerning lost attacks, the higher rate was revealed in the C3 area (N = 91, 21.8%) and the lower one in the A1 area (N = 8, 7.8%). An independence test revealed a significant association between setting zone and attack outcome (χ2 = 216.343, df = 30, p < 0.001). A Cramer's V coefficient of 0.156 indicates a moderate correlation between the two variables.
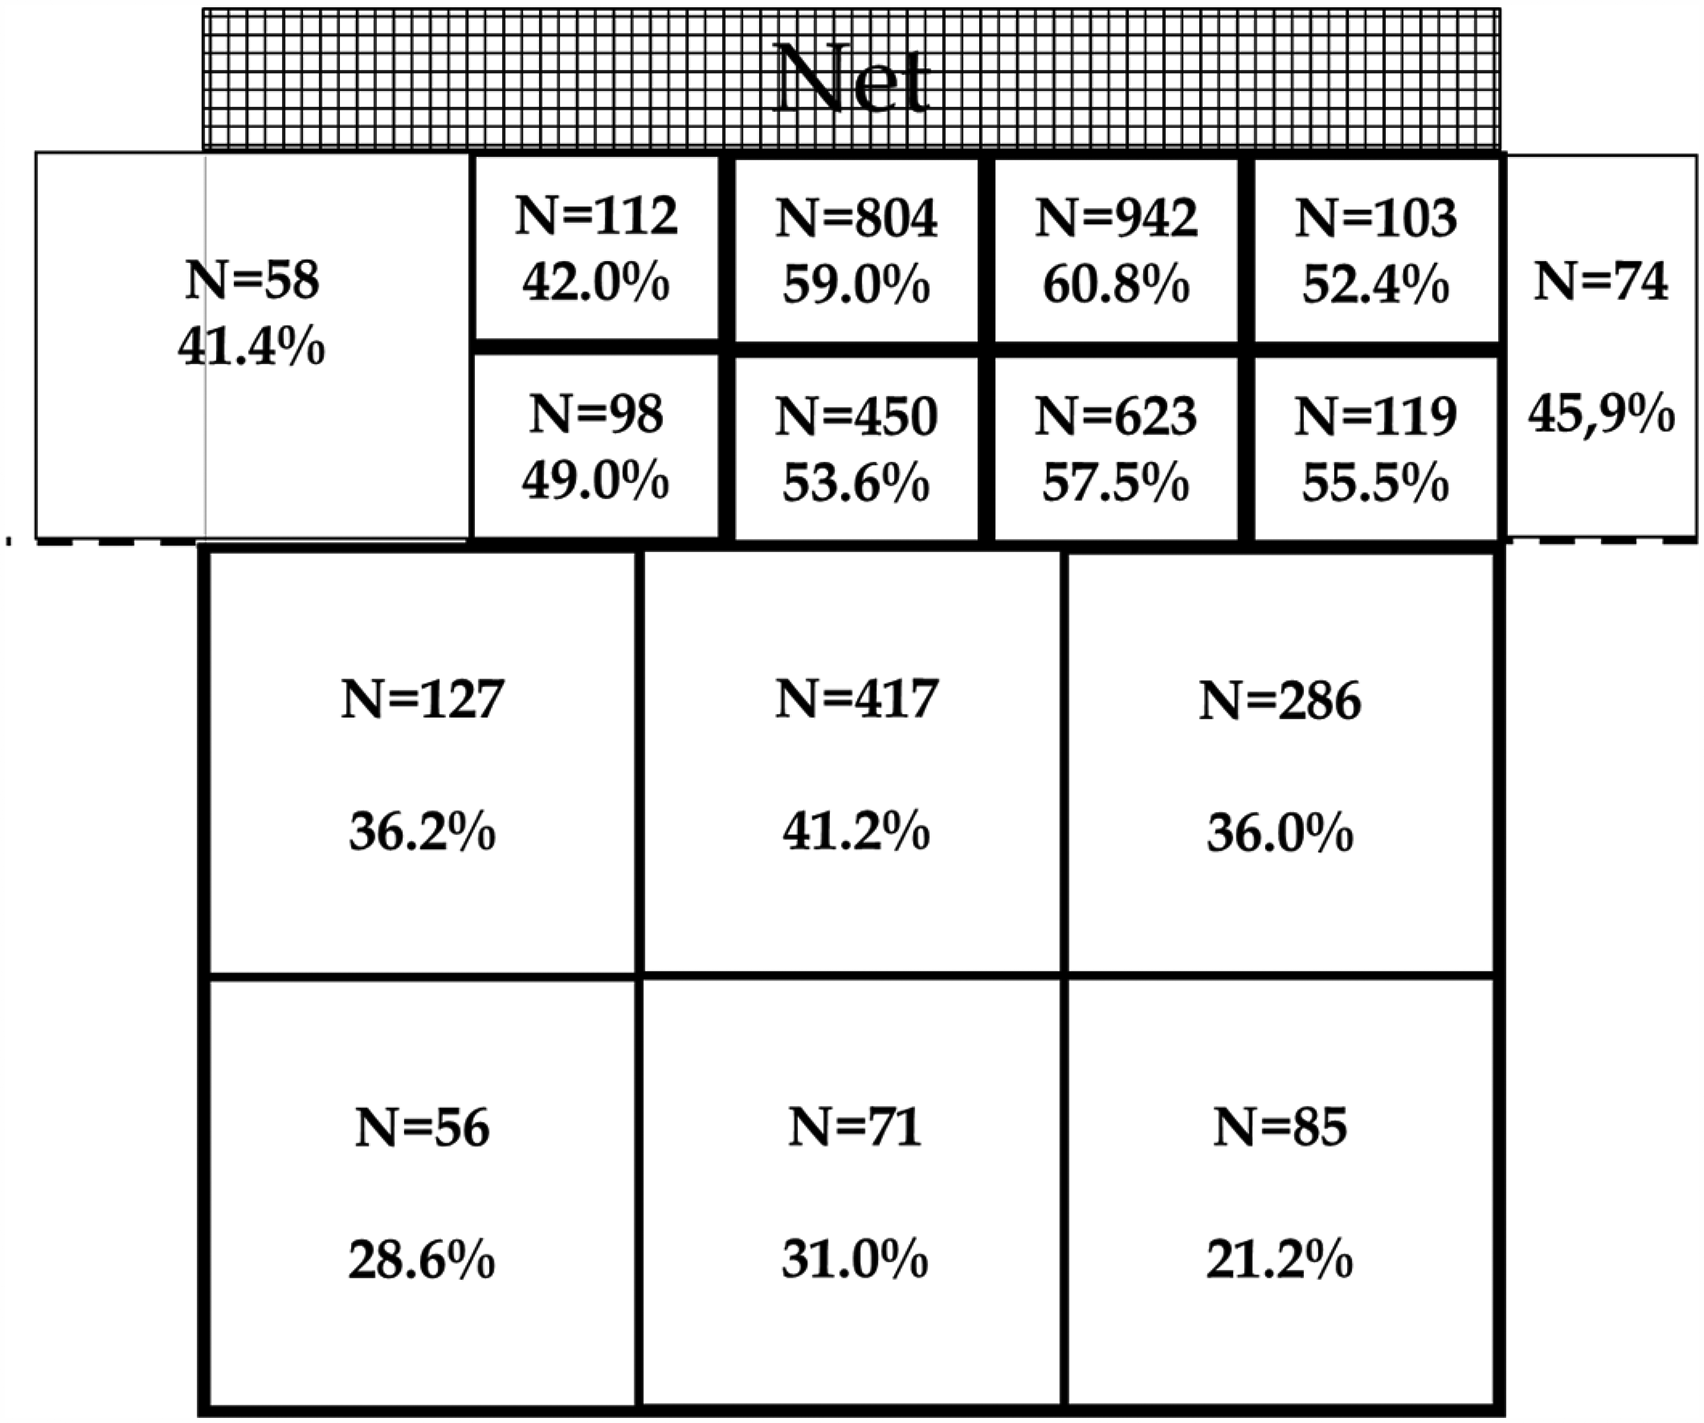
Number of receptions directed to the zones of the court and ratio of the won attacks after setting from each area.
AdjRes revealed that certain setting zones exhibit a discrepancy between observed and expected frequencies. These zones, implicated in variable interdependence, were: A2 (AdjRes = −2.8 and 3.5), A3 (AdjRes = −2.1 and 3.0), C5 (AdjRes = 2.9 and −3.6), C1 (AdjRes = 2,3 and - 3,8), D1 (AdjRes = 4.4 and −3,8), D3 (AdjRes = 3.3 and −2,6) and D5 (AdjRes = 3.8 and −3.2) for continued and won attack, respectively. Additionally, C3 (AdjRes = 4,6 and −3,6) for lost and won attacks and B2 (AdjRes = −3.1) for continued attack.
Attack performance concerning the setting tempo
The higher rate of lost and continued attacks was recorded after 3rd tempo attacks, with 17.60% (N = 125) and 47.70% (N = 38), respectively. The higher rate of won attacks was recorded after 1st tempo attacks with 60.50% (N = 563). An independence test revealed a significant association between setting tempo and attack outcome (χ2= 149.199, df = 6, p < 0.001). A Cramer's V coefficient of 0.130 indicates a moderate correlation between the two variables. Regarding AdjRes, the setting tempo that has fewer or more observations than expected and is involved in the dependence between the variables are the 1st tempo (AdjRes = −3.8, −3.1 and 3.9) for lost, continued and won attack respectively, the 2nd fast tempo (AdjRes = −3.8, 3.9) for continued and won attack respectively, and the 3rd tempo (AdjRes = 2.7, 7.4 and 7.3) for lost, continued and won attack respectively.
Attack performance concerning the attack zone
The higher rate of lost attacks was recorded after an attack from zone 2 (N = 174, 18.10%), while the highest rate of won attacks was recorded after an attack from zone 6 (N = 211, 65.10%). The results of the independence test were χ2= 90.204, df = 10, p < 0.001, revealing a significant association between attack zone and attack outcome. Cramer's V coefficient of 0.095 indicates a weak correlation between the two variables. Regarding the adjusted residuals (AdjRes), the attack zones that have fewer or more observations than expected and are involved in the dependence between the variables are zone 2 (AdjRes = 3.8) for lost attack, zone 3 (AdjRes = −3,7 and 3.9) for lost and won attack respectively, zone 4 (AdjRes = 3.9 and −3,9) for continued and won attack respectively and zone 6 (AdjRes = −3.0, −3.0 and 3.9) for lost, continued and won attack, respectively.
Attack performance concerning the existence of a threat from the MA
The higher rate of lost and continued attacks was recorded after an attack without MA threat with 17.70% (N = 176) and 46.90% (N = 468) respectively. In contrast, a higher ratio of won attacks was recorded after an attack with an MA threat at 56.70% (N = 1.943).
The results of the independence test (χ2= 143.349, df = 2, p < 0.001) revealed a significant association between MA threat and attack outcome. A Cramer's V of 0.180 indicates a medium degree of correlation between the two variables. Regarding the AdjRes, the variables of the existence or non-existence of the MA threat that have fewer or more observations than expected and are involved in the dependence between the variables are non-existence of threat (AdjRes = 3.3, 7.4 and −7.3) for lost, continued and won attack, respectively and the reciprocal values for the existence of an MA threat.
Attack performance concerning the threat position of the MA
The higher ratio of lost attacks was recorded after a threat in the A2 area with 14.80% (N = 43), while in contrast the higher ratio of won attacks was recorded after a threat in the A4 area with 57.20 (N = 663). The results of the independence test were χ2= 8.334, df = 6, p=<0.215, revealing no significant association between the threat zone of MA and attack outcome.
Log-linear analysis
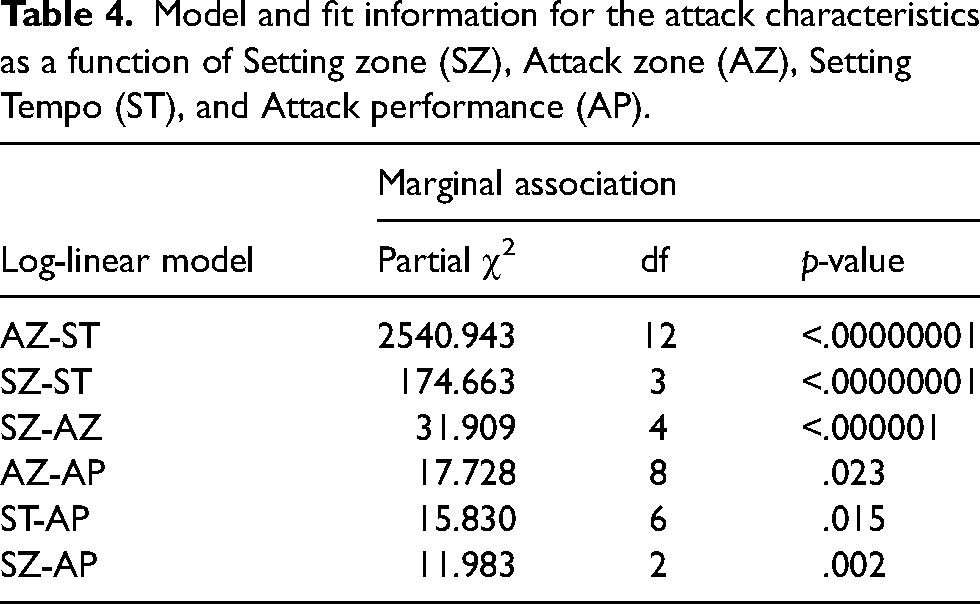
For the loglinear analysis, the setting zone variable was dichotomised into two categories: ‘On-target’ (N = 2.819, 63.7%) encompassing receptions within the A2, A3, B2, and B3 areas, and ‘Off-target’ (N = 1.606, 36.3%) representing receptions from all the other area. A backward elimination procedure was employed to identify the optimal model. Table 4 presents the results of this analysis. The selected model incorporates six out of the ten potential two-way interaction terms: interaction between attack zone and setting tempo, setting zone and setting tempo, setting zone and attack zone, attack zone and attack performance, setting tempo and attack performance, and setting zone and attack performance.
Model and fit information for the attack characteristics as a function of Setting zone (SZ), Attack zone (AZ), Setting Tempo (ST), and Attack performance (AP).
Multiple correspondence analysis
Figure 3 presents a two-dimensional map derived from MCA applied to the contingency table of the data. The first two dimensions, accounting for 87.92% of the total variance, illustrate the primary relationships within the data. The horizontal dimension (53.74% explained variance) reflects the relationship between attack performance and factors such as setting zone, setting tempo, attack zone, and the presence of an MA threat. Successful attacks (win attacks) are associated with receptions in areas A2, A3, B2, B3, with partial associations in A1. These attacks typically occur in first and second fast tempo settings to zones 3 and 6. Conversely, continued and lost attacks are linked to receptions outside the offensive zone (areas C and D) or near the sidelines (areas B1, B4, 0, AB5,6). These attacks often involve second slow and third tempo settings to the wings (zones 4, 2, 1) without the presence of an MA threat. Attacks resulting in a positive outcome (located in the upper left quadrant) are associated with receptions in areas A2, A3, B2, B3, with second fast tempo settings to zone 6 following a MA threat. The vertical dimension (34.17% explained variance) primarily reflects the spatiotemporal characteristics of continued attacks, considering factors such as Setting zone, proximity to the side-lines (C1, C5, AB5,6) or baseline (areas D), and third tempo without an MA threat.
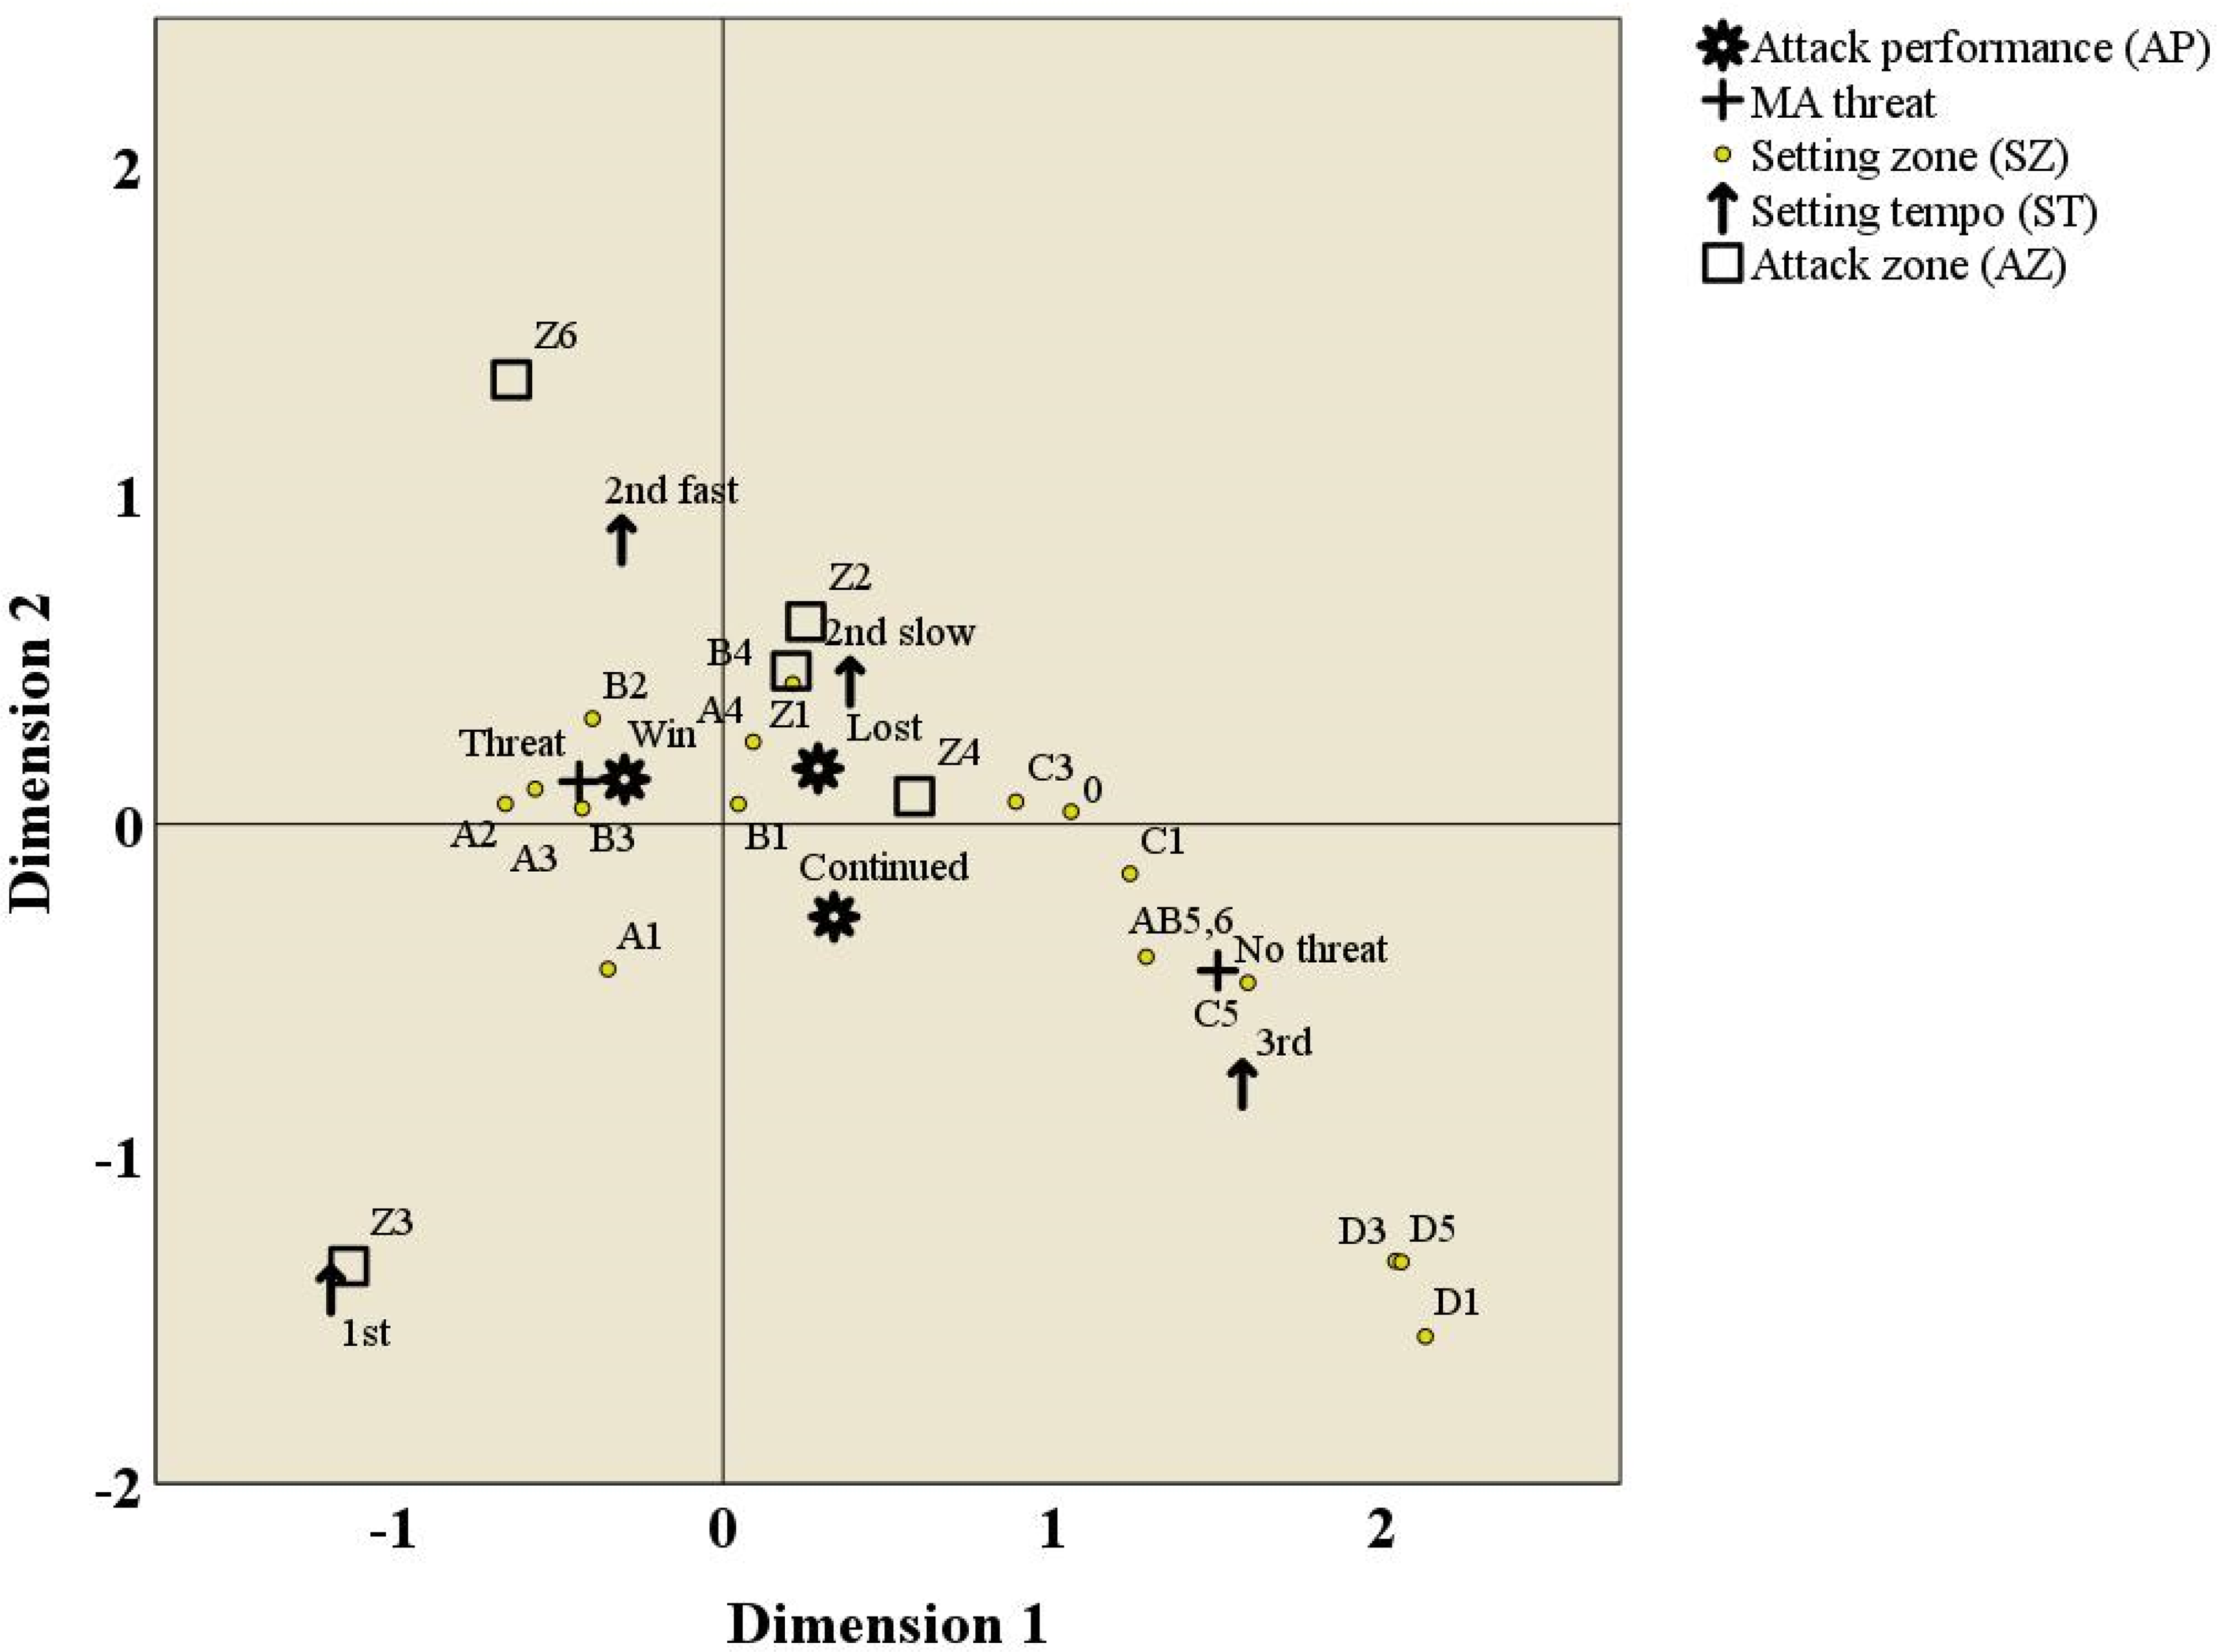
Map obtained by the multiple correspondence analysis performed on the five-way contingency table formed by setting zone and tempo, MA threat, attack zone and performance. The map displays the coordinates of categories of all variables in the two dimensions that capture the highest fraction of the total variable.
Discussion
The present investigation sought to ascertain the influence of spatiotemporal variables within complex 1 volleyball game actions on attack performance. Volleyball, characterised by the interconnectedness of its constituent game actions, necessitates a nuanced examination of individual elements to elucidate their potential impact on game progression and subsequent attack efficacy.
A quantitative analysis of the study's data revealed a negligible correlation between the reception zone on the court and the subsequent performance of the attack. The majority of receptions were concentrated in the back-court zones (BR, BM, BL), with zone BM recording the highest frequency. This observation is likely attributed to the high velocity serves characteristic of elite men's volleyball, which often targets the back line to minimise the risk of errors. However, this finding appears to contradict previous research suggesting that teams strategically target zone 5 (the outside hitter's responsibility) to disrupt their offensive capabilities.42,43 Despite these findings, the tactic of targeting the receiver-attacker positioned in the BL area of the court appears to be effective, as a higher frequency of lost attacks has been observed following receptions in this specific area. Additionally, the study observed a significantly lower frequency of serves directed towards the front-court zones (FR, FM, FL), which is likely due to a preference for powerful, spinning serves aimed near the back line. These findings corroborate existing research indicating that the net height and distance from the serving point influence the choice of serving target. 44 By forcing receivers to execute more intense movements, back-line serves can potentially reduce reception quality and hinder the development of the attack, particularly the outside hitter's offensive actions in zone 4. 45 Regarding the distribution of receptions across the right, central, and left zones, the results of the present study align with those of Barzouka et al., 46 which identified a hierarchical preference for zones 6, 5, and 1. Despite the concentration of receptions in these zones, the study found no significant differences in attack variable percentages, suggesting that the reception zone does not substantially impact the quality of the attack. 45
The present study examined the correlation between reception trajectory and attack performance in volleyball. Contrary to expectations, attack efficiency did not appear to be directly influenced by the quality of the reception trajectory. While the higher number of attacks occurred following very high receptions, the most effective attacks were executed after low trajectory receptions. Moreover, the rate of lost attacks was significantly lower after low trajectories, suggesting that attackers were more successful in controlling the ball and avoiding errors in these situations. This finding aligns with the understanding that each action in volleyball, except for the serve, is influenced by a preceding action and in this case, the reception influences the subsequent setting 47 and the setting influences the attack.14,15 This counterintuitive finding can be attributed to the inherent risk-reward dynamic associated with different reception types. When a ball is received with a poor trajectory, potentially hindering the setter's optimal positioning 47 the attacker is often forced to adopt a more cautious approach, prioritising ball placement and error avoidance over aggressive play. This strategic adjustment may contribute to a lower rate of lost attacks and a higher likelihood of continuing the attack sequence. Furthermore, receptions that do not give the setter all attack options may lead to a slower attack organisation, 48 which could paradoxically result in fewer errors as attackers have more time to control their actions. Moreover, the data revealed that the highest ratio of won attacks occurred after low-trajectory receptions, while the lower ratio was recorded following high-trajectory receptions. A plausible explanation for this unexpected outcome is that receptions directed towards the area around the ideal setting zone, executed with a low but manageable trajectory, may confer a temporal advantage to the receiving team. According to Fellingham et al. 10 the speed of a setting has a relationship with the outcome of the attack. A reception with a manageable low trajectory could allow for a quicker and more deceptive set, potentially leading to a higher rate of won attacks. Studies have shown that faster attack tempos increased spike performance14,15 and that teams with difficulty using fast attack tempos have less chance of scoring. 49 This suggests that even if a high reception allows for an attack under optimal conditions, the potential benefit might be offset by a loss of tempo compared to attacks following a controlled low reception. Additionally, a low reception trajectory might indicate a more precise reception efficacy, where the ball reaches a more optimal setting zone, allowing the setter to all the attack options or at least facilitating quicker attacks. This advantage and the setter's superior skill level enable them to rapidly deploy 2nd fast tempo settings.10,14,15,50 The accelerated pace at which the ball reaches the wing attackers challenges the opposing team's ability to establish a coordinated defensive block, thereby creating advantageous conditions for a successful offensive play.47,51,52 These findings tentatively suggest the potential strategic significance of reception trajectory, in volleyball. While seemingly counterintuitive, the data indicate that under specific conditions, receptions with lower trajectories may be associated with more effective and efficient subsequent attacks. Further research is warranted to more fully elucidate the complex interplay between reception trajectory and attack outcomes.
Regarding the attack performance concerning the setting zone, the results showed that there is a dependency, but with a small to medium effect size. This means that while the setting zone does influence attack performance, the association explains a relatively modest amount of the variability in attack performance. The majority of the receptions were directed in zones A2, A3, B2 and B3, indicating that more than half of the receptions (2.819 receptions in these zones out of a total of 4425 receptions) were directed around the ideal point of receiving the ball from the setter. It is no coincidence that we have a higher ratio of won attacks after a setting from these areas, as the setter can implement his tactical plan well and has all the attackers available and can use combinations with them. Conversely, it is observed that the further the setter moves away from the ideal point of receiving the ball, the less effective the attack becomes. The D1 zone records by far the highest percentage of continued attacks and the lowest ratio of won attacks. From this zone, the setter primarily has only one attacker available, the player in zone 4, who in turn seems to have a priority to place the ball in the opponent's court without risk, thus justifying the low ratio of lost attacks after a setting from zone D1. In general, it seems that the D zones record the lowest efficiency of the attack, as the setter has few attacking options and tends to pass the ball to the zone 4 attacker, 17 in a slow tempo, 53 but enabling the opposing team to better organise its block consisting sometimes of three blockers. 54 The C zones seem to have a higher percentage of won and lost attacks compared to the D zones. The setter from these zones can have more than one attacker at his disposal, so, on the one hand, there are better-attacking conditions and the efficiency rate increases, but on the other hand, due to the better conditions, the attacker does not focus on simply placing the ball to the opponent's court, but attacks with more risk thus leading to either a mistake or a spike on the opponent's block.
The efficacy of volleyball attacks is significantly influenced by the tempo of the setting, however, with a small effect size. So, the tempo of the setting has a statistically significant impact on attack performance, but this impact is relatively small compared to the setting zone. The highest number of attacks occurred in the second-fast tempo, while the third tempo was the least utilised. This suggests a prevalent offensive strategy aimed at disrupting the opponent's defence through fast-tempo settings, catching them off guard. Consistent with this finding, Fellingham et al. 10 advocate for coaches to prioritise training setters in first-tempo attacks, not only from zone 3 but also with all attackers along the net. Numerous studies underscore the association between faster setting tempos with increased match wins and attacking efficiency.18,55 Moreover, Afonso et al. 53 highlight the advantage of faster offensive play in countering fewer compact blocks. Third-tempo settings typically arise when the setter is forced to deviate from the ideal setting zone or when another player executes the second touch. Consequently, these attacks exhibit the lowest percentage of successful attacks and the highest rates of continued and lost attacks. Tsavdaroglou et al. 56 note that attackers in third-tempo attacks often face organised defences with three-player blocks, making it challenging to break through or avoid errors. In contrast, first-tempo attacks recorded the highest efficiency. This is attributed to the attacker frequently encountering single blocks or delayed set-up blocks, allowing for powerful spikes that are difficult to defend due to their speed and verticality. While second-fast tempo attacks are the most executed, they still demonstrate a relatively high percentage of successful attacks. Although less efficient than first-fast-tempo attacks, they are more effective than third-tempo attacks, reinforcing the superiority of a quick attacking game. To facilitate this strategy, the reception must be directed in a manner that allows the setter to set to all available players with speed and accuracy. Coaches should therefore focus on training setters to accurately set the ball from various zones at a fast tempo, while also emphasising reception skills to support the setter's efforts.
Regarding the correlation between attack performance and attack zone, the findings indicate a distinct dependency, but with a small effect size. Where the attack is directed has a significant influence, but it accounts for a smaller portion of the variation in attack performance compared to the setting zone and tempo. The majority of attacks were executed by players in zone 4, followed by zones 3 and 2. Zones 1 and 6 exhibited attack frequencies lower than the other zones, but comparable between them (N = 365 and 324 attempts, respectively). While zone 4 recorded the highest number of attacks, it also demonstrated the lowest ratio of successful attacks and the highest ratio of continued attacks. This can be attributed to the zone's proximity to the setter, making it a more accessible target for setting. Consequently, setters often prioritise zone 4 attackers in challenging situations due to their perceived reliability. 57 Emphasising zone 4 attacks in adverse conditions during training could enhance attackers’ ability to evade opponents’ blocks and secure immediate points. Zones 1 and 2, primarily occupied by the opposite hitter, showcased the highest ratio of missed attacks, while their successful attack rates were relatively high. The opposite hitter, a pivotal figure in high-level teams, is often entrusted with a significant portion of the attacking workload, especially in complex situations. 15 Teams frequently construct defensive strategies around this player, explaining the zone-specific attack ratios. Conversely, zones 6 and 3, located centrally on the court, emerged as the most effective attacking zones, registering successful attack rates. These zones also exhibited the lowest ratios of lost attacks. Factors contributing to these results include the 1st setting tempo from zone 3 and the attacking combinations that enable zone 6 players to execute attacks at a similar speed. In men's volleyball, zone 6 attacks have become an integral part of teams’ offensive strategies. 14 Moreover, setters often choose zone 6 when they are in the defensive zone to increase the number of available attackers across the net.14,58 Attackers from these zones frequently faced less organised blocks, allowing them to execute more effective attacks and secure points. In conclusion, quick attacks from the central part of the court appear to be highly effective and have been fully integrated into the tactical plans of contemporary volleyball teams. 14
The efficacy of volleyball attacks appears to be contingent upon the presence or absence of an MA, with a medium effect size. This suggests that the presence of the MA threat have a notable impact on how well attacks perform. A significant majority of attacks (77.3%) were initiated following an MA threat. Comparative analysis of attacks with and without MA threats revealed a substantial disparity in outcomes, with significantly higher rates of successful attacks, fewer continued attempts, and lower error ratios when a threat was present. Specifically, the percentage of successful attacks increased from 35.10% to 56.70% when an AM threat was established. These findings underscore the importance of MAs consistently executing threats, even in suboptimal attacking conditions. As Araújo et al. 54 posit, a dynamic MA threat can impose temporal pressure on opposing middle-blockers, demanding a split-second decision between blocking their primary opponent and shifting laterally to organise a cohesive block. Even a slight delay in this response can create a vulnerability for opposing attackers to exploit, facilitating more disorganised blocking and defensive arrangements. 20 Conversely, the absence of an MA threat can lead to more organised blocking and defensive formations, increasing the likelihood of attack errors or less aggressive spike attempts, ultimately providing opponents with greater counterattack opportunities.
The study revealed a distinct pattern in the distribution of MA threats concerning attacking performance. The A3 zone, situated at the centre of the court, experienced the highest frequency of threats. Similar results were found by Sapena Peiro et al. 20 This can be attributed to the increased difficulty of executing a double block from this position due to the greater distance to the court's edges, 47 and the simultaneous presence of an attacker from the middle lane of the defensive zone. 14 Conversely, the A1 zone recorded negligible threats, rendering it an insufficiently representative sample. While the A4 zone also exhibited a significant number of threats, it is noteworthy that it recorded the highest ratio of attacks won when a threat was initiated from this area. This can be explained by the proximity of A4 to zone 4. Setters often employ a strategy of overloading one side of the court with attackers while attempting to break through the opposing block on the opposite side, thereby increasing the likelihood of a successful attack. 20 The A2 zone, located behind the setter, was characterised by a low frequency of threats. This suggests that MAs generally prefer to attack in front of the setter, at 1–3 metres. In conclusion, the specific threat zone of an MA is not fixed but is influenced by the setter's positioning and the chosen attacking strategy. However, the central portion of the net emerges as the primary area of focus for middle-blocker threats.
This study investigated the intricate relationship between various spatiotemporal factors within Complex 1 and their impact on attack performance in high-level men's volleyball. The findings underscore the significance of specific elements in optimising attack success. While the reception zone has a limited influence on the success of the subsequent attack, the effectiveness of targeting the BL area with serves was evident. This strategy, often employed in elite volleyball, can disrupt the reception and subsequent attack. Additionally, low-trajectory receptions, although challenging for attackers, can lead to more controlled and efficient attacks, as players may prioritise accuracy over power. The study further emphasises the importance of setting tempo. Faster tempos, particularly first-tempo attacks, are associated with higher attack success rates. Moreover, the central lane (zones 3 and 6) emerged as highly effective attacking zones. These areas often allow for more powerful and accurate attacks, particularly when combined with well-timed MA threats. The presence of an MA can significantly disrupt opponents’ defensive strategies, creating opportunities for successful attacks from other positions.
Acknowledging the defined scope of this research, which focused on elite male national team volleyball, several limitations warrant consideration for a comprehensive understanding of complex I effectiveness. Firstly, the study did not account for the characteristics of the serve, including serve power and trajectory. Secondly, while the reception trajectory and direction were analysed, the study did not directly assess the overall quality or outcome of the reception. Thirdly, the analysis did not incorporate data on the opposing team's blocking formation (initial positioning and number of blockers). Finally, the study did not capture errors in reception and setting that resulted in direct points for the opponent, potentially underestimating the overall efficiency of complex I. These unexamined variables represent potential avenues for future research to provide a more holistic understanding of the factors influencing the effectiveness of the side-out phase in elite volleyball. Comparative analyses between genders could provide valuable insights into potential differences in playing styles and strategies. Additionally, a comparative analysis between teams of the same gender could offer in-depth insights into the distinct playing styles and strategic approaches employed by coaches and setters, potentially identifying key factors contributing to successful performance.
Footnotes
Declaration of conflicting interests
The authors declared no potential conflicts of interest with respect to the research, authorship, and/or publication of this article.
Funding
The authors received no financial support for the research, authorship, and/or publication of this article.