
Abstract
The aim of this study was to analyze the effects of resistance training (RT) based on optimum power load (OPL) and time under tension (TUT) on mechanical variables and the number of repetitions in the vertical jump performance of trained individuals. Twenty-five trained individuals participated in two sessions: one for OPL testing and another for the intervention consisting of 5 sets of 20 seconds of TUT. Data were collected on mechanical variables, number of repetitions, rating of perceived exertion (RPE), and countermovement jump (CMJ) and squat jump (SJ) tests, before and after the intervention. There was a significant decline in CMJ and SJ performance in terms of flight time, height, and absolute and relative power (p < 0.05). TUT was lower in set 5 (S5) compared to sets 1 (S1), 2 (S2), and 4 (S4) (p < 0.05). Velocity was lower in S5 compared to S1, S2, set 3 (S3), and S4 (p < 0.05). Power was higher in S1 compared to S4 and S5 (p < 0.05). Force was lower in S4 compared to S1, S2, and S3 (p < 0.05). Mechanical work was lower in S5 compared to S1, S2, S3, and S4 (p < 0.05). RPE was lower in S1 compared to S2, S3, S4, and S5 (p < 0.05). The RT protocol based on OPL and TUT led to reductions in mechanical variables across the five 20-second sets, especially from S4 onward. These reductions may have reflected a progressive accumulation of neuromuscular fatigue, as evidenced by the decline in vertical jump test performance and the increase in RPE.
Introduction
Resistance training (RT) has been widely utilized to enhance the maximal dynamic power of the lower limbs through multi-joint exercises, which are generally composed of ballistic and/or traditional movements.1,2 Furthermore, the ability to power output in the lower limbs is a determining factor for achieving maximal height in vertical jumps. Improvements in performance in this type of jump are relevant across various sports disciplines and result from the interaction between muscle strength and movement velocity. 3
In this context, strength and power training programs are generally prescribed based on a percentage of the one-repetition maximum (1RM). However, percentage-based training is time-consuming, requires multiple assessments, and may increase the risk of injury if performed improperly. Moreover, high-intensity RT may not be feasible for all populations or training phases.4,5
In addition to 1RM-based prescription, an alternative for determining the optimal load to enhance physical performance in RT is the use of the optimum power load (OPL) method. OPL can be defined as the load zone that maximizes power output in a given exercise, rather than a precise absolute load. This method is considered safe and may provide the additional advantage of inducing lower levels of neuromuscular fatigue and perceived exertion when compared with traditional RT programs.6,7
Neuromuscular fatigue is defined as the exercise-induced reduction in the ability to generate force or power output, which not only limits the maximal strength of a muscle but also decreases contraction velocity.8,9 One way to identify possible signs of fatigue is through the quantification of total mechanical work, which represents the mechanical stimulus generated throughout a training session. Mechanical work is defined as the product of the force applied by the individual multiplied by the corresponding displacement in the direction of that force. In addition, the velocity of the concentric and eccentric phases of each repetition influences the amount of total mechanical work performed.10–12
Changes in movement velocity can affect the number of repetitions performed, the duration of each repetition, the maximal load lifted, and, consequently, the time under tension (TUT) during RT.13–15 The TUT represents the duration a muscle or muscle group spends generating force during a single set. Accordingly, TUT can be manipulated through different movement velocities via cadence, which denotes the total duration of the movement across the eccentric, quasi-isometric, and concentric phases. 16
Furthermore, the TUT is a variable that has an interdependent relationship with movement velocity and can be used to assess training volume. 17 Wilk, Zajac e Tufano 18 showed in a review study that TUT can be employed for training prescription depending on the specific goal (strength, strength and hypertrophy, or hypertrophy), as a relationship between the number of repetitions and the optimal execution time was reported. However, the authors did not identify an ideal TUT for training aimed at the development of muscular power output.
Based on the potential advantages offered by load prescription using the OPL method and the limited number of studies investigating training prescription based on TUT aimed at muscular power output, the present study aimed to analyze the effects of RT based on OPL and TUT on mechanical variables and the number of repetitions in vertical jump performance in trained individuals.
Materials and methods
Type of study
This is an experimental study with pre- and post-assessment of an acute experimental protocol. 19 The study was approved by the Research Ethics Committee of the Pedro Ernesto University Hospital under number CAAE: 86666125.1.0000.5259 and adhered to the ethical aspects outlined in Resolution 466/12 and Law 14.874/2024, which govern the National System of Ethics in Research involving human subjects.
Sample size estimation and justification
The sample size (n) was calculated using G*Power software, version 3.1.9.7. 20 A repeated-measures ANOVA test was used, assuming an effect size of 0.25, statistical power of 0.80, alpha of 0.05, with five measurement time points and a correlation of 0.5 between measures. The estimated sample size was 21 participants for the protocol. However, to account for potential dropouts, the sample size was increased by 4 participants (∼20%) for the study. 21
Participants
The study was conducted with 25 trained individuals in resistance exercises from a university located in Rio de Janeiro, Brazil. The inclusion criteria were: a) male individuals aged 18 years or older; b) practitioners with at least one year of experience in RT, including the squat exercise; c) a minimum weekly training frequency of two sessions. The exclusion criteria were: a) individuals presenting any acute or chronic pathological condition that could be aggravated during the test battery or the proposed protocol; b) individuals who answered positively to at least one question on the Physical Activity Readiness Questionnaire (PAR-Q) 22 ; c) failure to attend all visits for data collection.
Data collection procedures
All data were collected over two visits. During the first visit, participants completed the Informed Consent Form (ICF) and the PAR-Q. Anthropometric variables were assessed, including total body mass (TBM), stature, and seated height, in addition to the application of the OPL test in the half-squat exercise performed on a smith machine. During the second visit, with a minimum interval of 48 h from the previous visit, the acute intervention was conducted using the half-squat exercise on the smith machine. Throughout the intervention protocol, power, mean velocity, number of repetitions, and the rating of perceived exertion (RPE) for each set were recorded. Additionally, two vertical jump tests were performed immediately before and after the intervention protocol (Figure 1).
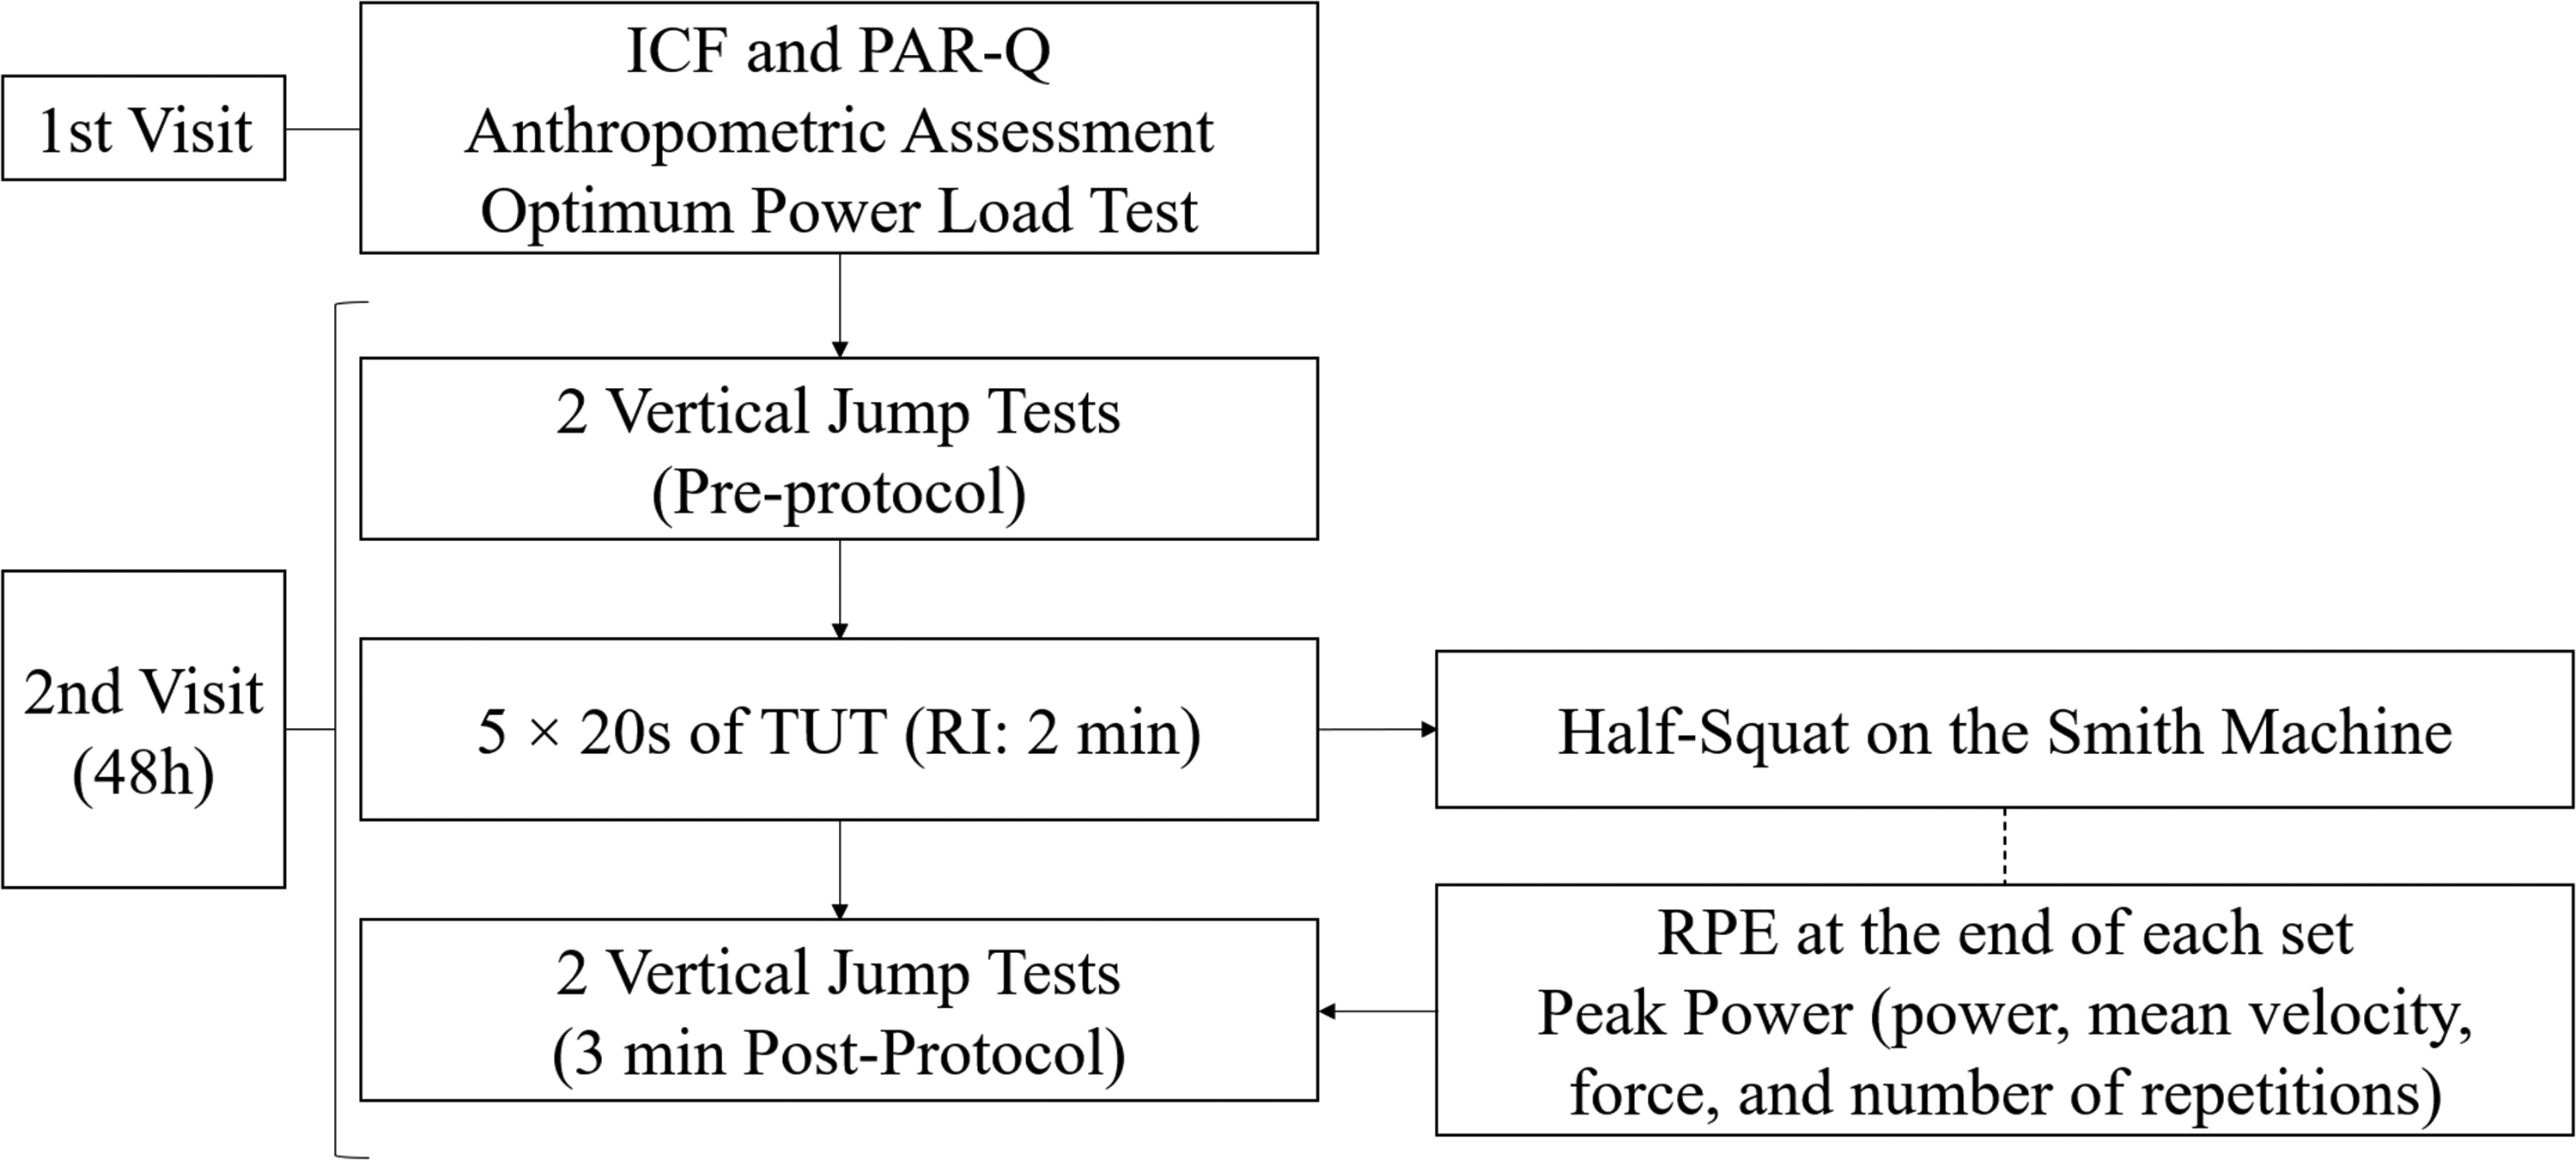
Data collection procedures.
Anthropometric assessment
The TBM (in kilograms) and stature (in meters) were measured using a digital scale (OMRON-HBFC, Omron Healthcare®, Brazil) and a portable stadiometer (SLIM FIT, Brazil) with a 0.1 cm scale, fixed to the wall without a baseboard and perpendicular to the floor. Seated height was assessed using the same portable stadiometer on a wooden box measuring 40 cm in height. Body mass index (BMI) was calculated as the ratio of body mass to the square of stature (kg/m2). All measurements were performed in accordance with the International Standards for Anthropometric Assessment (ISAK) by a single experienced evaluator, with an intraclass correlation coefficient (ICC) greater than 0.90 for all measures. 23
Optimum power load test
The OPL was determined using mean propulsive power (MPP). To assess MPP, a linear position encoder (Peak Power, Cefise, São Paulo, Brazil) was attached to the bar of a Smith machine (Mundial Fitness, São Paulo, Brazil), which has a fixed weight of 13 kg. The encoder was positioned perpendicular to the bar and calibrated with a reference amplitude of 50 millimeters, with tolerances between phases of 10 millimeters, according to the manufacturer's specifications. The highest MPP value was recorded during the concentric phase of the exercise, based on the displacement of the bar at a sampling frequency of 50 Hz and synchronized with software (Peak Power, version 4.0.6.8) installed on a notebook.6,24
MPP was measured during the half-squat exercise on a smith machine. Prior to the test, participants performed a specific warm-up consisting of one set of 15 repetitions of the proposed exercise without additional load. 15 Participants were instructed to perform 2 to 3 repetitions at maximal velocity for each load, with a 3 to 5-minute rest interval between sets. The test began with a load corresponding to 40% of the participant's body mass. An additional load of 10% of body mass was gradually added in each set until a clear decrease in MPP was observed. Participants were instructed to flex their knees until a 100° angle was reached, measured using a 360° steel goniometer (Cardiomed, Brazil), and, upon a verbal command, extend the knees, moving the bar as quickly as possible without losing contact of the shoulders with the bar or the feet with the floor. The load, including the weight of the bar (13 kg), that produced the highest MPP was considered.7,25
Description of the half-squat exercise
Prior to performing the exercise, participants were instructed on the proper standards and techniques for correctly executing the half-squat exercise on the smith machine. Participants were positioned standing, perpendicular to the fixed bar of the smith machine, with feet parallel and aligned with the shoulders and hips. They were instructed to initiate the exercise in the concentric phase, with knee flexion at a 100° angle, measured using a 360° steel goniometer (Cardiomed, Brazil), and hip flexion. The final execution of the exercise consisted of full extension of the knees and hips. To limit the movement angle, an elastic cord was attached and suspended at the ends of the smith machine to provide sensory feedback to the participants. The 100° angle was adopted to standardize exercise execution according to the OPL protocol and because it falls within the commonly used range of angles for the half-squat exercise (80° to 100°).15,26,27
Rating of perceived exertion
To monitor participants physical effort, the OMNI-RES Scale (OMNI-Resistance Exercise Scale) was used. 28 At the end of each set, participants observed pictograms representing different effort levels and indicated, on a scale from 0 to 10, the value corresponding to their perception, where 0 represented na “extremely easy” effort and 10 na “extremely hard” effort. 29
Mechanical variables and number of repetitions
Absolute and relative power, mean velocity, acceleration, force, and number of repetitions were collected during each experimental session using a linear position encoder called Peak Power (Cefise, São Paulo, Brazil). The Peak Power system operates via a wire attached to the bar of the smith machine, which electronically records displacement, converts it digitally, and transfers the data to computer software. Displacement is recorded in millimeters, and a timer records time in microseconds. The software analyzes several variables, including power, force, velocity, acceleration, fatigue index, among others. In high-velocity resistance exercises, this equipment has a reliability of 0.95, as determined using the intraclass correlation coeficiente. 30 Furthermore, total mechanical work was calculated using the equation: Mechanical Work (J) = Force (N) × Displacement (m). 11
Vertical jump test
Vertical jump height, flight time, absolute power, and relative power were assessed using the squat jump (SJ) and countermovement jump (CMJ). Participants were instructed to place their hands on their hips and keep them in contact during both the jump and landing. In the SJ, participants were asked to maintain a static position for 2-seconds with a knee flexion angle of 90° before jumping as high as possible. In CMJ, participants were instructed to perform a rapid knee flexion followed by full extension of the lower limbs. Jumps were performed on two contact mats (Jump System Duo, Cefise, São Paulo, Brazil). Three attempts were performed for each exercise, with a 30-second recovery interval between jumps and 2-minutes between exercises. The best result from each exercise was considered for analysis.5,25
Intervention protocol
The intervention protocol consisted of 5 sets of 20 seconds of TUT. Prior to the intervention, participants performed a warm-up of one set of 15 repetitions of the half-squat exercise with 50% of the load obtained in the OPL test, followed by a 3-minute rest interval. After the warm-up, participants were instructed to perform the intervention protocol at the highest possible velocity. The movement was initiated from the concentric phase (touching the elastic cord), with knee flexion at 100° and hip flexion, progressing to the eccentric phase (full extension of the knees and hips), with a 2-minute recovery interval between sets. The movement angle (range of motion) during the exercise was determined using a 360° manual steel goniometer (Cardiomed, Brazil) and limited by elastic cords attached to the smith machine structure to provide participants with sensory feedback regarding the appropriate exercise angle. Throughout the protocol, participants received verbal encouragement to maintain movement execution until the end of each set. 31 For the analysis, only the repetitions that completed a movement cycle (concentric, quasi-isometric, and eccentric) within the 20-second execution period were considered.
Statistical analysis
Sample data were presented as mean, standard deviation, and minimum and maximum values. Normality and sphericity of the data were assessed using the Shapiro–Wilk and Mauchly tests, respectively. Since these prerequisites were assumed, then to analyze comparisons between protocol sets, a one-way repeated measures ANOVA was applied, followed by the Bonferroni-adjusted post hoc test. The paired Student's t-test was used to analyze performance in the different types of jumps (CMJ and SJ) before and after the experimental protocol intervention. The effect size (ES) was calculated to analyze the clinical impact of the intervention. The partial eta squared (η2p) was used according to the following classification: η2p < 0.01 as no effect; 0.01> = η2p < 0.06 as a small effect, 0.06> = η2p < 0.14 as a moderate effect and η2p> = 0.14 as a large effect. 32 Power of experiment was calculated to detect a true statistical effect in the study. The level of significance was set at p < 0.05. Data analysis was performed using IBM SPSS Statistics 27 software.
Results
The characterization of the sample, composed of 25 participants, with mean, standard deviation, minimum, and maximum values for each variable, is presented in Table 1. Data were collected regarding age, TBM, stature, seated height, total load in the half-squat exercise (including the 13 kg bar), and relative load (%) in relation to TBM.
Sample characteristics (n = 25).
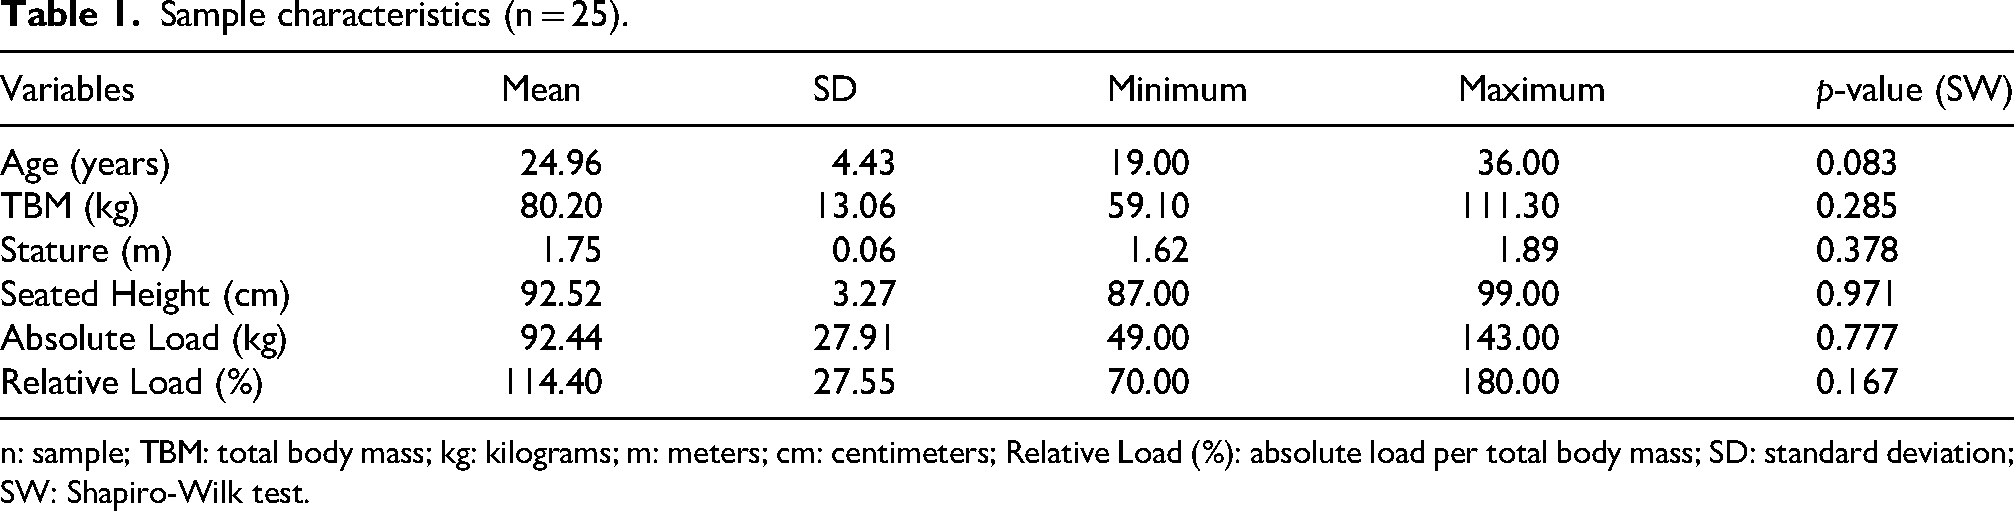
n: sample; TBM: total body mass; kg: kilograms; m: meters; cm: centimeters; Relative Load (%): absolute load per total body mass; SD: standard deviation; SW: Shapiro-Wilk test.
Analysis of variance (ANOVA) revealed an effect across the five sets in the half-squat exercise on the variables TUT (F = 7.156; p < 0.001; η2p = 0.230; Power = 97%), velocity (F = 10.603; p < 0.001; η2p = 0.306; Power = 99%), absolute power (F = 7.737; p = 0.001; η2p = 0.244; Power = 96%), relative power (F = 6.785; p = 0.002; η2p = 0.220; Power = 91%), force (F = 9.902; p = 0.004; η2p = 0.275; Power = 87%), total mechanical work (F = 12.412; p < 0.001; η2p = 0.341; Power = 98%), and RPE (F = 59.510; p < 0.001; η2p = 0.713; Power = 99%). Conversely, no significant effects were observed for the variables number of repetitions (F = 1.996; p = 0.148; η2p = 0.077; Power = 39%) and acceleration (F = 1.008; p = 0.364; η2p = 0.040; Power = 20%).
Figures 2 and 3 present the results of multiple comparisons between exercise sets using the Bonferroni-adjusted post hoc test. TUT was lower in set 5 (S5) compared to sets 1 (S1), 2 (S2), and 4 (S4) (p = 0.001; p = 0.004; p = 0.044), but no difference was observed with set 3 (S3). Velocity was lower in S5 compared to S1, S2, S3, and S4 (p < 0.001; p = 0.005; p = 0.016; p = 0.048). Absolute power was higher in S1 compared to S4 and S5 (p = 0.035; p = 0.013), with no differences observed for S2 and S3. Relative power was higher only in S1 compared to S5 (p = 0.031), with no significant differences between S2, S3, and S4. Furthermore, no significant changes were observed between sets for the number of repetitions (Figure 1).
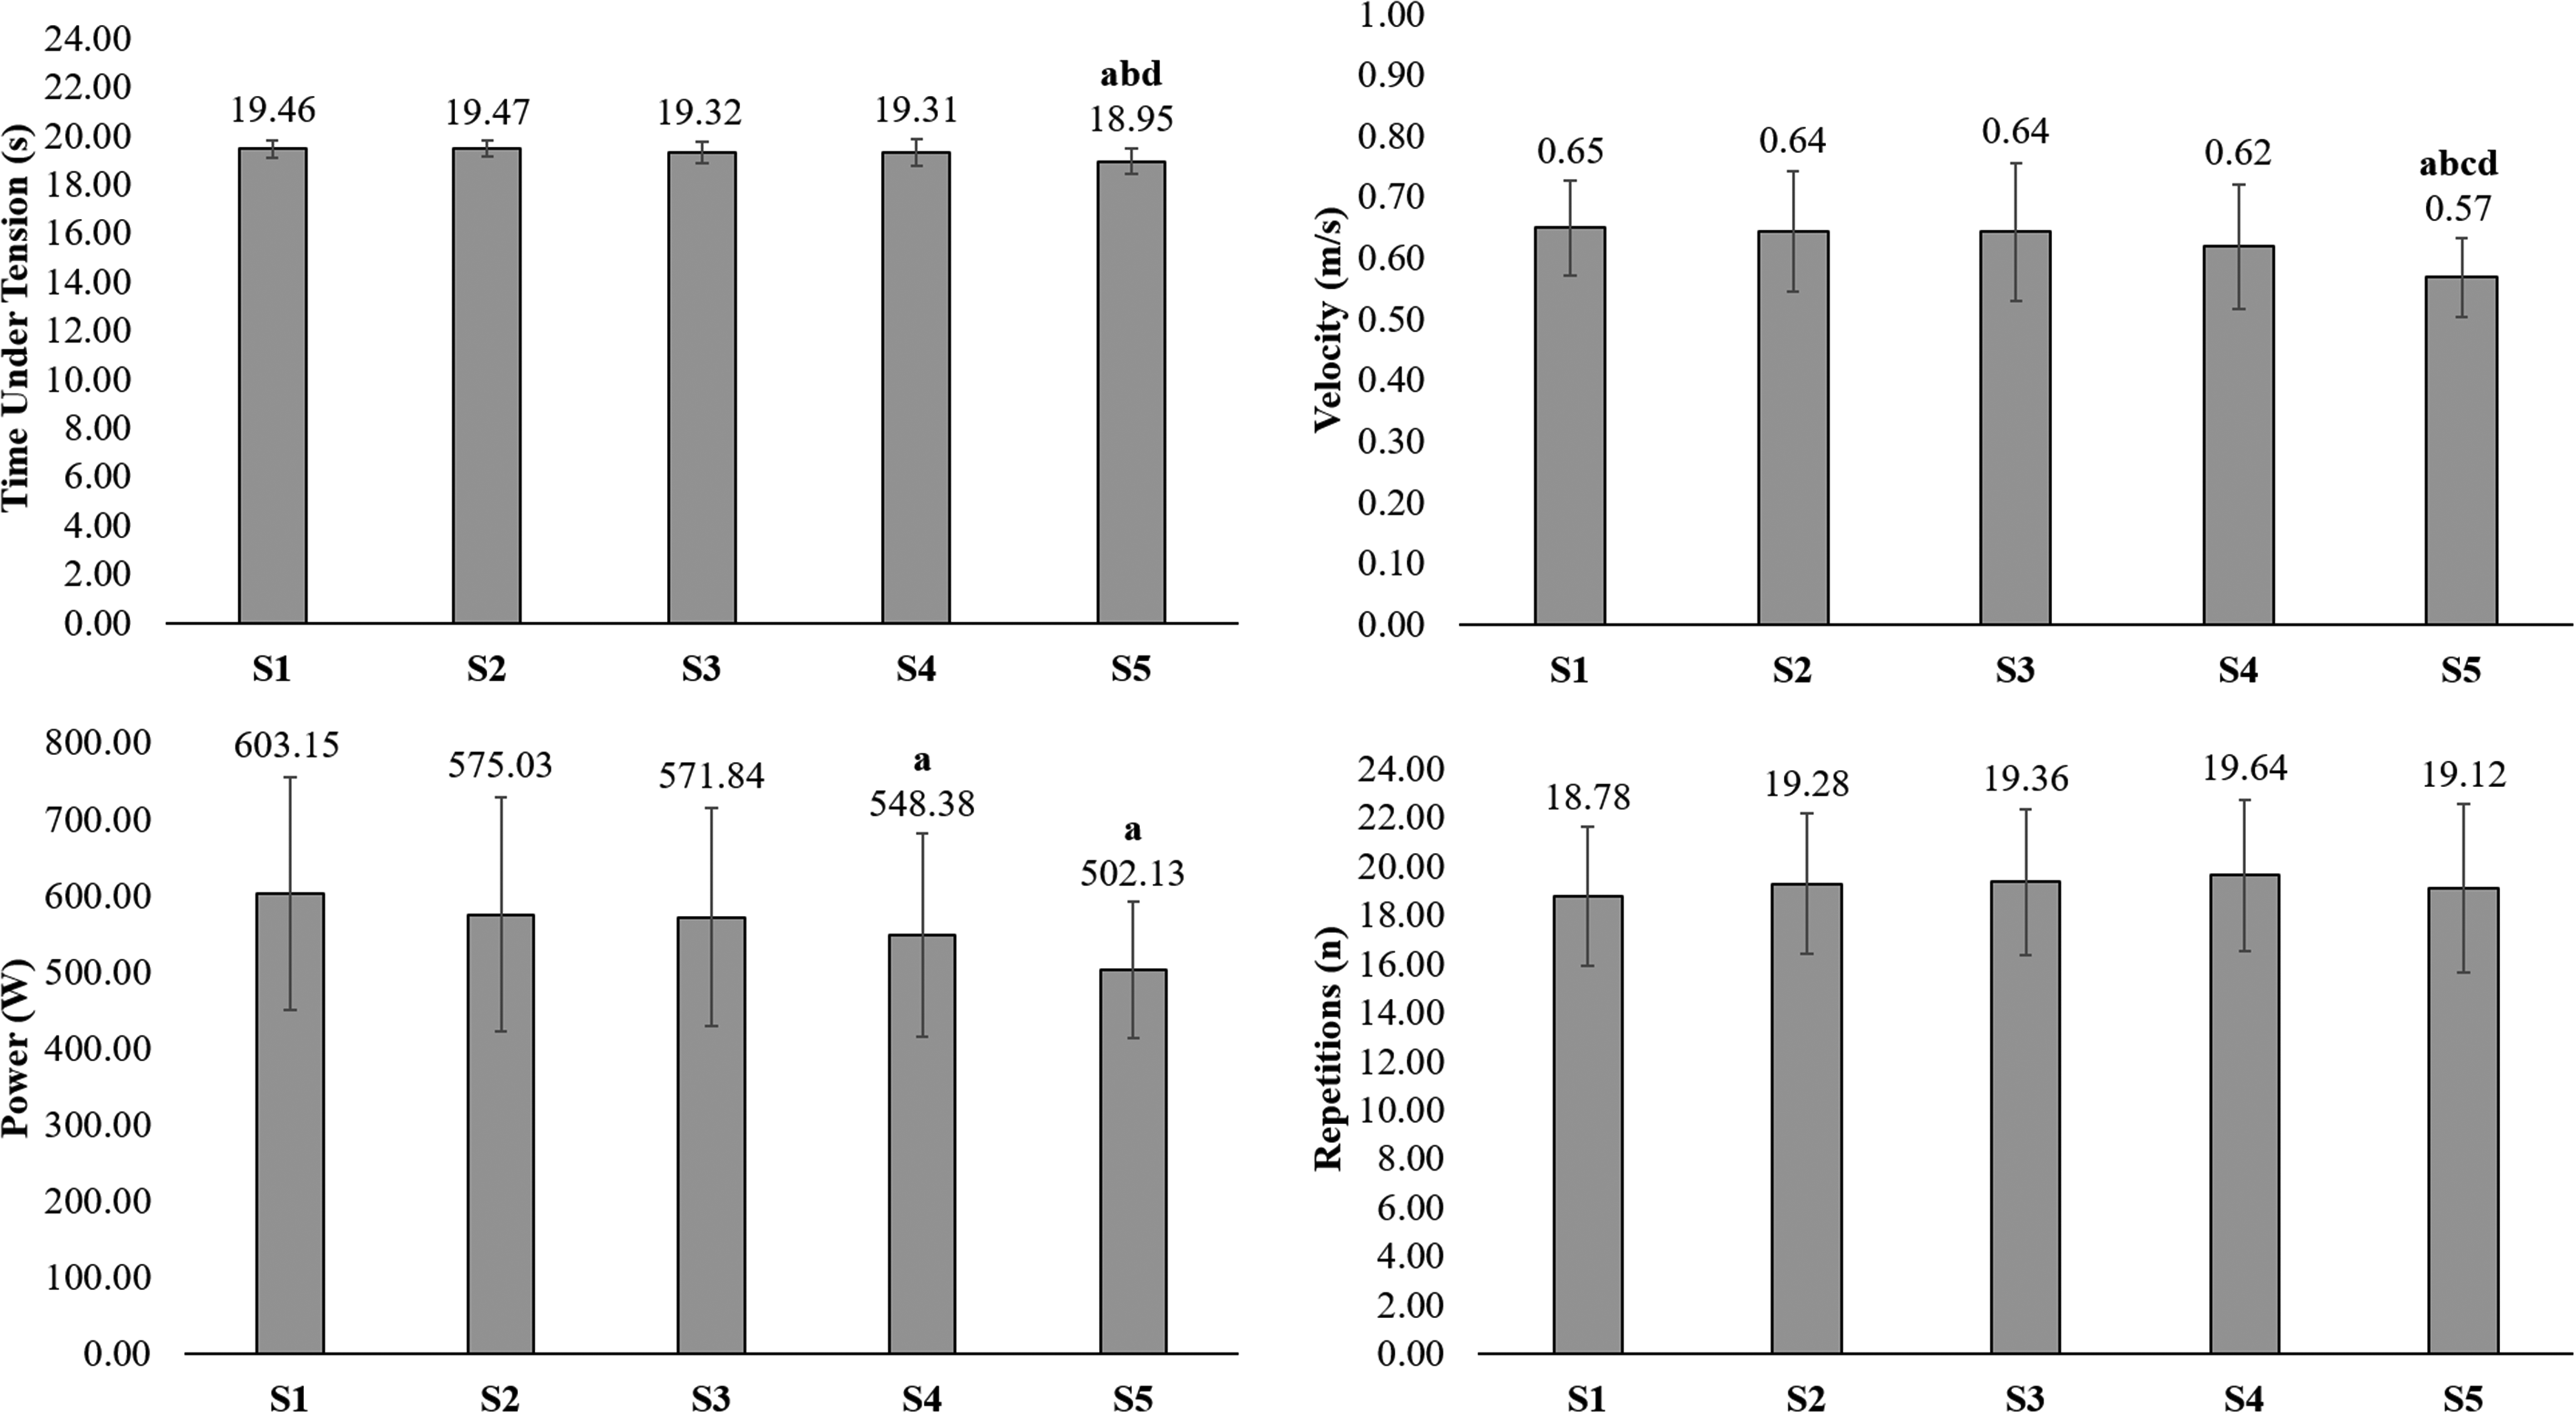
Results of TUT, velocity, power, and number of repetitions.
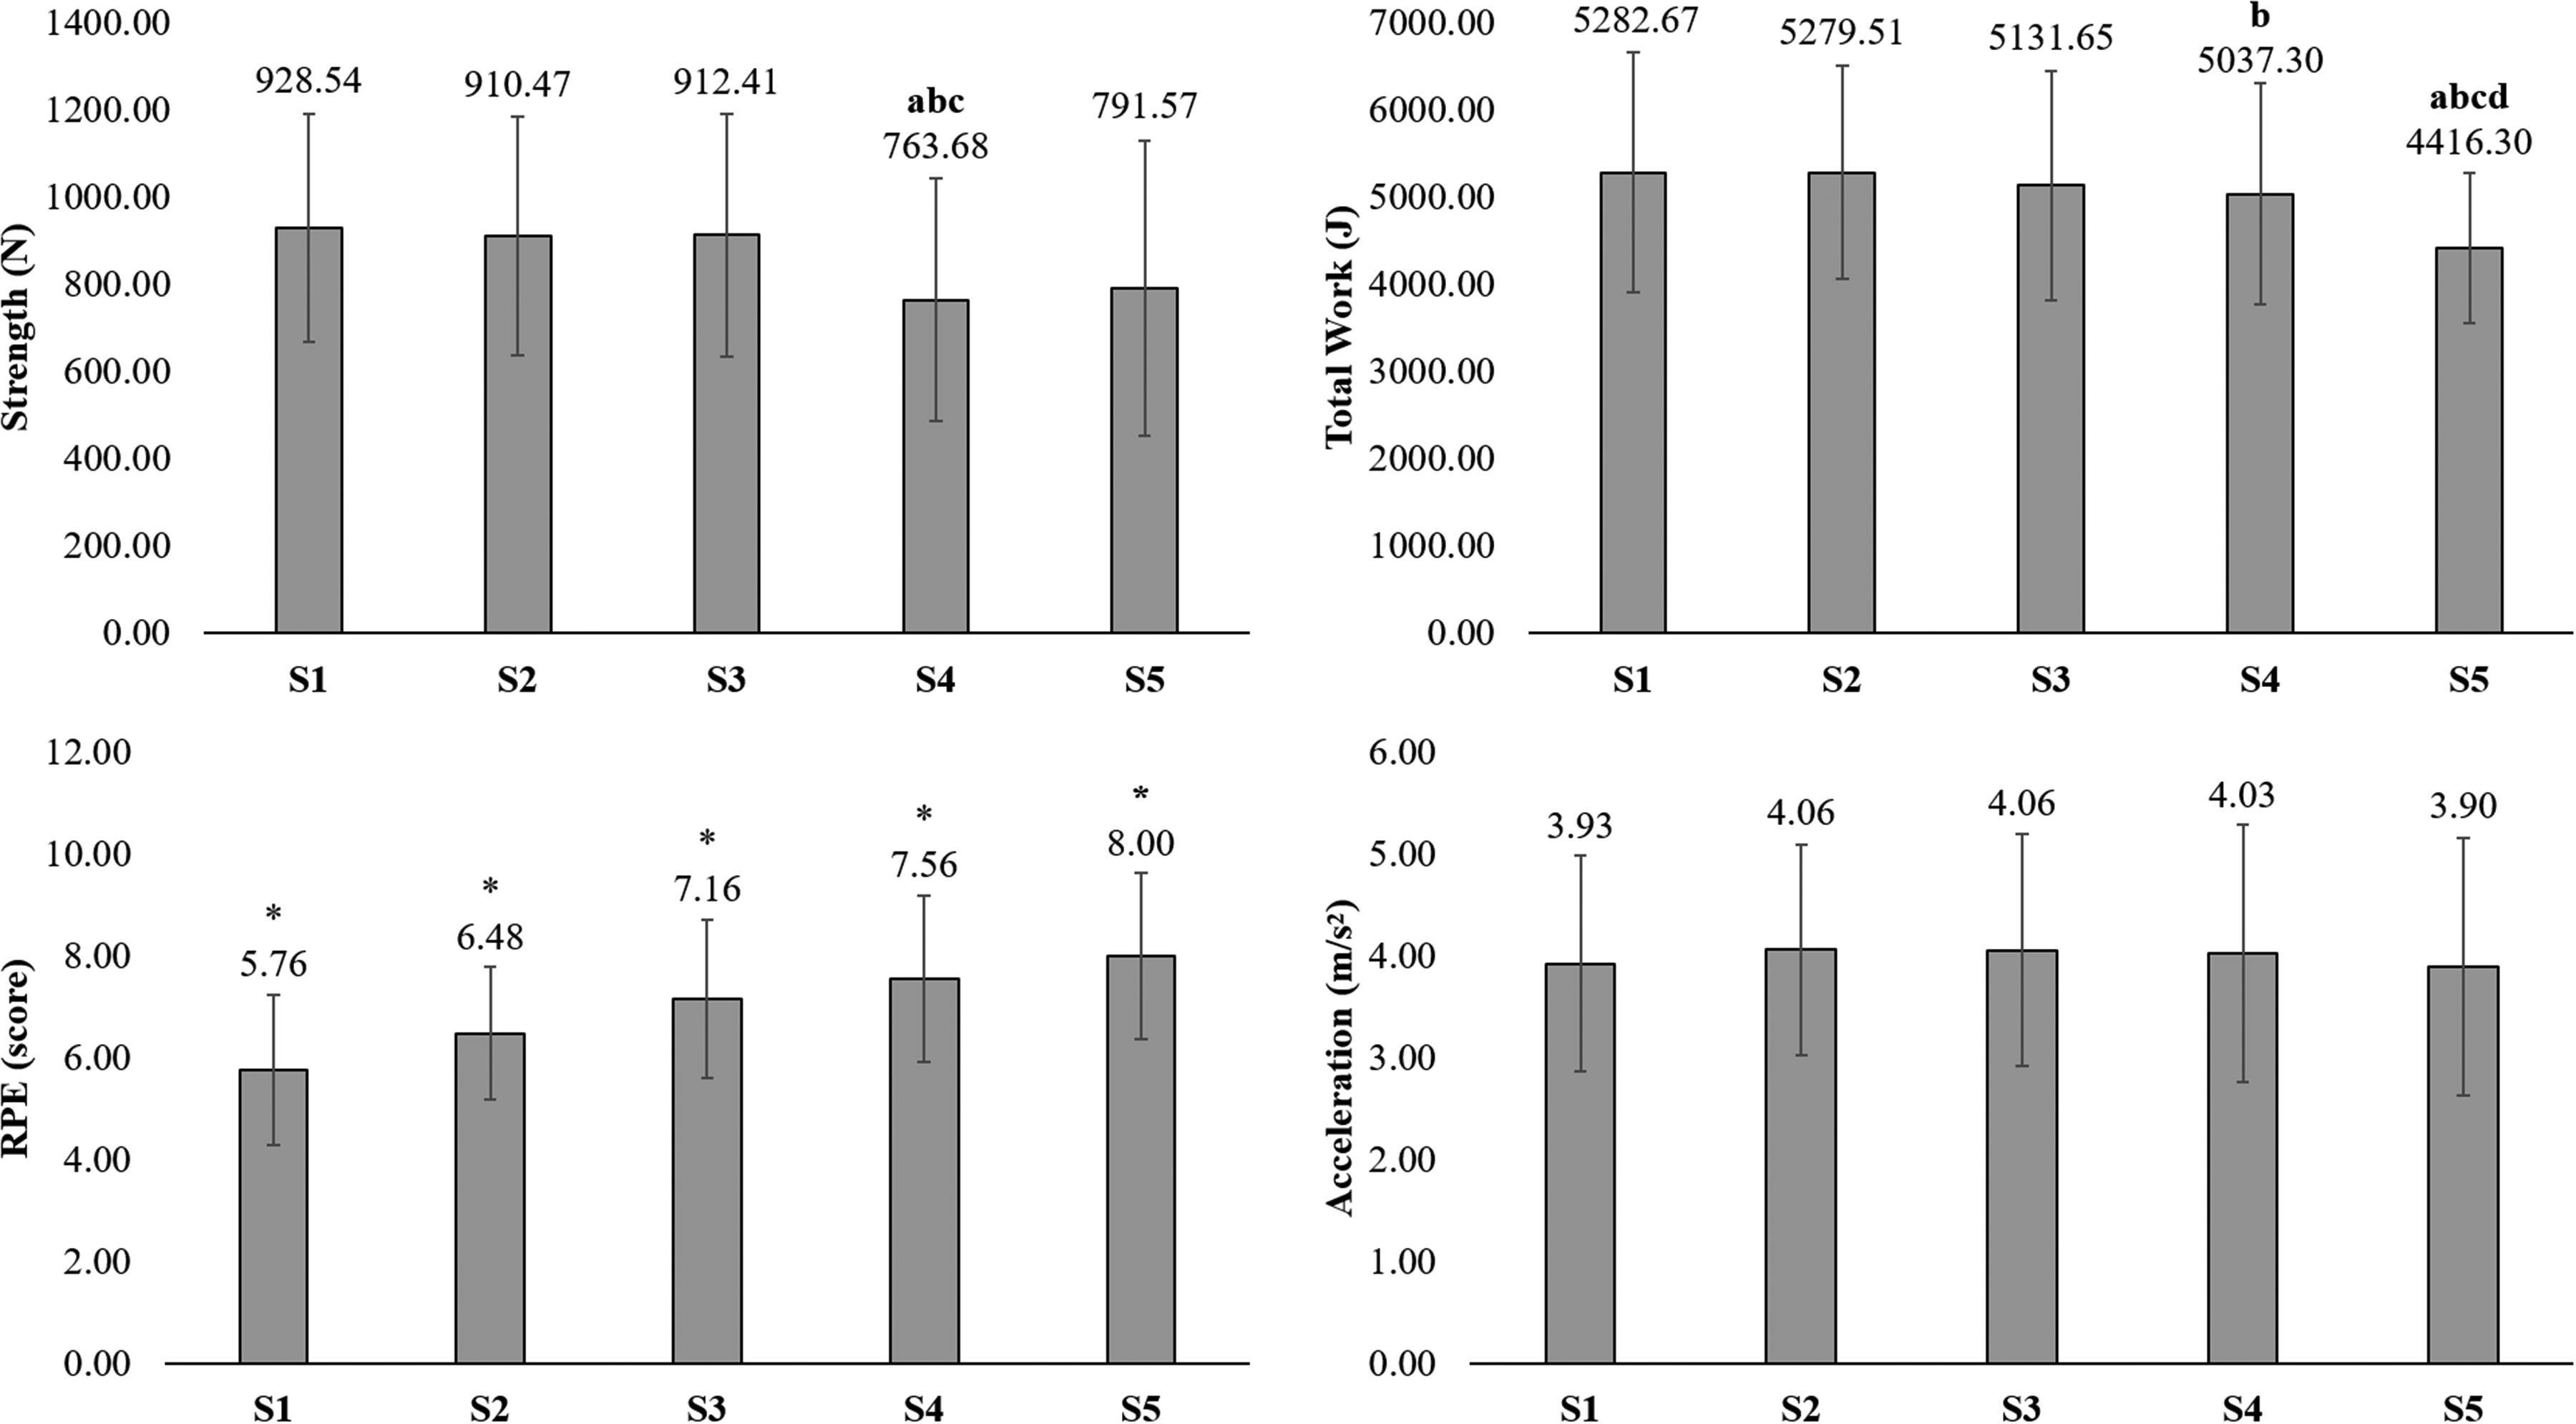
Results of mean force, total work, RPE, and acceleration.
Mean force was lower in S4 compared to S1, S2, and S3 (p = 0.029; p = 0.030; p = 0.030), but no difference was observed with S5. Total mechanical work was lower in S5 compared to S1, S2, S3, and S4 (p = 0.009; p = 0.001; p = 0.014; p = 0.036), and lower in S4 compared to S2 (p = 0.011), with no significant differences observed in S1 and S3. RPE was lower in S1 compared to S2, S3, S4, and S5 (p < 0.001; p < 0.001; p < 0.001; p < 0.001). Furthermore, no significant changes were observed between sets for acceleration (Figure 3).
Table 2 presents the results of vertical jump performance obtained before and after the training protocol intervention. A decrease (p < 0.05) was observed in all variables analyzed for both the CMJ and the SJ after the intervention protocol. In the CMJ, flight time, jump height, absolute power, and relative power decreased (p < 0.05) from pre- to post-test. Similar results were observed in the SJ, with reductions (p < 0.05) in flight time, jump height, absolute power, and relative power.
Results of the comparison of vertical jumps.
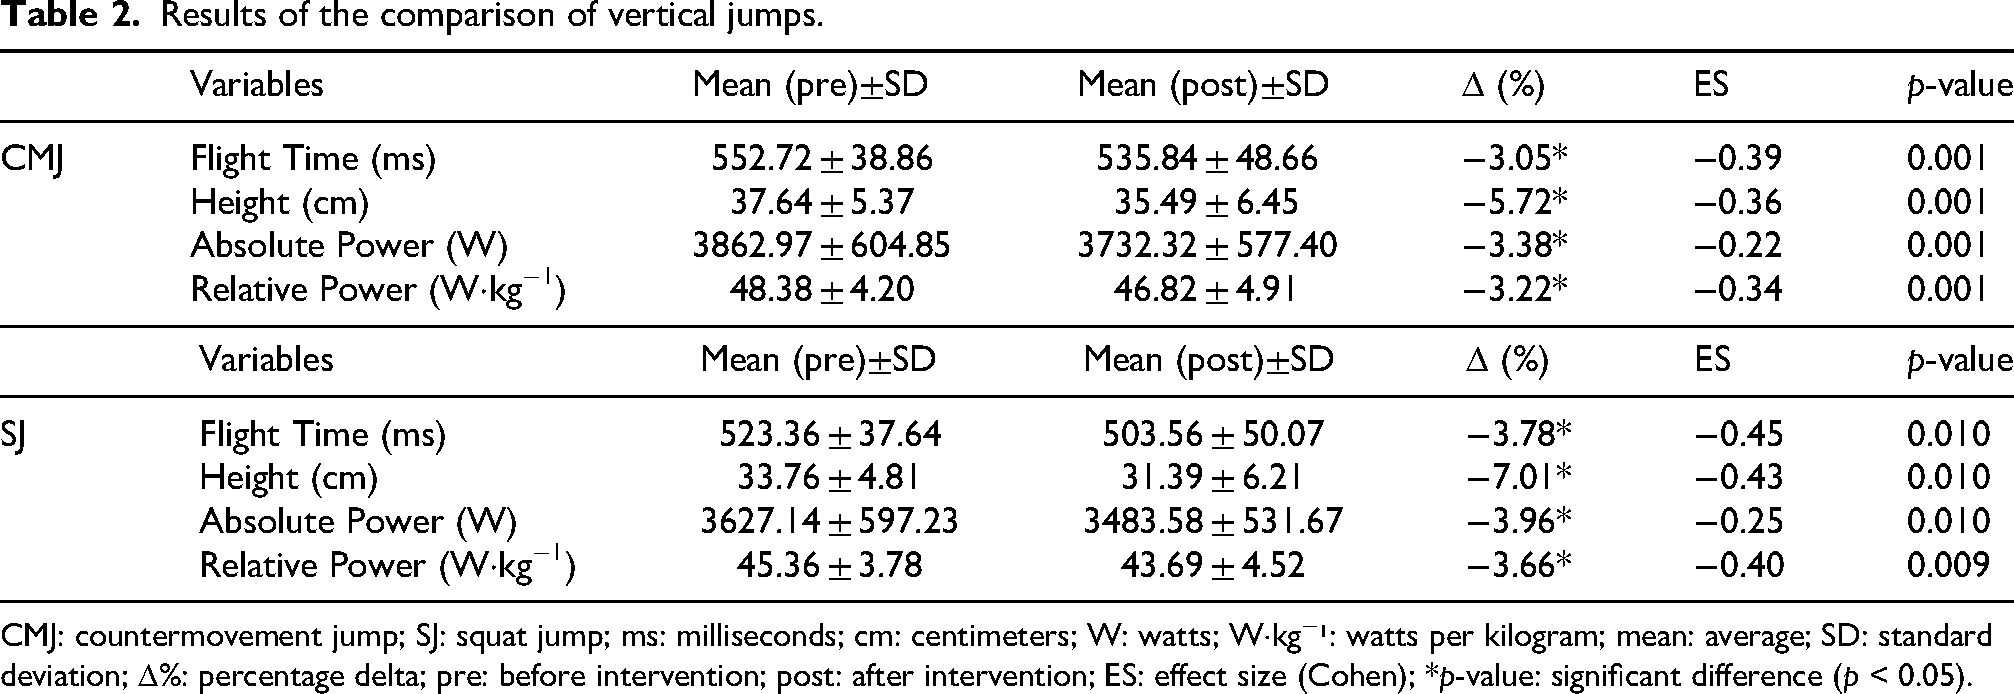
CMJ: countermovement jump; SJ: squat jump; ms: milliseconds; cm: centimeters; W: watts; W·kg−¹: watts per kilogram; mean: average; SD: standard deviation; Δ%: percentage delta; pre: before intervention; post: after intervention; ES: effect size (Cohen); *p-value: significant difference (p < 0.05).
Discussion
The aim of the present study was to analyze the effects of resistance training (RT) based on the optimum power load (OPL) and time under tension (TUT) on mechanical variables and the number of repetitions in vertical jump performance of trained individuals. The main finding was a significant reduction in vertical jump performance after the OPL and TUT based RT intervention, possibly attributed to the accumulation of neuromuscular fatigue, which compromises the musculoskeletal system's ability to generate force rapidly. This finding is supported by Hughes et al. 33 who emphasize that vertical jump tests are widely used to monitor fatigue.
Another study supporting the decline in vertical jump performance is that of Van Hooren and Zolotarjova, 34 who identified biomechanical and neuromuscular differences between the countermovement jump (CMJ) and the squat jump (SJ) as decisive factors for their distinct responses to neuromuscular fatigue. The authors pointed out that the reduction in CMJ height reflects impairments in the stretch-shortening cycle (SSC) mechanisms, such as reflex activation and elastic energy storage, both of which are essential for force output in explosive actions. In the SJ, the performance decline results from the absence of the SSC, making the movement more dependent on pure concentric force and therefore more susceptible to neuromuscular fatigue.
Furthermore, it is hypothesized that the decline in vertical jump performance observed in the present study is related to the acute nature of the intervention, whose immediate effects do not necessarily reflect the exercise's adaptive potential when applied chronically. Loturco et al. 35 evaluated the effects of the half-squat and jump squat in elite soccer players over a four week intervention. The results showed that, between pre- and post-intervention measurements, the group performing the half-squat exhibited a non significant reduction in CMJ performance, but a significant increase in SJ height. In contrast, no significant improvements in CMJ or SJ were observed in the group performing the jump squat.
Arsenis et al. 36 analyzed the effects of free weight training and flywheel training in half-squat with OPL over an eight-week intervention and found no significant improvements in CMJ and SJ performance between pre- and post-intervention measurements. Similarly, Hoyo et al. 37 investigated the effects of traditional RT performed in the half-squat and horizontal flywheel training performed with a forward lunge, both protocols using OPL, after six weeks of intervention, and observed that only the group performing traditional RT showed a significant increase in CMJ height compared to the group using horizontal flywheel. Moreover, Meireles et al. 38 showed, in a systematic review and meta-analysis of chronic effect studies (longitudinal), that RT with OPL in the half-squat exercise showed a significant effect size in trained individuals, both in the CMJ and SJ.
The results regarding the number of repetitions indicated that performance remained stable across sets, with no significant differences between them. Participants were able to perform an average of 19 valid repetitions during the 20-second execution period. A possible explanation for this consistency may be related to the influence of motivation during the intervention. Weakley et al. 39 report that the regular provision of visual or verbal feedback can enhance training performance, promoting gains in strength, velocity, power, volume, and the number of completed repetitions. These findings are favorable, especially when compared to the guidelines of the American College of Sports Medicine,2,40 which recommend performing 3 to 6 repetitions with loads between 0 and 60% of one-repetition maximum (1RM) for lower-limb power development. However, Lamas et al. 41 suggest performing up to 12 repetitions using loads corresponding to 60% of 1RM.
Regarding mean velocity across sets, the results indicated a progressive decrease, with set 5 (S5) showing a significant reduction compared to sets 1 (S1), 2 (S2), 3 (S3), and 4 (S4). This reduction may be explained by the accumulation of muscular fatigue, which compromises the neuromuscular system's ability to generate force, affecting coordination and movement efficiency, ultimately resulting in slower movements. 9 Concurrently, TUT showed a reduction in the later sets, particularly in S5 compared to S1, S2, and S4, indicating a significant decrease. Although a decrease in velocity was observed in the last set (S5), Silva et al. 16 reported that variations in movement velocity can influence reductions in TUT. A possible explanation for this TUT reduction associated with decreased velocity is that only valid repetitions performed within the 20-second protocol were considered for analysis, which may have impacted TUT. Another hypothesis is that, although the present study did not present data on TUT per repetition, some repetitions may have been performed at a higher speed during the 20-seconds.
Regarding absolute power, the S1 showed higher values than S4 and S5, indicating a significant decline in absolute power from S4 onward. On the other hand, relative power in S1 was higher only than in S5, showed a reduction in relative power in the last set. These findings suggest that participants were able to maintain muscular power output up to S4. However, Banyard et al. 42 demonstrated that high levels of fatigue and loss of velocity influence the reduction of muscular force and power output. Halson 43 reports that fatigue is a multifaceted phenomenon influenced by factors such as the type of stimulus, type of muscle contraction, duration, frequency, exercise intensity, and the type of muscle involved. Therefore, since power is directly influenced by execution velocity, the reduction in velocity significantly contributes to the decrease in the capacity to generate power output.
Regarding acceleration, the results did not show significant differences between sets. This stability suggests that, despite the accumulation of fatigue observed in other mechanical variables such as velocity and power, acceleration was maintained throughout the sets. A possible explanation for this behavior is that, although average values of power and velocity decreased, mean acceleration remained stable, possibly due to the preservation of the ability to generate force rapidly at the beginning of the movement, known as the rate of force development (RFD). 44 Furthermore, another hypothesis is that this result may have occurred due to technical compensations in movement execution by the participants and/or the averaging out of momentary variations in acceleration over time.
For mean force, a decrease was observed across sets, particularly in S4, which was significantly lower compared to S1, S2, and S3. However, no significant difference was found between S4 and S5. These results indicate that force values begin to decline from S4 onward. These findings are supported by Shi et al., 45 who observed that in multi-joint exercises such as the squat, muscular force output disproportionately decreases during the initial phase of the concentric movement due to mechanical disadvantages at specific joint angles, which may lead to a deceleration of the upward movement. Furthermore, another possible explanation for the reduction in force is the accumulation of neuromuscular fatigue across sets.
The reduction in total mechanical work, which reflects the energy expended during exercise, was greater in S5. Although participants maintained the number of repetitions, the energy applied in each repetition may have progressively decreased. S5 showed a significant decrease in mechanical work compared to S1, S2, S3, and S4. Additionally, S4 also exhibited lower total mechanical work compared to S2. These findings suggest that the muscular system may not have been able to sustain the same intensity of effort across sets, compromising the amount of work performed. It is also observed that from S4 onward, a significant decline in mechanical work began, which can be explained by McBride et al., 12 who report that changes in contraction velocity can significantly affect total mechanical work.
Furthermore, the rating of perceived exertion (RPE) progressively increased across sets, with differences observed in all multiple comparisons. This increase can be interpreted as a direct reflection of the growing fatigue and perceived effort by the participants. Although total volume was maintained, the sense of effort became more intense, suggesting greater discomfort and difficulty in continuing the protocol. The increase in RPE can be considered a sensitive indicator of accumulated fatigue, affecting both motivation and the ability to sustain performance effectively. RPE increased (p < 0.05) from S2, reflecting the highest perceived effort in S5, rated on the scale as “extremely hard.” The study conducted by Bourdon et al. 46 showed that perceived exertion is widely used to assess internal load in sports contexts due to its ease of application, low cost, and scientific validity.
The present study had some limitations. The main limitation was the exclusive use of the half-squat exercise, which prevented the comparison of the training protocol effects on other exercises. Additionally, as this was an analysis of acute effects, longitudinal analyses could not be established. Another limitation of the study concerns the sample, composed of individuals with prior experience in RT, which limits the generalization of the results to other populations, such as high-performance athletes from different categories and training levels, or sedentary individuals. Therefore, caution is needed when extrapolating the findings to broader groups or those with different training contexts.
Conclusion
The present study demonstrated that the RT protocol based on the OPL and TUT led to reductions in mechanical variables over the five 20-second sets, particularly from S4 onward. These reductions may reflect a progressive accumulation of fatigue, as evidenced by the decline in vertical jump performance and the increase in RPE. Furthermore, the average execution of 19 valid repetitions per set may provide a relevant parameter for prescribing training aimed at developing muscular power output using OPL in the half-squat exercise.
It is recommended that future studies investigate other traditional or ballistic exercises for both lower and upper limbs, combined with different TUT protocols and the analysis of biochemical markers such as creatine kinase (CK), lactate dehydrogenase (LDH), and salivary cortisol, in order to assess the physiological response to training across different populations and in a longitudinal manner.
Footnotes
ORCID iDs
Ethical considerations
The study was approved by the Research Ethics Committee of the Pedro Ernesto University Hospital (CAAE: 86666125.1.0000.5259) on April 30, 2025. All participants provided written informed consent prior to enrolment in the study. This research was conducted ethically in accordance with the World Medical Association Declaration of Helsinki.
Consent to participate
Written informed consent to participate in this study was provided to the participants.
Consent for publication
Not applicable.
Funding
The authors received no financial support for the research, authorship, and/or publication of this article.
Declaration of conflicting interests
The authors declared no potential conflicts of interest with respect to the research, authorship, and/or publication of this article.
Data availability
The data of this study are available from the corresponding author upon reasonable request.