
Abstract
The relationship between rebound jump (RJ) performance and lower limb joint mechanics differs depending on task demands, such as pre-planned change of direction (COD) versus unanticipated agility. However, longitudinal associations with agility remain unclear. This study examined improvements in the RJ performance and their relationship with reactive agility performance, focusing on joint mechanics during takeoff. Twenty-five female soccer players completed sprint, RJ, COD, and reactive agility tests during the pre- and mid-seasons. Based on changes in reactive agility time, participants were classified into improved (n = 17) and non-improved (n = 8) groups. Performance variables and RJ takeoff mechanics were analyzed using 3D motion analysis and force plate. Linear mixed models and empirical best linear unbiased predictors were used to assess group effects and individual variability. Paired t-tests were used to evaluate within-group changes. The COD time and RJ-index (jump height/contact time) improved significantly, along with increased ankle negative power and knee eccentric torque. No changes were observed during sprint time and reactive agility time. However, the improved group showed improvements in reactive agility time, RJ performance, and joint mechanics, whereas the non-improved group showed only limited changes. Individual analysis revealed that those with a high baseline RJ-index improved further via increased hip joint output, whereas those with low initial values improved RJ-index, but not reactive agility performance. These findings support plyometric strategies that consider joint-specific eccentric requirements and initial performance characteristics.
Keywords
Introduction
Sprinting, change of direction (COD), and jumping motions are executed through lower limb stretch-shortening cycle (SSC) movements. 1 Therefore, enhancing the lower limbs’ ability to generate power in SSC improves sprinting and COD performance. Lower limb SSC function can be assessed using the rebound jump (RJ) index,2–8 which is calculated by dividing jump height by the contact time during the RJ. Recent studies suggest that, in addition to quantitative assessments of RJ performance variables, examining the kinematic and kinetic characteristics of the hip, knee, and ankle joints during RJ takeoff enables a more detailed evaluation of lower limb SSC power production.8,9 Therefore, a comprehensive evaluation of the RJ-index and joint mechanics may help facilitate improvements in sprint and COD performance.
Previous studies have reported a correlation between the RJ-index and sprint or COD times.4,6,10–14 Both male and female athletes with faster sprint and COD times tended to have a higher RJ-index.15,16 In addition, female athletes exhibit greater ankle joint power and higher eccentric knee torque during RJ takeoff. 16 Moreover, cutting time has been shown to be associated with peak ankle power and peak plantar flexor moment during a cutting maneuver. 17 Therefore, these findings suggest that the ankle joint's contribution to force and power production plays an important role not only in RJ performance but also in COD ability. However, in sprinting tasks, previous study 18 demonstrated that sprint performance becomes increasingly dependent on joint-specific kinetics as training progresses. This finding suggests that sprint performance may increasingly depend on joint-specific kinetic characteristics rather than overall RJ performance measures such as the RJ-index or jump height. Although no direct relationship has been observed between RJ and sprint performance, mechanical similarities in ankle and knee joint kinetics have been reported. 19 Furthermore, agility movements, which involve decision-making and sudden deceleration, differ from COD tasks in terms of direction and timing. 20 Previous studies have reported a weak association between agility and COD performance.13,14,21 However, while both COD and reactive agility time were associated with the RJ-index and jump height, contact time correlated significantly only with reactive agility time. 22 These findings suggest that reactive agility tasks require SSC force production with shorter contact times, in which the eccentric torque in the lower limbs plays a crucial role. 22 Therefore, it is essential to optimize lower limb SSC mechanics to improve sprint and agility performance. Assessment of lower limb SSC functions should cover not only the RJ-index but also the kinematic and kinetic characteristics of the hip, knee, and ankle joints during RJ takeoff.
Although the relationships between performance variables within the same timeframe or across different athlete groups have been examined in previous studies, longitudinal changes in reactive agility following improvements in the RJ-index and the associated joint mechanics within individuals remain largely underexplored. Cross-sectional studies have shown that the ankle joint produces the greatest torque and power during takeoff in RJ and drop jumps, with its positive power output identified as a key determinant of the RJ-index.8,23–25 A longitudinal study incorporating plyometric training demonstrated that an increased RJ-index was associated with greater total power at the ankle and knee joints. 26 In addition, another study reported that adaptation patterns vary depending on initial RJ-index values, which in turn influence subsequent performance variables and joint kinetics. 27 Investigating the relationships among improvements in the RJ-index, agility performance, and joint-specific kinetic adaptations offers practical insights for integrating the ability to exert power in the SSC of the lower limbs into training. This approach enables a more precise assessment of performance improvements by considering both overall performance variables and joint mechanics, thereby guiding individualized plyometric programs tailored to each athlete's joint-specific adaptations.
This study investigated how improvements in RJ performance influence reactive agility performance, particularly through kinematic and kinetic changes in lower limb joints during RJ takeoff. We hypothesized that improvements in the RJ-index would lead to reactive agility gains, with individual variability explained by joint mechanics during RJ takeoff, especially those contributing to sprint and reactive agility performance.
Materials and methods
Participants
This study enrolled 25 female university soccer athletes (first measurement: age = 20.2 ± 0.9 years, height = 161.9 ± 4.8 cm, body mass = 59.08 ± 5.7 kg; second measurement: age = 20.8 ± 1.1 years, height = 161.9 ± 4.8 cm, body mass = 59.07 ± 5.1 kg). Based on changes in reactive agility time between the first and second measurements, the participants were retrospectively classified into two groups: an improved group (n = 17) and a non-improved group (n = 8). The specific criteria used for group classification are described in the statistical analysis section. All participants were members of a university sports club and trained with their teams approximately five days per week. The weekly training program consisted of three main components: regular field-based training (4 days per week), strength training (2 days per week; once following a regular training session and once following a game-based session), and game or game-based training (1 day per week). Regular training sessions included a warm-up segment (jogging, stretching, and mobility exercises), sprint and agility training, and ball-training sessions that also incorporated small-sided or full-game activities. The strength-training sessions comprised resistance exercises for both the upper and lower body, as well as plyometric exercises. Game or game-based training was conducted in a match-play format, typically performed in 20–45-min halves. Under the supervision of their coaches, the initial portion of each training session typically included sprint drills and running-based exercises incorporating sprinting, COD, and agility tasks, as well as plyometric movements. In addition, participants engaged in strength training sessions one to two times per week throughout the study period. The participants did not engage in any strenuous exercise the day before the measurements. They did not experience lower limb injuries that could have affected their ability to perform RJs. This study was approved by the Ethics Committee of the Faculty of Health and Sports Sciences, University of Tsukuba (approval no. tai 30–142), and all procedures conformed to the principles of the Declaration of Helsinki. After receiving an explanation of the benefits and risks of the investigation, the participants provided written informed consent in compliance with institutional guidelines.
Experimental protocol
The first and second measurements were performed during the same competitive season. The first measurement was conducted before the start of official matches. The second measurement was conducted during the competitive season at the time when each participant recorded her highest RJ-index in the team's routine monitoring sessions. This timing was selected to ensure that the second measurement reflected each participants peak RJ performance within the season. All participants were instructed to refrain from resistance training one day before the experiment. Before testing, the participants performed 15 minutes of low-intensity exercise, including dynamic stretching. Before the experiment, the participants practiced to ensure they could perform the trials correctly, following the instructions of an author familiar with the experimental protocol. All field-based tests (sprint test, COD and reactive agility tests) were performed on an artificial turf (3G) soccer pitch. All participants wore football boots during the measurements.
Sprint test
During the sprint test, participants adopted a standing start posture with their toes at the starting line (0.5 m behind the first timing cell). After receiving a signal from the measurer, they sprinted at their own discretion with maximum effort.. Timing cells measuring 1 m in height (TC Timing System, Brower Timing System, Inc., Draper, Utah, USA) were placed at 0 and 30 m to record sprint times, and split times at 5, 10, and 20 m were also recorded. Participants performed two maximal sprint trials to ensure reliable measurement while minimizing fatigue, and the fastest valid 20 m and 30 m times were used for analysis. Trials in which timing failed due to falls, slips, or other clear signs of error were considered invalid.
COD and reactive agility test
The COD and reactive agility tests used in this study were based on previous studies.21,27 The COD test was performed without a light stimulus, whereas the reactive agility test was conducted with a light stimulus to indicate the direction movement.
Participants began each trial from a standing position at an arbitrary time after receiving a verbal signal from the measurer and were instructed to reach the goal as quickly as possible, stepping on or over the 8 m line when changing direction. For both tests, participants accelerated for 5 m before reaching the timing gate, executed a 135° change of direction at the 8 m line, and then sprinted to the 13 m finish line, following the configuration reported by Kawahara et al. (2021) 28 and Yoshida et al. (2025). 22 A diagram of the test layout is provided in Figure 1. In the reactive agility test, participants passed through a timing gate (WITTY-SEM, Microgate, Bolzano, Italy) at a distance of 5 m, after which a light stimulus indicated the direction for the 135° turn.22,28 The COD test consisted of two trials in each direction, whereas the reactive agility test consisted of five trials to minimize predictive response bias. The fastest valid COD and reactive agility times, regardless of movement direction, were used for analysis. The order of the trials in each test was random. Trials were excluded if participants failed to cross the line, moved in the wrong direction, fell or slipped, or if timing could not be recorded due to photoelectric measurement error. Any invalid trial was repeated.
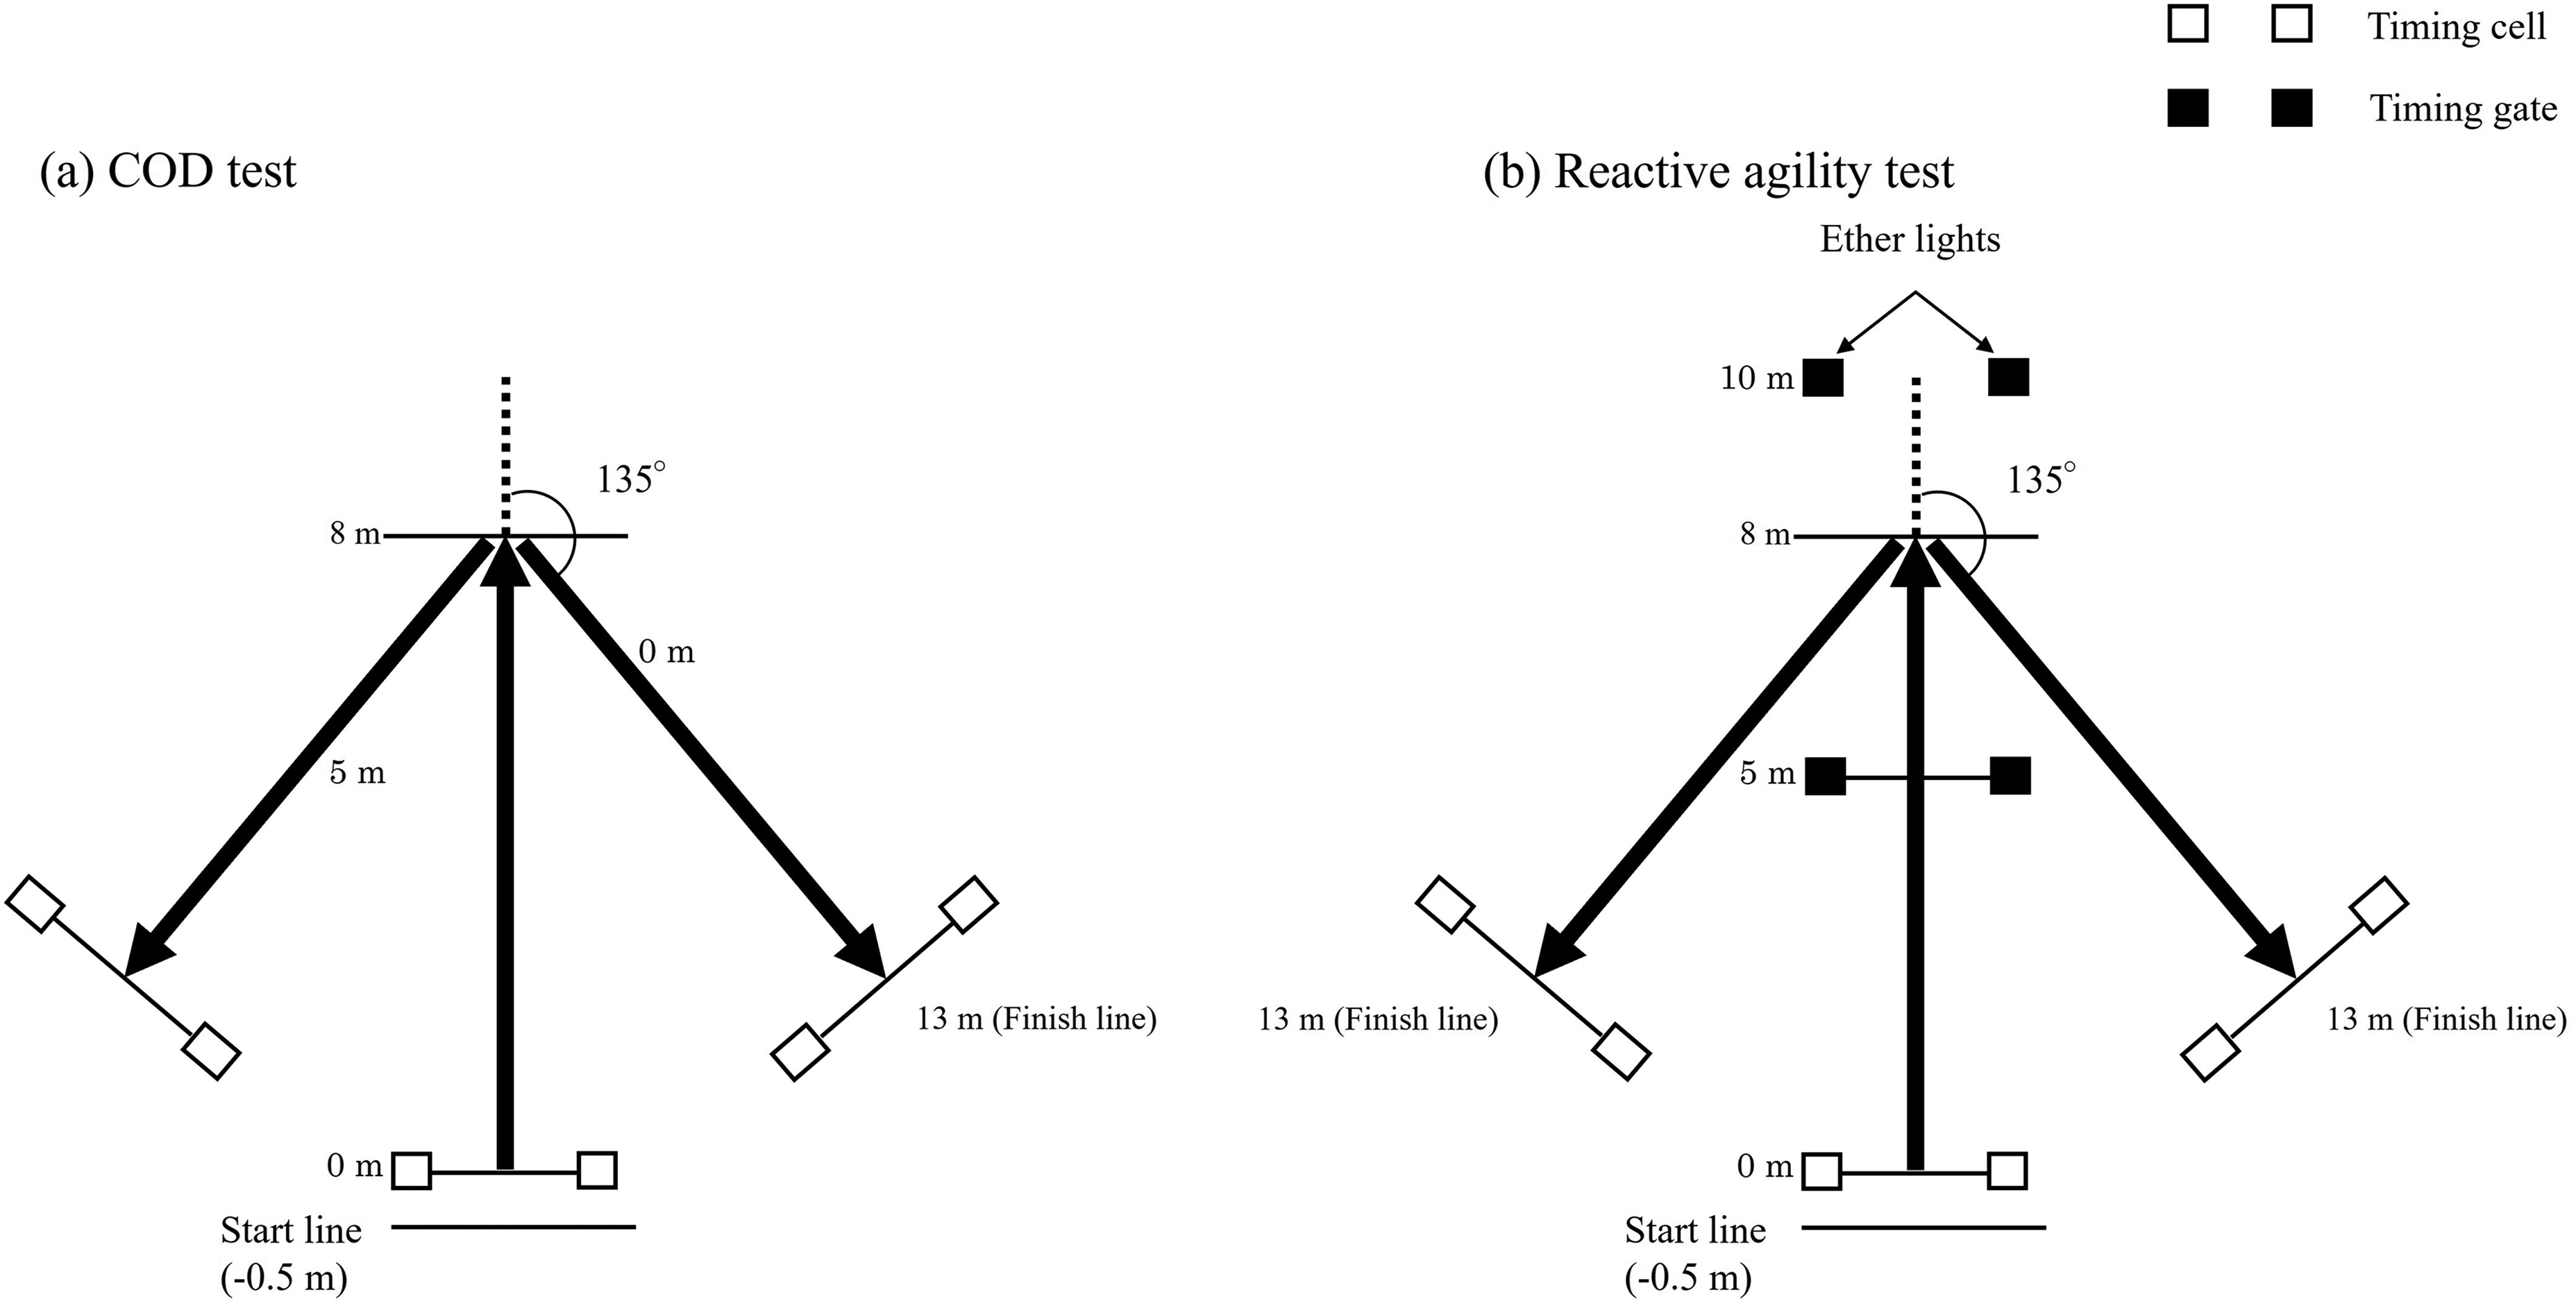
COD and reactive agility set-up (Kawahara et al., 2021 and Yoshida et al., 2025 for reference).
Rebound jump test
The participants wore their habitual training shoes to maintain consistency across trials and were prepared for motion analysis by attaching 12 retro-reflective markers (diameter, 14 mm) to specific anatomical landmarks. Twelve representative body points were used for each participant (1: right toe, 2: right heel, 3: right ankle, 4: right knee, 5: right greater trochanter, 6: right shoulder, 7: left toe, 8: left heel, 9: left ankle, 10: left knee, 11: left greater trochanter, and 12: left shoulder). Body coordinates were measured using an auto-labeling procedure based on this simplified marker set. This configuration was adopted because the Quick Motion Analysis System (QMAS) computes joint kinematics and kinetics in real time using these 12 markers. In a preliminary experiment, a dummy marker was attached to one thigh to prevent left–right hip marker swapping, and relabeling was performed when necessary. All markers were secured with kinesiology tape (NITREAT Kinesiology Tape; Nitto Group Company, Osaka, Japan) to prevent detachment during measurement. Marker trajectories were captured using a Vicon T20 system (Nexus 2; Vicon Motion Systems, Ltd, Oxford, UK) with 10 cameras operating at 250 Hz.
A global coordinate system was defined based on participants’ jumping directions along the X (mediolateral), Y (anterior-posterior), and Z (vertical) axes. The coordinate system proposed by Zushi et al. 8 was used to calculate the joint torque and angles. The coordinates are smoothed using a fourth-order zero-lag low-pass Butterworth filter. The optimal cutoff frequency (7.5–15 Hz) was determined using the residual method. 29 We analyzed the ankle joints of the participants for plantar flexion and dorsiflexion and the knee and hip joints for extension and flexion. The definitions of the joint angles were based on anatomical landmarks. The ankle joint angle was determined using the segments connecting the ankle, knee, and toe. The knee joint angle was defined as the angle between the segments linking the knee to the greater trochanter and ankle. The hip joint angle was formed by the segment linking the greater trochanter and the shoulder, with that connecting the greater trochanter and the knee. The angular velocity was calculated by differentiating the angular displacement with respect to time, with the flexion velocity set to negative and the extension velocity set to positive.
Ground reaction force (GRF) data were collected simultaneously using two force platforms (Kistler 9287C; Kistler Instruments AG, Winterthur, Switzerland) at a sampling rate of 1000 Hz. Each participant performed six repeated RJ trials, stepping onto the force plates to separately assess GRF for each leg. During the trials, participants were instructed to maximize jump height while minimizing contact time. The RJ-index was calculated based on the best performance among the six trials. To mitigate fatigue, a standardized rest period of 120 seconds was provided between trials. 30
The GRF data were time-synchronized using the Vicon Nexus software for subsequent inverse dynamic analysis. Kinetic measurements were obtained from the force platform under the dominant leg that had the fastest COD and reactive agility times across the trials. We calculated the ground contact and air time at the point where the vertical GRF was < 10 N using the force platform under the dominant leg. Jump height was determined using the free-fall formula, 31 and the RJ-index was calculated as the ratio of jump height to contact time. 8 The GRF data were smoothed using a low-pass Butterworth digital filter with a cut-off frequency comparable to that used for the marker coordinate data, in order to minimise artefacts immediately after ground contact.
The GRF data from the force plates and the marker position data from the Vicon system were processed using a Quick Motion Analysis System (QMAS; Q'sfix Co., Ltd, Tokyo, Japan), which integrates a three-dimensional optical motion system with force plates to compute lower limb joint dynamics in real time. We employed QMAS to determine the joint angles and subsequently derived the angular velocity through time differentiation. We calculated the joint torque, power, and work using inverse dynamics based on the Newton-Euler equations applied to the lower limb segments. Segmental inertial parameters were estimated according to previous studies 32 incorporating the body segment properties of Japanese athletes.
The definitions of lower limb kinematics (joint, flexion, and extension angles) and kinetic variables (joint extension torque, including ankle plantarflexion torque, power, and work), as well as the measurement procedures for body coordinates and ground reaction force data, conformed to the methodologies used in previous studies.8,9,22
Statistical analysis
All data are presented as mean ± standard deviation (SD). Normality was assessed using the Shapiro-Wilk test. Participants were categorized into two groups based on changes in reactive agility time (improved vs. non-improved). To account for measurement error in reactive agility test, test–retest reliability was assessed using intraclass correlation coefficients (ICC), yielding values of 0.947 (first measurement) and 0.917 (second measurement). The corresponding standard error of measurement SEM was 0.029–0.043 seconds, and the minimal detectable change at the 95% confidence level (MDC95) was 0.081–0.120 seconds. Although MDC95 provides a useful reference for interpreting individual changes, several participants demonstrated very fast baseline reactive agility times, limiting the magnitude of possible improvement. Therefore, participants were classified as “improved” if their reactive agility time decreased from the first to the second trial, regardless of whether the change exceeded the MDC95 threshold. This decision was further supported by the significant time × group interaction identified in the linear mixed model (LMM), indicating that the improved group exhibited a distinct pattern of performance change compared with the non-improved group. The COD test also demonstrated high test–retest reliability, with ICC values of 0.877 (first measurement) and 0.905 (second measurement). The sprint and RJ tests likewise showed good to excellent reliability: 20 m sprint, ICC = 0.859 (first measurement) and 0.863 (second measurement); 30 m sprint, ICC = 0.848 (first measurement) and 0.865 (second measurement); RJ-index, ICC = 0.893 (first measurement) and 0.878 (second measurement). A LMM was applied to agility time to examine the fixed effects of time, group, and their interaction, with individual variability modelled as a random intercept. For reactive agility time and other variables (sprint times, COD time, and RJ variables including RJ-index, jump height, and contact time), within-group changes from the first to the second measurement were analyzed using paired t-tests. Cohen's d was used to estimate the effect size. Joint kinematics, torque, and power during the RJ takeoff phase were compared within each group using paired t-tests. All analyses were conducted using SPSS version 29 (IBM Corp., Armonk, NY, USA), with an alpha level of 0.05.
Results
We conducted the Shapiro-Wilk test to examine the normality of the performance variables. We observed no significant deviations from normality for any variable: first 20 m sprint time (p = 0.367), first 30 m sprint time (p = 0.178), first COD time (p = 0.377), first reactive agility time (p = 0.218), first RJ-index (p = 0.245), second 20 m sprint time (p = 0.333), second 30 m sprint time (p = 0.058), second COD time (p = 0.841), second reactive agility time (p = 0.725), or second RJ-index (p = 0.213).
Table 1 shows the changes in performance variables from the first to the second measurement.
Changes in performance variables from the first to the second measurements.
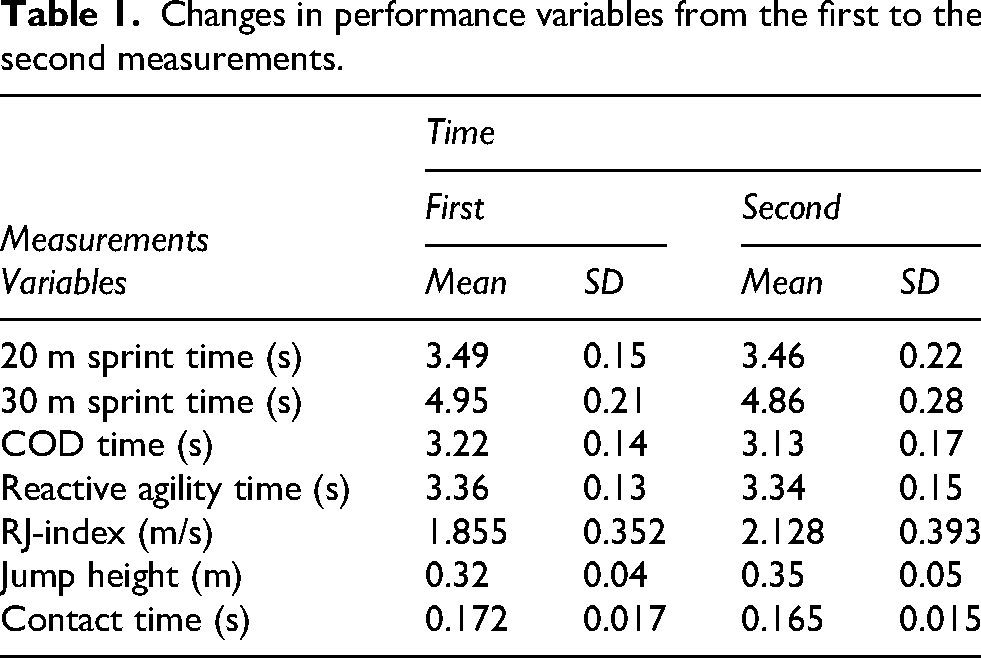
Table 2 shows the results of the LMM (time, group, and time × group) for reactive agility time. LMM analysis revealed significant group effects (p = 0.018) and a time × group interaction (p = 0.001) for reactive agility time, indicating that changes over time differed between the improved and non-improved groups. The effect of time alone was not statistically significant (p = 0.351).
Results of the linear mixed model (time, group, time × group) based on reactive agility time.
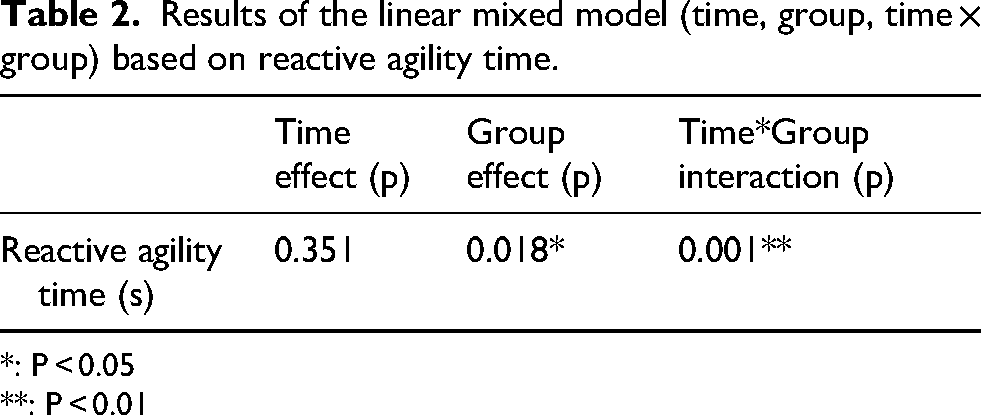
*: P < 0.05
**: P < 0.01
Table 3 shows changes in reactive agility time, 20 and 30 m sprint time, COD time, and RJ performance variables from the first to second measurement within each group. In the improved group, significant improvements were observed in reactive agility time (p = 0.001, d = 1.30), 30 m sprint time (p = 0.009, d = 0.72), COD time (p = 0.001, d = 1.34), RJ-index (p = 0.001, d = −1.63), RJ jump height (p = 0.001, d = −1.31), and RJ contact time (p = 0.003, d = −1.24). In contrast, the non-improved group showed a significant increase in reactive agility time (p = 0.020, d = −1.06), while other variables showed no significant changes.
Changes in reactive agility time, sprint time, COD time, and RJ performance variables from the first to second measurements within each group.
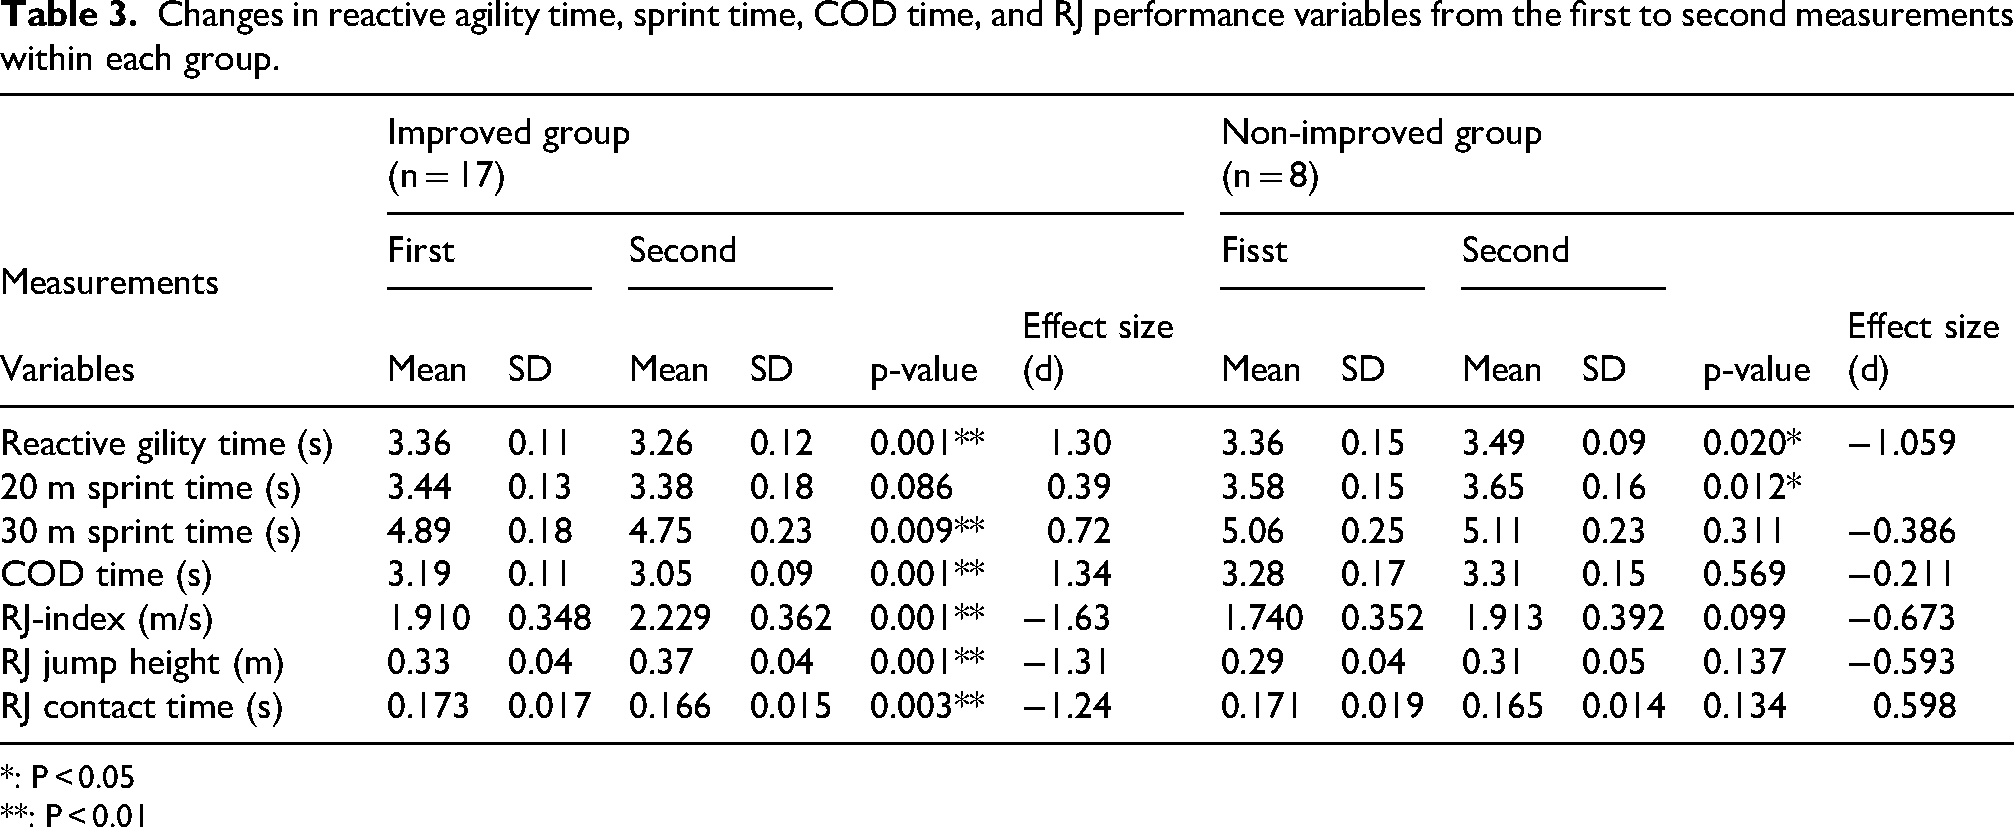
*: P < 0.05
**: P < 0.01
Table 4 shows the changes in RJ joint kinematics and kinetics from the first to the second measurement in each group. In the improved group, significant increases were observed in eccentric knee extension torque (p = 0.037, d = −0.55) and negative ankle joint power (p = 0.025, d = 0.60). Other joint angles, torques, and power variables did not exhibit significant changes. The non-improved group did not exhibit significant changes in any joint mechanical variables, although moderate effect sizes were observed for negative hip and knee joint power.
Changes in joint kinematics and kinetics during RJ takeoff phase from the first to the second measurements within each group.
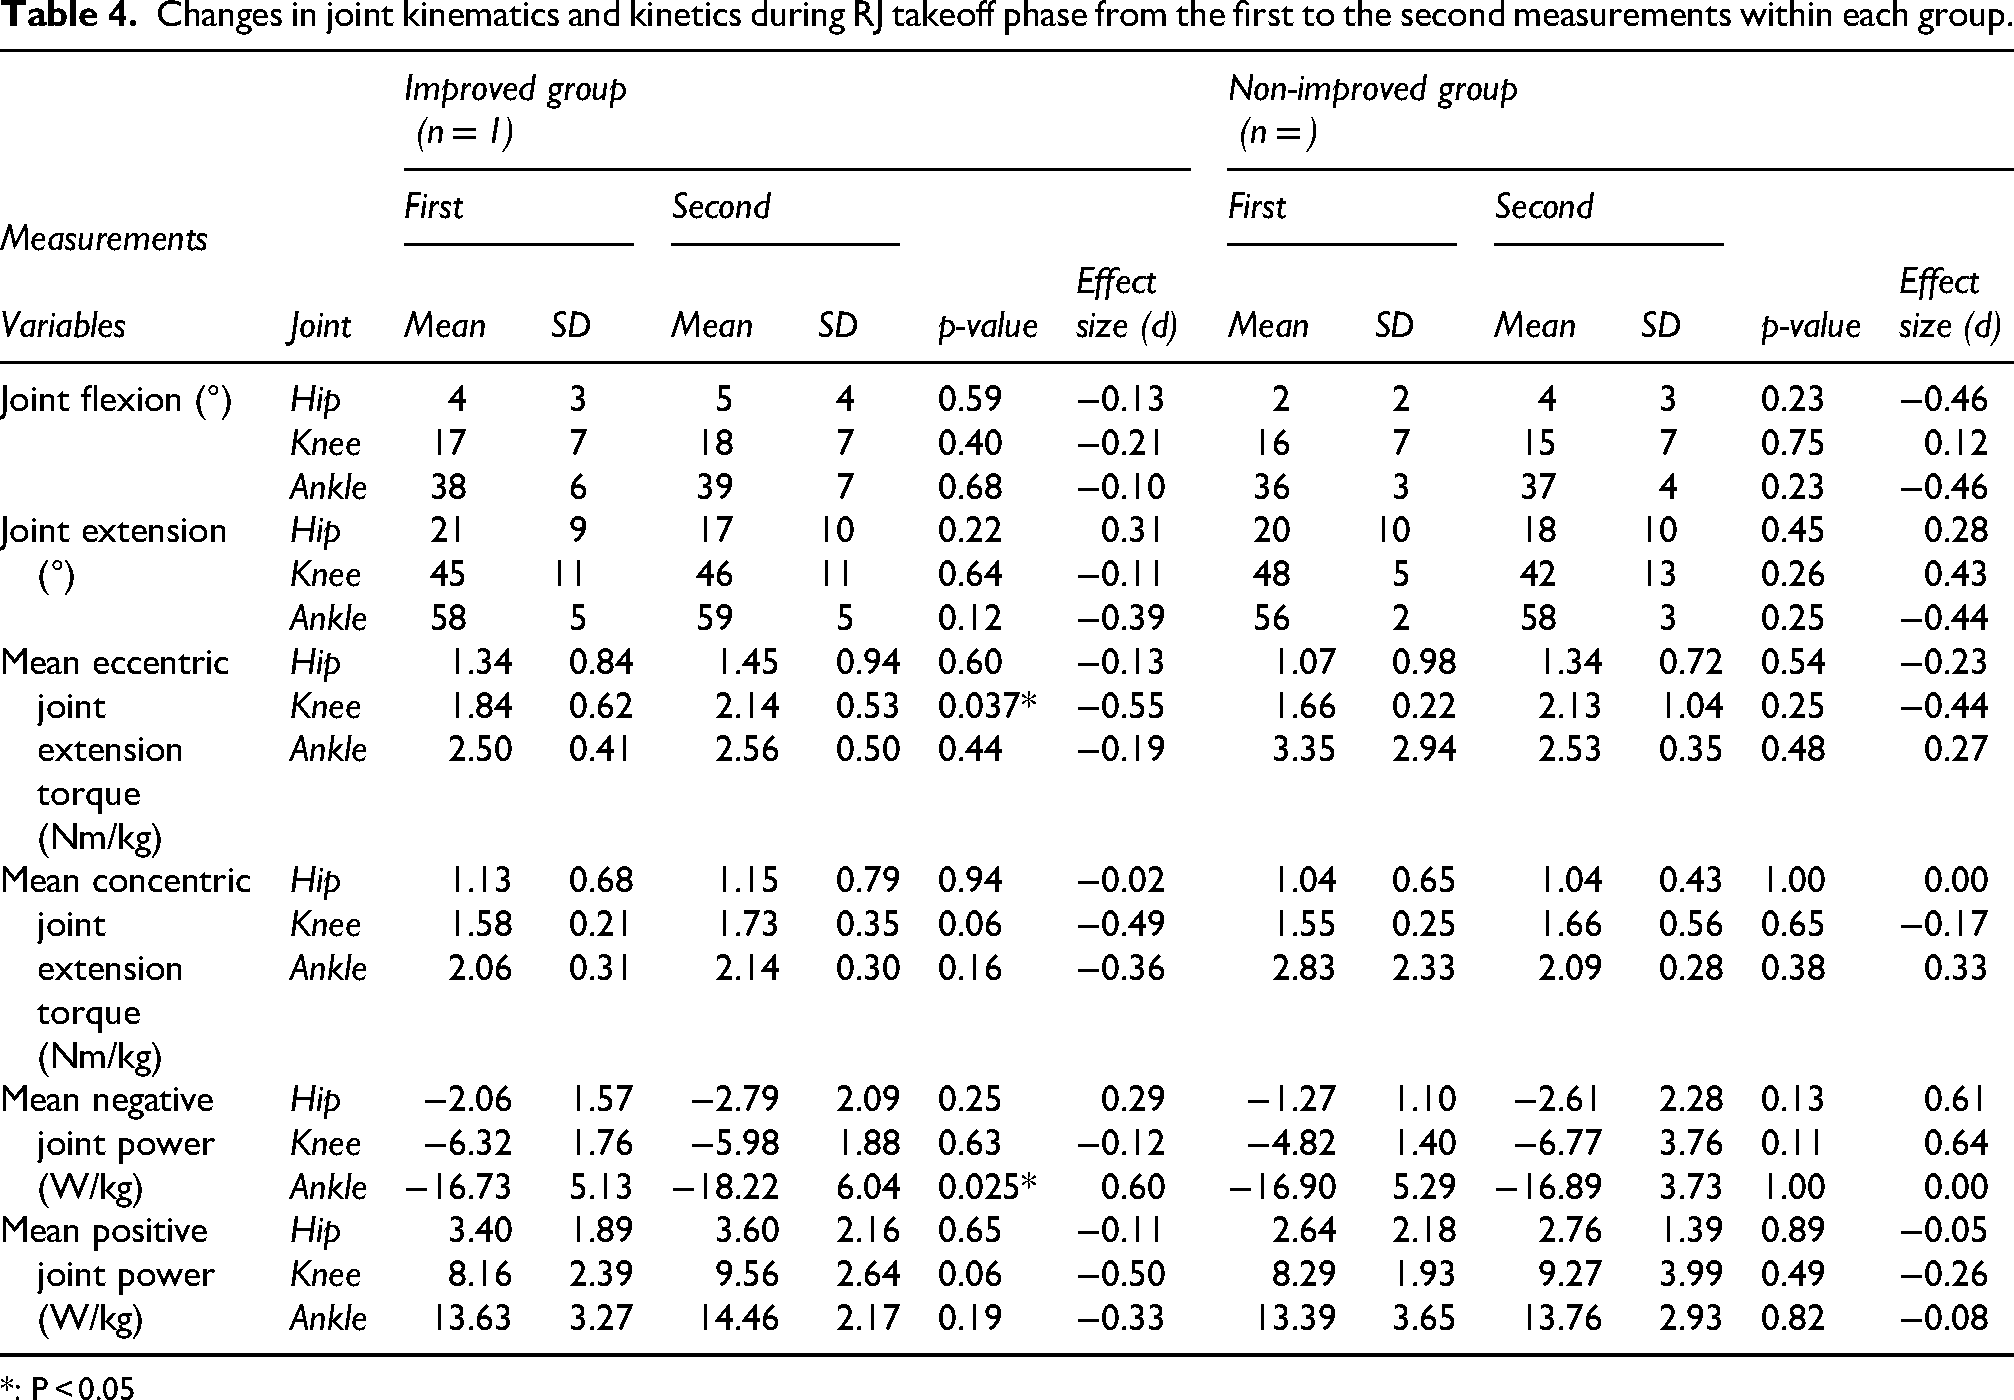
*: P < 0.05
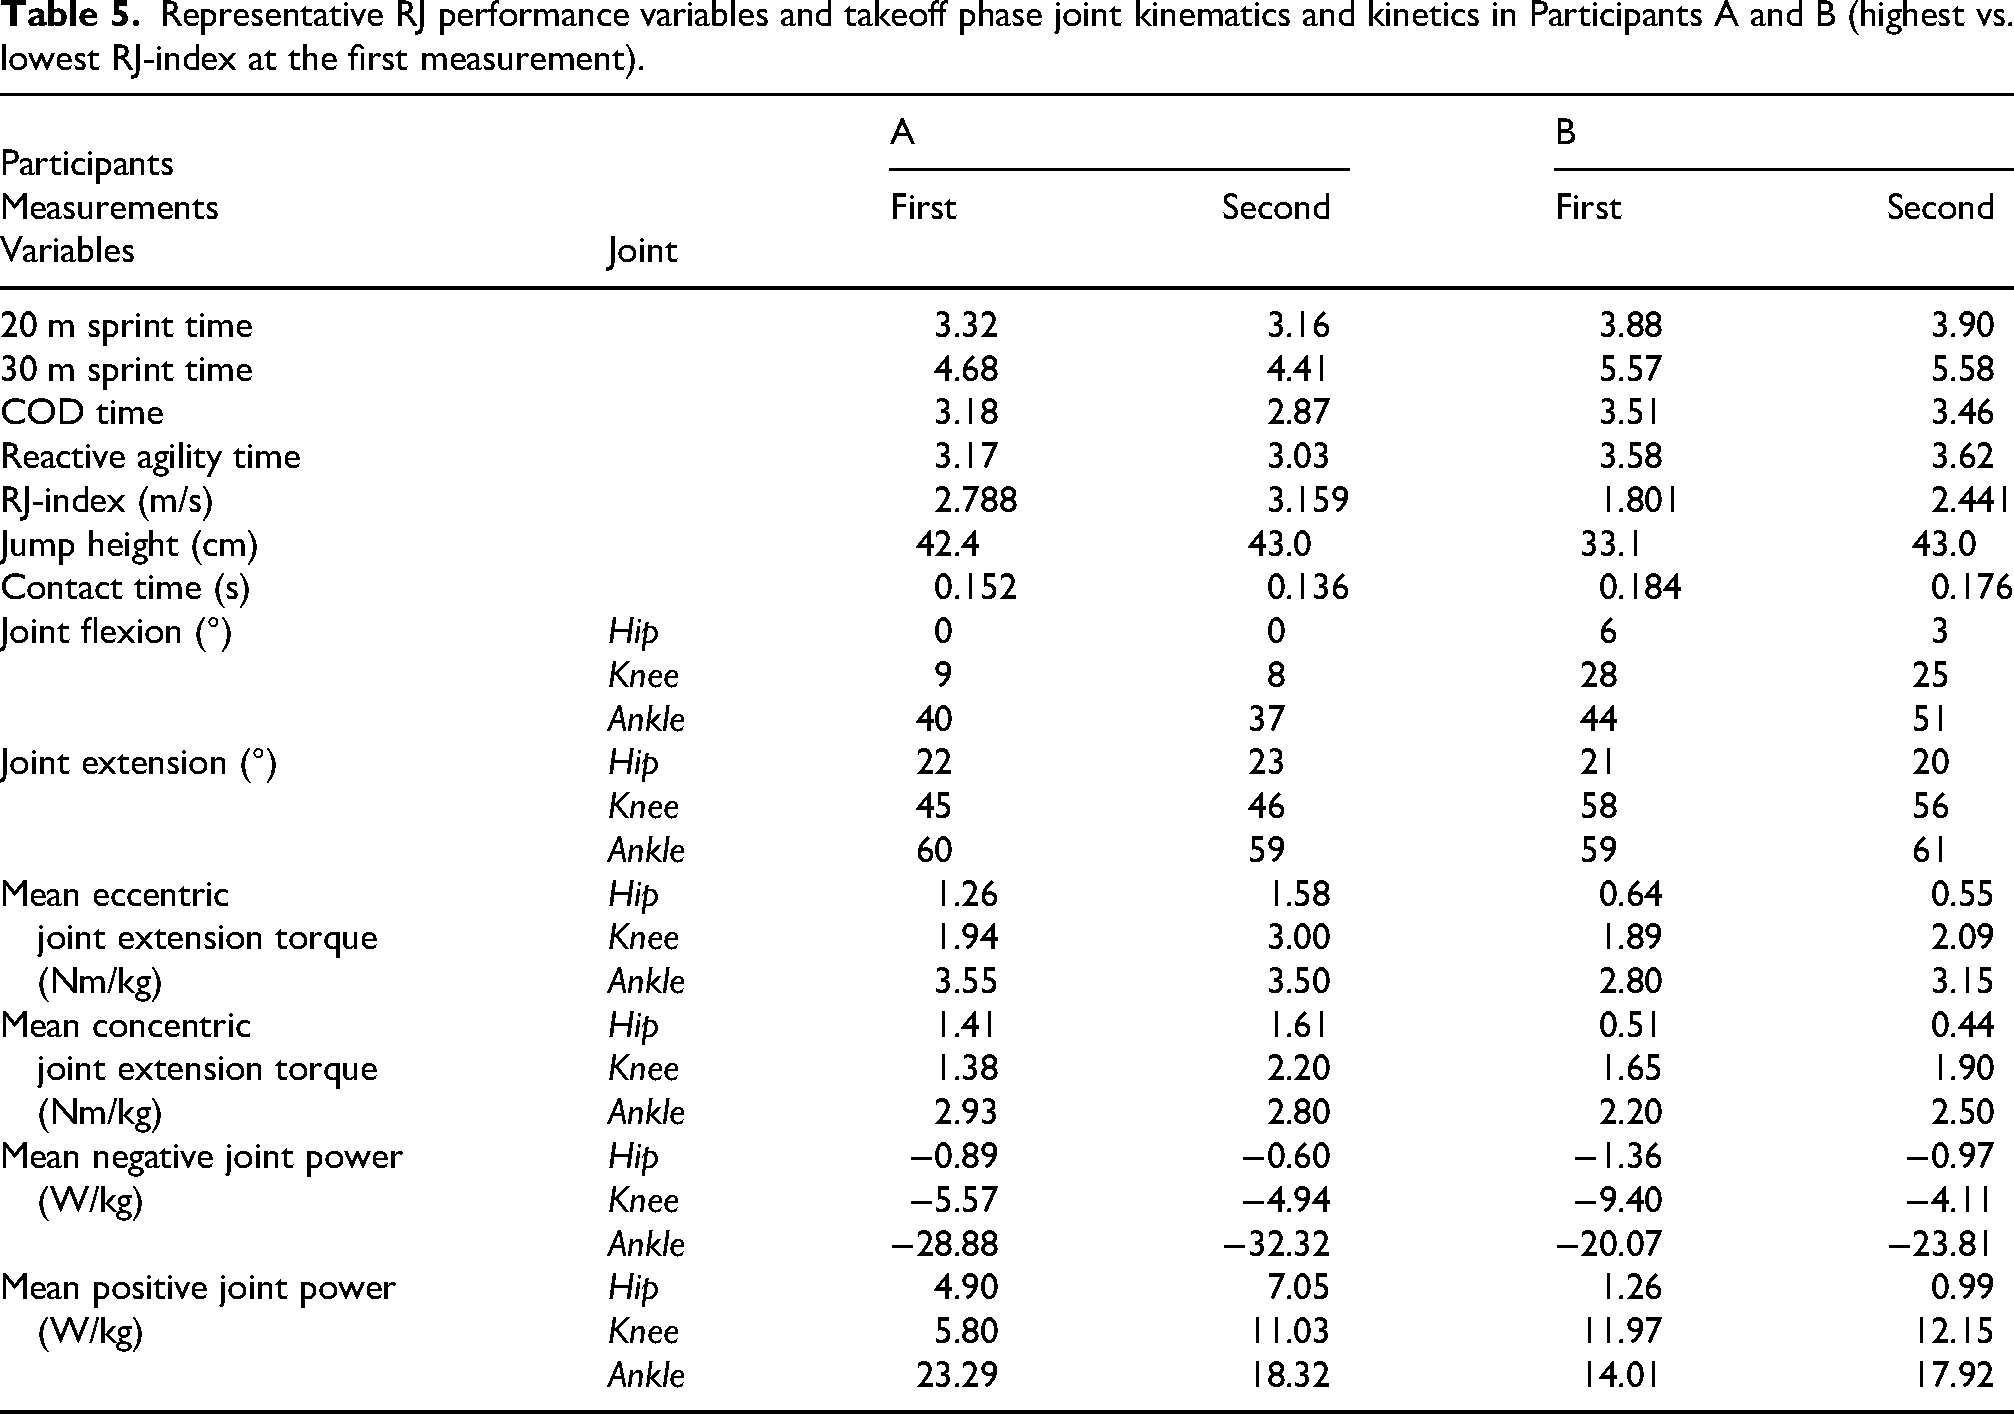
Table 5 presents changes in joint kinematics and kinetics during RJ takeoff for two participants (A and B) who differed in reactive agility time. Participants A showed significant improvements in reactive agility time. Participant A, who had a relatively high RJ-index at baseline (2.788 m/s), exhibited further increases in RJ-index and RJ jump height, along with an improvement in RJ contact time. Moreover, in RJ takeoff, while ankle negative power slightly decreased (- −28.88 to −32.32 W/kg), hip joint parameters showed marked increases, including eccentric extension torque (1.26 to 1.58 Nm/kg), concentric extension torque (1.41 to 1.61 Nm/kg), and positive power (4.90 to 7.05 W/kg). In contrast, Participant B, who had a lower baseline RJ-index (1.801 m/s), also showed improvements in RJ-index and RJ jump height but did not demonstrate reactive agility time. In addition, although in RJ, takeoff ankle plantarflexion torque and power increased, the hip joint parameters remained low or declined, and knee negative power decreased substantially (−9.40 to −4.11 W/kg).
Representative RJ performance variables and takeoff phase joint kinematics and kinetics in Participants A and B (highest vs. lowest RJ-index at the first measurement).
Discussion
This study examined the influence of RJ performance improvements on reactive agility performance, focusing on the changes in joint mechanics during RJ takeoff. Based on the changes in reactive agility time, the participants were classified into improved and non-improved groups. The improved group demonstrated significant reductions in reactive agility time (p = 0.001, d = 1.30), 30 m sprint time (p = 0.009, d = 0.72), and COD time (p = 0.001, d = 1.34), alongside increases in RJ-index (p = 0.001, d = −1.63), RJ jump height (p = 0.001, d = −1.31), and reductions in RJ contact time (p = 0.003, d = −1.24). These results suggest that enhanced lower limb SSC function is more pronounced in participants with improved reactive agility, which is consistent with previous cross-sectional findings.4,6,10–14,16 Notably, studies have reported that athletes with superior sprint and COD abilities tend to exhibit a higher RJ-index. 16 Similarly, Yoshida et al. 22 found significant correlations between the RJ-index and sprint and reactive agility times, suggesting that RJ performance is closely linked to multidirectional speed capabilities. Importantly, Zushi et al. 8 demonstrated that the jump height and contact time, two components of the RJ-index are influenced by separate underlying mechanical determinants, suggesting that improvements in each component reflects different aspects of SSC function. Yoshida et al. 22 reported that RJ contact time was closely associated with reactive agility time whereas no such relationship was observed for COD time. This may be due to the specific demands of reactive agility tasks, which require rapid deceleration and directional shifts within a limited time window, thereby increasing the importance of generating force quickly through efficient SSC function. These findings highlight the multifaceted nature of SSC function and indicate that both jump height and contact time play distinct roles in RJ performance.
Analysis of joint kinetics during RJ takeoff phase revealed significant increases in knee eccentric torque (p = 0.037, d = −0.55) and ankle negative power (p = 0.025, d = 0.60) in the improved group. These results support previous findings that joint-specific kinetic adaptations, particularly at the ankle and knee, serve as key mechanical determinants of RJ performance improvements.8,9,26 Zushi et al. 8 demonstrated that ankle plantarflexion torque and power contribute to the acquisition of the RJ-index, RJ jump height, and RJ contact time, highlighting the central role of ankle kinetics in plyometric jump exercises that require achieving a high jump height within a limited time window, such as RJ. This study reported that knee eccentric extension torque was specifically associated with improvements in the RJ-index, suggesting that greater eccentric force generation capacity at the knee may contribute to controlling excessive knee flexion during takeoff. Improvements in both ankle and knee joint kinetics may contribute not only to increased jump height but also to reduced contact time, two critical components of RJ performance. These longitudinal findings are consistent with those of previous cross-sectional studies, which reported that athletes with superior sprint and COD times tend to exhibit higher RJ-index values.4,10,15,16 Notably, female athletes demonstrate greater ankle power and knee eccentric extension torque during RJ takeoff. 16 Although RJ and sprint performance are not directly correlated, similarities in ankle and knee joint kinetics have been observed across both movement. 19 In sprinting tasks, Morin et al. 18 reported that training shifts sprint performance determinants toward joint-specific kinetic characteristics, particularly the ability to apply force effectively in the horizontal direction rather than overall RJ performance measures such as the RJ-index. Taken together, these findings indicate that the joint kinetic characteristics associated with RJ performance appears consistent across both cross-sectional and longitudinal contexts, reinforcing the importance of ankle and knee contributions to lower limb SSC function and agility-related movement execution.
Building on these longitudinal findings, previous studies on COD performance consistently highlight the importance of joint-specific eccentric control. Dos'Santos et al.33–35 emphasized that appropriate levels of negative knee power are critical for effective braking and reacceleration during high-velocity COD tasks. Besier et al. 20 further demonstrated that unpredictable COD substantially increases knee flexion in the supporting leg, indicating heightened mechanical demand. In line with this, Jones et al. 36 reported that eccentric knee extension strength plays a key role in managing such directional shifts. Importantly, the influence of joint-specific eccentric control appears to vary depending on the COD angle. Jones et al. 37 identified eccentric knee extension strength as a primary determinant of performance in 180° turns. Moreover, evidence consistently shows that eccentric knee extensor strength is a key determinant of COD performance across a wide range of directional changes.36–38 Given that the reactive agility test in the present study required a 135° directional change (i.e., a 45° backward cut), knee-specific eccentric capacity is likely to play a central role in managing the substantial braking and reorientation demands.
Focusing on the two individuals who exhibited the highest (Participant A: 2.788 m/s) and lowest (Participant B: 1.642 m/s) RJ-index values at the first measurement, the distinct adaptation profiles deviated from group-level trends, offering insight into individual variability. Notably, both participants underwent the same training program, which included sprint drills, running-based exercises (sprint, COD, and agility tasks), plyometric movements, and one to two weekly strength training sessions. Participant A, who exhibited the highest ankle torque and power across both measurements, demonstrated further improvements in RJ performance along with increased hip joint parameters. Given that the ankle joint typically produces the greatest torque and power during RJ takeoff, these results suggest that in individuals with a high distal output, additional gains may be supported by enhanced proximal joint function. 22 Therefore, eccentric extension torque at the knee and hip joints may compensate for loading that cannot be fully absorbed by the ankle joint, helping maintain stable lower limb alignment under the stretch loads imposed during landing. Based on these findings, reactive agility performance appears to require the capacity to resist increased stretch loads. Participant B, who had the lowest baseline RJ-index, showed improvements in ankle joint kinetics and RJ performance. However, given the limited initial RJ performance, these changes may not directly translate into improvements in reactive agility performance. This pattern suggests that, in individuals with low baseline RJ performance, early-phase adaptations may be insufficient to influence complex tasks such as reactive agility. Such tasks require not only power generation but also substantial eccentric load management, which may not yet be adequately developed.
Future research is warranted to address several important directions suggested by the present findings. First, although individual variability was examined, the sample size for subgroup analysis was limited. Studies involving larger cohorts are needed to validate and extend these observations. Second, while joint mechanics during RJ takeoff phase were analyzed, the current study did not directly assess force production or movement strategies during reactive agility tasks. Future investigations incorporating biomechanical analyses during actual reactive agility execution would help clarify how SSC functions contribute to on-field movement efficiency.
A key limitation of this study concerns the nature of the reactive COD assessment. Although the task required participants to respond to a light signal, it does not fully capture the perceptual-cognitive components that are central to definitions of agility. The reactive COD task used in this study reflects the unpredictable nature of directional changes in football and therefore retains ecological relevance. However, the reactive element may also introduce additional individual variability related to simple reaction time, which could influence performance independently of physical COD performance.
Conclusion
This study demonstrated that improvements in reactive agility time and RJ-index were accompanied by increased knee eccentric extension torque and ankle extension power, particularly in the improved group. These changes suggest enhanced SSC function and joint-specific kinetic adaptations. At the same time, variability in reactive agility performance responses indicates that SSC function and joint kinetics may reflect individualized adaptation profiles. Notably, participants with a high baseline RJ-index achieved further gains through increased hip joint kinetics, whereas those with lower initial RJ-index improved only their RJ performance without corresponding enhancements in reactive agility performance. These findings support a task-specific adaptation model in which proximal joint kinetics and eccentric control become increasingly important for complex multidirectional tasks. Individualized plyometric strategies targeting joint-specific SSC functions, particularly eccentric force production at the knee and hip may therefore be essential for optimizing reactive agility.
Footnotes
Acknowledgments
We would like to express our gratitude to the athletes and laboratory members who cooperated in this research.
Ethical considerations
This study was approved by the Ethics Committee of the Faculty of Health and Sports Sciences, University of Tsukuba (approval no. tai 30–142), and all procedures were conducted in accordance with the Declaration of Helsinki.
Consent to participate
Written informed consent to participate was obtained from all participants after they were informed of the purpose, procedures, potential benefits, and risks of the study.
Consent for publication
Not applicable
Funding
The authors disclosed receipt of the following financial support for the research, authorship, and/or publication of this article: This research was supported by the Japan Society for the Promotion of Science Grant-in-Aid for Scientific Research (grant number 23K10708).
Declaration of conflicting interests
The authors declared no potential conflicts of interest with respect to the research, authorship, and/or publication of this article.
Data availability
The datasets generated and analyzed during the current study are not publicly available due to ethical restrictions related to human participant data, but are available from the corresponding author on reasonable request.