
Abstract
Plyometric training has been proposed as a relevant tool for swimming performance, especially in turns, given its biomechanical similarity to the push-off phase. This study aimed 1) to analyse the relationship between the drop jump (DJ) variables and the tumble turn variables and 2) to explore which DJ variables may predict the tumble turn time. A cross-sectional design was used to examine the relationship between the DJ and tumble turn performance. Eighteen swimmers (9 females, 14.3 ± 0.8 years; and 9 males, 15.2 ± 0.5 years) participated. Swimmers completed a standardized dryland warm-up followed by 5 sets of a single DJ. Subsequently, participants underwent a standardized in-water warm-up before performing 3 front crawl tumble turns. Sex-stratified correlations, exploratory linear stepwise multiple regression, and network analyses were performed to examine the relationships between DJ variables and tumble turn performance. Jump height correlated with the mean horizontal velocity during the wall contact active phase for females (r = 0.71; p = 0.033) and males (rho=0.9; p = 0.001). The tuck index of the DJ (TIG) showed association with the time from wall contact to 2.5 m (T2.5m-out) for females (r = 0.76; p = 0.018) and males (r = -0.67; p = 0.047). Exploratory multiple regressions explained the T2.5m-out for females and males (87% and 88% of the variance, respectively) with TIG as the main predictor in both. In conclusion, DJ performance was associated with tumble turn performance. Variations in the tuck index during DJ, reflecting different hip and knee displacement patterns, may be linked to differences in tumble turn efficiency.
Introduction
In competitive swimming events, the overall performance depends on four major components: start, clean swimming, turn and finish. 1 The importance of each component is underscored when observing the small differences between competitors, as a few hundredths of a second determine whether a swimmer wins or loses a race. 2 In this sense, the strong relationship between total turn time and total race time has established turn performance as the distinguishing factor. 2 The turn segment may account for up to 55.7% of the total race time, with its contribution increasing proportionally as the distance of the event increases. 2 Therefore, the development and enhancement of turn segment is crucial for overall swimming performance. 3
The specific distance of turn segment has been broadly varied in scientific literature. Although some authors have suggested using individual distances to gain deeper insights into turn performance, this level of individualization hinders the direct comparison among swimmers.4,5 Hence, the fixed distances are commonly used in the literature to compare the performance of different swimmers, provided that this turn distance is adapted to the duration of the event. 1 Moreover, for a more in-depth analysis, the tumble turn segment is divided into seven phases: approach, rotation, wall contact, glide, underwater undulatory swimming and breakout. 6
Wall contact is a phase that requires a certain balance between the force applied during the push-off and the time invested in this action. Previous research showed contradictory results on the relationship between push-off peak force and tumble turn performance.6–9 In addition, the minimum distance between the hips and the wall in the turn, denominated tuck index (TIW), becomes important as it determines part of the wall contact time (WCT), and its manipulation could improve the tumble turn. 10 The wall contact phase stands out, apart from the dive, as the only moment that force is applied against a solid surface, allowing swimmers to generate speed immediately after reaching TIW and push-off. 11 In the wall contact phase, the 2.5 m is a crucial distance, as it reflects the speed primarily generated by the push-off, though also affected by the gliding position. 6 This push-off against the wall is similar to that one performed in a vertical jump during the ground contact time (GCT). Specifically, shorter GCT and higher reactive strength index (RSI) values (i.e., typical markers in stretch–shortening cycle tasks such as the drop jump (DJ)) are indicative of more efficient stretch-shortening cycle (SSC) function; this is especially relevant in adolescent swimmers, whose neuromuscular capacities are still maturing. 12 In that sense, plyometrics exercises are commonly implemented during elite swimmers dry-land training sessions, 13 who not only outperform sub-elite swimmers in the water but also demonstrate greater force and power during vertical jumps training. 14
To improve the vertical jump and therefore the tumble turn performance, plyometrics is one of the dryland training methods with more evidence. 15 Specifically, the plyometric exercises have been applied in numerous studies to enhance turn performance due to the aforementioned similarity to the push-off from the wall.16–21 This method consists of applying the maximal amount of force within the shortest timeframe, harnessing the elastic energy stored during the muscles SSC. 22 Accordingly, plyometrics targets SSC behavior and rate of force development under brief contact times, which aligns with turn demands. Tumble turns are constrained by very short time-windows for force application, making reactive capacity and rapid force production relevant to the task. 10 In this sense, plyometric training elicits muscle strength development by inducing neural improvements such as increased motor unit activation, coordination, recruitment and firing in motor units. 23 Given these benefits, plyometric method appears to be an effective strategy to improve all types of swimming turning performance. 23 However, the precise relationship between swimming turn performance and plyometric jumping performance variables remains unclear. Thus, further insights may aid swimming coaches when planning and evaluating plyometric training to improve swimmers’ turn performance.
Among the different plyometric exercises, the countermovement jump (CMJ) is widely used in the scientific literature, both as an assessment tool,13,14 and as a training exercise to enhance performance.18,20 However, the tumble turn involves an impact component characterized by limited time for force production due to short WCTs, together with a rebound elements that the CMJ lacks. 24 In this sense, the drop jump (DJ) exhibits these characteristics and its similarity to tumble turn push-off may make it a more suitable comparison for these two specific movements. Indeed, the DJ mirrors key constraints of the turn (brief contact, SSC reliance, the need for rapid force production, and especially mechanical similarity (i.e., hip–knee–ankle extension against rigid surface after foot reception against the wall/ floor)) while water-specific demands (e.g., postural/streamline control after push-off) remain critical modifiers of performance.
In practical terms, transfer from dry-land to in-water performance depends on matching the contraction regime (SSC), the time available for impulse, and the ability to maintain arms–trunk–legs alignment into the streamline.9,14,25 Thus, as the DJ mimics the turns demand, it is an exercise often included in training programs to improve performance; however, to the best of the authors’ knowledge it has not been employed to assess the turn performance. Therefore, the aims of the current study were 1) to analyse the relationship between the DJ variables and the tumble turn performance, and 2) to explore which DJ variables may predict the tumble turn performance. It was hypothesized that swimmers with higher DJ performance would tend to exhibit better tumble turn performance. Moreover, the tuck index of the DJ (TIG) and the GCT were considered candidate predictors to be explored in relation to tumble turn performance.
Material and methods
Subjects
A total of 18 adolescent swimmers, nine females and nine males (14.3 ± 0.8 and 15.2 ± 0.5 years; 2.69 ± 0.89 and 2.28 ± 0.63 years from peak height velocity (maturity offset); 54.9 ± 9.1 and 63.0 ± 6.4 kg of body mass; 164.1 ± 9.4 and 172.5 ± 6.9 cm of body height; 98.3 ± 6.9 and 99.9 ± 5.3 cm of trochanteric height; 86.4 ± 3.2 and 93.3 ± 2.8 cm of sitting height; 223.5 ± 12.2 and 234.4 ± 10.13 cm of body length; 465 ± 88 and 496 ± 100 Junior World Aquatics Points, respectively) from the same swimming club volunteered to participate after being provided with information about the study that was to be conducted. All swimmers primarily competed in sprint freestyle (50–100 m) events at regional- or national-level, had over four years of competitive experience and underwent a training regimen consisting of six in-water (6583 ± 2764 meters of daily volume) and four dry-land sessions per week under the supervision of the same coach. As a turn sprint was assessed and all swimmers were under 18 years old, World Aquatics Points were scored in their personal best 50 m freestyle (PB50mFR) in short course through the Junior World Record. 26 Swimmers were required to score more than 350 points to be included in the data analysis. 27 The protocol was explained to the participants and their parents before providing written consent to participate.
Procedures
A schematic representation of the study design and procedures is provided in Figure 1. The trials were carried out in a 25 m indoor pool (length × width × depth, 25×17.6×2.07 m; air and water temperatures of 29.2 and 27.6°C, respectively). During the two weeks prior to data collection, the swimmers underwent three familiarization sessions of 30 min, where the execution technique of DJ was explained and shown to the swimmers. It should be noted that the swimmers analysed already practiced the DJ during their dry-land training program, and that three familiarization sessions were carried out to give them a more specific cueing. During the explanation, swimmers were asked to perform the fastest gesture aiming to reach the maximum jump height. Participants were asked to refrain from strenuous activity and to maintain their dietary habits for 24 h prior to data collection.
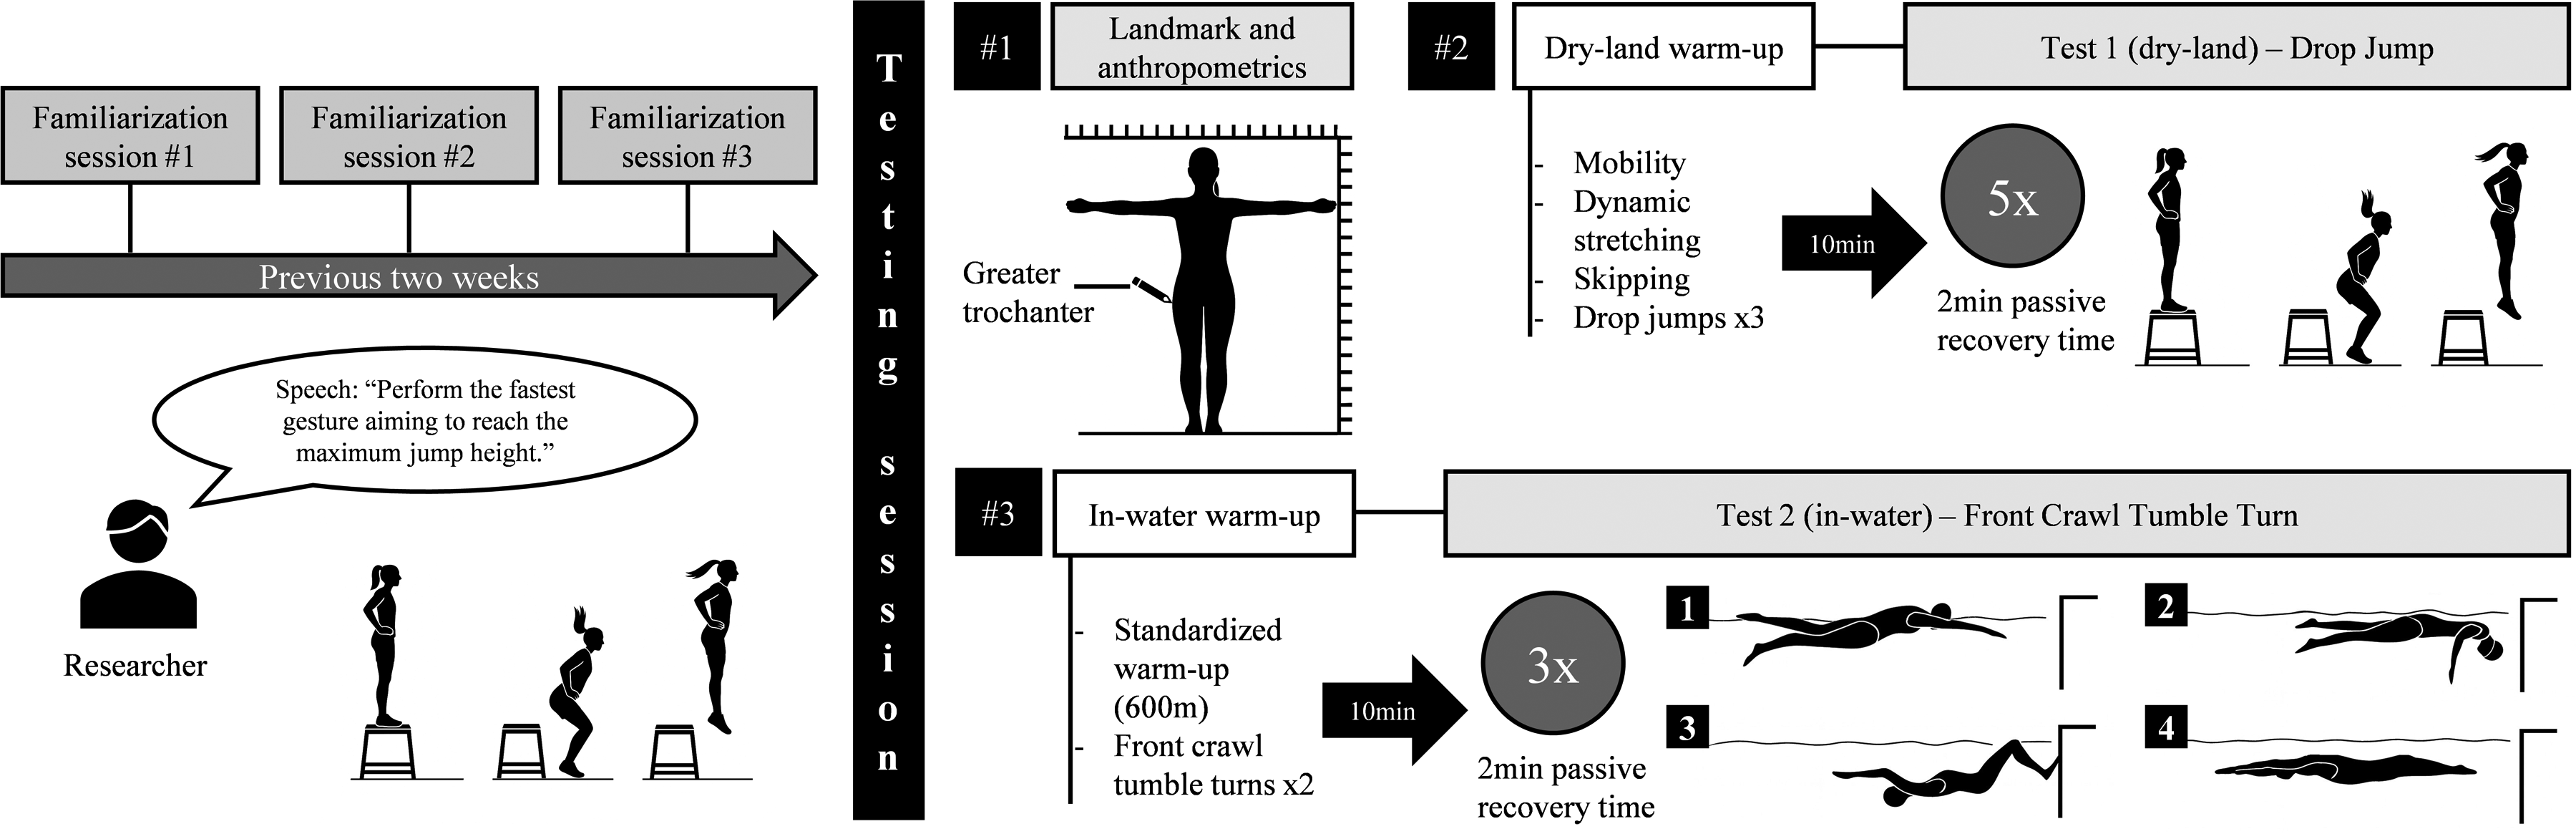
Schematic and timeline of the study design and procedures.
In the testing session, upon arrival to the facilities, the swimmers were marked with a 3cm-diameter circle of black oil-based hypoallergenic body paint at the greater trochanter of the femur for both in-water and dry-land displacement references. Then, anthropometric variables were measured following standardized techniques adopted by the International Society for the Advancement of Kinanthropometry (ISAK). 28 Height and body mass were measured using a stadiometer/scale (Seca 799, Hamburg, Germany). Body length and trochanteric height were assessed with the participant lying on the floor in streamlined supine position (i.e., arms extended overhead with hands overlapped, aligned with trunk and legs together with ankles plantarflexed) on a measuring tape. All measurements were taken by the same ISAK Level 2 accredited researcher.
Then the swimmers underwent a standardized dryland warm-up, consisting of mobility, dynamic stretching, skipping exercises and three submaximal DJ. Ten min after the end of the warm-up, five DJ with a 2 min passive recovery time between each one were performed. 29 To perform the DJ, participants were instructed to step off a 0.45 m high box 30 with hands placed on their hips, minimize GCT, and jump immediately aiming for maximal vertical displacement with knee flexion no greater than ∼90°. Box height was selected as a mid-range, pragmatic standard for this cohort, to maximize comparability across swimmers while remaining within evidence-based ranges for DJ. 30
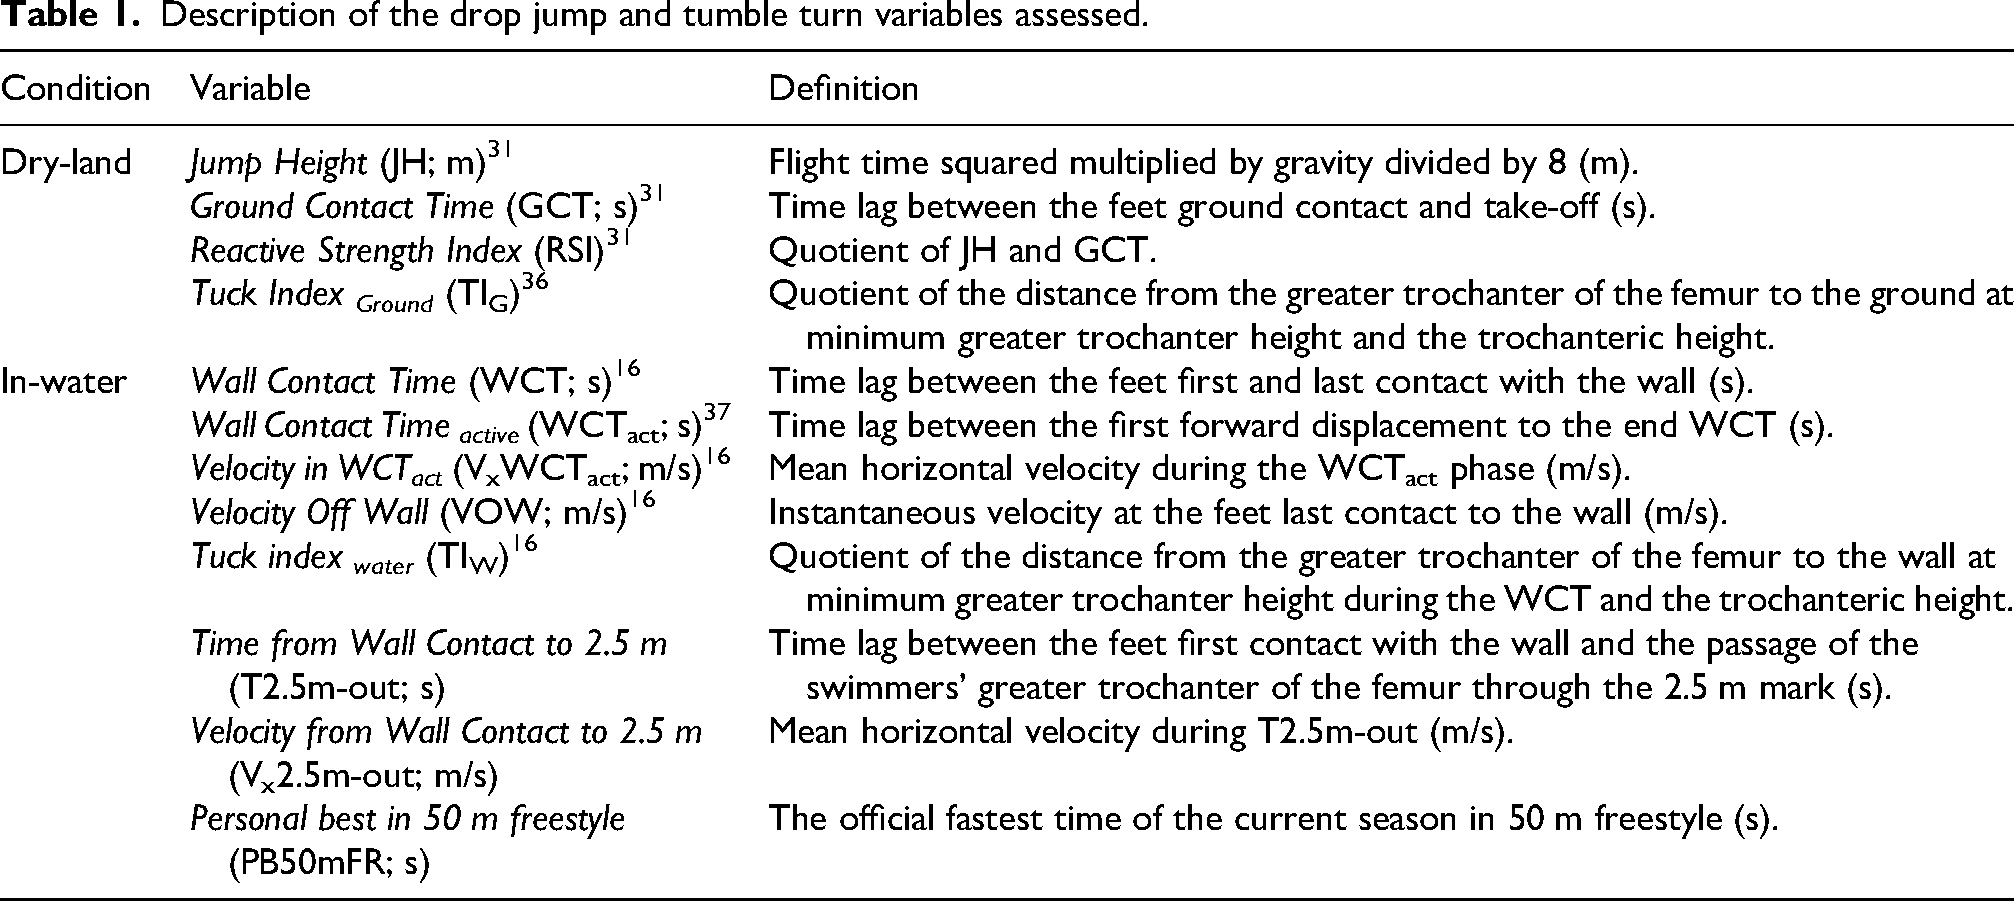
The DJs were analysed using My Jump 2 app on an iPhone 12 device (1080 pixels and 240 Hz), app that shows near-perfect reliability and concurrent validity vs. a force plate in the measured variables (ICC and r = 0.98, 0.97 (RSI); 0.96, 0.96 (JH); 0.92, 0.98 (GCT)). 31 Moreover, all jumps were recorded using a digital video camera (Handycam 4 K FDR-AX53, Sony Europe B.V., Netherlands), mounted on a tripod, perpendicular to the sagittal plane and aligned at trochanteric height, with a resolution of 1080 pixels and a sampling rate of 120 Hz for the measurement of minimum greater trochanter height during GCT (a coplanar calibration object was used to convert pixels to meters) using Kinovea software (version 0.9.5, Kinovea.org, France). For TIG calculation, the orthogonal distance from greater trochanter landmark to the ground plane at minimum hip position was extracted and normalized by trochanteric height. Jump height was quantified first to identify and discard the highest and the lowest trials and the mean of the remaining three jumps were used for further analyses (Table 1). 32 All analyses, both app-based and video-based, were performed by a single expert evaluator following a predefined event detection protocol.
Description of the drop jump and tumble turn variables assessed.
Afterwards, in-water tests were preceded by a standardized warm-up, 33 consisting of 600 m in total, plus two additional practice turns at maximum speed. Subsequently, the swimmers rested for 10 min and performed three front crawl tumble turns with 2 min passive recovery time between trials. 34 The turns were executed with the swimmers starting at 10 m from the wall. They were asked to reach the maximum speed before the 5 m mark, perform the rotation and push-off from the wall in streamlined body position, gliding without kicking to isolate the push-off and minimize the effect of undulatory underwater swimming. 35 Compliance was verified in real time by an in-water researcher and a second observer on deck; any leg motion before 2.5 m triggered immediate repetition (5 trials were repeated). All trials were then reviewed frame-by-frame (only 1 trial was excluded). The averages of the variables from the three turns were used as the representative measures. The turns were recorded with two digital action video cameras (HERO 9 Black, GoPro Inc., USA) with a resolution of 1080 pixels and a sampling rate of 120 Hz, holding them stationary at 2.5 m and 5 m from the wall, with the optical axes parallel to the sagittal plane, and at 1 m depth.
The tumble turn variables were obtained through indirect photogrammetric methodology, analysing the videos of the swimmers’ trials and considering T2.5m-out as the tumble turn performance variable, defined as time lag between the feet first contact with the wall and the passage of the swimmers’ greater trochanter of the femur through the 2.5 m mark (see Table 1 for variables definition). A calibration zone was established by placing two calibration marks in the pool, at 2.5 m and 5 m from the wall. These marks served as reference to adjust for the influence of camera position and perspective on the measurements. Cameras were synchronized using a visual cue (i.e., LED flash) recorded at start, with frame alignment performed offline. Merged 2D trajectories were used for the final kinematic variables and measure the minimum greater trochanter height to the wall. The swimmer's data was acquired through meticulous observations conducted by a single evaluator using in-house customized software designed for performance analysis. 38 The intraclass correlation coefficient (ICC) was computed to verify the absolute agreement between repeated measures for each trial, obtaining an almost perfect correlation (ICC: .979–.999). The “Cinalysis” software was utilized to compute the calibration coefficients through a 2D direct linear transformation (2D-DLT) method involving a calibration plane (3.99 × 2.08 m) with 46 calibration points in Matlab 2016 (MathWorks Inc., Natick, Mass., USA). The calibration error was quantified by assessing the reprojection error, resulting in root-mean-square errors (RMSE) of 5.3 and 4.9 mm of the reconstructed calibration marker positions for the x- and y-axis, respectively.
Statistical analysis
The normality of all the variables was assessed using Shapiro-Wilk's test. Pearson's product-moment correlation coefficients (r) were conducted to examine the associations between tumble turn and DJ variables. Spearman's correlation coefficients (rho) were applied for all variables that did not exhibit a normal distribution. For significant focal associations, scatterplots were produced with least-squares linear fit and 95% confidence band for the mean fit. For Pearson and Spearman fits, R2 and Rho2 were reported, respectively. The threshold correlation values were defined as: trivial (≤ 0.1), small (> 0.1–0.3), moderate (>0.3–0.5) large (> 0.5–0.7), very large (> 0.7–0.9), and extremely large (> 0.9–1.0). 39
To explore directional, preliminary trends in multivariable associations, sex-specific stepwise linear regressions were run with T2.5m-out as the dependent variable. 40 Candidate predictors were TIG, PB50mFR, GCT, JH, RSI, and body length. Stepwise criteria were p-in ≤ 0.05 and p-out ≥ 0.10. Model assumptions (normality, linearity, homoscedasticity, independence) were checked; for the final models we report multicollinearity (tolerance, VIF) and residual independence (Durbin–Watson). To provide convergent evidence, a network analysis based on z-scored values was performed in RStudio (RStudio Inc., Boston, MA) using the “qgraph” package to create the network figure. 41 Following methods used in previous swimming studies, centrality measures (betweenness, closeness, and strength) were computed to determine each variable's relational role.42,43 The level of significance was set at p < 0.05 and the rest of the statistical procedures were performed using SPSS version 29 (IBM Chicago, IL, USA). Then, a post hoc power and sensitivity analysis was performed for two-tailed bivariate correlations and for the linear multiple regressions (fixed model, R2 deviation from zero) using G*Power version 3.1.9.7 (Universität Düsseldorf, NRW, Germany). 44
Results
Table 2 shows the descriptive values (mean and standard deviation) of the main variables analysed. The associations between DJ and tumble turn variables are presented by sex in Figure 2. Figure 3 depicts sex-specific scatterplots corresponding to the reported correlations (with linear fits, 95% confidence bands and R2/Rho2 values). For females, JH was correlated with VxWCTact and Vx2.5m-out (p < 0.05; r = 0.71; 0.73; 95% CI [0.16, 0.96]; [0.47, 0.96], respectively). TIG showed positive association with T2.5m-out (p < 0.05; r = 0.76; 95% CI [0.38, 0.95]). For males, JH displayed positive association with VxWCTact and VOW (p < 0.05; rho = 0.9; 0.75; 95% CI [0.7, 0.97]; [0.11, 0.99], respectively). The TIG was negatively related to T2.5m-out (p < 0.05; r = -0.67; 95% CI [-0.95, −0.08]). The RSI was correlated with VxWCTact (p < 0.05; rho = 0.7; 95% CI [0.48, 0.82]). Observed statistical power for the reported correlations ranged from 0.56 to 0.97 based on a sample size of n = 9 per sex, α = 0.05, and the observed effect sizes (r/rho = |0.67–0.90|). 44 Complementarily, a sensitivity analysis (α = 0.05, 1−β = 0.80, n = 9) indicated a minimum detectable correlation of r = 0.79 (two-tailed) and, for the two-predictor regression, a minimum detectable effect of f2 = 1.84 (R2 = 0.65).
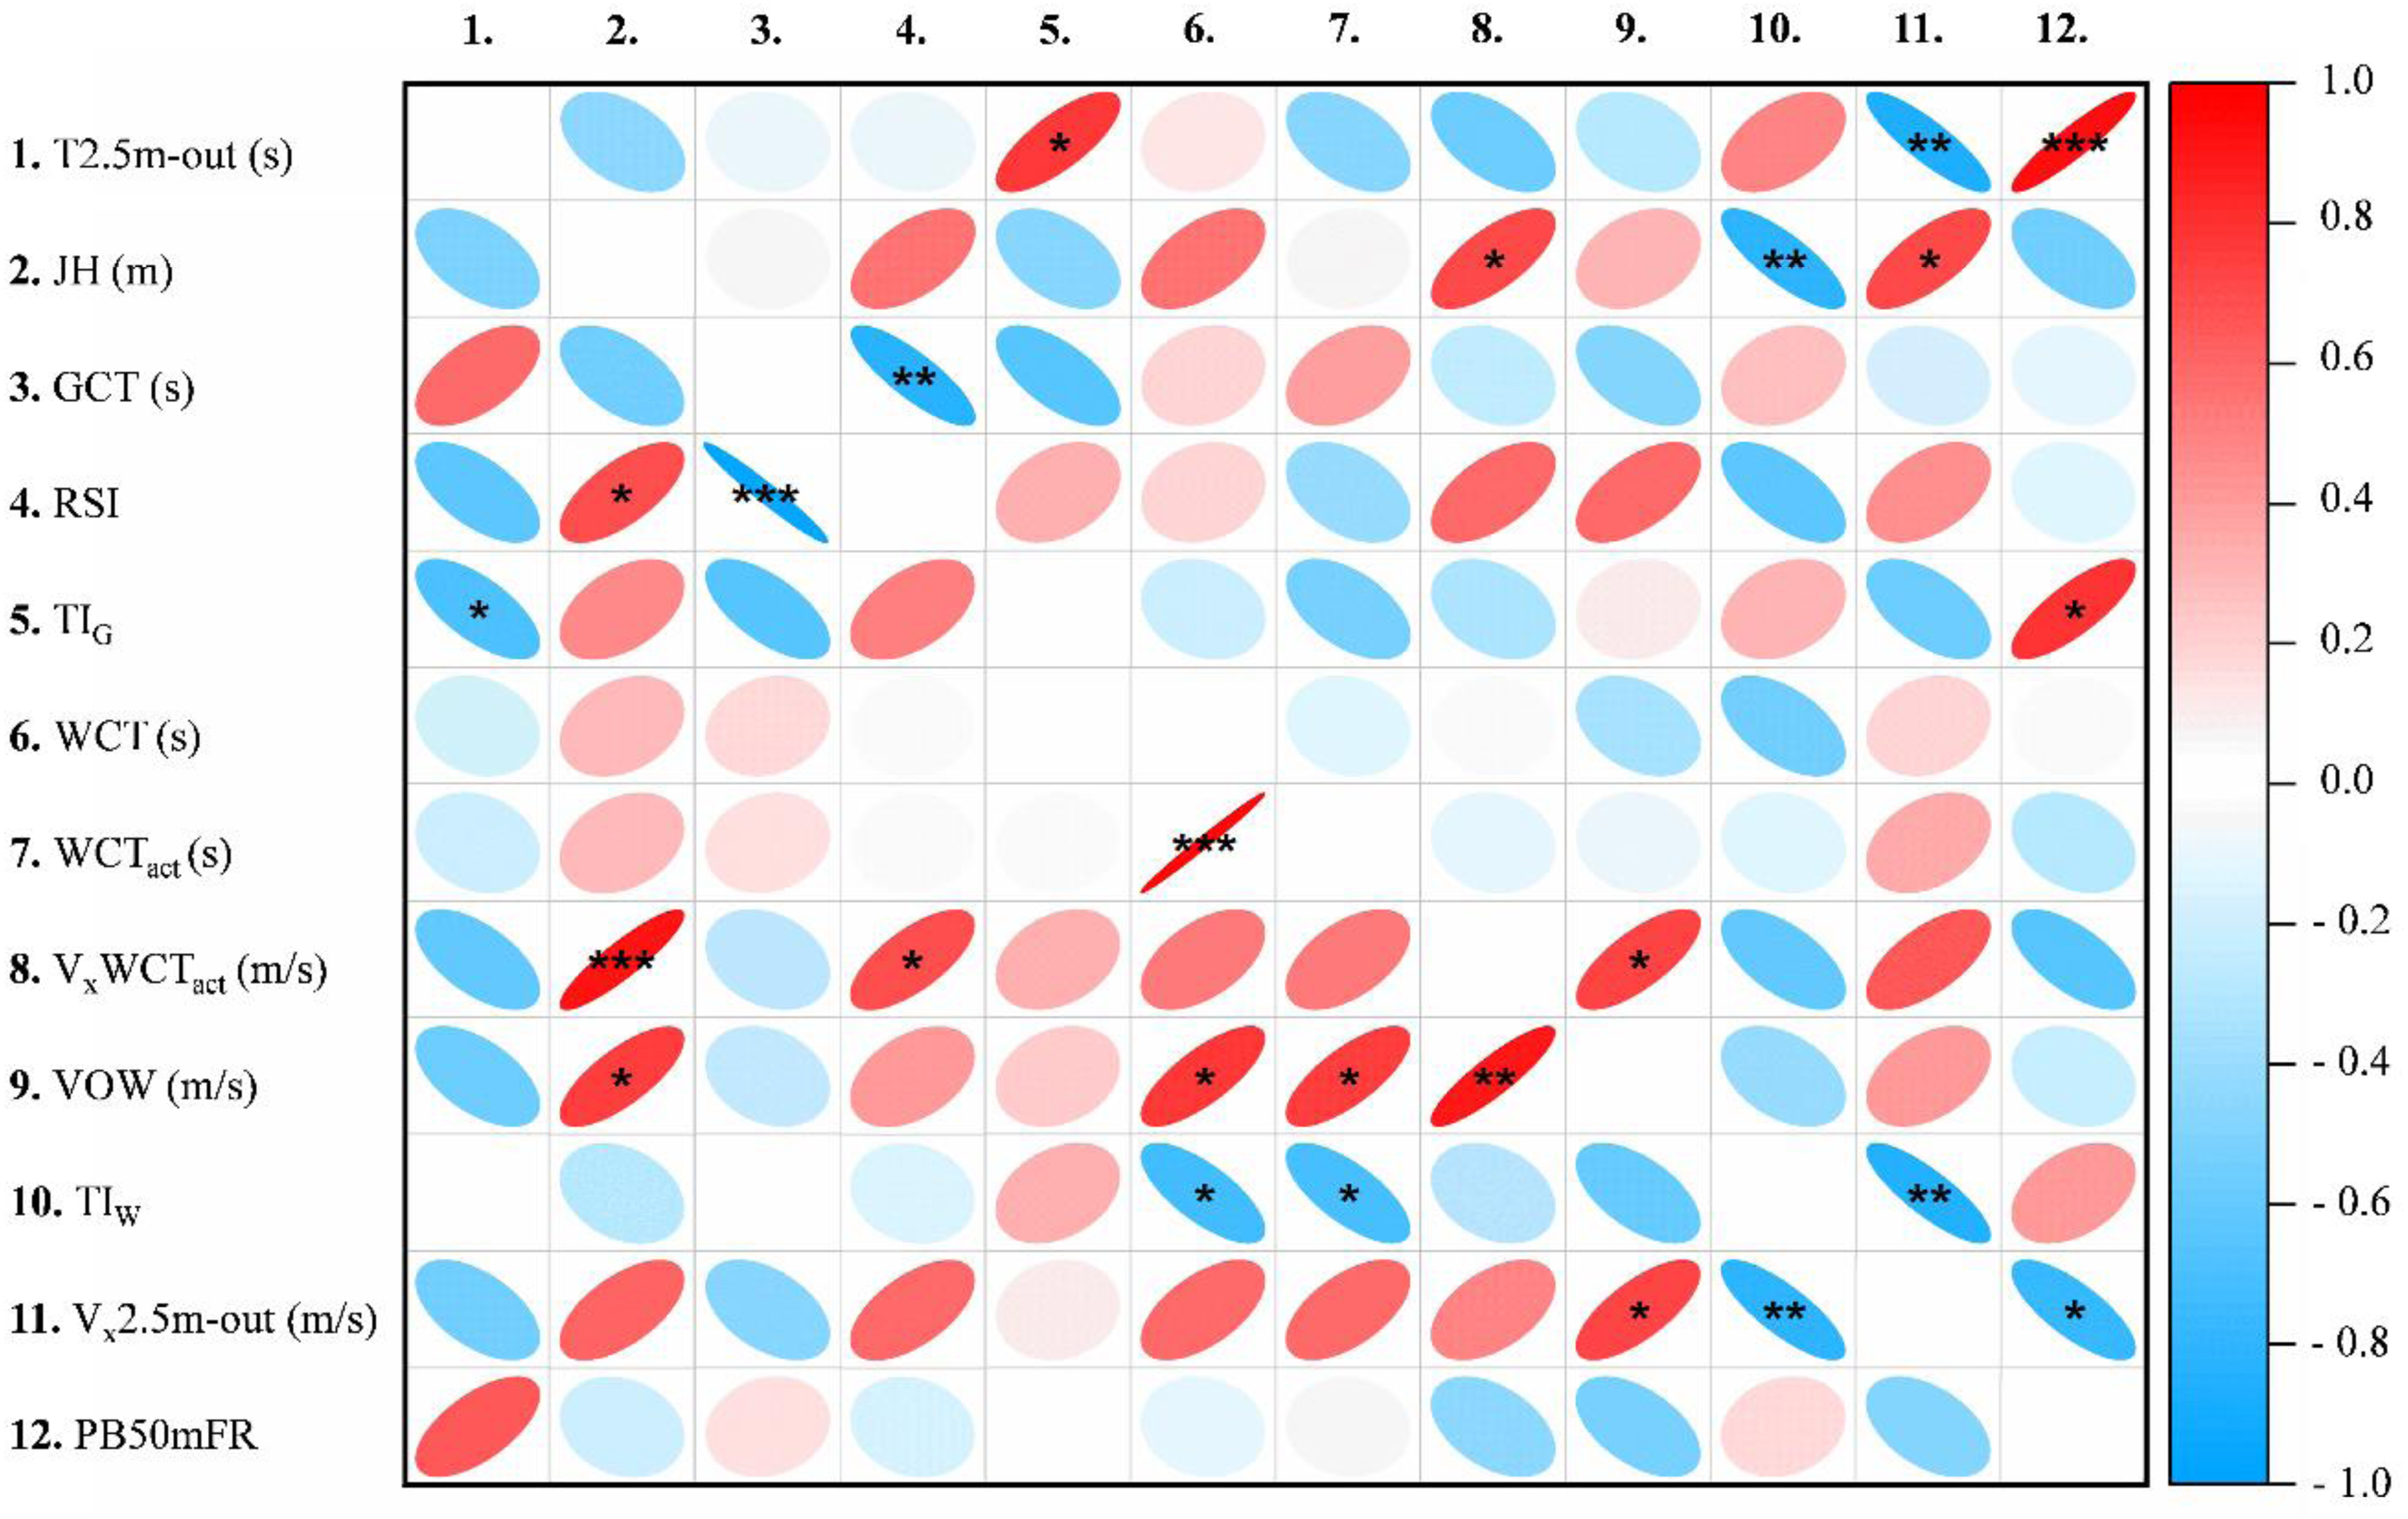
Correlation plot between DJ and tumble turn variables. Ellipses with a positive slope indicate a positive correlation and with a negative slope indicate a negative correlation. Female: upper triangular matrix; male: lower triangular matrix. *p < 0.05; **p < 0.01; *** p < 0.001.
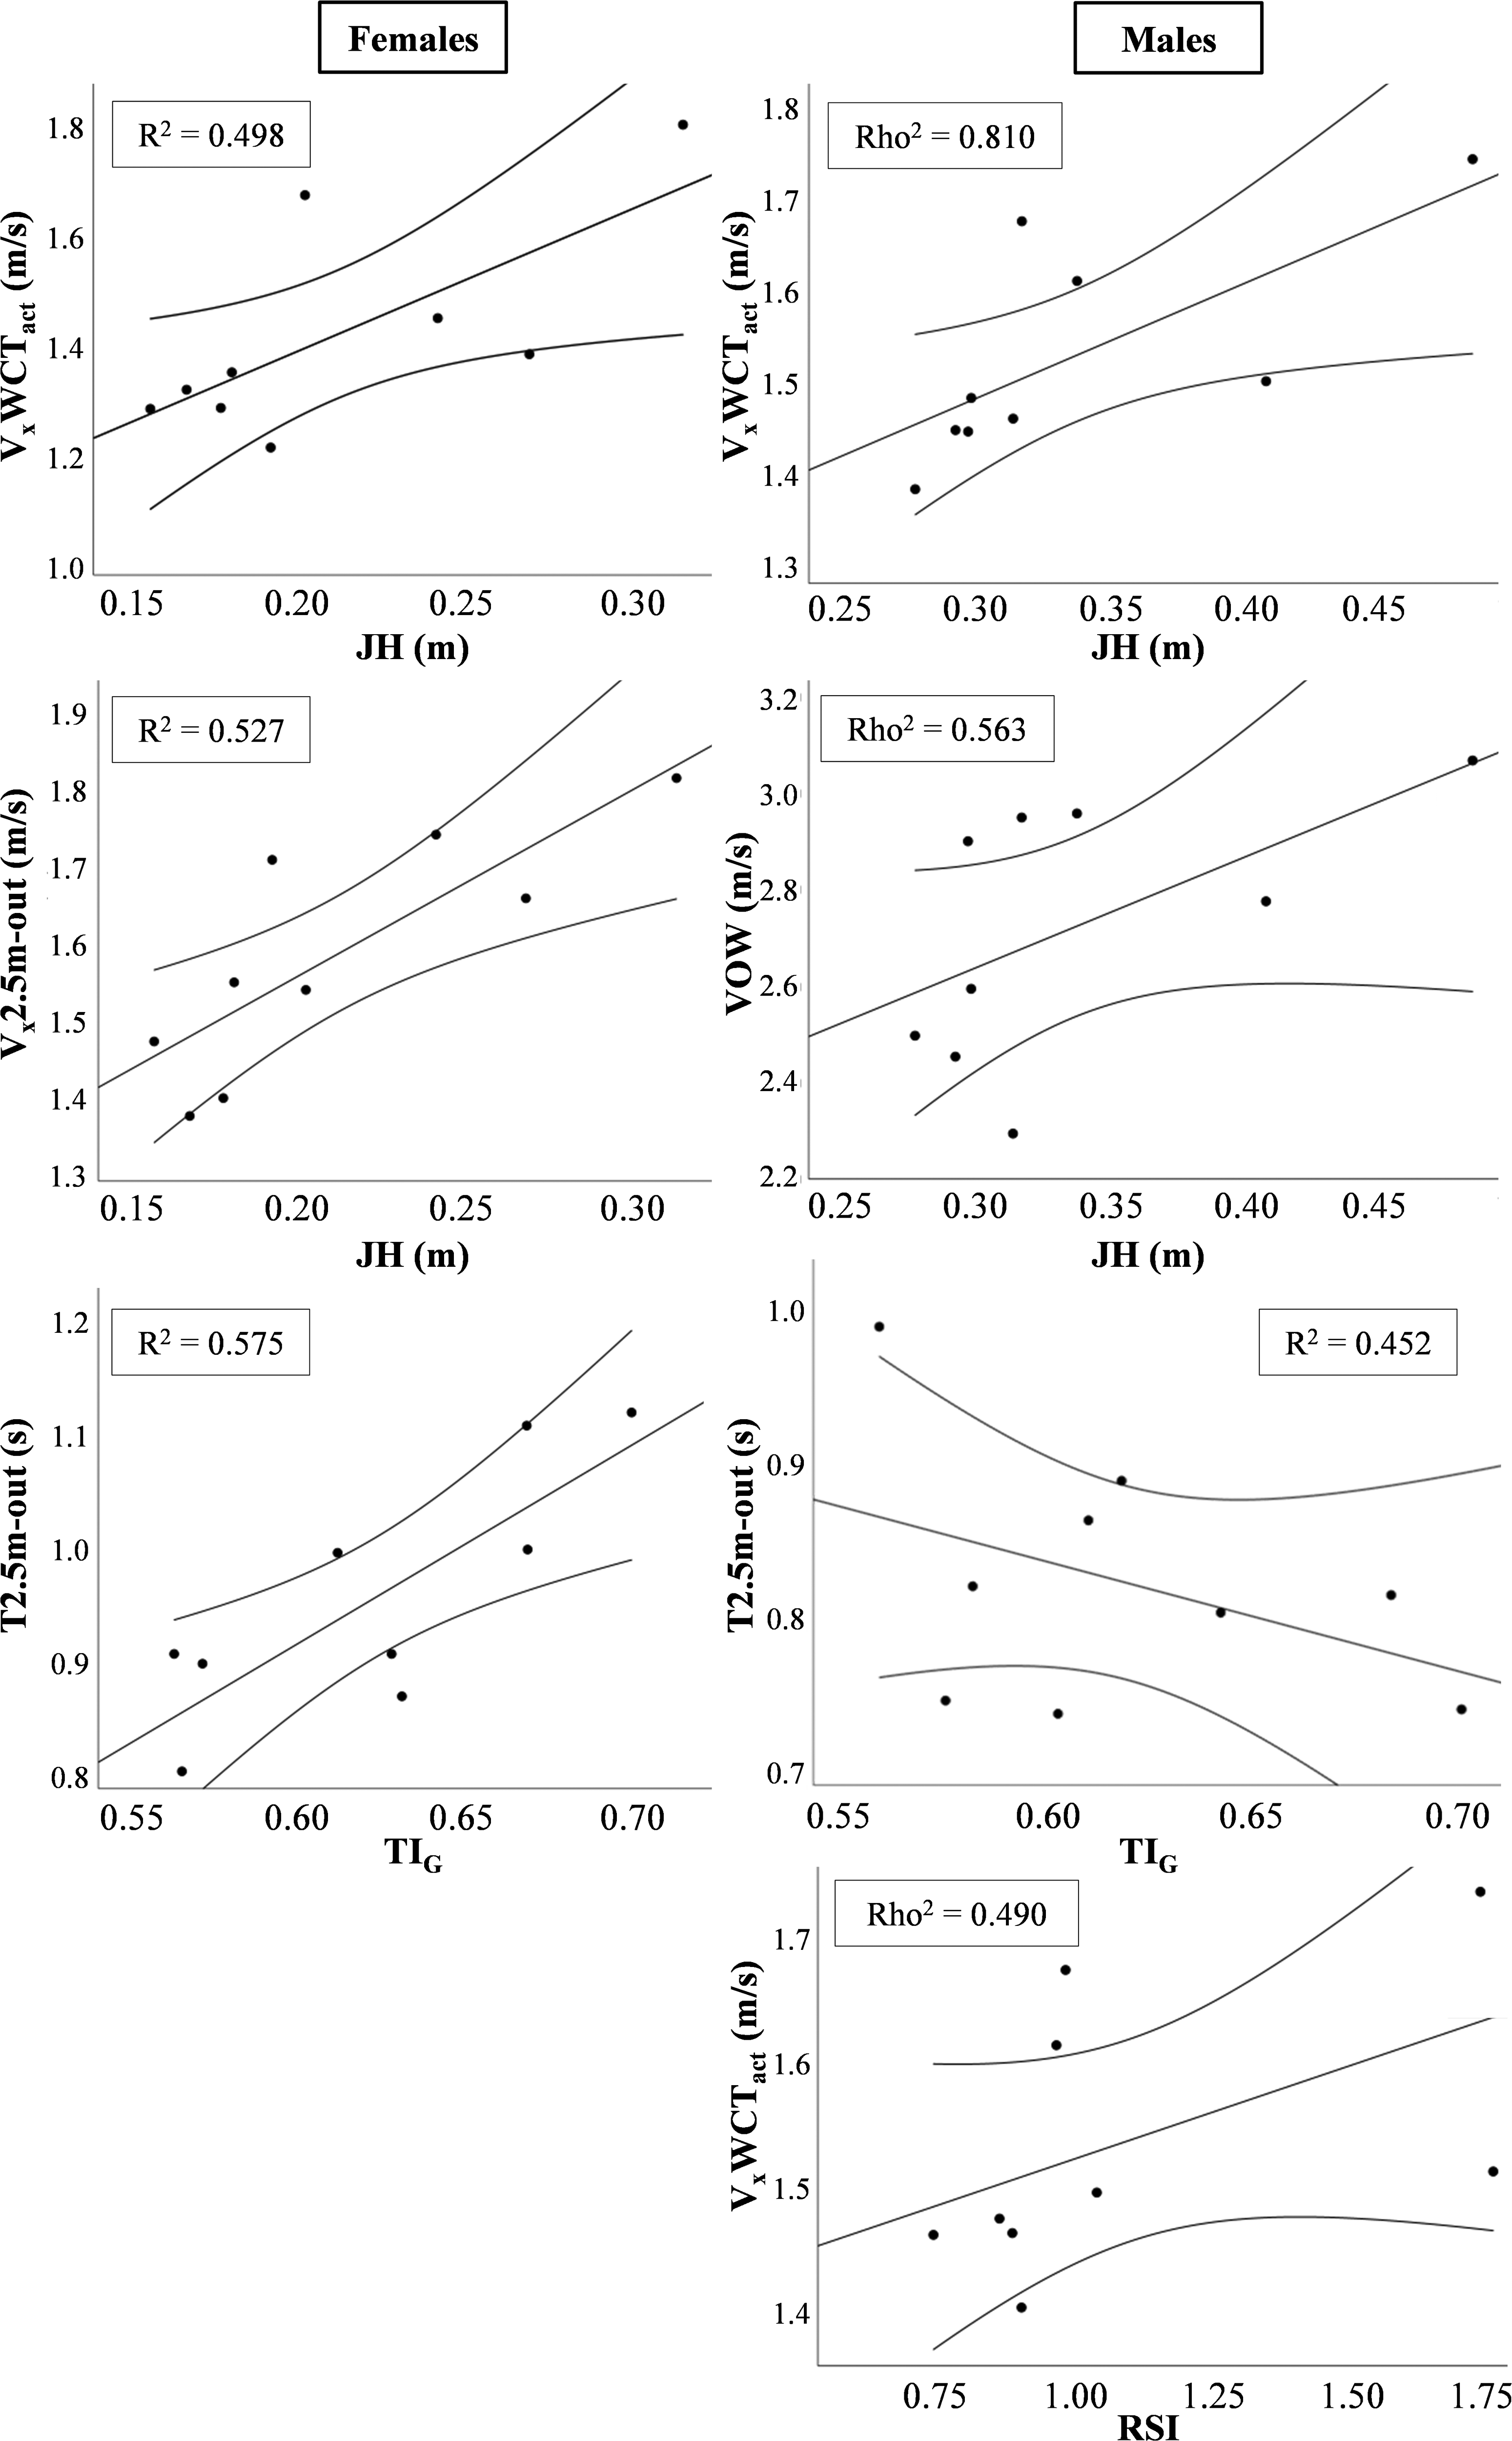
Sex-specific scatterplots with linear fit and 95% confidence band for the mean fit. R2 (Pearson) or Rho2 (Spearman) is shown in each panel. T2.5m-out = time from wall contact to 2.5 m; JH = jump height; RSI = reactive strength index; TIG = tuck index in the drop jump; VxWCTact = mean horizontal velocity during WCTact; VOW = velocity off wall; Vx2.5m-out = mean horizontal velocity during T2.5m-out.
The mean ± standard deviation (SD) values for the drop jump and tumble turn variables for female (n = 9) and male (n = 9) adolescent swimmers.
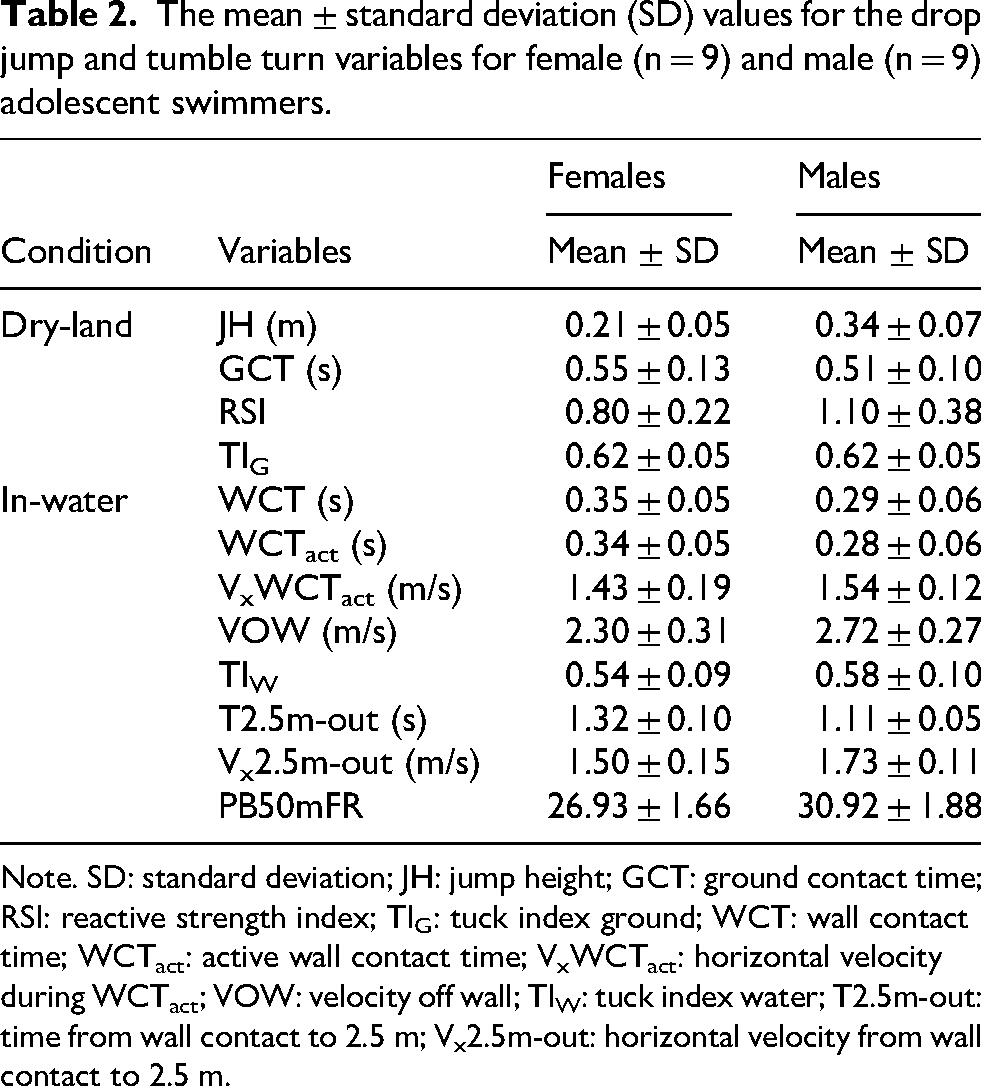
Note. SD: standard deviation; JH: jump height; GCT: ground contact time; RSI: reactive strength index; TIG: tuck index ground; WCT: wall contact time; WCTact: active wall contact time; VxWCTact: horizontal velocity during WCTact; VOW: velocity off wall; TIW: tuck index water; T2.5m-out: time from wall contact to 2.5 m; Vx2.5m-out: horizontal velocity from wall contact to 2.5 m.
In females, the final stepwise multiple regression model retained TIG (β = 1.224, p < 0.001) and GCT (β = 0.714, p < 0.01), explaining R2 = 0.866 (adjusted R2 = 0.822; SEE = 0.0418 s; F (2,6) = 19.44, p < 0.01; f2 = 6.46). Diagnostics: VIF = 1.00 (tolerance = 1.00) for TIG and VIF = 1.74 (tolerance = 0.574) for GCT; Durbin–Watson = 2.50. In males, the final model retained TIG (β = -0.669, p = .004) and PB50mFR (β = 0.650, p < 0.01), explaining R2 = 0.875 (adjusted R2 = 0.833; SEE = 0.0198 s; F (2,6) = 20.93, p < 0.01). The corresponding effect size was f2 = 7.00. Diagnostics: VIF = 1.00 (tolerance = 1.00) for both predictors and Durbin-Watson = 2.87. For both models, visual inspection of residuals showed no meaningful departures from normality or homoscedasticity. A post hoc power analysis indicated an observed power of 0.99 for both models based on the sample size (n = 9), α = 0.05, and the respective effect sizes. 44 The raw and standardized regression coefficients and partial correlations of the predictors are shown in Table 3.
Multiple linear regression models to predict tumble turn performance for female (n = 9) and male (n = 9) adolescent swimmers.
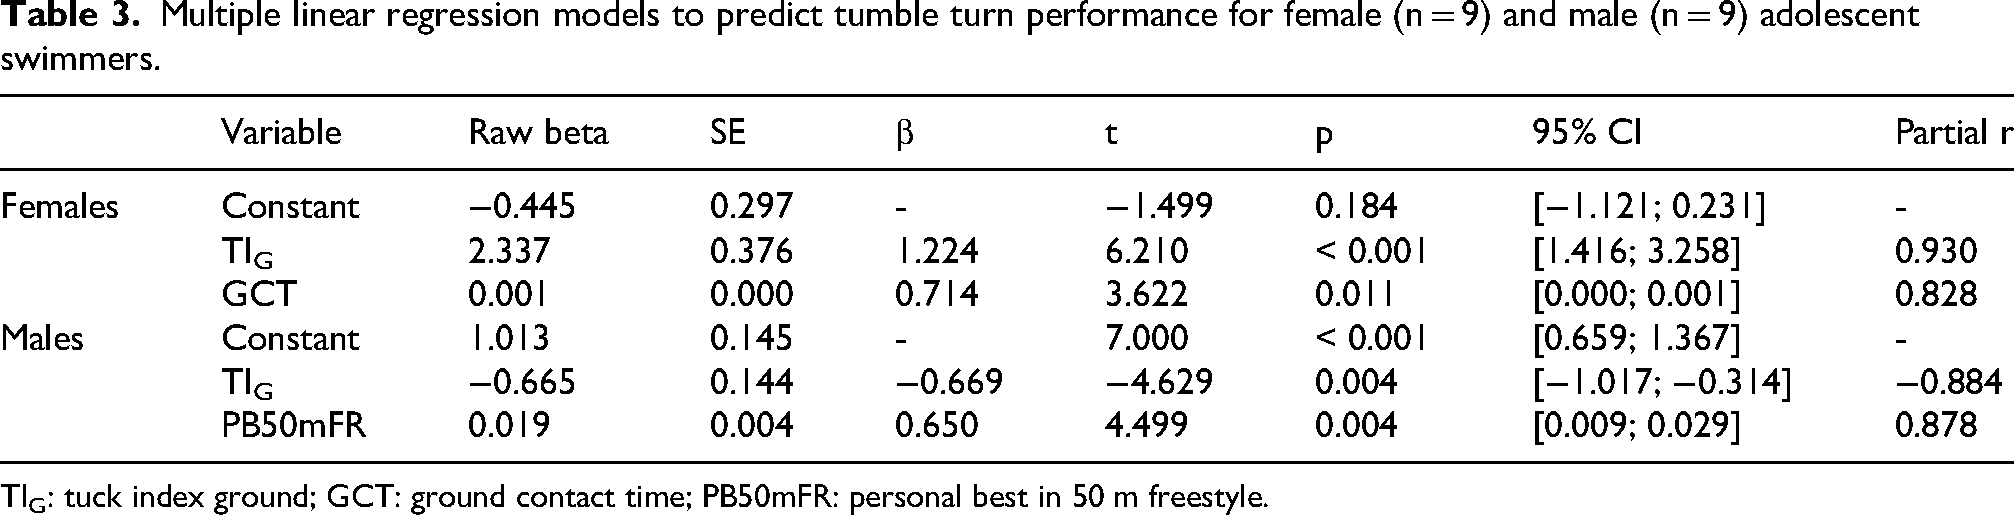
TIG: tuck index ground; GCT: ground contact time; PB50mFR: personal best in 50 m freestyle.
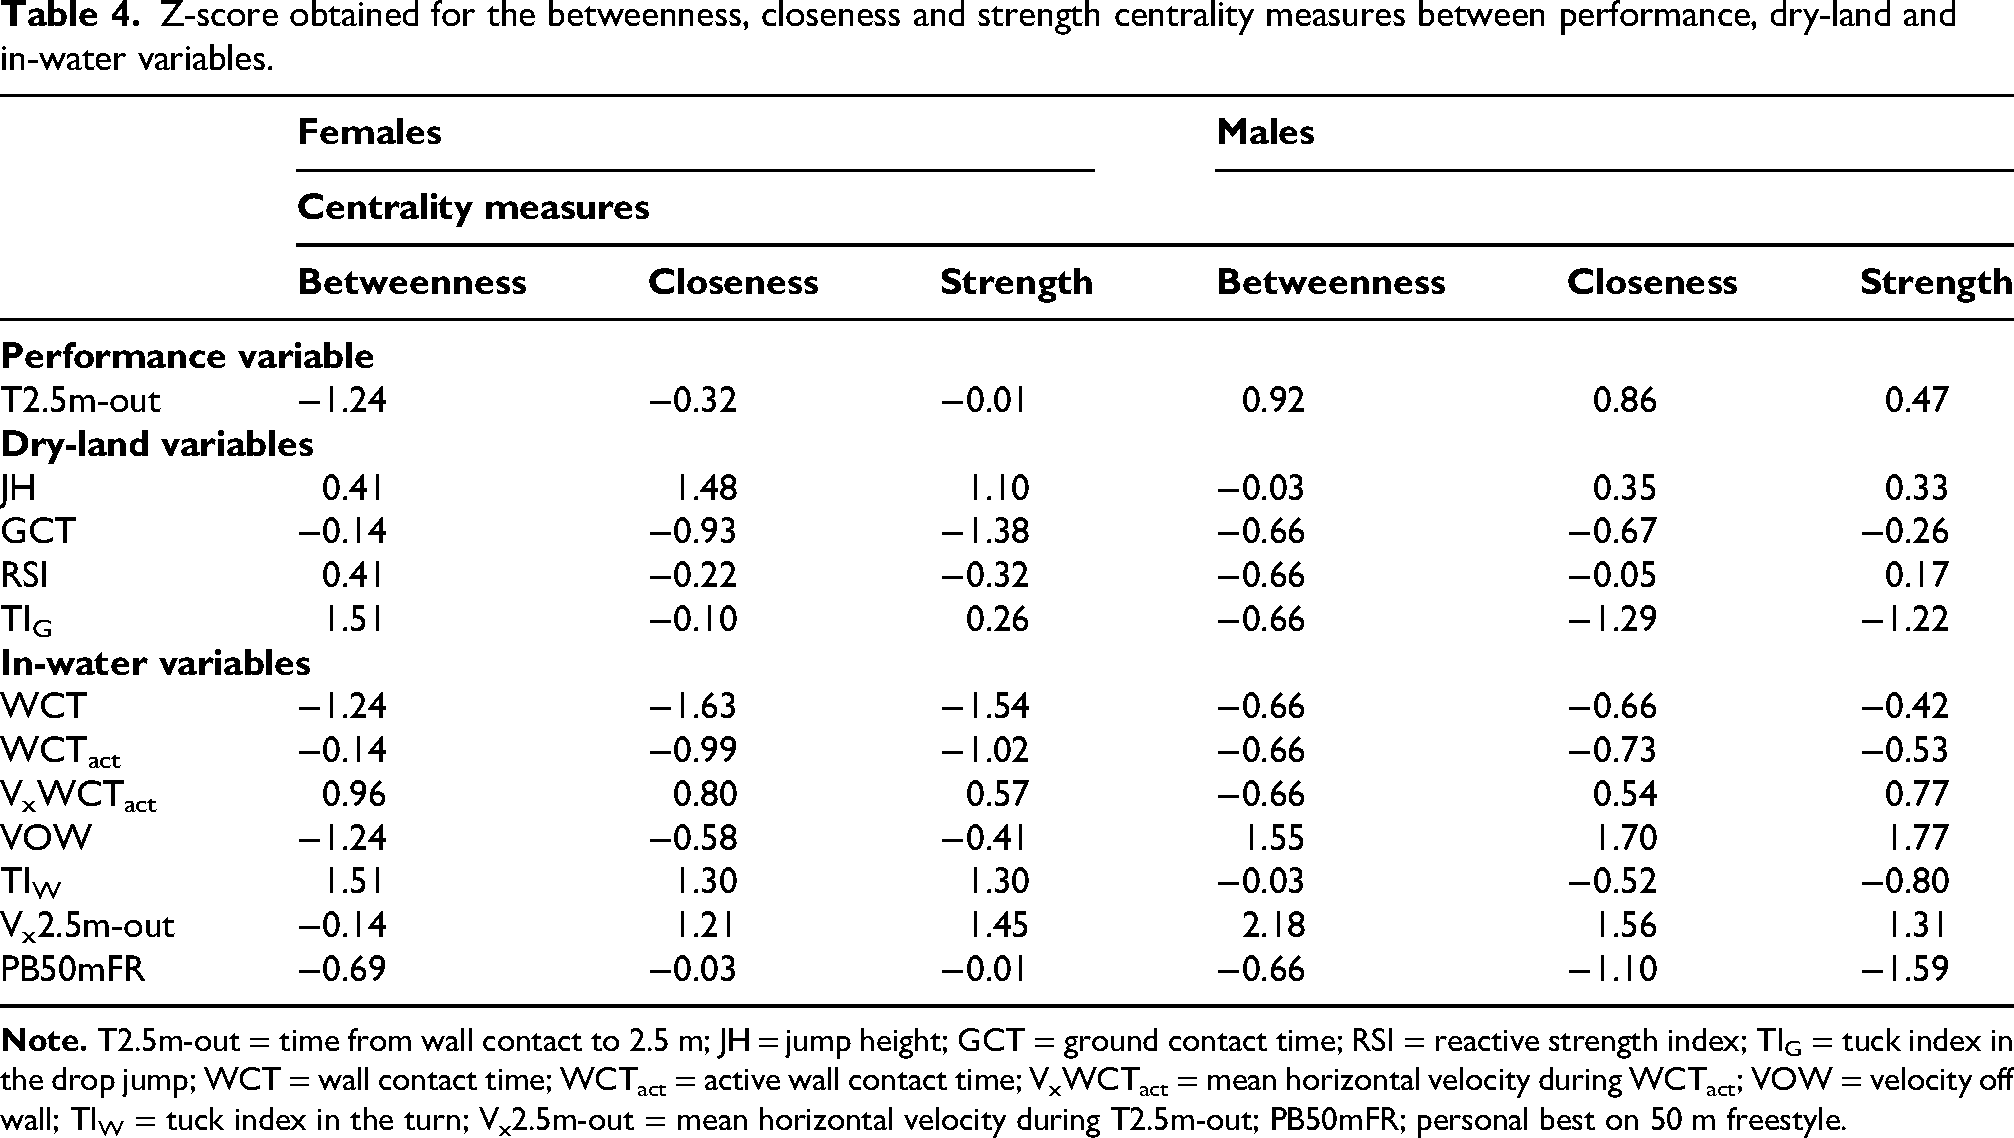
The network of associations between T2.5m-out (i.e., swimming performance) and dry-land and in-water variables are shown in Figure 4. In females, TIG showed notable betweenness, while JH and TIW displayed higher closeness/strength (Table 4). In males, VOW showed the greatest overall centrality, and Vx2.5m-out acted as a bridge (high betweenness), whereas TIG exhibited negative centrality consistent with its inverse association (Table 4).
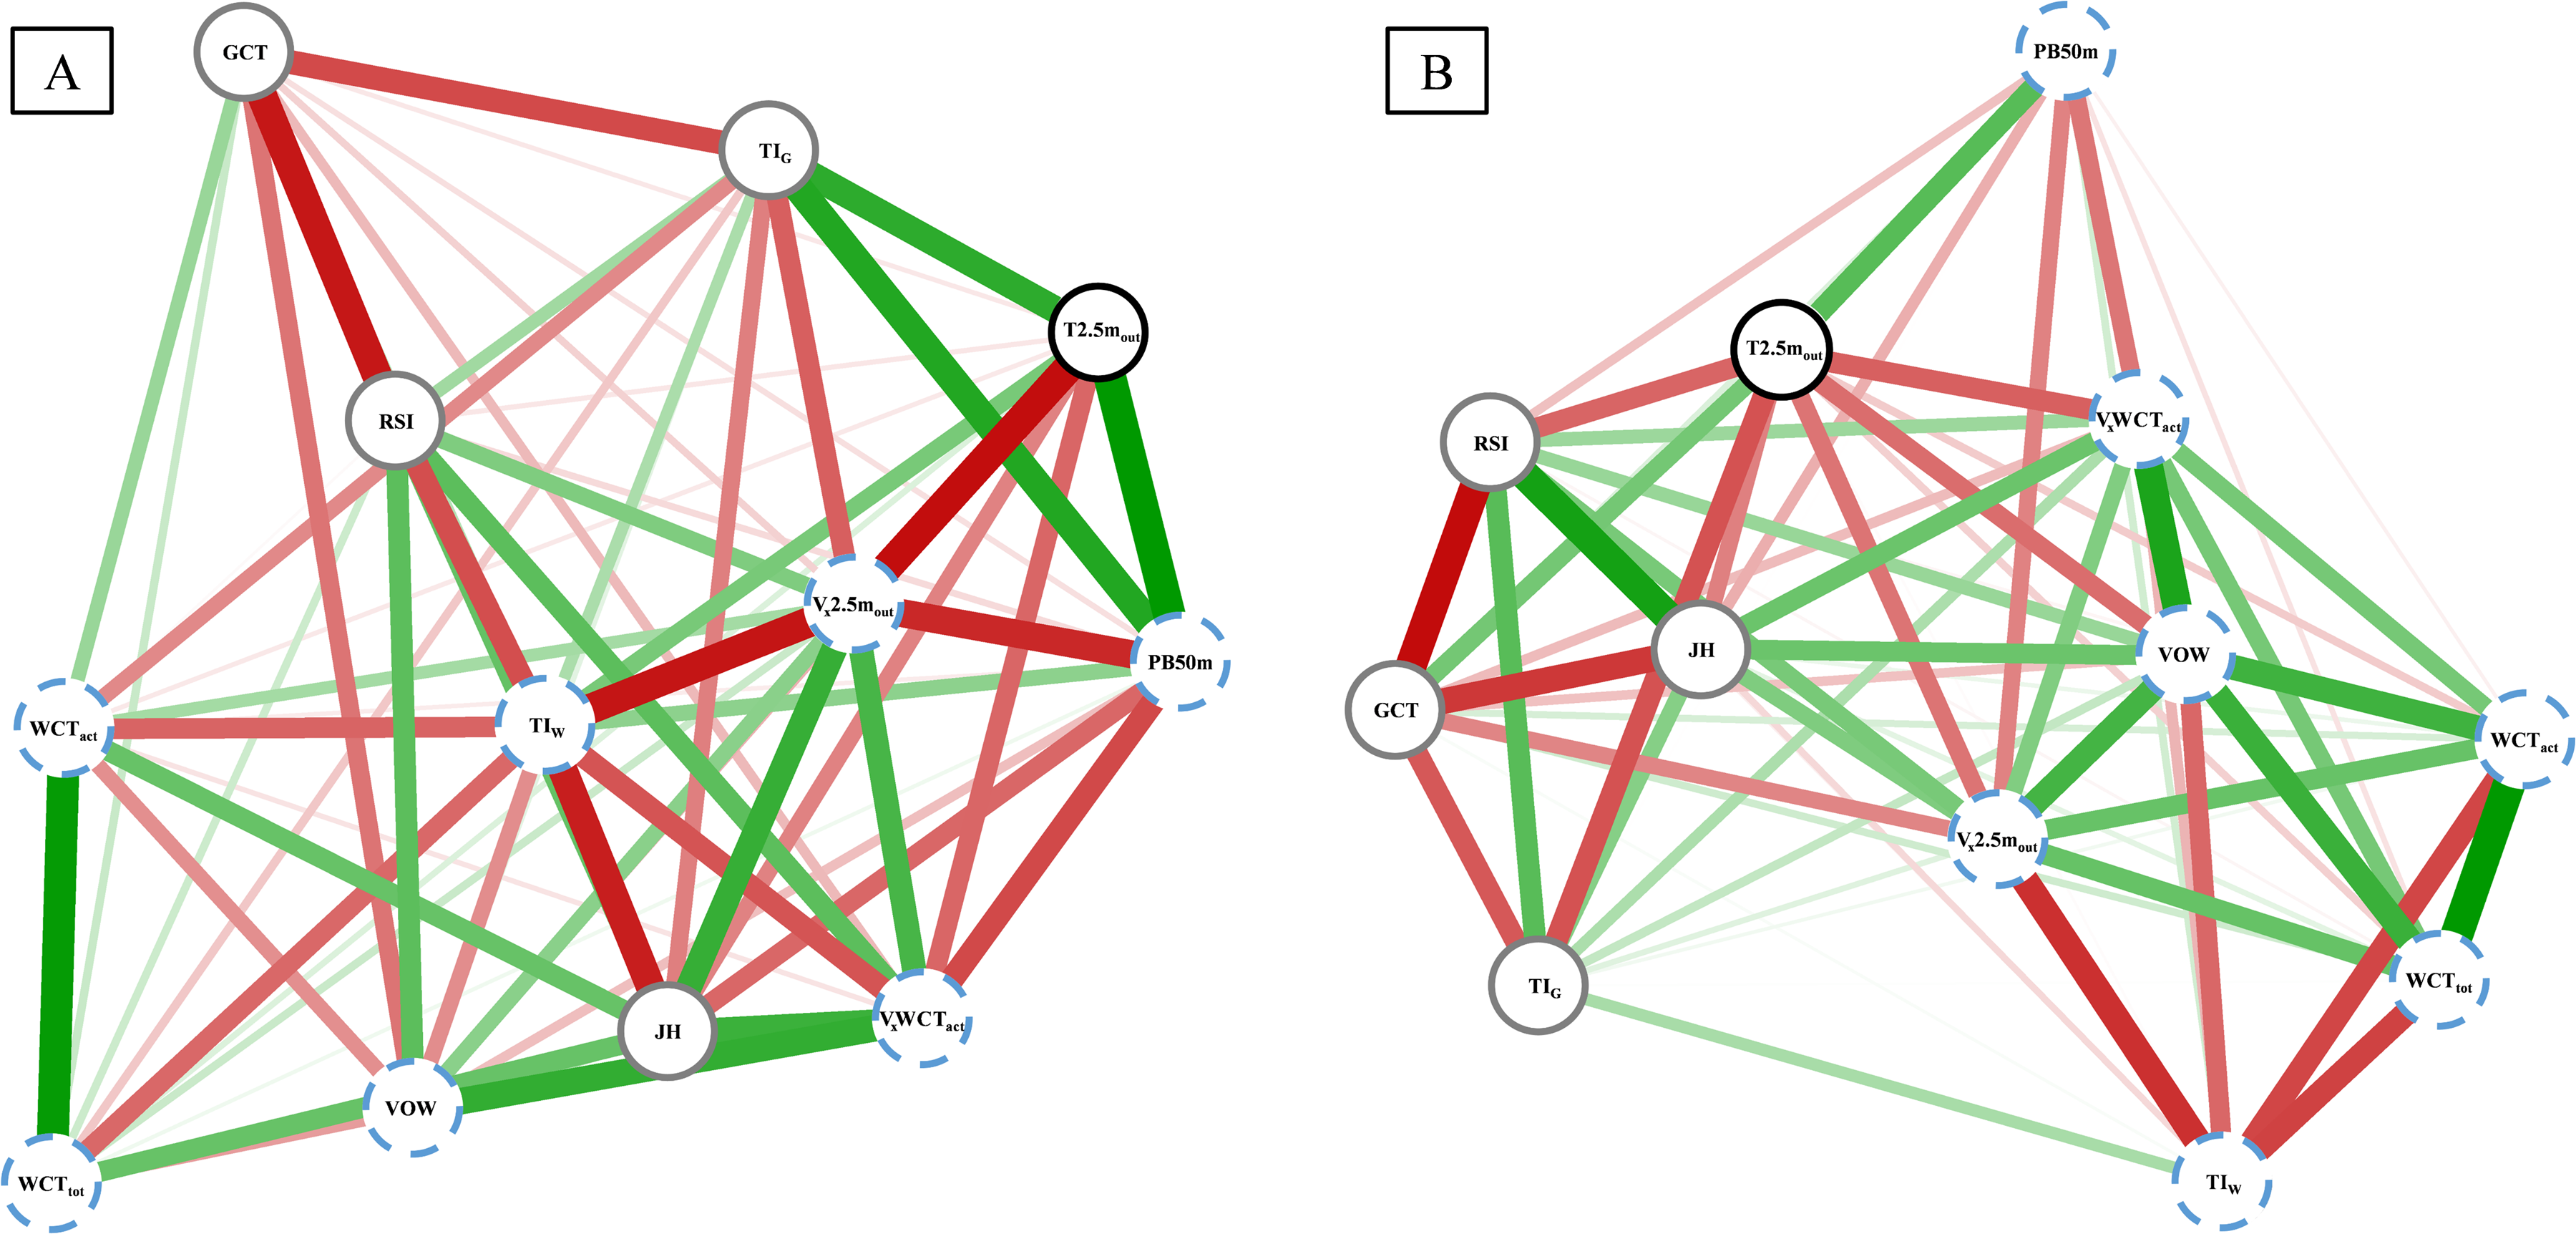
Network analysis of correlations between tumble turn performance (solid black circle), dry-land (solid grey circles) and in-water (dashed blue circles) variables in adolescent females’ (A) and males’ swimmers (B), n = 9 both sexes. The positive and negative relationships are represented in green and red, respectively. The thickness and intensity of the colors indicate the magnitude of the associations. T2.5m-out = time from wall contact to 2.5 m; JH = jump height; GCT = ground contact time; RSI = reactive strength index; TIG = tuck index in the drop jump; WCT = wall contact time; WCTact = active wall contact time; VxWCTact = mean horizontal velocity during WCTact; VOW = velocity off wall; TIW = tuck index in the turn; Vx2.5m-out = mean horizontal velocity during T2.5m-out; 2.5mRTT = 2.5 m round trip time; PB50mFR; personal best on 50 m freestyle.
Z-score obtained for the betweenness, closeness and strength centrality measures between performance, dry-land and in-water variables.
Discussion
This study aimed to analyse the relationship between the DJ variables and the tumble turn performance and to explore which DJ variables may predict the tumble turn performance. In keeping with this exploratory framing, as hypothesized, swimmers with higher DJ performance tended to exhibit better tumble turn performance. The main findings of this study show that the JH correlated with VxWCTact for females and males, the TIG showed association with the T2.5m-out for both sexes, and linear stepwise multiple regressions provided preliminary, hypothesis-generating models of T2.5m-out for females and males with TIG as the main predictor for both cases.
Different types of jumps have been used to test the relationship between JH and swimming performance.14,16,17,21,45–47 In this study, the JH obtained in the DJ was related to VxWCTact for both female and male swimmers (Figure 2), suggesting that a higher JH is associated with better push-off from the wall and hence better tumble turn performance. This outcome may be explained by the similarity of both movements (i.e., DJ and tumble turn), which consist of performing a caudal-cranial thrust against a resistance (drag and gravity, respectively). In addition, JH for females was strongly correlated with Vx2.5m-out and, for males, with VOW; two sequential horizontal-velocity metrics that act as proximal determinants of early-phase turn performance and are typically associated with shorter T2.5m-out.10,25 These findings suggest that rapid force production, as indexed by DJ, influences not only wall contact mechanics but also downstream glide and exit velocities, even without accounting for morphological factors such as frontal area or drag coefficient. 48 The strength of our correlations exceeded those typically reported in prior studies using squat jump or CMJ height (studies where performance was operationalized as 5 m post-turn time) with the exception of the females’ JH against CMJ correlation reported in those studies.16,49
The TIW has been extensively analysed for its relationship to tumble turn performance.10,16,36,37,50 However, to explore whether this in-water relationship transfers to a similar dry-land exercise, this research focused on the association between TIG and tumble turn performance. Our results showed that females presented a positive correlation between TIG and T2.5m-out, whereas a negative correlation with T2.5m-out for males was observed. These results suggest that female swimmers who maintain a more tucked legs position during the DJ cover the 2.5 m after the turn faster than those with straighter legs. On the contrary, males who keep a straighter leg position during the DJ tend to reach the 2.5 m in less time than their counterparts. These variations may be attributed to sex-induce differences, as males exhibit a greater capacity to produce force in a shorter time than females. 12 This means that males are more efficient in SSC exercises, a fact that is boosted in adolescence due to maturational factors. 12 Therefore, it is important to seek a balance between the force applied and its application time, as the advantage gained from applying greater force may be offset by a longer WCT. As our kinematic measurements focused on tuck depth (joint-angle profiles were not measured), these interpretations should be viewed with caution.
In this study, no significant association was found between RSI and VxWCTact for females, while a strong correlation was observed for males. This lack of correlation in females may reflect greater variability in the RSI components (especially JH, and to a lesser extent GCT) within this subgroup, which can dominate the ratio and decouple RSI from VxWCTact. Based on its calculations (i.e., RSI = JH/GCT), a decrease in GCT (even with stable JH) can lead to increased RSI. Therefore, a shorter GCT implies applying more force in less time (i.e., a higher average net force and rate of force application during push-off). In practice, when JH and GCT vary, the reduction in time often exerts a larger impact on the ratio than modest changes in JH. An additional, theoretical explanation involves body-composition differences between sexes, particularly the amount and distribution of adipose tissue (i.e., accumulation around the hips in females vs. around the waist in males). 51 These differences may have a greater impact in aquatic environments compared to dryland, affecting drag coefficient and velocities close to the push-off wall. 48
The predictive models accounted for the variance in T2.5m-out similarly for both females and males, with TIG contributing more significantly for females (57.4%) compared to males (45.2%). The large contribution of the TIG may be attributed to the fact that greater proximity of the hips to the wall in the turn requires a larger extension travel during push-off, thereby increasing WCT. Consistent with plyometric terminology, we use DJ to denote a short-amortization task with limited knee flexion, and “depth jump” to denote unrestricted leg flexion and a longer amortization. 24 In this framework, adopting a depth-jump-like strategy to the tumble turn may increase JH and potentially VOW by generating a larger impulse, however, the associated prolongation of WCT would be detrimental in a sport where performance is time-based. 37 Nonetheless, no leg-angle kinematics were measured in either task, and further confirmation is required. However, the contribution of TIG (higher values indicates a shallower flexion) varied between sexes, being positive for females and negative for males. In females, the positive TIG may be attributed to the requirement for a longer eccentric phase to generate sufficient force to minimize T2.5m-out, despite a higher WCT due to greater compensatory acceleration. In the case of males, the negative TIG may be explained by the need for a shorter eccentric phase to leverage the SSC because of their superior neuromuscular capabilities. 12 Consequently, a relatively shallower flexion enables more rapid force application, which appears to reduce T2.5m-out with only limited increases in WCT. Conversely, deeper flexion (i.e., lower TIG/TIW) may allow for higher instantaneous acceleration and could yield greater JH on land 52 ; however, in the water it tends to prolong WCT and thereby lengthen T2.5 m-out, without offsetting the associated cost. These sex-specific interpretations fit the observed pattern but remain tentative, as we did not directly measure the underlying mechanisms.
In addition, the second predictive variable was GCT (29.2%) for females and the PB50mFR for males (42.3%). The contribution of the GCT was hypothesized, since applied to the wall in a tumble turn plays a crucial role and a large part of the time of the T2.5m-out. For males, the influence of T2.5m-out on 50 m freestyle performance has been demonstrated in the model, consistent with the correlations observed in previous studies. 36 These contributions are also in line with the estimated contributions in models for sub-elite males and females during 5m-in to 5m-out turn segments. 53 In the abovementioned models, for females, WCT contributed more than for males, while for males, speed-in had a much larger influence compared to WCT, the same occurring in the present study but with the variables GCT and PB50mFR.
The combined interpretation of the regression and network analyses highlights the transfer pathway from dry-land to in-water performance (Figure 4 and Table 4). Variables such as TIG and GCT represent the dry-land foundation of rapid force production and coordinative capacity, but their impact on performance becomes evident only through their integration with in-water technical actions, mainly those related to wall contact and transition velocity. The high centrality of in-water variables (e.g., VOW, TIW, Vx2.5m-out) indicates that they act as functional bridges, mediating how dry-land qualities are expressed in water. In this sense, performance in the T2.5m-out phase depends not only on the magnitude of dry-land abilities but on how efficiently these are transferred through key aquatic connections. This network structure reinforces the concept that training for performance should optimize the translation of dry-land qualities into specific in-water skills rather than treating them as isolated domains. 54
Given the small sex-stratified samples, these multivariable models were treated as hypothesis-generating indicators and should be interpreted with caution, as small sample increases the risk of Type I/II error and limits generalizability of the results. Hence, external validation in larger cohorts is warranted. Alongside stepwise regression, a network analysis mapped conditional associations and mitigated collinearity, providing convergent support without substituting for formal validation. The main limitation of this study was the inability to control hydrodynamic position: although T2.5m-out was used as the performance variable, propulsion and drag could have been influenced, and (even in a relatively homogeneous training group) differences in streamline position could have affected the results. 48 In addition, we could not account for individual morphological, neuromuscular, and technical factors that may mediate the DJ-turn relationship and contribute to unexplained variance. Future studies should consider the analysis of different ages and performance levels and, ideally, compare forces applied with electromyography or force plate for both specific movements to strengthen biomechanistic inference. Further research may also consider incorporating the lower limbs dynamic strength index (DSI) as a complementary neuromuscular indicator, as it may provide additional insight into the force–velocity characteristics underlying push-off efficiency during tumble turns and help to better elucidate the transfer between dry-land neuromuscular capacities and in-water technical performance.
Conclusion
DJ was related to the tumble turn, and the way this dry-land exercise is performed may influence in-water performance. In this exploratory analysis, variation in TIG may be related to changes in the time spent in the GCT, which could potentially influence the T2.5m-out, a preliminary finding given the sex-stratified sample size. Practically, extremes of tuck depth may be suboptimal; accordingly, it is important to avoid using a TIG that is too low, as this could result in a longer GCT; or too high, as this may reduce neuromuscular and SSC capabilities. Both extremes may negatively impact T2.5m-out, considering the individuality of each swimmer. Hence, the working TIG target may be that one that could allow the adoption of a correct streamlined position during the tumble turn, allowing a powerful push-off from the wall and minimizing the T2.5m-out.
Coaches and athletes should consider the relationship between the DJ and the tumble turn when incorporating dry-land exercises. It is important to maintain elements such as WCT, SSC, and the rebound mechanics inherent in the swimming turn, focusing not only on the JH but also on the technique used to achieve it (i.e., the technical gesture). In line with these observations, emphasizing a specific TIG may contribute to improved performance, e.g., performing as a classic DJ on dry-land may be more beneficial than a “depth jump”. Moreover, the transferability of DJ movements to swimming turns highlights its value as both a training and assessment tool. As prospective implications, monitoring these variables can provide coaches and scientists with valuable insights for monitoring swimmers’ performance throughout the season, but these observations should be followed by external validation and, where feasible, targeted interventions.
Footnotes
Acknowledgments
The authors would like to sincerely thank all swimmers and coaches involved in this study for their valuable time, commitment, and collaboration. Their contribution was fundamental to the successful completion of this research.
Ethical considerations
This study was approved by the Ethics Committee in Human Research of the University of Granada (approval number: 3256/CEIH/2023, approved on 12 September 2023) and was conducted in accordance with the Declaration of Helsinki.
Consent to participate
Written informed consent to participate was obtained from all participants and/or their legal guardians prior to inclusion in the study.
Funding
This study was supported by the Grant PID2022-142147NB-I00 (SWIM III) funded by MICIU/AEI/10.13039/501100011033/ and by ERDF, EU. AFC holds an FPI fellowship, which is funded through the aforementioned grant.
Declaration of conflicting interests
The authors declared no potential conflicts of interest with respect to the research, authorship, and/or publication of this article.
Data availability
The datasets generated and/or analysed during the current study are available from the corresponding author on reasonable request.