
Abstract
This study aimed to clarify how ball launch angle and initial velocity influence flight distance in goal kicks performed by elite youth soccer goalkeepers, and to identify the launch angles associated with maximal distance. Six goalkeepers from the same elite youth team performed maximal-effort place kicks on a stationary ball, simulating goal-kick conditions. The three-dimensional ball motion was recorded using an optical motion capture system (500 Hz), and launch angle and initial velocity were calculated. For each participant, a linear regression model describing the angle–velocity relationship was constructed. Flight distance was then estimated using two-dimensional numerical trajectory simulations under a no-spin assumption.
Across all participants, initial velocity consistently decreased as launch angle increased, although the strength of this relationship and the regression characteristics varied markedly between individuals. Simulations based on measured launch angles and velocities showed that flight distance increased with launch angle within the observed range. When the launch angle range was extrapolated from 5° to 50°, the angle–distance relationship exhibited a quadratic pattern, with maximal flight distances typically occurring at launch angles between approximately 25° and 30°.
These findings indicate that the optimal launch angle for goal kicks is not uniform, but instead depends on each goalkeeper's individual angle–velocity characteristics. This study highlights the importance of individualized, biomechanics-based optimization of launch conditions, rather than relying on a single, standardized angle, for maximizing goal-kick distance in soccer.
Introduction
Goal kicks are one of the most important technical skills required of soccer goalkeepers, and long-distance kicks in particular play a key role in modern attacking strategies. In match play, goalkeepers perform goal kicks more frequently than goal-saving actions, 1 and in the English football league, approximately 92.3% of goal kicks are executed as long kicks. 2 Moreover, long goal-kick strategies have been reported to be more strongly associated with offensive success than short-kick approaches. 3 In addition to restarts, the ability to kick the ball over long distances is also crucial for clearances and long passes under pressure. 4 Accordingly, elite player development programs, such as the French Football Federation's Pôle Espoir, incorporate long-kick training under match-like conditions. 5 Despite their tactical importance, however, the success rate of long kicks, including goal kicks, is not necessarily high in both youth and elite goalkeepers. 6 This indicates a need to refine current knowledge and identify the key mechanical factors that determine long-kick performance, particularly ball flight distance.
Previous sports science research has primarily focused on ball velocity as the main determinant of kicking distance. For skilled players, generating an appropriate launch angle is often considered relatively easy, and maximum ball velocity has therefore been widely used as a performance indicator. 7 However, in real match environments, the influence of launch angle on flight distance cannot be ignored. For example, long goal kicks performed with high launch angles under strong headwind conditions have been reported to result in insufficient distance, with the ball even being pushed back toward the goalkeeper's own goal line.8,9 During the 2010 FIFA World Cup in South Africa, the effects of high-altitude conditions on ball trajectories also attracted considerable attention, 10 and the instability of the official match ball “Jabulani” was widely discussed. One contributing factor was suggested to be the interaction between launch angle and aerodynamic characteristics. 11 These examples highlight the necessity of considering launch angle, in addition to ball velocity, when evaluating the effectiveness of long kicks.
Players are known to control ball launch angle by adjusting the foot–ball impact location and foot posture during the kicking action.12,13 Such adjustments are accompanied by changes in lower-limb joint angles and in the distance between the support foot and the ball at ground contact. 14 Moreover, kicking mechanics vary according to the required kicking distance, with distinct movement patterns observed for different distance conditions. 15 These findings suggest that long-kick performance should be evaluated by considering the combined effects of launch angle and ball velocity, rather than focusing on velocity alone.
From a biomechanical perspective, ball flight distance is determined by both initial velocity and launch angle. Under idealized conditions without air resistance, a launch angle of approximately 45° is theoretically optimal for maximizing range.16,17 In real soccer kicks, however, air resistance and ball spin reduce the optimal angle to lower values. Despite this, empirical studies examining launch angles in soccer long kicks remain limited, and the optimal launch angle has not been sufficiently clarified. Most existing research has focused on the accuracy and reproducibility of free kicks,18–21 with target distances typically restricted to around 35 m. Consequently, few studies have examined the angle–distance relationship under conditions resembling match-play long kicks, and the mechanical understanding of distance generation remains incomplete.
In particular, biomechanical data on youth goalkeepers are scarce. Because the youth stage is characterized by rapid physical and technical development, identifying movement patterns and mechanical tendencies at this stage is essential for long-term performance enhancement. Although the present study involved a small sample size (n = 6), all participants belonged to the same elite youth team and trained under identical environmental and coaching conditions. This provided a unique opportunity to minimize environmental variability and examine individual differences in projection conditions under controlled circumstances.
Therefore, the purpose of this study was to investigate how ball launch angle and initial velocity influence flight distance in goal kicks performed by elite youth goalkeepers, using an optical motion capture system and numerical flight simulations. By identifying the launch angles associated with maximal flight distance, this study aimed to provide both theoretical and practical insights for improving long-kick performance in soccer.
Methods
Experimental procedure
Six youth elite goalkeepers competing in the English Champions League participated in this study (age: 19.37 ± 1.07 years; height: 1.89 ± 0.03 m; body mass: 88.82 ± 3.81 kg; mean ± SD). Prior to the experiment, all participants received a detailed explanation of the study purpose, experimental procedures, and potential risks, and provided written informed consent.
After completing a standardized warm-up, each participant performed maximal-effort goal-kick–style place kicks using their preferred kicking foot toward a target located 5 m in front of them. They were instructed to maximize the flight distance of the ball. Participants wore their usual outdoor football boots, and all trials were conducted on an artificial turf surface. Adequate rest was provided between trials to minimize fatigue effects.
Each participant performed at least 10 trials. Trials with marker occlusion or unsuccessful labeling were excluded from analysis. The final dataset consisted of approximately 10 trials per participant, yielding a total of 60 trials (some participants contributed 9 or 11 trials).
Ball motion was captured using an infrared motion capture system (Qqus 300+, Qualisys, Gothenburg, Sweden) at a sampling frequency of 500 Hz (Figure 1). Four reflective markers were attached to the ball surface. The global coordinate system was defined following Lees et al. (2009). 22 Ball center coordinates were reconstructed from the four marker positions using Visual3D software (C-Motion, Germantown, USA).
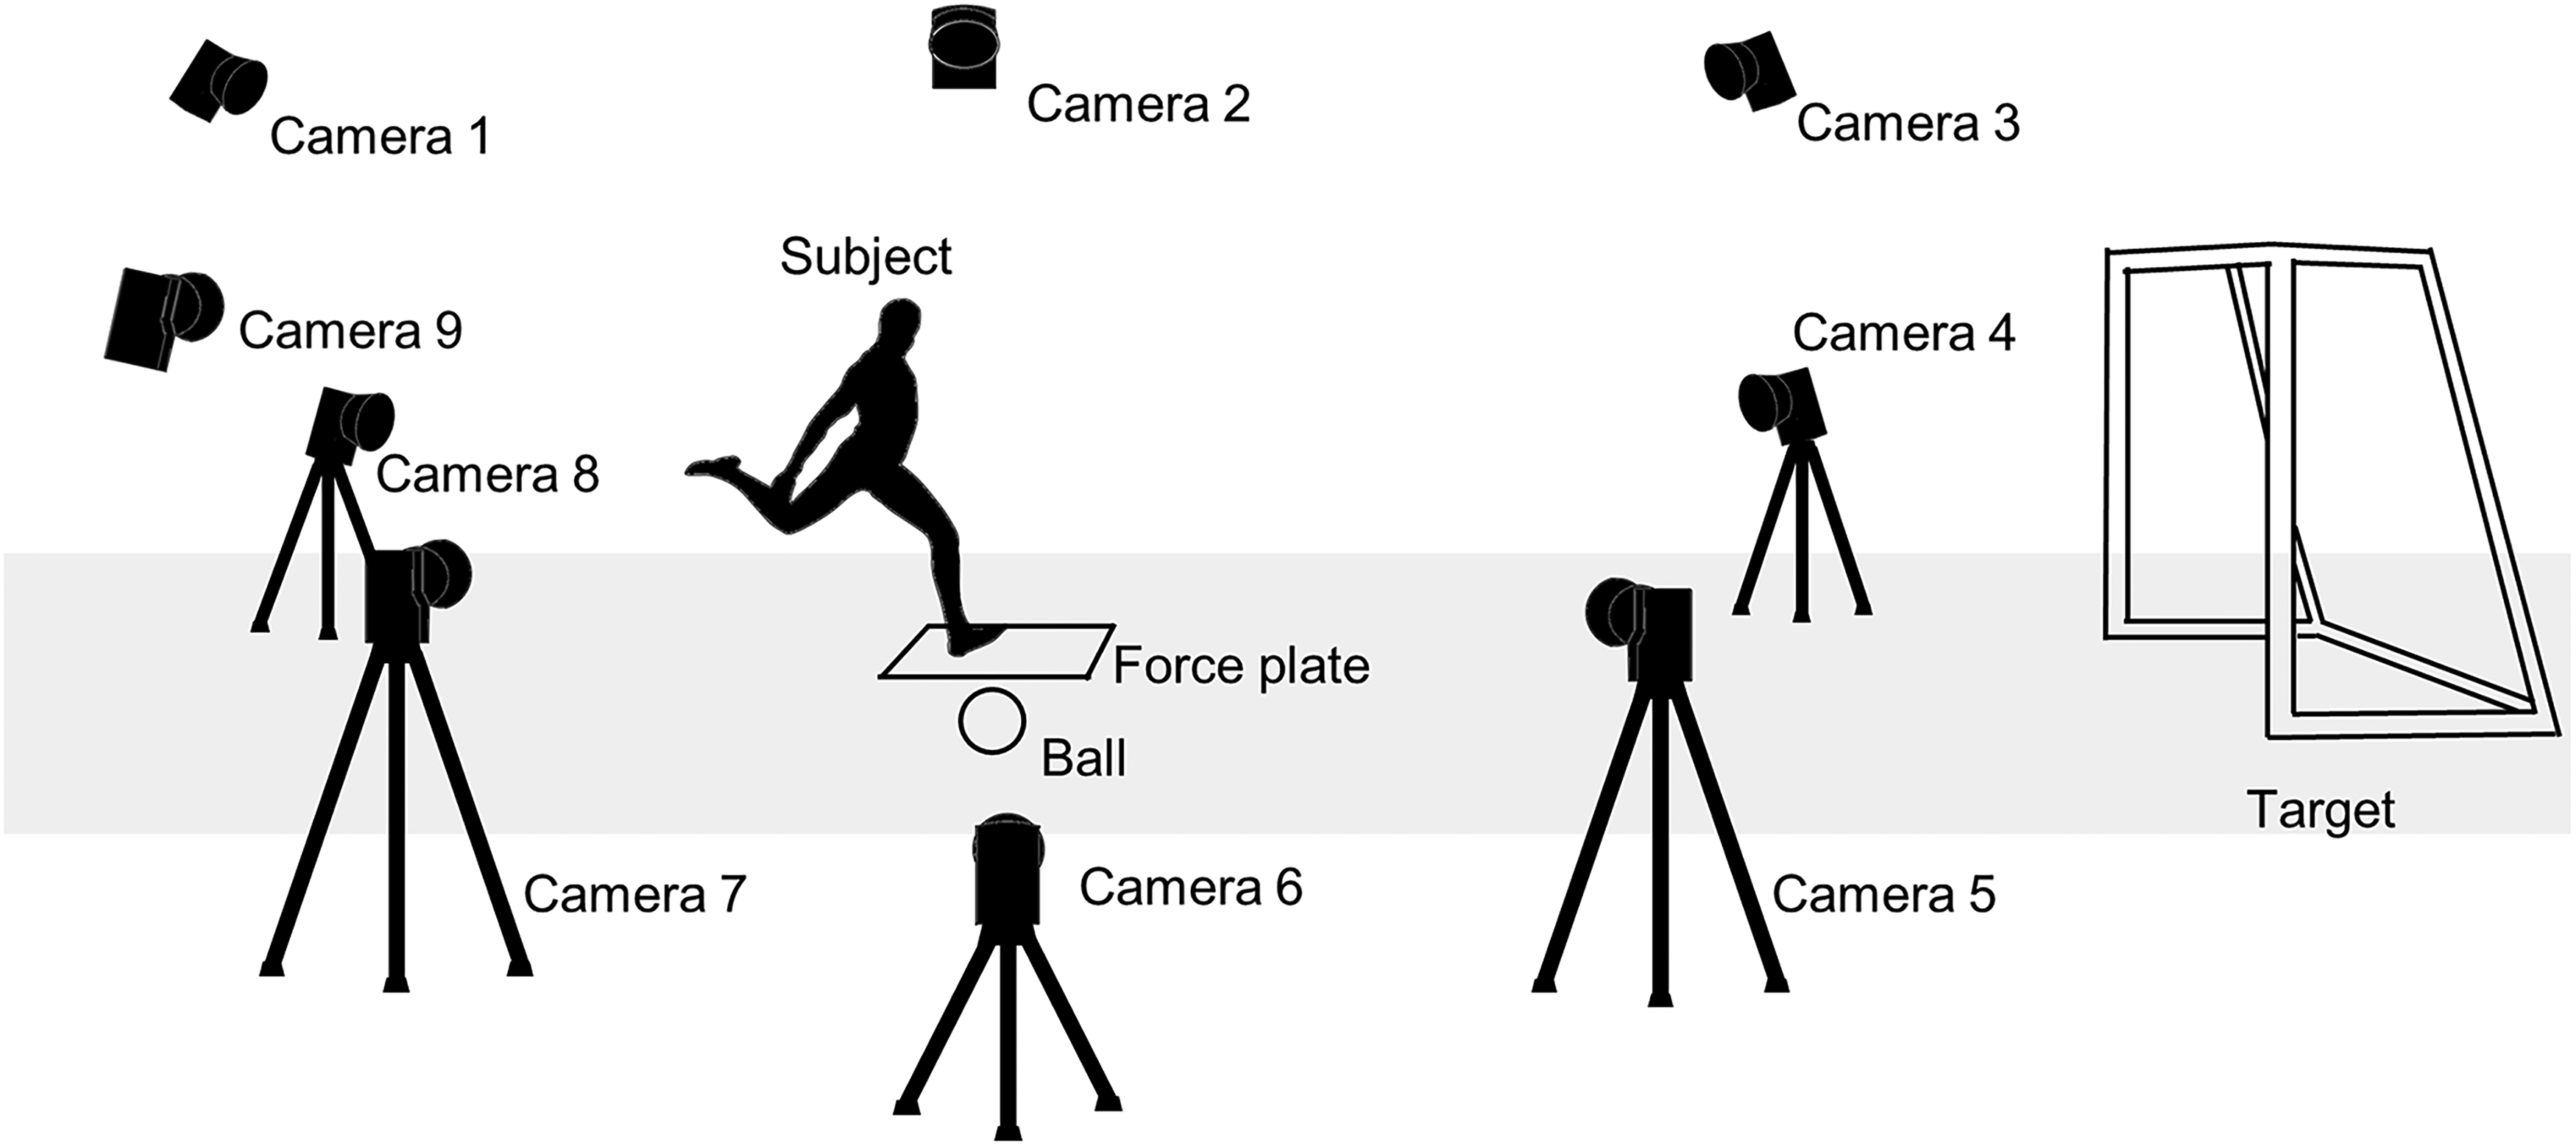
Experimental setup.
The global coordinate system was defined with the vertical axis as z, the anteroposterior axis as y, and the mediolateral axis as x. Ball velocity was calculated as the resultant velocity in the global coordinate system and averaged over 15 frames after ball–foot impact. The ball launch angle was defined as the angle of the velocity vector in the vertical–horizontal plane. 23
For each participant, a linear regression model was constructed to describe the relationship between launch angle and initial ball velocity. Based on this regression equation, ball velocities corresponding to launch angles in 5° increments were estimated. These angle–velocity combinations were then used as input parameters for the flight trajectory simulations to calculate ball flight distance. Additionally, a quadratic regression model was fitted to the relationship between launch angle and simulated flight distance, and the launch angle producing the maximum distance was defined as the estimated optimal launch angle.
Flight trajectory simulation
To evaluate the effects of launch angle and initial ball velocity on flight distance, a two-dimensional ball flight simulation was conducted.
24
The equations of motion were:


Numerical integration was performed using the explicit Euler method with a time step of 0.001 s. The drag coefficient corresponded to that of a 32-panel ball model similar to the ball used in this study. The drag coefficient was interpolated using a sixth-order polynomial function at each time step. Lift and side forces due to ball spin were not considered; only drag under non-spinning conditions was included.
Statistical analysis and regression modeling
All trials were screened for outliers prior to analysis. Data were analyzed separately for each participant to preserve individual performance characteristics.
Simple linear regression models were constructed to examine the relationship between launch angle and initial ball velocity. Model goodness-of-fit was evaluated using the coefficient of determination (R2). The statistical significance of regression coefficients was assessed using t-tests with a significance level of 5% (p < 0.05).
Model validity was further examined by analyzing residuals (measured values minus predicted values). The mean and standard deviation of residuals were calculated to assess systematic bias. Pearson correlation coefficients between residuals and launch angle were computed to evaluate linearity and homoscedasticity assumptions.
All statistical analyses were conducted using JASP (Version 0.95.4) and Microsoft Excel. The study protocol was approved by the institutional ethics committee of Meiji Gakuin University.
Results
Angle–velocity relationship (individual and group-level characteristics)
Figure 2 illustrates the relationships between ball launch angle and initial velocity for each participant. In all six participants, initial ball velocity decreased as launch angle increased.
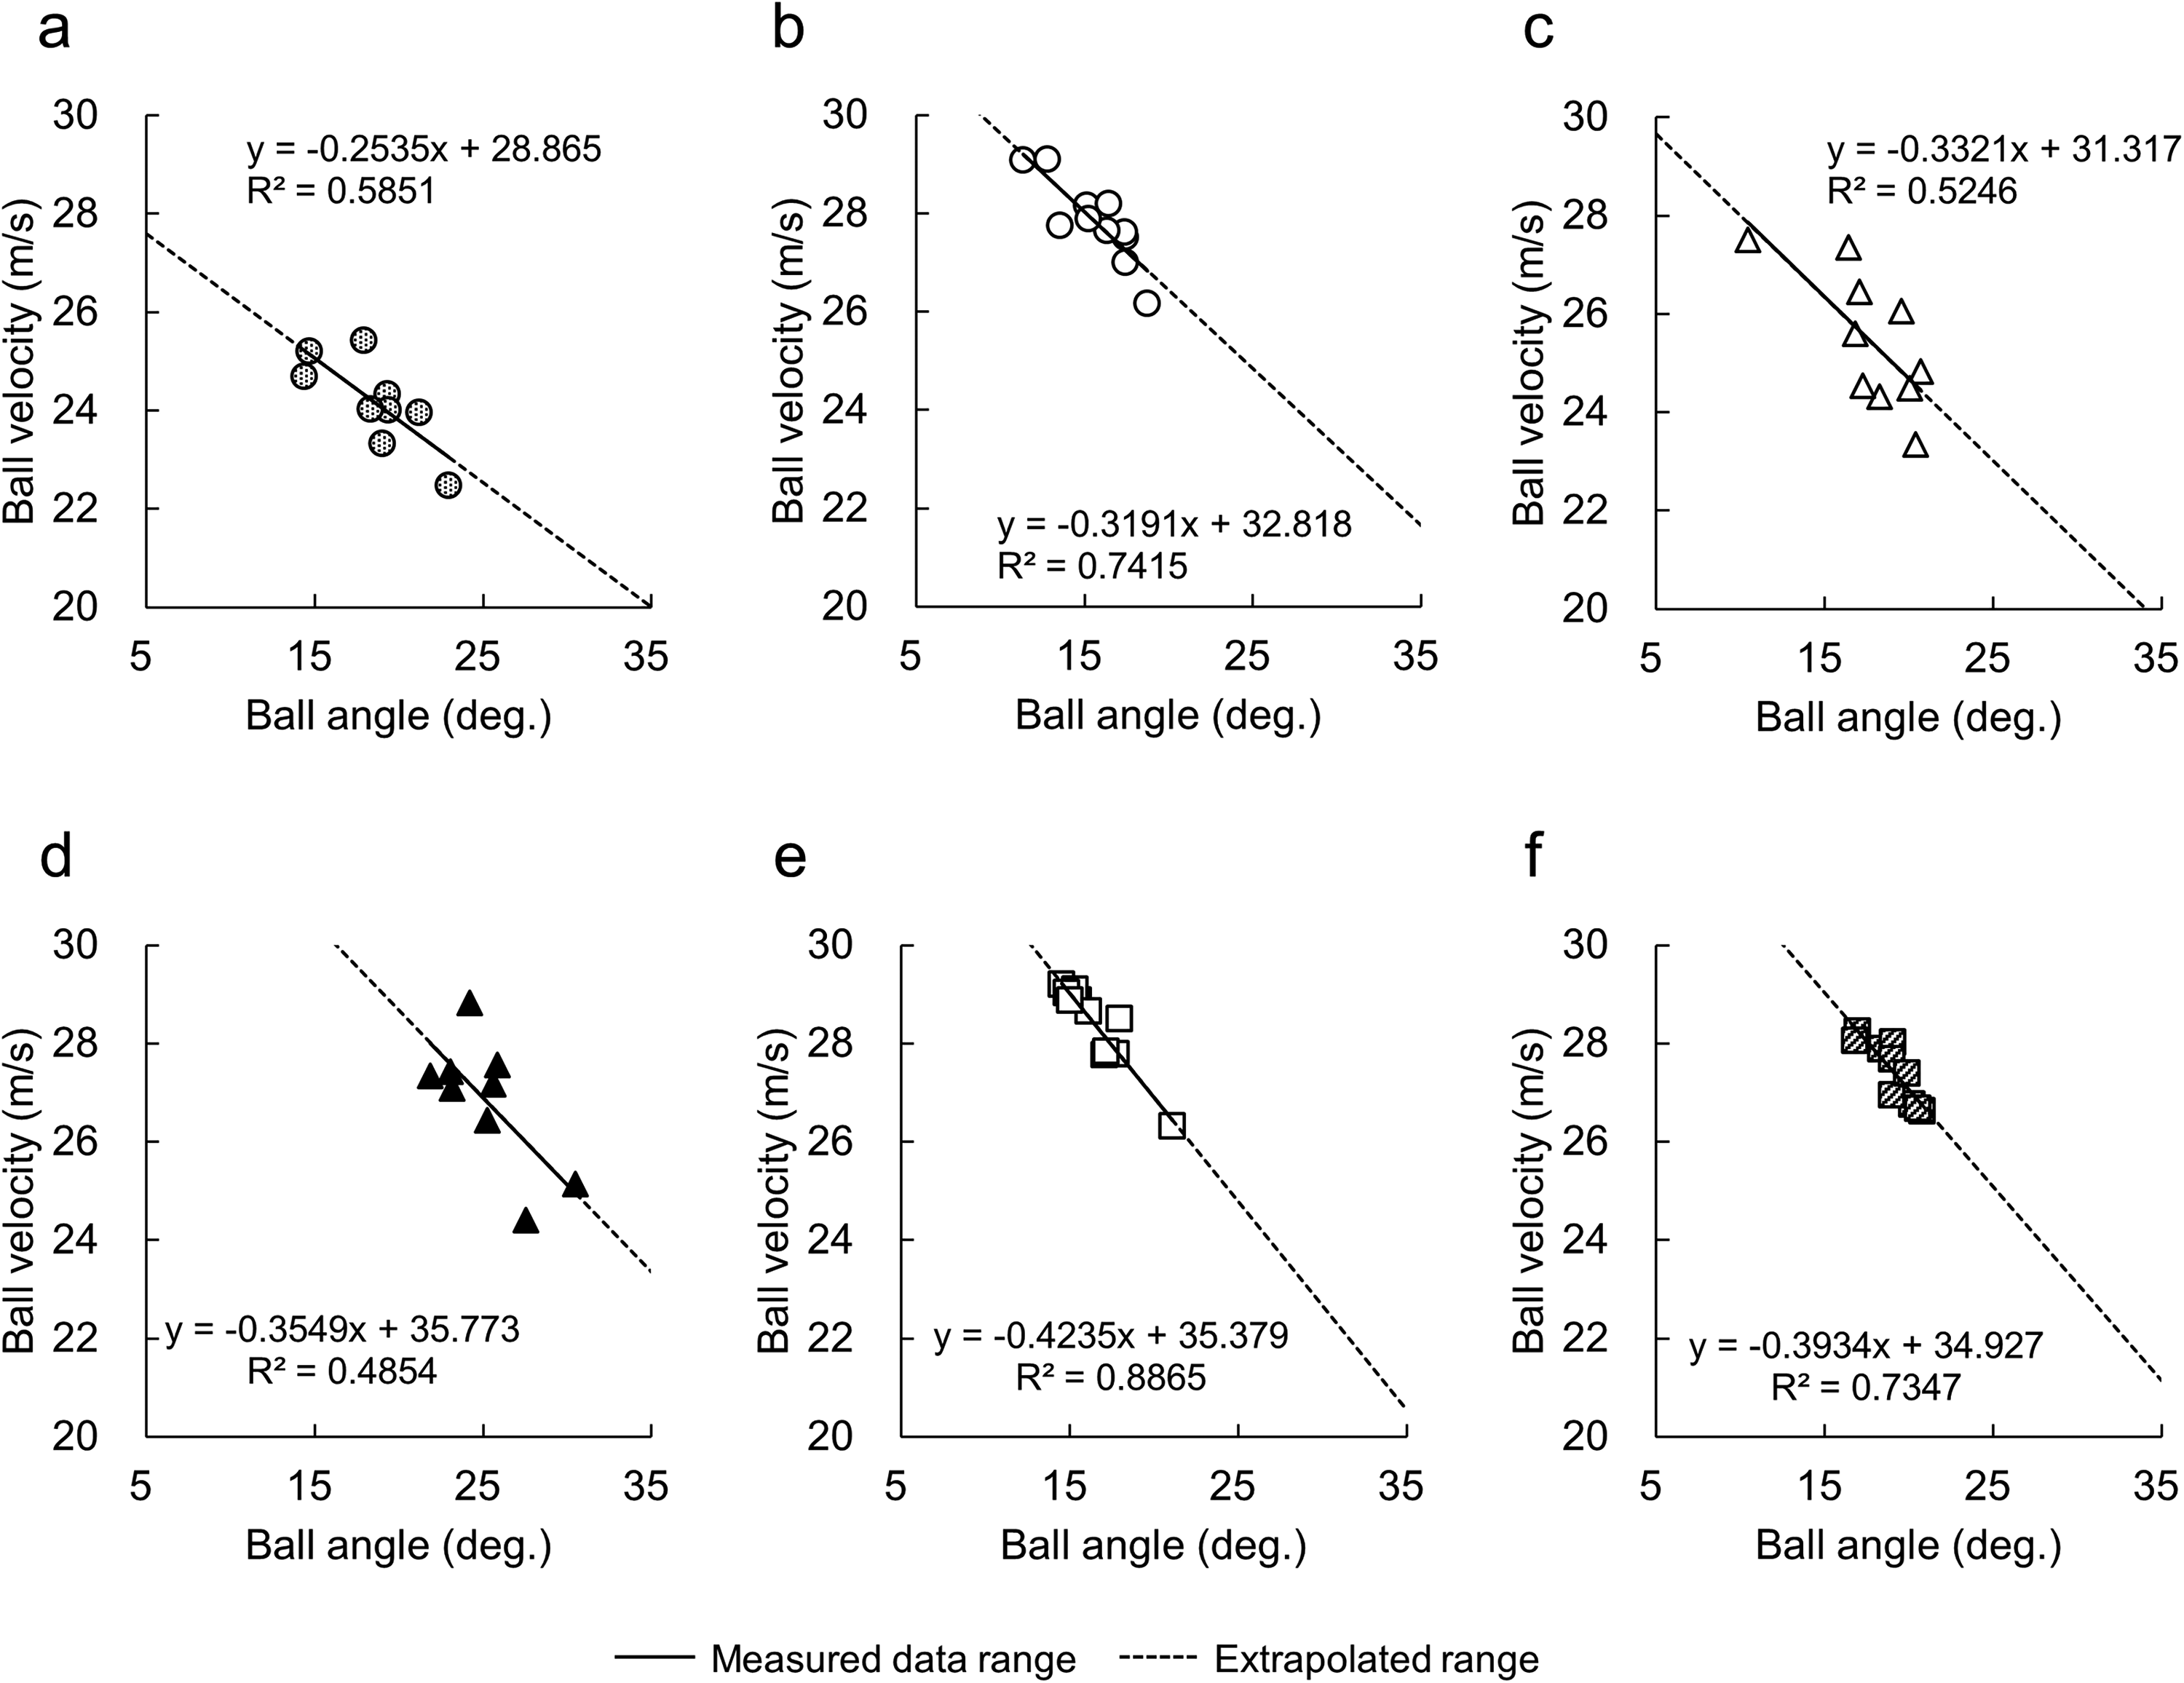
Relationship between launch angle and initial ball velocity for each participant. Panels a–f correspond to sub1, sub2, sub3, sub4, sub5, and sub6, respectively. In all participants, ball velocity tended to decrease with increasing launch angle, although the slope and strength of the relationship varied among individuals. The solid line represents the regression within the measured range, while the dashed line indicates extrapolated values beyond the observed data range.
The coefficients of determination (R2) for the angle–velocity relationships were 0.59 (p = 1.63 × 10⁻²) for sub1, 0.74 (p = 6.62 × 10⁻⁴) for sub2, 0.52 (p = 1.78 × 10⁻²) for sub3, 0.49 (p = 3.70 × 10⁻²) for sub4, 0.89 (p = 1.52 × 10⁻⁵) for sub5, and 0.73 (p = 1.53 × 10⁻³) for sub6, indicating moderate to strong negative correlations. However, the strength of the relationships and the slopes of the regression lines differed among participants, reflecting individual variability.
When data from all participants were pooled, the negative association between launch angle and initial velocity was weak (R2 = 0.15, p = 2.24 × 10⁻³; Figure 3).
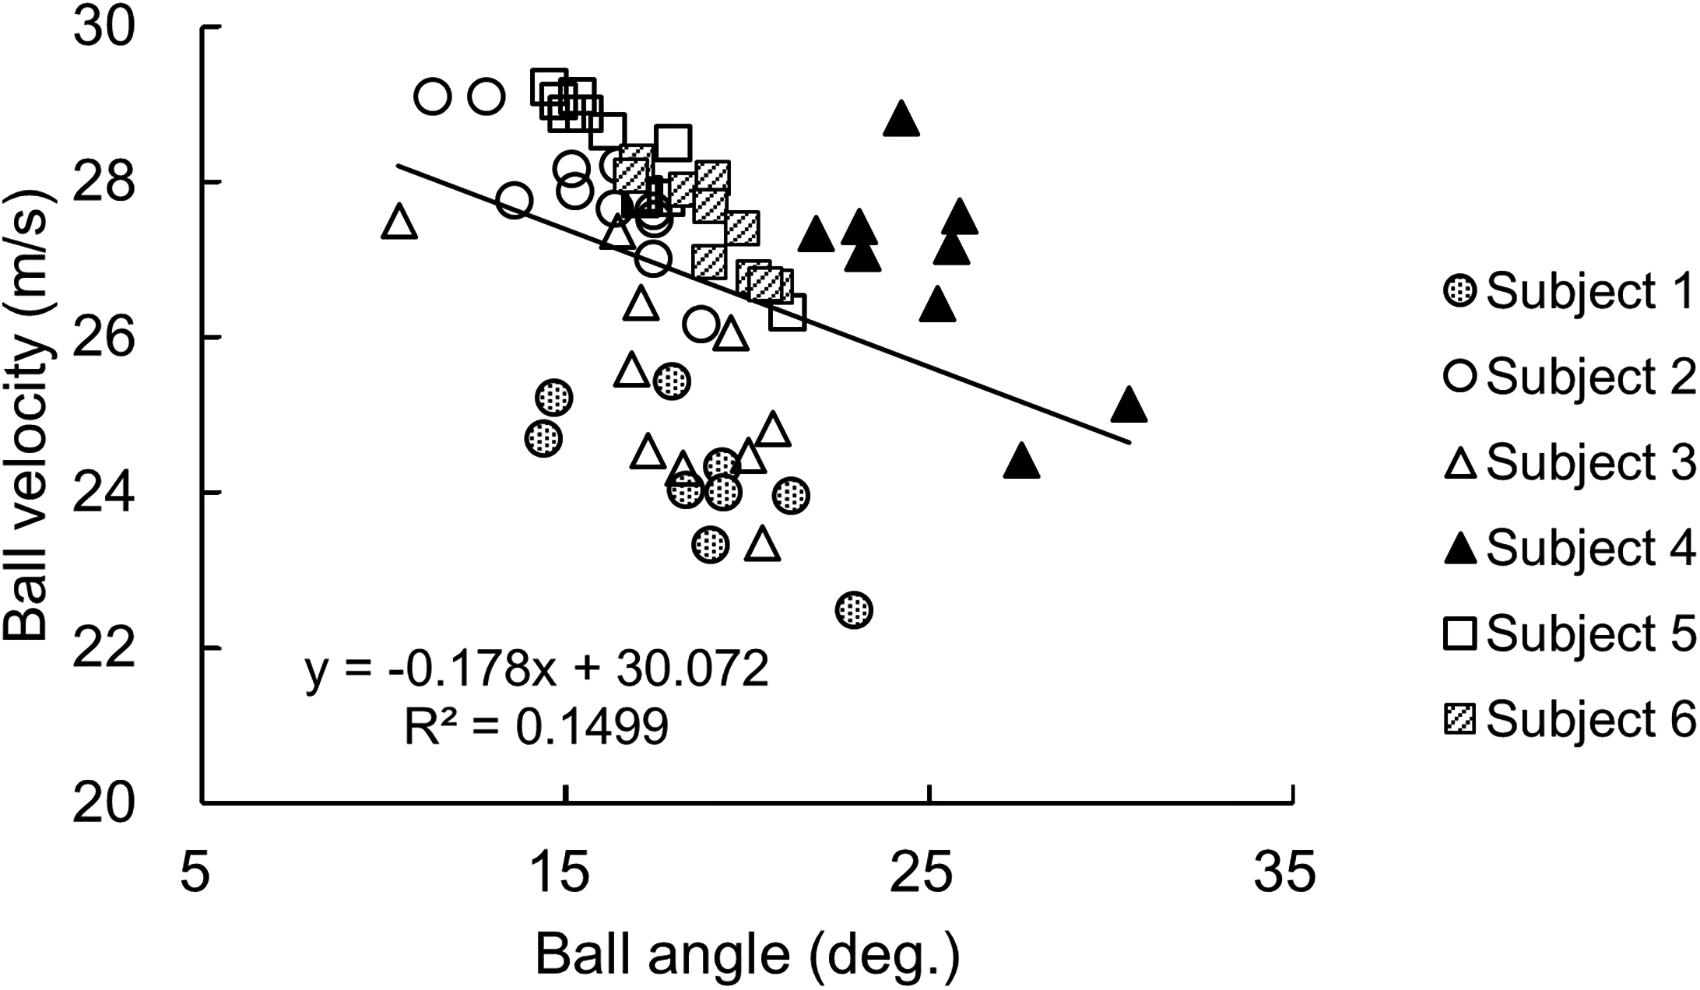
Combined distribution of launch angle and initial ball velocity for all participants. A slight decrease in velocity with increasing launch angle was observed (R2 = 0.15, p = 2.24 × 10⁻³).
Residuals from the linear regression models had a mean value close to zero (−3 × 10⁻⁵ ± 0.61 m/s), indicating no systematic over- or underestimation. Residual magnitude was approximately constant across the range of launch angles, and no significant correlation was observed between residuals and launch angle (|r| = 1.73 × 10⁻⁴), suggesting that assumptions of linearity and homoscedasticity were reasonably satisfied.
Flight distance based on measured angle and velocity
Figure 4 shows the simulated flight distances calculated using the measured launch angles and initial velocities under non-spinning conditions. In all participants, flight distance increased as launch angle increased.
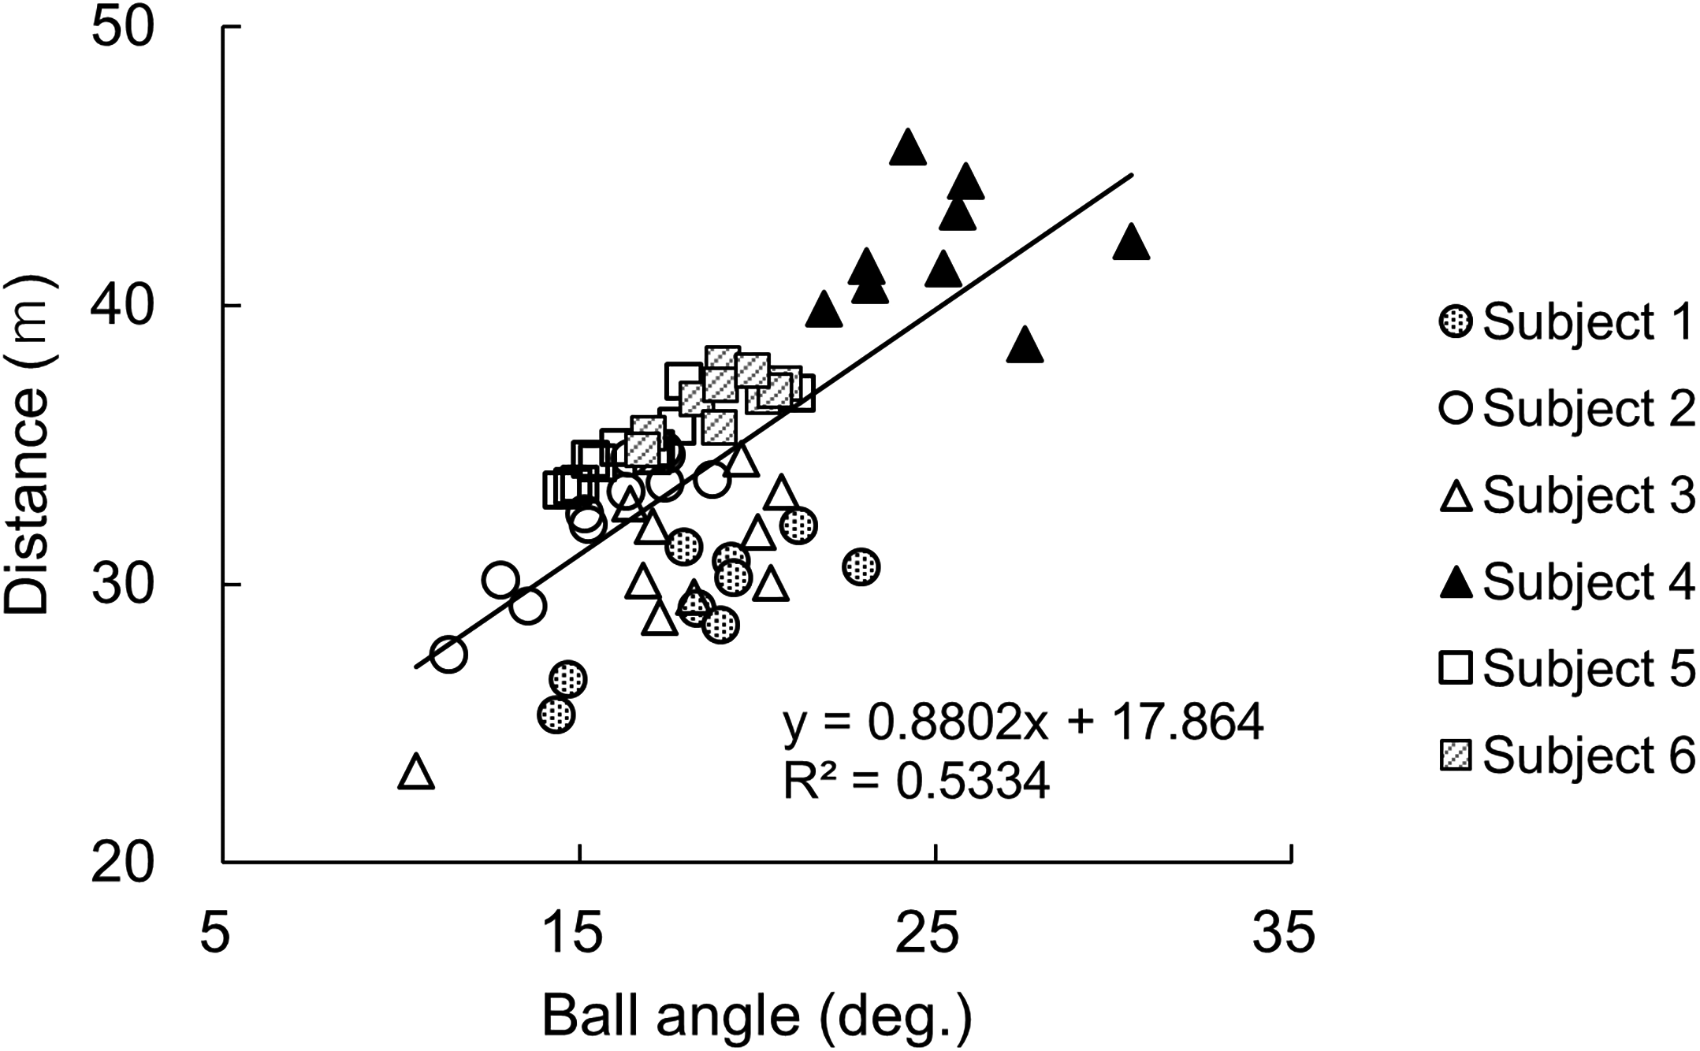
Relationship between launch angle and flight distance obtained from the no-spin flight trajectory simulation using measured launch angles and initial velocities for all participants. Flight distance increased significantly with increasing launch angle (R2 = 0.53, p = 3.53 × 10⁻¹¹).
When pooled across participants, a moderate positive correlation was observed between launch angle and flight distance (R2 = 0.53, p = 3.53 × 10⁻¹¹).
Extrapolated flight distance simulation
Using the individual angle–velocity regression equations, flight distances were simulated for launch angles ranging from 5° to 50°. The resulting angle–distance relationships exhibited a quadratic pattern (Figure 5).
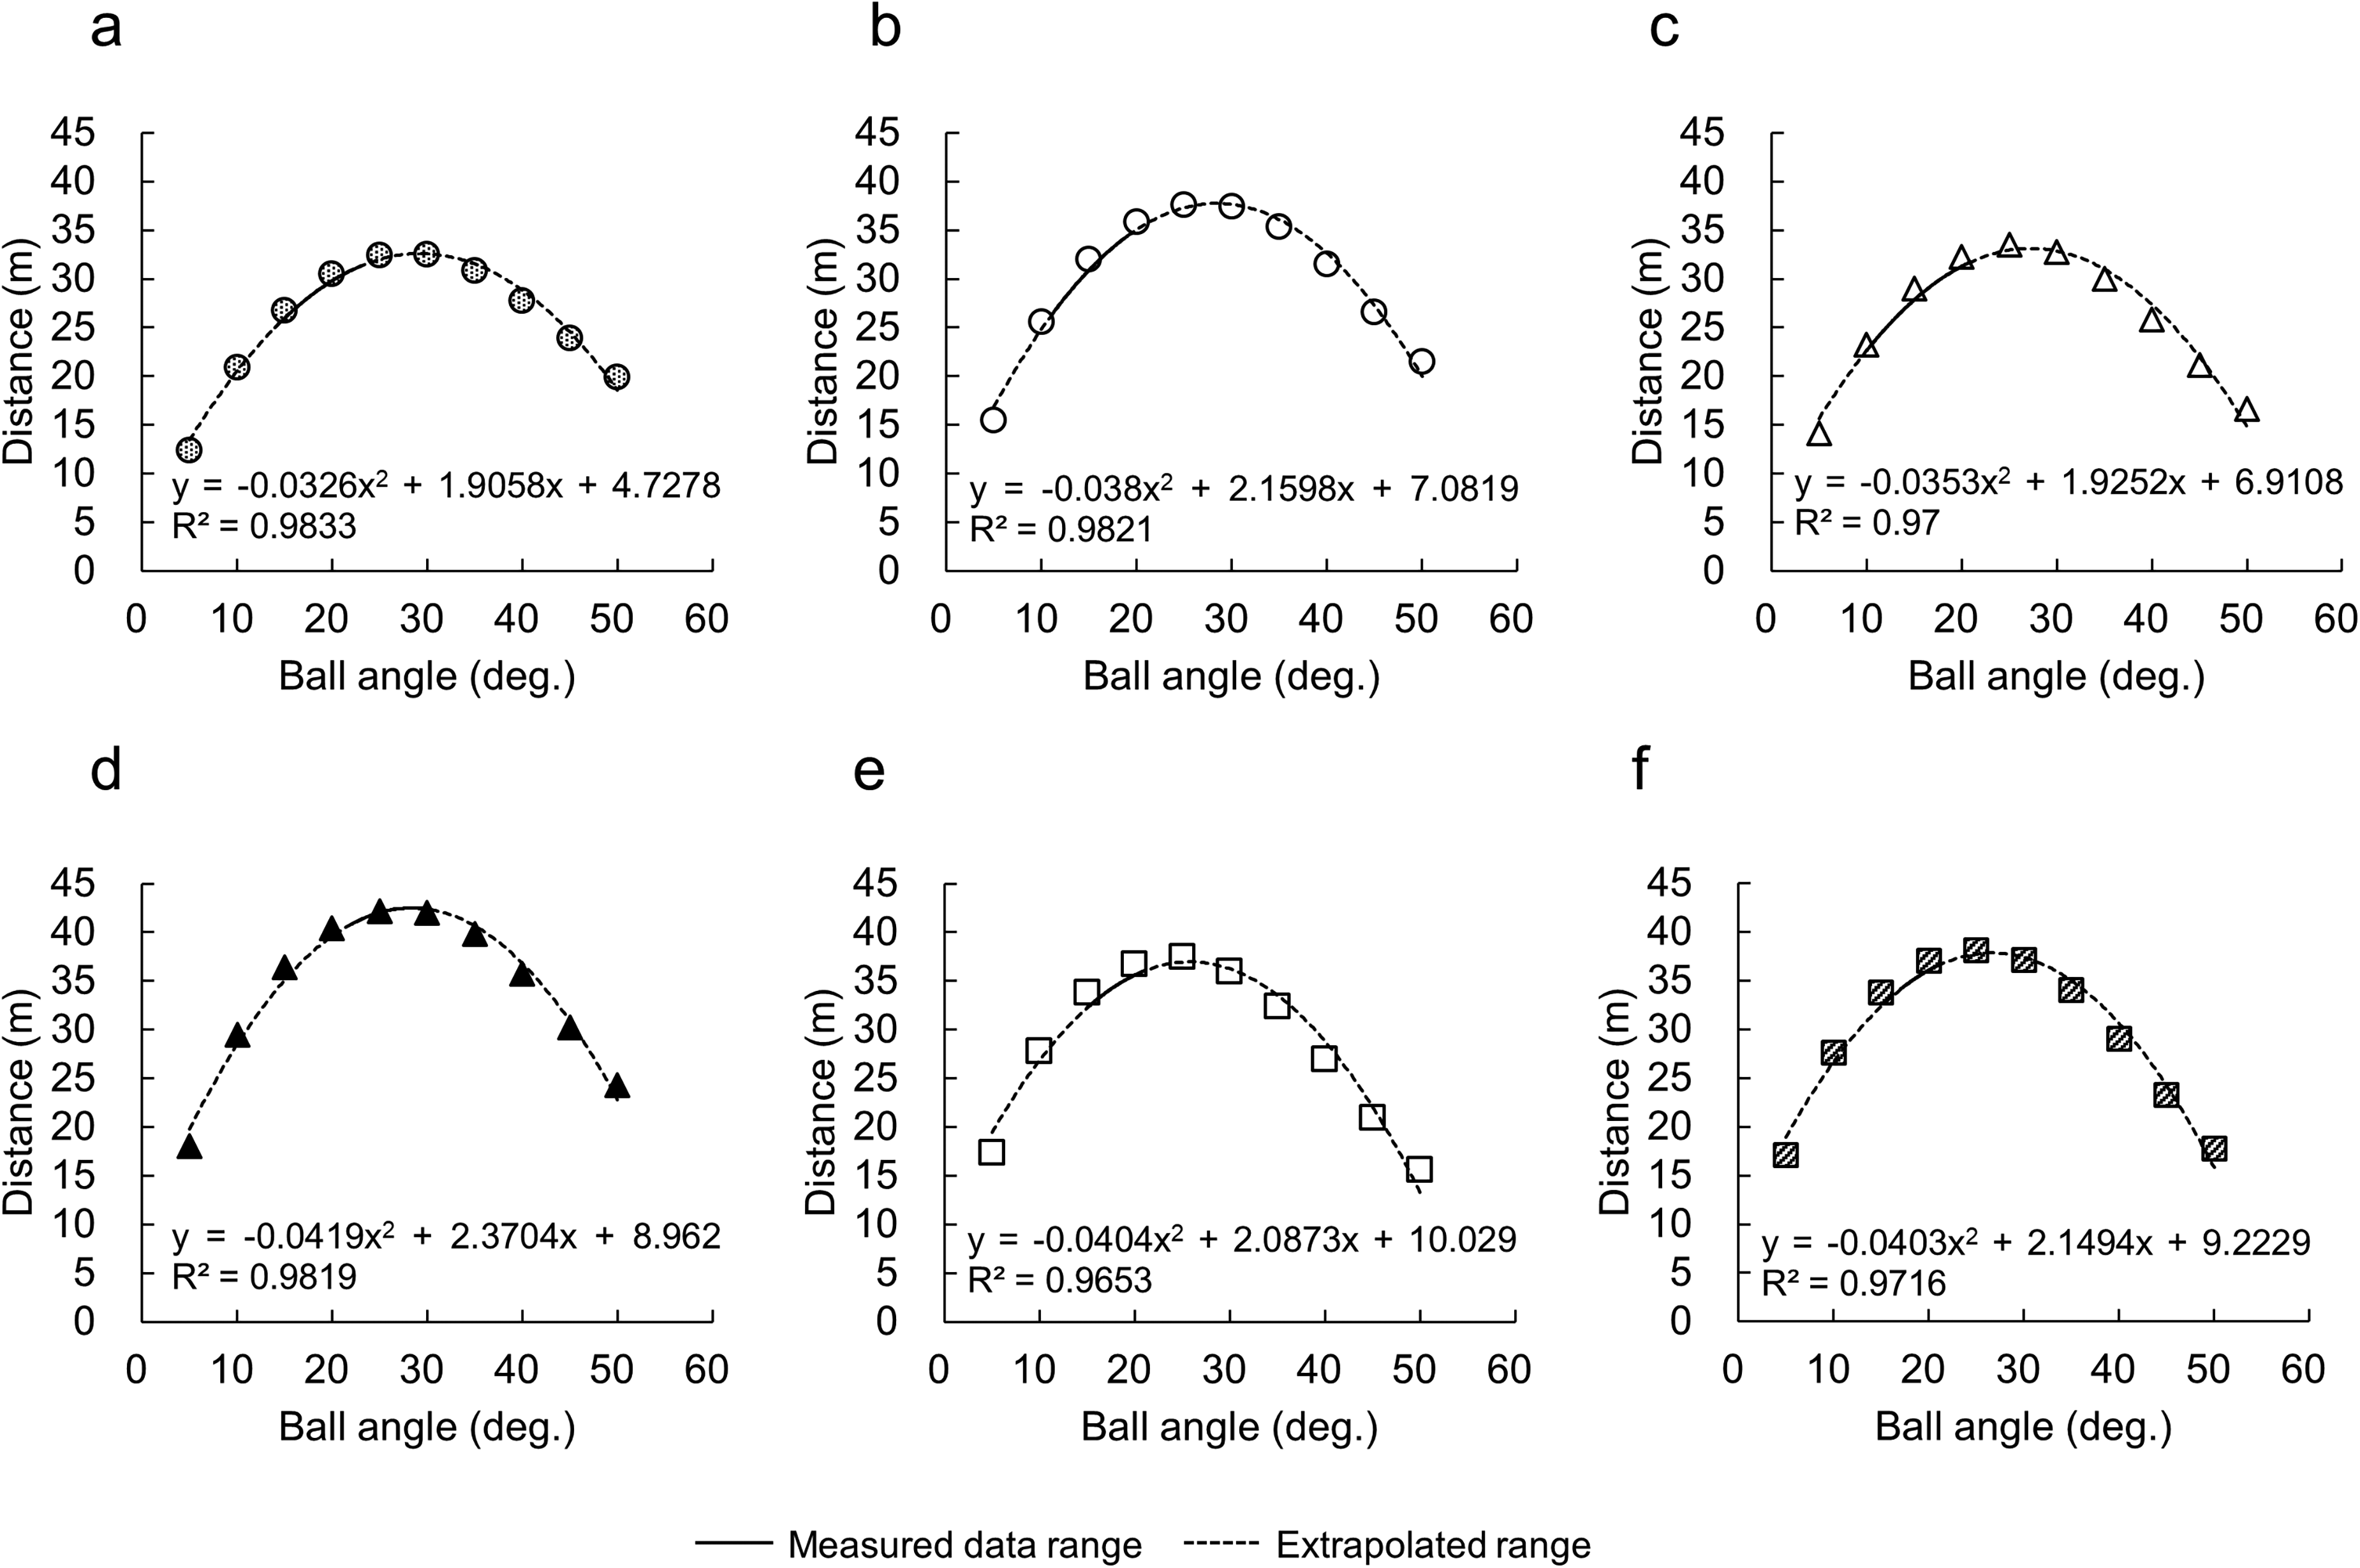
Relationship between launch angle and flight distance based on extrapolated simulations (5–50°) using individual launch angle–velocity regression models. Panels a–f correspond to sub1, sub2, sub3, sub4, sub5, and sub6, respectively. The solid line represents the regression within the measured range, while the dashed line indicates extrapolated values beyond the observed data range.
The estimated maximum flight distances and corresponding launch angles were approximately 32.6 m (29.2°) for sub1, 37.8 m (28.4°) for sub2, 33.2 m (27.3°) for sub3, 42.5 m (28.3°) for sub4, 37.0 m (25.8°) for sub5, and 37.9 m (26.7°) for sub6 (Figure 6).
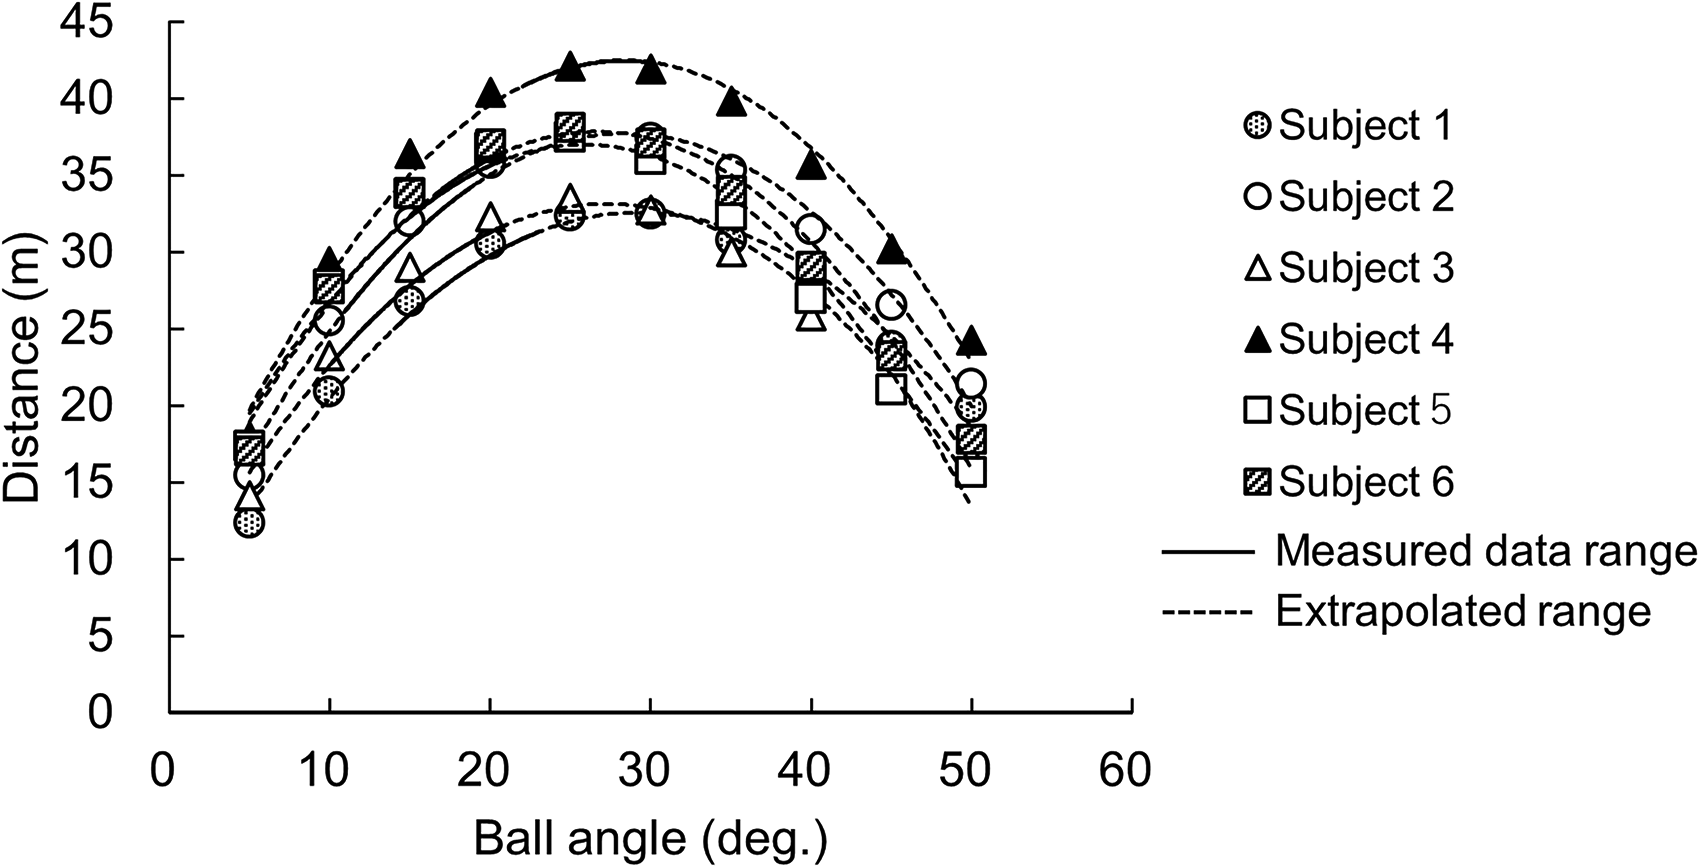
Quadratic relationships between launch angle and flight distance based on extrapolated simulations (5–50°) for each participant. In all cases, flight distance exhibited a parabolic pattern, with maximal distances occurring at launch angles of approximately 25–30°. The solid line represents the regression within the measured range, while the dashed line indicates extrapolated values beyond the observed data range.
Across all participants, the launch angles associated with maximal flight distance were generally distributed between 25° and 30°.
Discussion
Individual differences in the angle–velocity relationship
All participants demonstrated a consistent tendency for initial ball velocity to decrease as launch angle increased. However, the strength and slope of this relationship varied among individuals, indicating that projection conditions in goal kicks are not governed by a single universal pattern. Instead, they appear to reflect individualized interactions among physical characteristics, technical execution, approach strategy, and impact mechanics.
This finding aligns with previous studies on ballistic movements that report trade-off relationships between projection angle and velocity. Notably, the present results indicate that this relationship is more pronounced at the individual level than at the group level, suggesting that goal-kick performance is highly individualized and may benefit from subject-specific optimization strategies.
Biomechanical mechanisms underlying the angle–velocity trade-off
A more detailed biomechanical interpretation of the observed decrease in initial ball velocity with increasing launch angle can be derived from the kinematics of the kicking motion. To generate higher launch angles, players are likely required to modify foot trajectory and orientation at ball impact, resulting in a more upward-directed projection of the ball. This adjustment typically involves a more downward or undercutting foot–ball interaction, which may reduce the efficiency of horizontal momentum transfer.
In addition, achieving higher launch angles may require changes in approach speed and body configuration, including a more upright trunk posture and altered coordination of lower-limb segments. These changes can constrain the angular velocity of the kicking leg and disrupt the proximal-to-distal segmental sequencing that is critical for maximizing foot velocity at impact.
Furthermore, variations in the impact location on the ball—such as striking lower on the ball to increase loft—may reduce effective force transmission and contribute to a decrease in resultant ball speed. Collectively, these kinematic and kinetic constraints provide a plausible mechanistic explanation for the angle–velocity trade-off observed in this study.
Validity of the linear regression model within the measured range
Residual analyses indicated minimal systematic bias, approximate homoscedasticity, and no significant association between residuals and launch angle. These findings support the validity of the linear regression models in representing the angle–velocity relationship within the experimentally measured range.
Accordingly, the use of these models for simulating flight trajectories within this range is considered appropriate. However, caution is required when interpreting model-based estimates outside the observed data range.
Angle–distance relationship and extrapolation considerations
When simulated using measured launch angles and velocities, flight distance increased with increasing launch angle within the observed range. This suggests that the gain in vertical velocity component outweighed the reduction in initial speed under these conditions. However, the limited range of observed angles likely did not include the true optimum, making it difficult to identify a maximal distance point based solely on measured data.
To address this limitation, the angle range was extended to 5–50° using regression-based extrapolation. Under these conditions, the angle–distance relationship exhibited a quadratic pattern, and the estimated optimal launch angles clustered around 25–30°.
Nevertheless, it is important to emphasize that these values are derived from extrapolated estimates based on a linear model fitted to a limited dataset. There is no guarantee that the linear angle–velocity relationship observed within the measured range is maintained at more extreme angles. In practical kicking situations, changes in launch angle are likely accompanied by nonlinear alterations in kinematics, including variations in approach velocity, joint coordination, and impact conditions. These factors may impose biomechanical constraints that limit performance at extreme angles.25,26
Therefore, the estimated optimal angle range should be interpreted as a conceptual approximation rather than a definitive value. The extrapolation approach employed in this study should be understood as a first-order framework for exploring the interaction between angle and velocity, rather than a precise predictive model.
Influence of ball spin and aerodynamic simplifications
An important limitation of this study lies in the assumption of non-spinning ball flight in the trajectory simulations. In practical soccer contexts, especially during long-distance goal kicks, backspin is frequently imparted to the ball, generating aerodynamic lift forces via the Magnus effect. These forces can increase flight time and horizontal displacement, thereby influencing both flight distance and the optimal launch angle.27,28
Under the non-spinning assumption adopted here, only aerodynamic drag was considered. As a result, flight distances may be underestimated, particularly at higher launch angles where the contribution of lift would be more pronounced. In addition, the optimal launch angle identified in this study (approximately 25–30°) may shift toward higher values under realistic spinning conditions.
Nevertheless, the simplified aerodynamic model enabled the isolation of the fundamental relationship between launch angle and initial velocity, providing a clearer understanding of the underlying mechanical trade-offs. Future studies incorporating spin rate measurements and lift modeling are required to improve ecological validity.
Comparison with previous studies
Previous studies on punt kicking have reported optimal angles closer to 45° when projection velocity is relatively independent of angle. 29 In contrast, the present results demonstrate a clear decrease in velocity with increasing launch angle, leading to a lower optimal angle.
This discrepancy may reflect differences in kicking technique (punt vs. ground-based kick), approach conditions, and impact mechanics.30,31 Goal kicks may allow greater velocity generation at lower angles, resulting in a distinct angle–velocity relationship compared to other kicking forms.
Practical implications
The findings of this study suggest that maximizing goal-kick distance does not simply require increasing launch angle. Instead, the ability to maintain high ball velocity at specific angles appears to be a key determinant of performance.
Given the observed inter-individual variability, coaching strategies may benefit from an individualized approach that considers each goalkeeper's unique angle–velocity profile, rather than prescribing a uniform optimal angle.
Limitations and future directions
A key limitation of this study is the relatively small sample size (n = 6), which may limit statistical power and restrict the generalizability of the findings. Although all participants were drawn from the same elite youth team—thereby reducing environmental variability—this homogeneity also constrains the applicability of the results to other populations.
In particular, goalkeepers of different age groups, performance levels, and training backgrounds may exhibit different angle–velocity relationships due to variations in physical development and technical proficiency. Therefore, the present findings should be interpreted with caution when generalized beyond the sampled population.
Importantly, the primary focus of this study was on individual-level analysis rather than population-level inference. The results highlight the existence of individual variability and the potential importance of individualized optimization.
Future research should include larger and more diverse samples, incorporate spin and aerodynamic effects, and examine kinematic determinants such as approach velocity, joint coordination, and impact mechanics to further elucidate the mechanisms underlying optimal goal-kick performance.
Conclusion
This study examined the relationship between ball launch angle and initial velocity in goal kicks performed by elite youth goalkeepers, and investigated how these projection conditions influenced ball flight distance using a combination of experimental measurements and numerical flight simulations.
Across all participants, initial ball velocity consistently decreased as launch angle increased. Although this negative angle–velocity relationship was weak at the group level, moderate to strong correlations were observed within individual participants, with clear differences in regression slopes and coefficients of determination. These findings indicate that projection conditions in goal kicks are not governed by a uniform pattern, but are instead shaped by highly individualized movement strategies and impact mechanics.
Flight trajectory simulations based on measured launch angles and velocities showed that ball flight distance increased with increasing launch angle within the observed range. However, when the launch angle range was extended using individual angle–velocity regression models, the angle–distance relationship exhibited a quadratic pattern, and the estimated launch angles associated with maximal flight distance were generally distributed between 25° and 30°. This suggests that the mechanical constraint imposed by the reduction in initial velocity at higher launch angles shifts the optimal projection angle to values substantially lower than the theoretical 45°.
Taken together, these results demonstrate that the optimal launch angle for maximizing goal-kick distance cannot be defined by a single universal value. Instead, it should be determined based on each goalkeeper's individual angle–velocity characteristics. From a practical perspective, coaching strategies aimed at maximizing kicking distance may benefit from an individualized optimization approach rather than prescribing uniform technical instructions regarding launch angle.
Future studies should incorporate the effects of ball spin, aerodynamic lift and side forces, and detailed kinematic analyses of the kicking motion to further clarify the mechanisms underlying the formation of optimal projection conditions in goal kicks.
Footnotes
Acknowledgment
This research on influence of ball launch angle and velocity on flight distance has been greatly supported by several individuals to whom we owe much gratitude. We extend our deepest gratitude to Professors Takeshi Asai at International Pacific University and Mark Lake at Liverpool John Moores University for their expert guidance. Their advice was crucial to the development of this study.
We are grateful to the players from the Everton Football Club whose participation was essential for our practical analysis. Their commitment and cooperation contributed significantly to our findings.
Special thanks go to our peers, Clansey, Lozano-Berges, and Liu, for their support and insightful feedback throughout the process.
This study, which was undertaken without external funding, reflects the collective efforts and dedication of everyone involved. The authors declare that they have no conflicts of interest.
Your support has been pivotal to the success of this research and we are profoundly thankful.
Ethical considerations
Ethics approval was obtained from the Ethics Committee of the Faculty of Health and Sports Sciences at the Meiji Gakuin University (approval no. 19001).
Consent to participate
Written informed consent was obtained from all participants before their inclusion in the study.
The participants were provided with comprehensive information about the purpose, procedures, potential risks, and benefits of the research.
Consent for publication
Not applicable.
Funding
The authors received no financial support for the research, authorship, and/or publication of this article.
Declaration of conflicting interests
The authors declared no potential conflicts of interest with respect to the research, authorship, and/or publication of this article.
Data availability
The participants in this study did not provide written consent for their data to be shared publicly, because the sensitive nature of the research supporting the data was not available.