
Abstract
Isometric posterior chain strength assessments are increasingly employed in high-performance sports for benchmarking and fatigue monitoring, yet little is known about how practical implementation factors influence protocol selection. The aim of this study was to examine the feasibility, practicality, participant perceptions, and reliability of four commonly used isometric posterior chain assessments, the long-lever bridge (LLB), standing 90:20, supine 90:90, and supine 30:30. Thirty-seven NCAA division II athletes (19 females: age = 20.1 ± 0.9 years, height = 166.7 ± 5.2 cm, body mass = 67.0 ± 12.1 kg; and 18 males: 19.7 ± 1.2 years, height = 178.9 ± 6.6 cm, body mass 79.8 ± 8.1 kg) completed all four protocols in randomized order across four sessions. Protocol duration, athlete-reported perceptions (effort, comfort, soreness), and within-session reliability of force-time characteristics were assessed. Protocol duration ranged from 2:30 to 3:20 min, with the LLB requiring the longest setup time. The supine 90:90 was consistently rated the easiest and most comfortable assessment, particularly among female athletes, while the LLB was rated as the most demanding. Peak force demonstrated excellent reliability across all protocols (intraclass correlation coefficient lower bound 95% confidence interval > 0.90, coefficient of variation < 5%), though rapid force production ranged between poor-good reliability at early force-time points (50–250 ms). These findings demonstrate that no single protocol optimizes all criteria simultaneously. Protocol selection should balance measurement quality with practical feasibility, guided by the primary monitoring objective and whether sustained athlete compliance or comprehensive force production profiling is prioritized.
Introduction
With a growing body of evidence supporting the use of isometric posterior chain assessments in applied sporting environments,1,2 isometric testing has increasingly been adopted as a practical and accessible alternative to traditional laboratory-based assessment methods (e.g., using an isokinetic dynamometer). 3 This reflects a broader trend within sport science toward monitoring strategies that balance actionable insight with feasibility, particularly in high-performance environments where time, space, and resources are often constrained. 4 The growing reliance on isometric testing is likely underpinned by advances in portable technology, including force plates and fixed or portable dynamometry systems. These tools offer valid and reliable measures of force production while allowing assessments to be conducted outside of controlled laboratory environments.5–7 Their enhanced portability and reduced spatial requirements allow for implementation during periods of travel and within training facilities, supporting more frequent and contextually relevant monitoring of athlete neuromuscular status.8,9 Moreover, such technologies have become increasingly commonplace in the field of strength and conditioning,9,10 in part due to reductions in cost, relative to traditional laboratory-based equipment (e.g., isokinetic dynamometer). As a result, practitioners are more likely to have routine access to these devices within their existing infrastructure. Given their availability, logistical efficiency, and capacity to produce valid performance data, it is therefore logical for applied practitioners to prioritize assessment methodologies that utilize equipment already embedded within the sporting environment, rather than laboratory tools that may be impractical or inaccessible.
Several isometric posterior chain assessments have emerged as commonly used options within applied sport settings, 11 most notably the supine 90:90,12,13 the supine 30:30,1,14 the standing 90:20,15,16 and, more recently, the supine long-lever bridge (LLB).17,18 As implied by their naming conventions, the supine 90:90 and supine 30:30 are performed supine with the hip and knee at 90° and 30° of flexion, respectively, while the standing 90:20 is executed upright with the hip at 90° and knee at 20° of flexion, with the back supported against a stable surface. Unlike the others, the LLB does not derive its setup from its name and is instead characterized by a bridge position with approximately 30° of knee flexion and 45° of hip flexion, equivalent to the 135° hip flexion value reported under alternative reference conventions. Each of these assessments have been evaluated within the scientific literature and have generally demonstrated good reliability at peak forces, 3 reinforcing their suitability as field-based assessments for monitoring posterior chain strength. However, despite their growing application, no researchers to date have published a study in which they systematically compare the feasibility, practicality, or overall ease of implementation of the four assessments within applied sport environments. While Woodbridge et al. 19 have evaluated the differences between two of these tests, a comprehensive evaluation of their relative practicality and contextual appropriateness remains absent. Therefore, the aim of this study was to compare the feasibility, practicality, and overall perception of the four commonly employed isometric posterior chain assessments, as well as their capacity to produce reliable force-related measures to better inform evidence-based selection and implementation of appropriate assessments in high-performance sporting environments.
Methods
Experimental design
A within-subject, randomized crossover design was employed to examine performance across four distinct posterior chain tests. All participants completed every testing condition, with the order of the tests randomized to reduce potential order effects. Sessions were conducted 24 h apart, resulting in a total study duration of 96 h. As each session involved a distinct isometric task rather than repeated identical measures, the inter-session interval was selected to minimize residual fatigue while accommodating the constraints of the athletes’ training schedule. Testing took place during the participants’ usual training hours, with each session scheduled at the same time of day to control for diurnal variation.
Participants
Thirty-seven National Collegiate Athletic Association (NCAA) Division II soccer players, comprising 19 females and 18 males, each with at least two years of resistance training experience, volunteered for participation in this study. Participants’ characteristics were comprised of females: age = 20.1 ± 0.9 years, height = 166.7 ± 5.2 cm, body mass = 67.0 ± 12.1 kg; and males: age = 19.7 ± 1.2 years, height = 178.9 ± 6.6 cm, body mass 79.8 ± 8.1 kg. All athletes had no history of hamstring-related injuries in the six months prior to the study. Organizational consent was obtained before approaching participants, and all participants provided written informed consent prior to enrollment. Ethical approval was granted by the University of Salford's institutional ethics committee (reference no: 2025-7379-8844, approval date: 30 July 2025) in accordance with the Declaration of Helsinki. An a priori sample size estimation to detect differences between the four assessment conditions indicated that a total of 16 participants were required. This estimation was informed by summary statistics from Woodbridge et al., 19 who compared the supine 90:90 and standing 90:20 isometric hamstring assessments. Reported group means and standard deviations were used to estimate a large effect size (ηp2 = 0.31) assuming an alpha level of 0.05, a statistical power value of 0.80, and four assessment conditions. A large difference between assessments was anticipated, given that two assessments were primarily knee-flexion based while others involved additional hip extension, with previously reported values suggesting substantially different outcomes between these assessment types. The sample size of 37 participants exceeded the minimum requirement, allowing for additional exploratory analyses conducted separately by sex (19 females, 18 males).
Procedures
All isometric assessments were performed using a single force plate (Hawkin Dynamics Inc., Portland, ME, USA) sampling at 1000 Hz, with data collected via the manufacturer's proprietary software and force plates re-zeroed between participants and assessment limb. Prior to testing, participants completed two warm-up/familiarization trials per limb at 50% and 75% of perceived maximal effort. For all assessments, participants were instructed to remain as still as possible for at least one second before each trial to allow for accurate force-time calculation. 12 All data collection and calculations were performed directly within the manufacturer's proprietary software using the default processing settings, without additional filtering or post-processing. This approach was used to mirror applied sport settings, maximizing feasibility and minimizing time burden for practitioners, who typically rely on manufacturer provided outputs rather than extracting detailed force-time trials, as more common in laboratory analyses. As this approach used the Hawkin Dynamics proprietary software for all calculations, the onset of force production was identified automatically when the force exceeded three standard deviations (SD) above the one-second weighing period. 20
To assess the feasibility and time efficiency of each assessment, the total duration of each isometric assessment was recorded using a digital stopwatch. Timing began at the initiation of verbal instruction from the test examiner to the participant and concluded upon completion of the final repetition with the second assessed limb, capturing the full practical time burden of each test in an applied setting. To provide further granularity, the duration from the first trial of the first assessed limb to the final trial of the second assessed limb was extracted from the trial metadata. The difference between the total stopwatch duration and the extracted cumulative trial duration was calculated to estimate the time required for an assessor to provide adequate verbal instruction and participant positioning prior to the first trial, representing the practical time demand for test administration once participants are previously familiarized with the assessment.
Twenty-four hours following completion of all four assessments, participants were requested to complete a subjective questionnaire evaluating each protocol (see Supplementary Materials). Using a 4-point Likert scale, participants rated each assessment across three domains: perceived effort during the assessment, comfort and feasibility of the setup and execution, and pain and soreness experienced during or after the assessment, with 1 representing the lowest rating and 4 representing the highest. This delayed administration allowed participants to reflect on any residual discomfort or soreness from each protocol while minimizing interference from acute fatigue experienced during testing. Participants who experienced no soreness were permitted to leave the soreness item blank; zero and missing responses were treated as missing data, resulting in a reduced effective sample size for soreness analyses (males: n = 13; females: n = 12).
Supine 90:90 and 30:30 assessments
The supine 90:90 and 30:30 isometric hamstring assessments were performed with participants lying supine and the testing leg positioned according to the target knee and hip angles, while the non-testing limb remained fully extended alongside the testing surface. The force plate was placed upon stacked DC blocks (each 5.08 cm in height) with the number of blocks adjusted for each participant to achieve the closest possible approximation to the target joint angles, as verified using a goniometer. For the 90:90 isometric assessment, the active knee and hip maintained 90° of flexion, while for the 30:30 isometric assessment, the active knee and hip maintained 30° of flexion. The participant's heel rested on the force plate with footwear removed. Participants were required to repeat trials if their hips rose off the ground as determined by visual inspection.
Standing 90:20 assessment
During the standing 90:20 assessment, participants stood with the heel of the non-assessed leg, hips, upper back, and head against a wall, while the heel of the assessed leg was placed on a force plate that was stacked upon DC blocks (5.08 cm in height) at an appropriate height for each participant. The distance of the force plate to the wall was individually adjusted to ensure each participant was positioned with a hip angle of 90° and 20° of knee flexion, measured using a goniometer. Participants crossed their forearms on their chest for the entire duration of the assessment, with the test applied unilaterally and the non-assessed limb maintaining full contact with the wall throughout the assessment.
Long-Lever bridge assessment
The isometric LLB was conducted with participants positioned supine, their heels in contact with the force plate placed upon the floor, and the inferior angle of the scapulae placed on top of a 15.24 cm foam platform to elevate the torso. A loaded barbell, with a rigid foam pad at the inguinal fold, was used to anchor the lower extremity and provide a point of resistance. The test was performed unilaterally with a knee angle of 30° and a hip angle of 45°, measured using a goniometer.
Statistical analyses
All statistical analyses were performed using Python 3.12.7 (Python Software Foundation, DE, USA). Data are reported as mean ± SD. The Shapiro-Wilk test evaluated normality, and Levene's test assessed homogeneity of variance. Statistical significance was set as α < 0.05. Within-session absolute reliability was quantified using coefficient of variation (CV%) with 95% confidence intervals (CI) and interpreted as: <5.00% (excellent), 5.00–9.99% (good), 10.00–14.99% (moderate), and > 15.00% (poor). Within-session relative reliability was calculated using intraclass correlation coefficients (ICC; 3,1), a two-way mixed effects model with absolute agreement appropriate for single fixed-rater designs. ICC values were interpreted based on the lower bound CI as recommended by Koo and Li 21 as: ≥ 0.90 (excellent), 0.75–0.89 (good), 0.50–0.74 (moderate), and ≤ 0.49 (poor). For reliability reporting, only right-limb data are portrayed, as all assessments were conducted unilaterally and over 90% of participants identified the right limb as their dominant side. One-way repeated measures ANOVAs were performed to compare force production at specific time points (50, 100, 150, 200, 250 ms, and peak force) across assessment protocols (90:90, 30:30, 90:20, LLB) with Bonferroni-adjusted post-hoc comparisons. Partial eta squared (ηp2) was calculated to quantify overall effect sizes as follows: > 0.01 (small), > 0.06 (moderate), > 0.14 (large) based on recommendations by Hopkins et al. 22 Moreover, Hedges’ g effect sizes were calculated to provide pairwise comparisons and were interpreted as: < 0.19 (trivial). 0.20–0.59 (small), 0.60–1.19 (moderate), 1.20–1.99 (large), and 2.00–3.99 (very large). 23 Test duration data violated normality assumptions and were therefore log-transformed prior to analysis. Repeated measures ANOVA was also used to compare assessment duration times across protocols, with Bonferroni-corrected pairwise comparisons following significant main effects. Effect sizes were interpreted using the same ηp2 and Hedges’ g criteria. Though analyzed on the log scale, descriptive data are presented in minutes for eased interpretability. Questionnaire responses across three domains (perceived effort, comfort/feasibility, and pain/soreness) were analyzed using the Friedman test to assess differences across protocols, with significant effects followed by Wilcoxon signed-rank tests with Bonferroni-adjusted corrections. Finally, to examine whether participants who performed better on one assessment tended to perform better on others, Pearson correlation coefficients were calculated between all assessment pairs, with 95% CI's and coefficients of determination (r2) also reported. Correlation magnitudes were interpreted as: trivial (0.00–0.10), small (0.11–0.30), moderate (0.31–0.50), large (0.51–0.70), very large (0.71–0.90), and nearly perfect (>0.90).
Results
Within-Session reliability
Reliability characteristics are summarized in Table 1. Peak force demonstrated excellent relative and absolute reliability across all protocols for both sexes. Late-stage rapid force production (200–250 ms) showed variable reliability, with the standing 90:20 exhibiting the most consistent good reliability profile for both sexes, while the supine 90:90 showed sex-specific patterns (good for males, poor for females). The supine 30:30 and LLB, on the other hand, demonstrated moderate reliability at these time points. Early-stage rapid force production (50–150 ms) revealed poor to moderate reliability across all protocols, with the standing 90:20 showing the most consistent moderate reliability for both sexes, while other protocols exhibited predominantly poor reliability, particularly for the supine 90:90.
Descriptive characteristics and within-session relative (ICC) and absolute (CV%) reliability across six force-time points (50 ms to peak force), presented with 95% confidence intervals separately for male and female participants. Force values are expressed in Newtons (N).
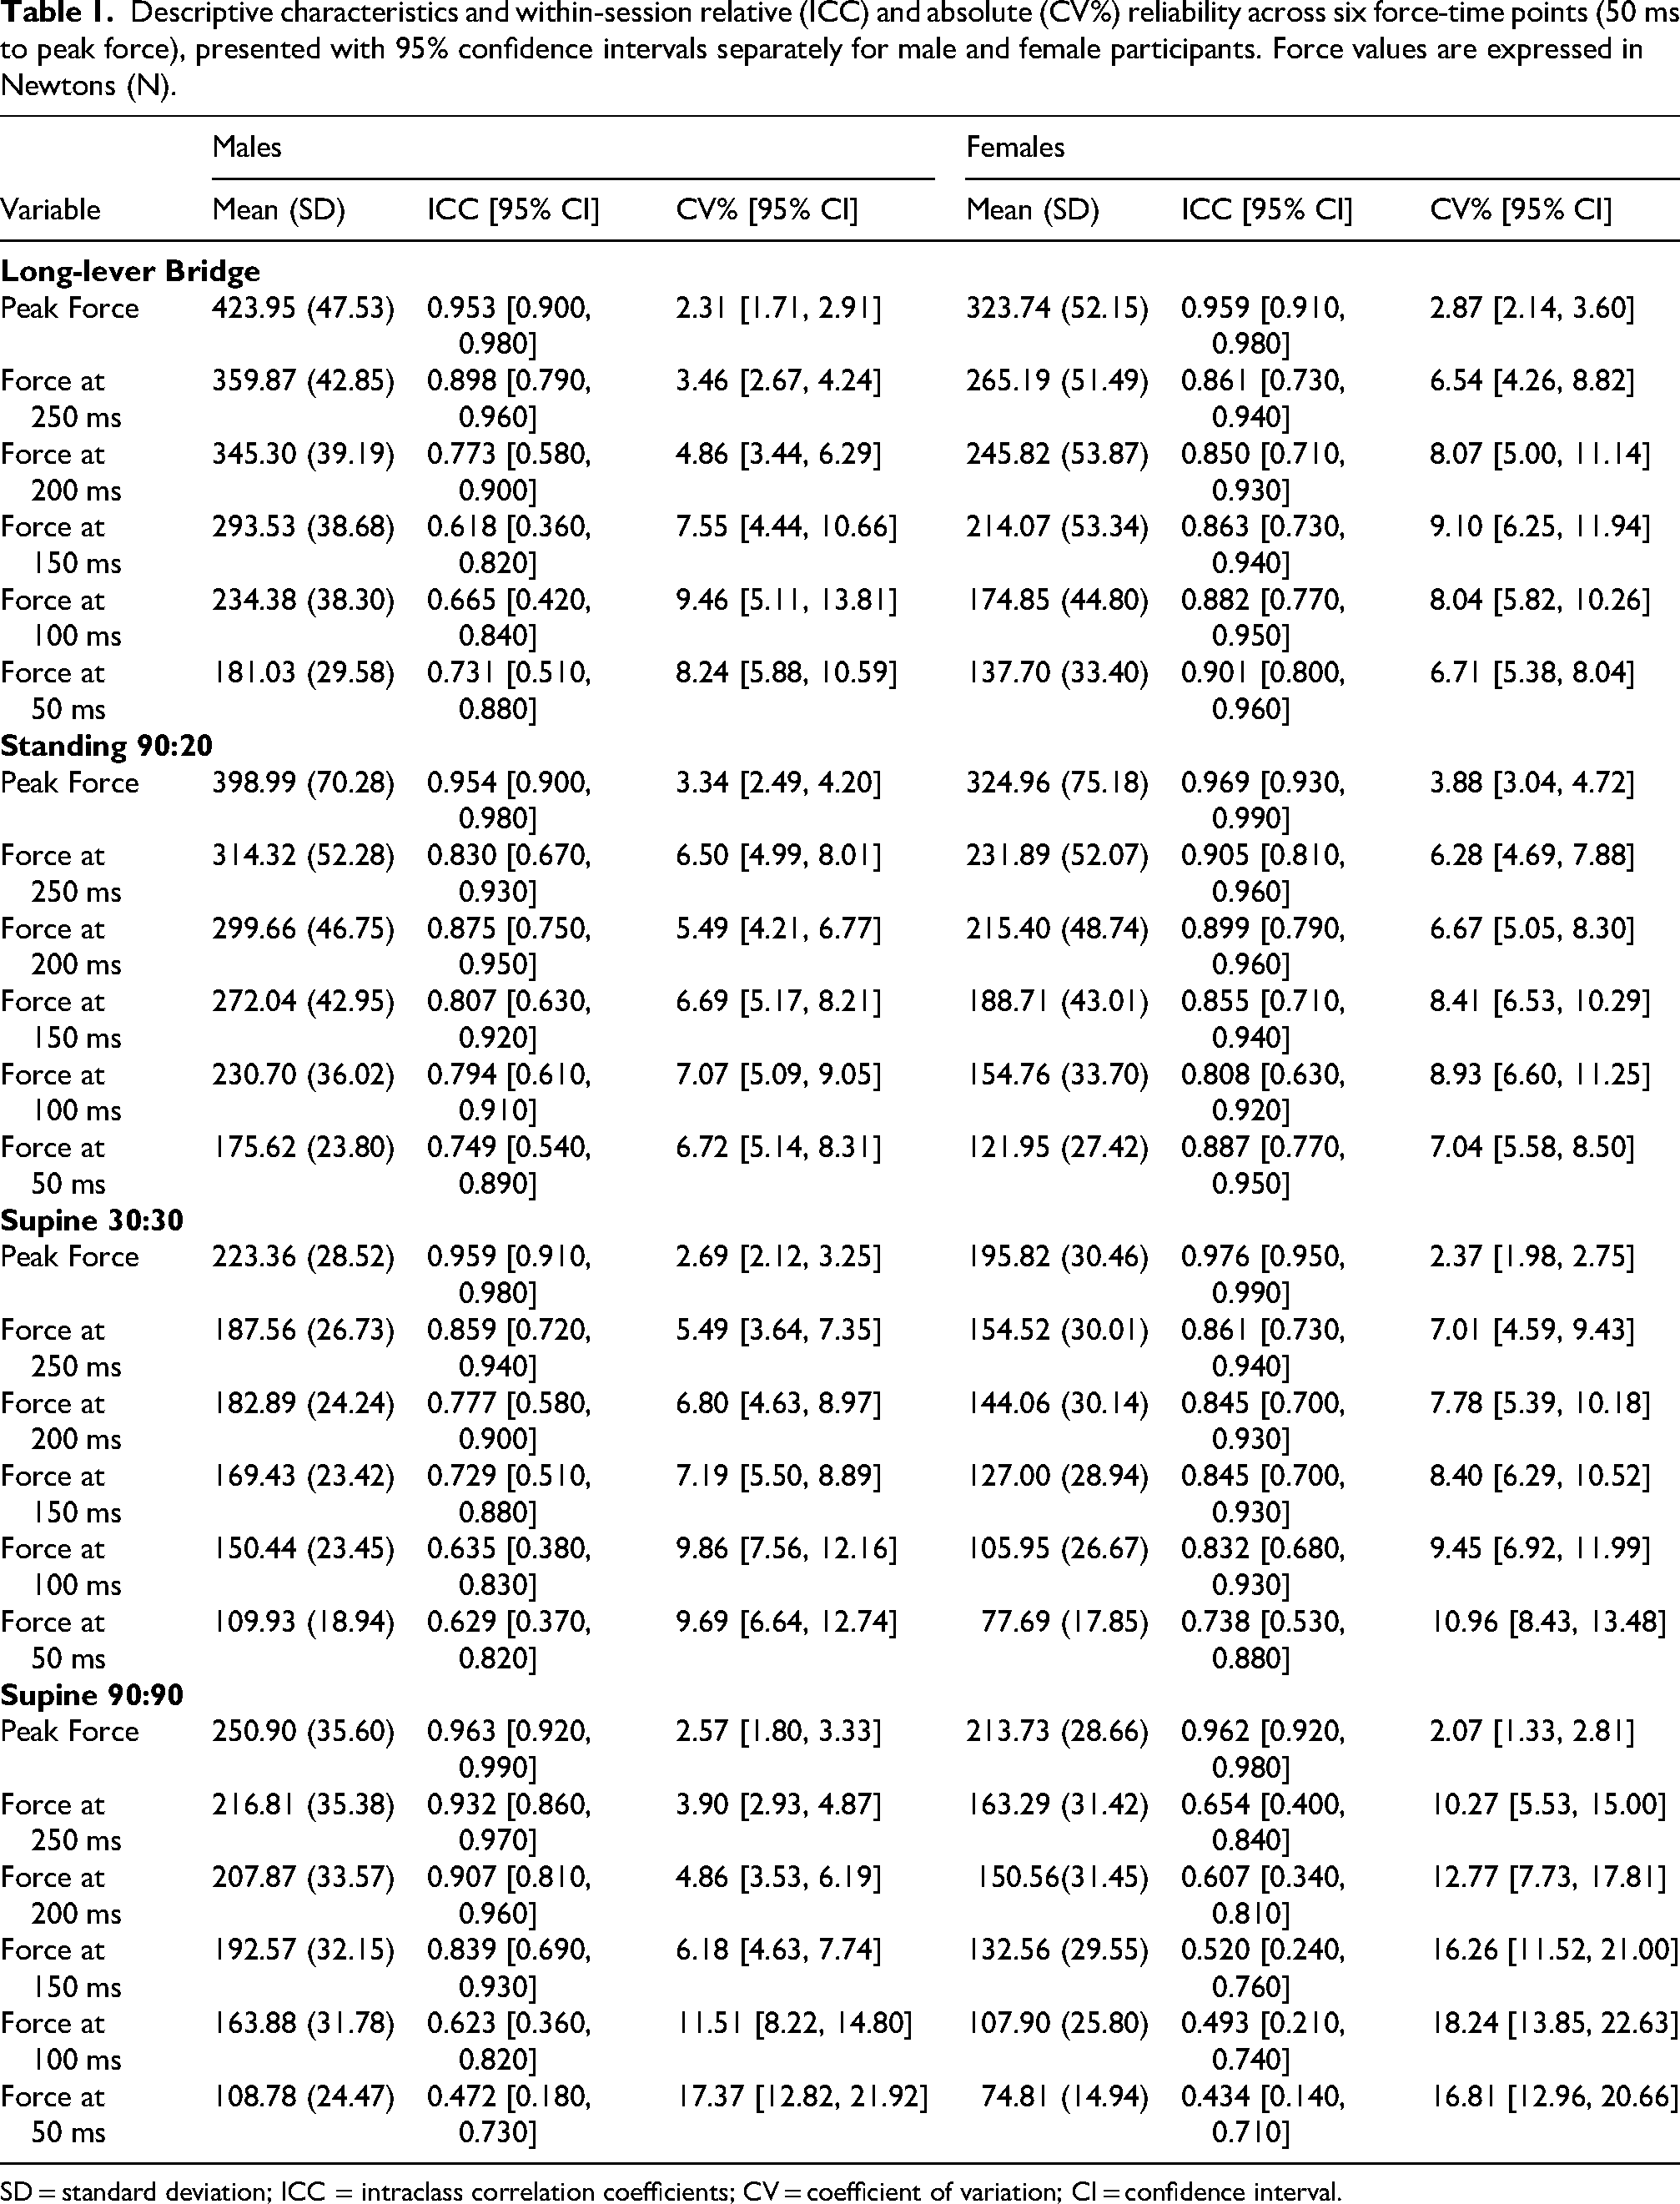
SD = standard deviation; ICC = intraclass correlation coefficients; CV = coefficient of variation; CI = confidence interval.
Force production characteristics
All force production characteristics are displayed in Table 1. Significant differences were observed between all four protocols across all force-time points (p < 0.001, ηp2 = 0.46–0.78). Peak forces were greatest in the LLB, followed by the standing 90:20, with both protocols producing significantly greater force than the supine 90:90 and supine 30:30 (p < 0.001). Post-hoc comparisons revealed that the LLB and standing 90:20 produced similar peak forces (males: p = 0.314; females: p = 1.000). On the other hand, at late-stage force-time points (200–250 ms), the LLB produced significantly greater forces than the standing 90:20 (p < 0.05), with both protocols remaining significantly greater than both supine protocols (p < 0.001). At these late-stage force-time points, the supine 90:90 produced significantly greater forces than the supine 30:30 in males (p < 0.01), though no differences were observed between females (p > 0.05). At early-stage force-time points (50–150 ms), protocol differences diminished, with the LLB and standing 90:20 producing comparable force (p > 0.05), while both supine protocols also showed no significant differences from each other (p > 0.05), excluding males at 150 ms (p = 0.012).
Test duration
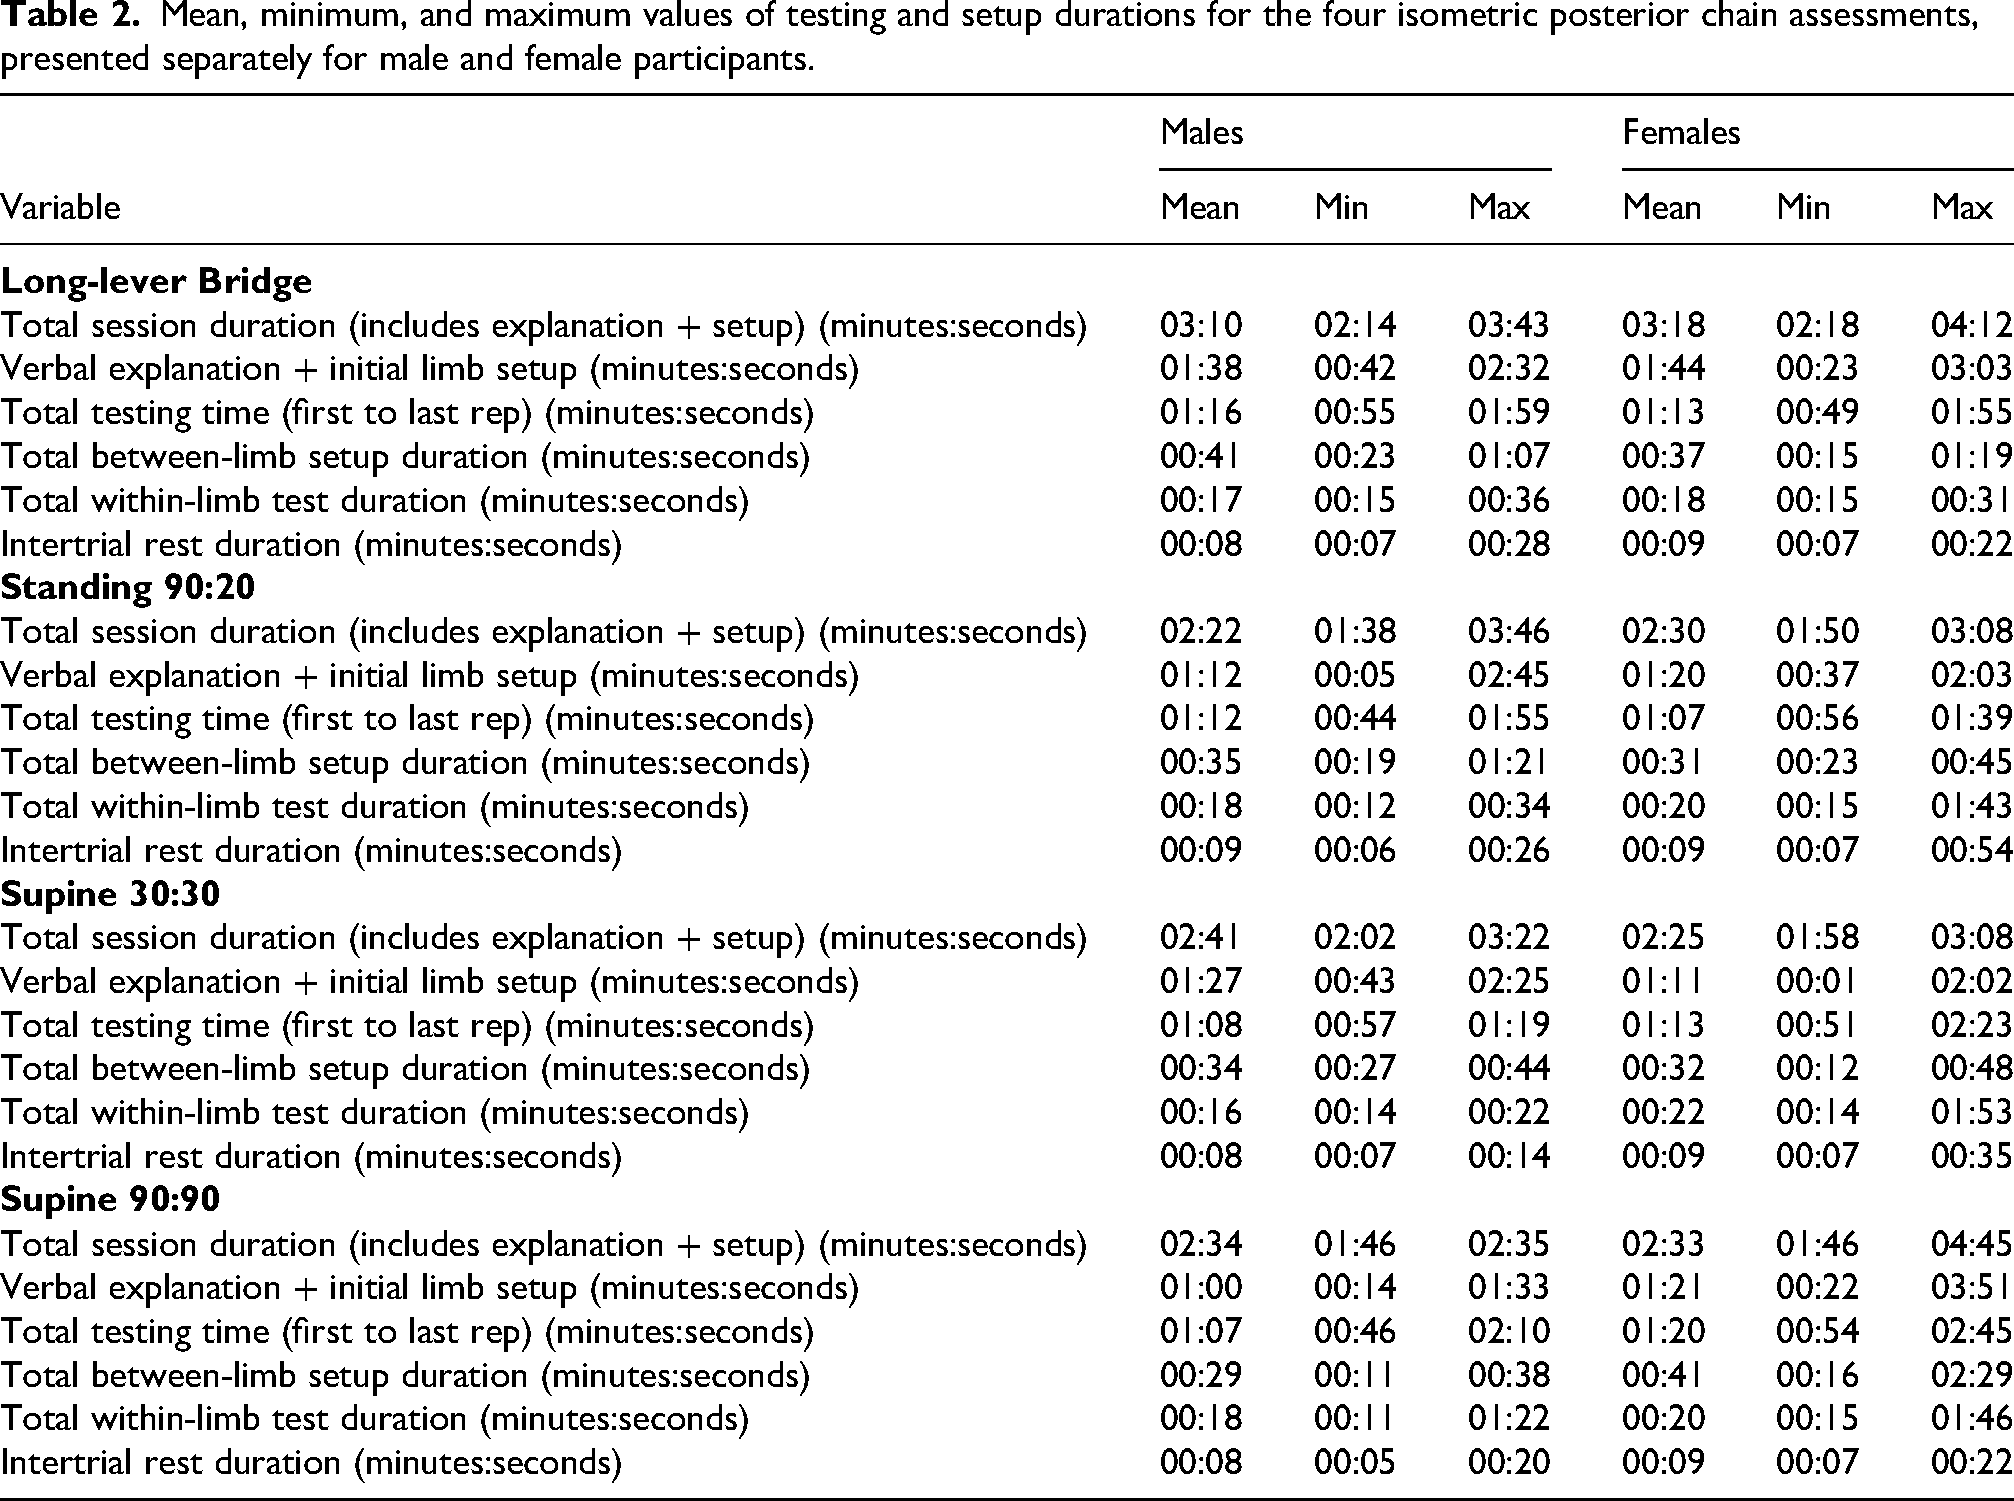
Test duration is summarized in Table 2. Significant main effects were observed for total testing duration in males (p < 0.001, ηp2 = 0.33) and females (p = 0.006, ηp2 = 0.20), with post-hoc comparisons presented in Table 2. Across both sexes, the LLB required the longest completion time, while the supine 90:90 and supine 30:30 were the fastest protocols. Total testing duration, including verbal instructions and equipment setup, ranged from approximately 2:30 to 3:20 min across all protocols. Inter-trial rest periods averaged around 8–9 s, while between-limb setup transitions ranged from 30–40 s.
Mean, minimum, and maximum values of testing and setup durations for the four isometric posterior chain assessments, presented separately for male and female participants.
Participant-Reported preferences
Participant preferences and feasibility rankings are displayed in Table 3 and Figure 1. For male participants, Friedman tests revealed no significant differences across protocols for perceived effort (χ2 = 6.62, p = 0.085), comfort and feasibility (χ2 = 2.47, p = 0.481), or post-exercise soreness (χ2 = 5.94, p = 0.115). In contrast, female participants demonstrated significant differences across protocols for perceived effort (χ2 = 11.65, p = 0.009), and comfort and feasibility (χ2 = 11.51, p = 0.009), though no differences were observed for post-exercise soreness (χ2 = 7.71, p = 0.052). Post-hoc pairwise comparisons for female participants revealed that the supine 90:90 was rated as significantly easier than the LLB (p = 0.010) and significantly more comfortable than the LLB (p = 0.009), while the standing 90:20 was also rated as significantly easier than the LLB (p = 0.010).
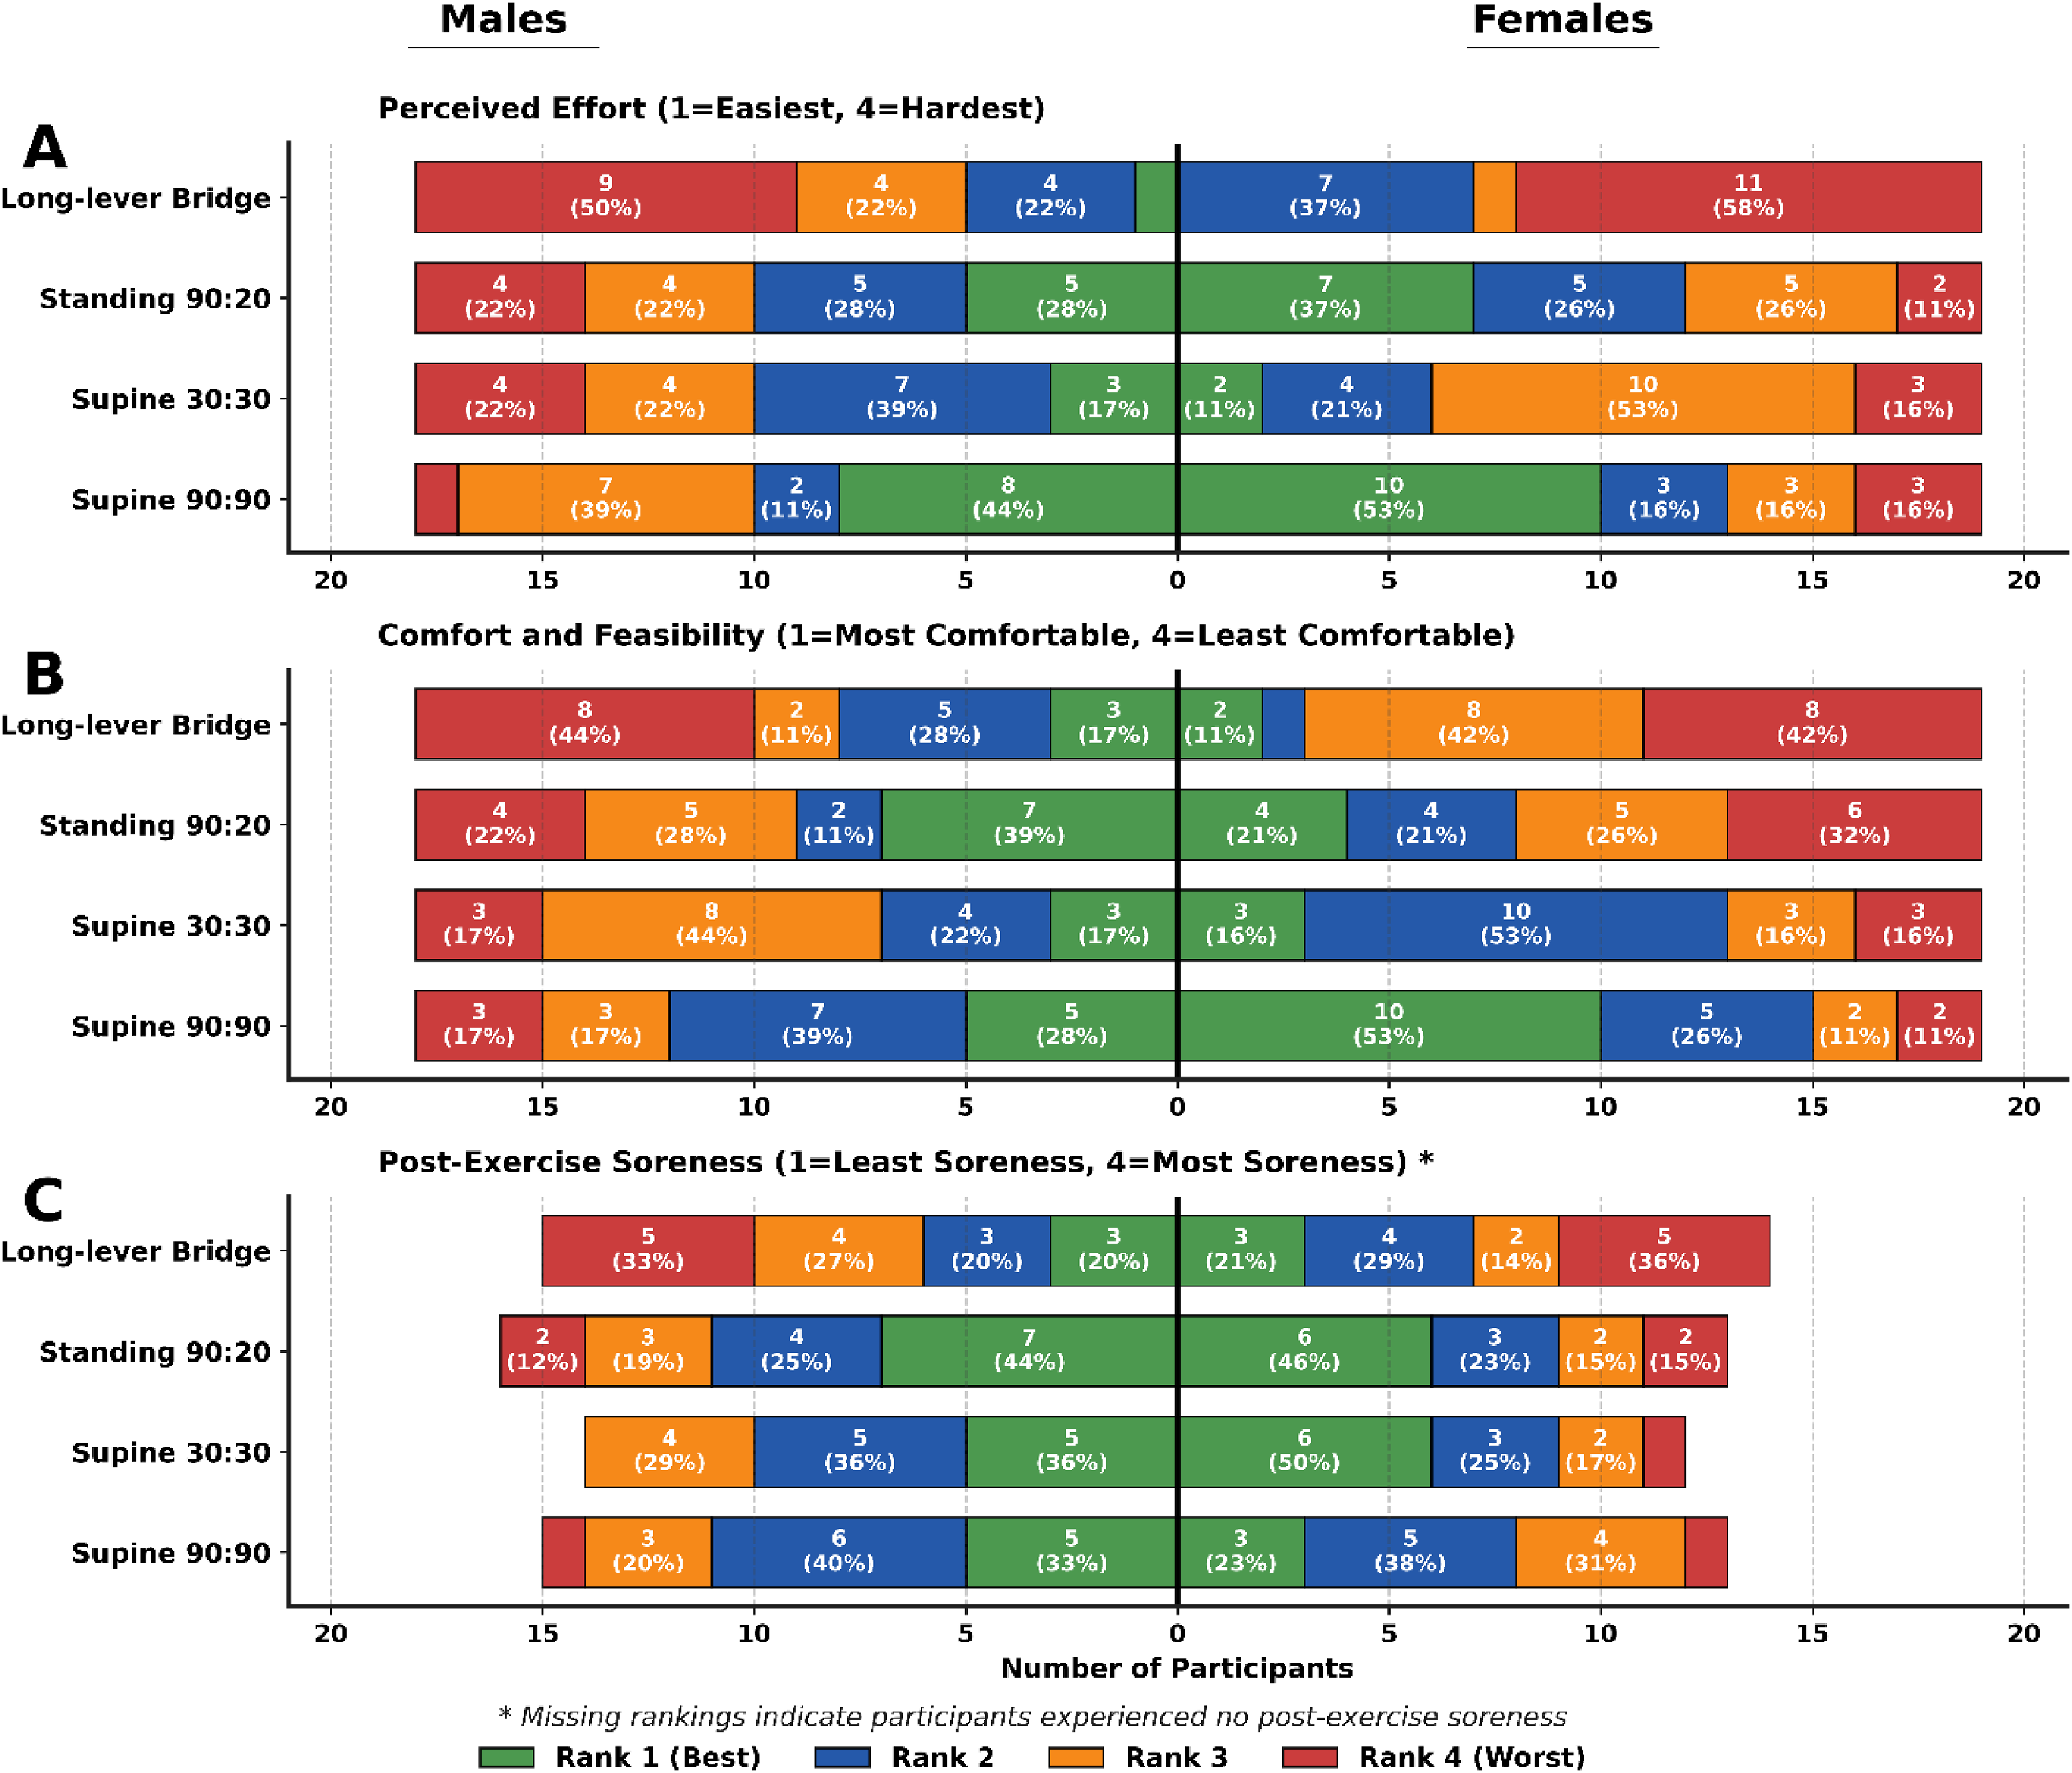
Questionnaire response distribution across the four isometric posterior chain assessments for male (left) and female (right) participants: (A) perceived effort, (B) comfort and feasibility, and (C) post-exercise soreness. Responses were recorded using a 4-point Likert scale (1 = lowest, 4 = highest). Stacked bars represent the proportion of participants selecting each rating, with absolute frequencies and percentages displayed within each segment.
Friedman test mean rank comparisons of perceived effort, comfort and feasibility, and post-exercise soreness across the four isometric posterior chain assessments, presented separately for male and female participants. Rankings are derived from a 4-point Likert scale (1 = lowest, 4 = highest), with lower mean ranks indicating more favorable ratings. Median values are presented in parentheses.
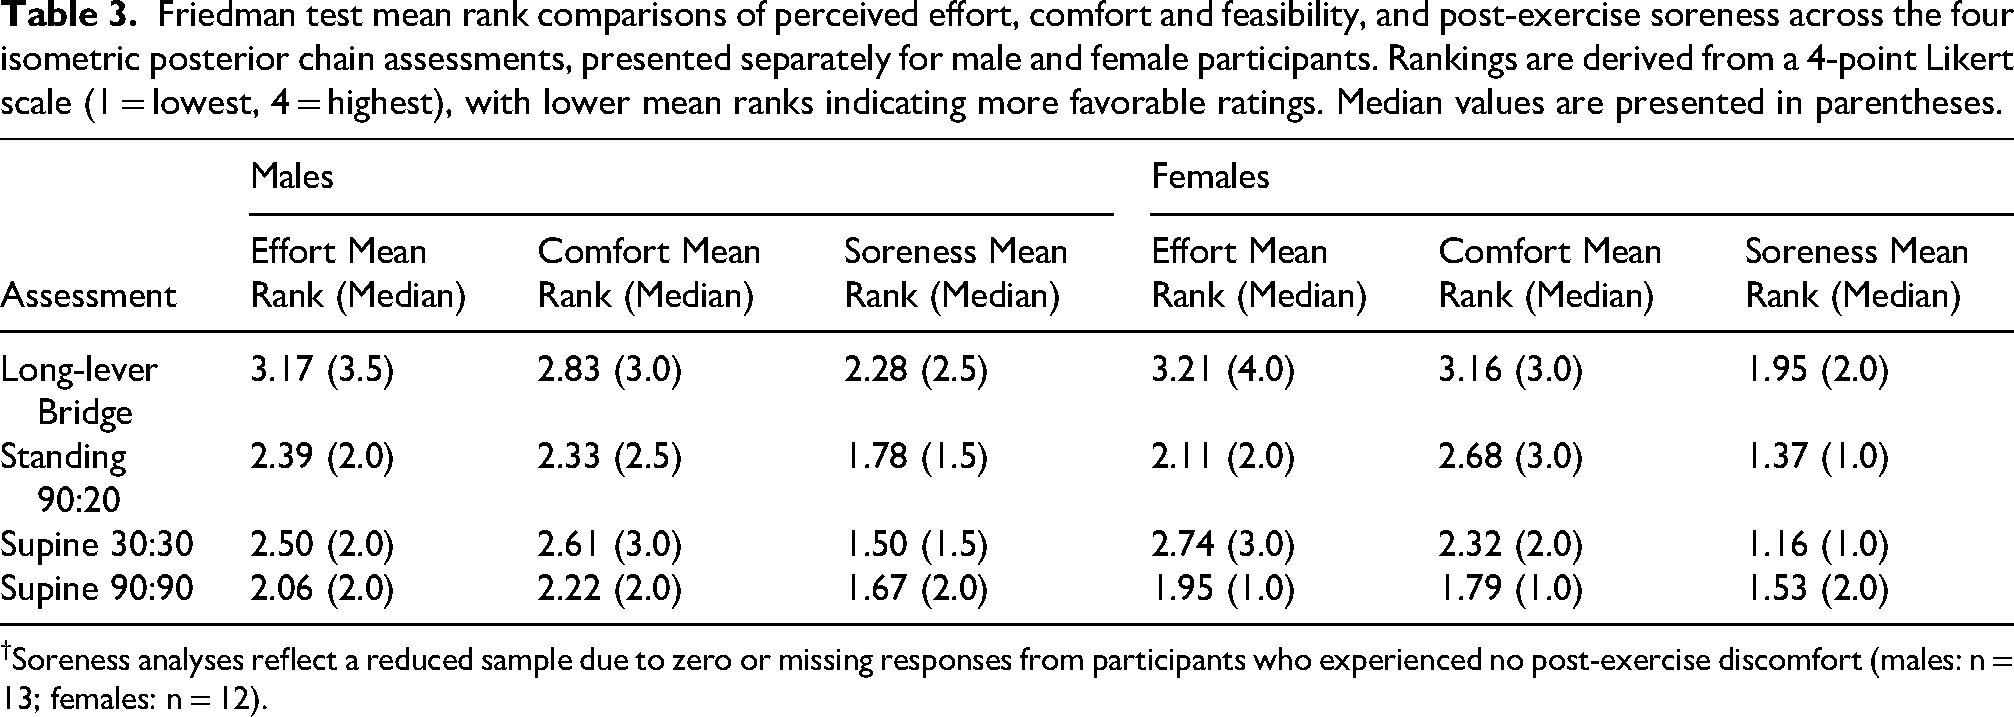
Soreness analyses reflect a reduced sample due to zero or missing responses from participants who experienced no post-exercise discomfort (males: n = 13; females: n = 12).
Assessment interchangeability
As shown in Figure 2, correlations between assessments differed markedly by sex. In males, two pairs demonstrated very large correlations: LLB-90:20 (r = 0.70) and 30:30–90:90 (r = 0.72), while the remaining pairs were small to moderate (r = 0.21–0.30), suggesting that performance on one assessment does not consistently carry over to another. In females, correlations were more consistently moderate to very large across all pairs (r = 0.46–0.82), with the 90:20–30:30 relationship being particularly strong (r = 0.82), suggesting that stronger females tend to rank relatively similar across assessments, perhaps excluding the LLB, whereas in males this consistency was largely absent.
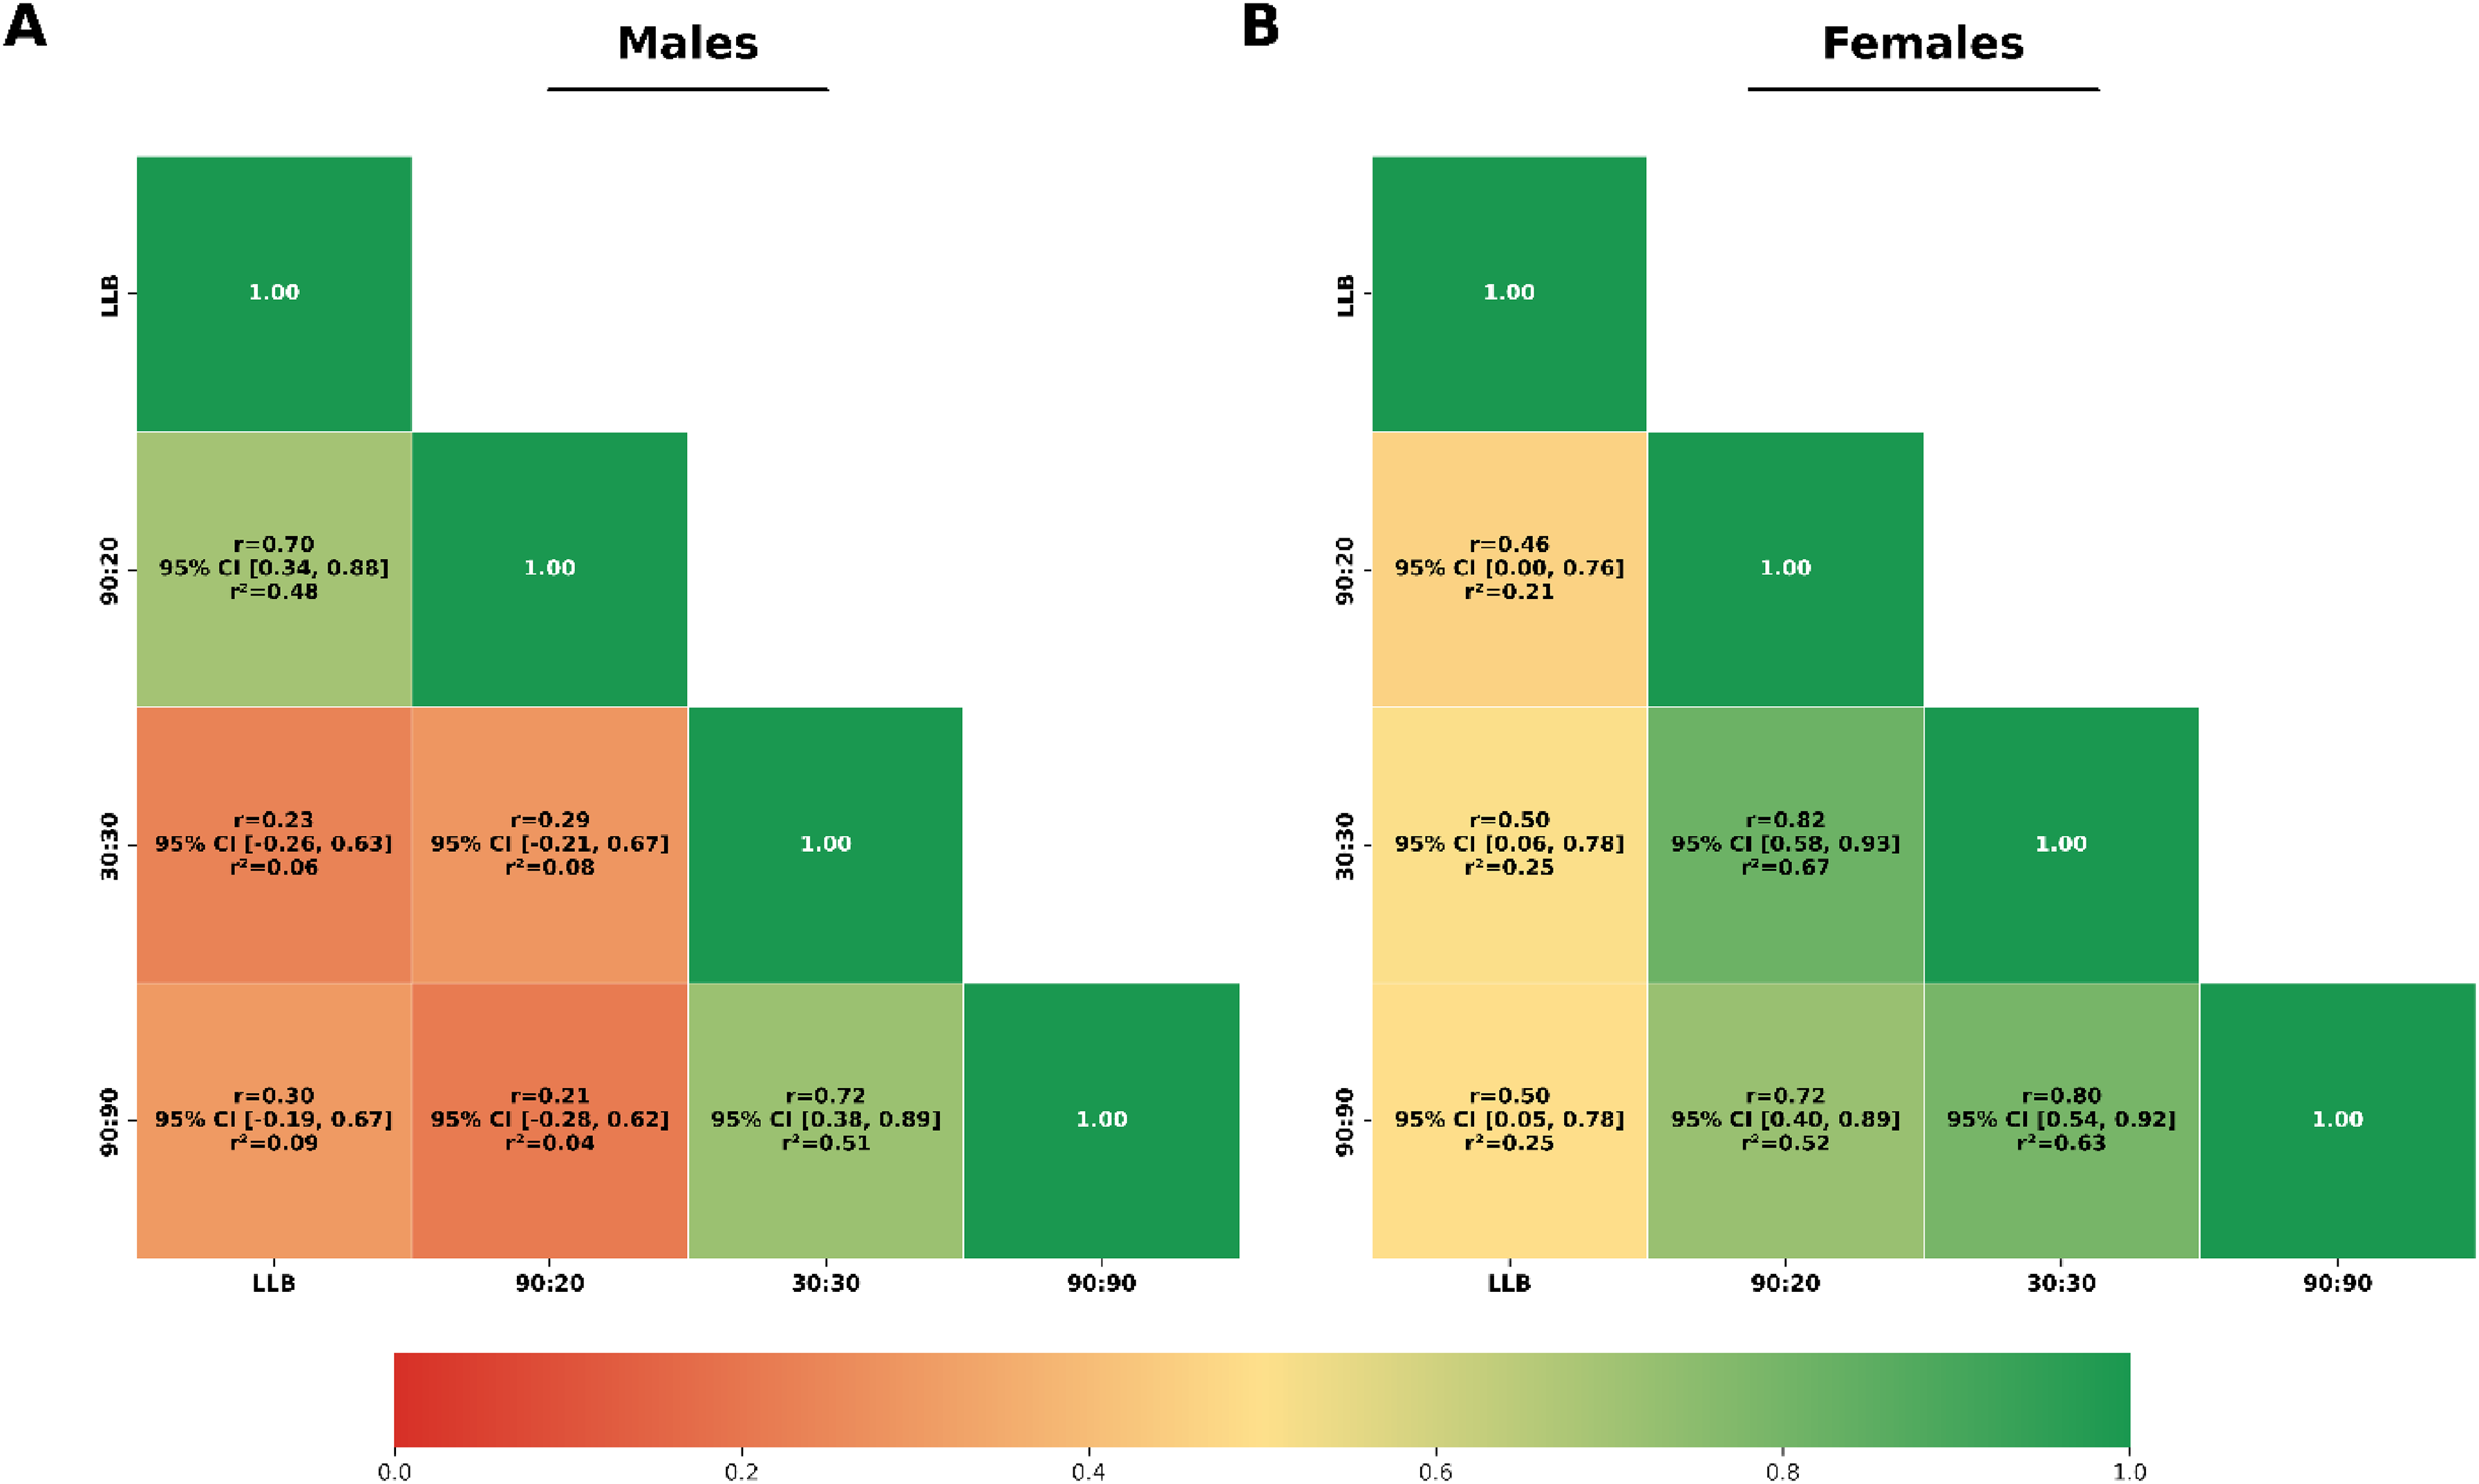
Pearson correlation heatmap illustrating relationships between the four isometric posterior chain assessments for (A) male and (B) female participants. Each cell displays the correlation coefficient (r), 95% confidence interval, and coefficient of determination (r2). Correlation magnitudes were interpreted as: trivial (0.00–0.10), small (0.11–0.30), moderate (0.31–0.50), large (0.51–0.70), very large (0.71–0.90), and nearly perfect (>0.90).
Discussion
The present investigation was performed to examine the feasibility, practicality, perceptions, and reliability of four commonly employed isometric posterior chain assessments to inform evidence-based selection in high-performance sporting environments and further evaluate the comparative validity of force-time characteristics between assessments. The main findings revealed substantial differences in force production between assessment protocols, with large effect sizes observed across peak force and rapid force production time-points in both sexes. Despite these substantial differences, certain protocol comparisons, namely the LLB versus standing 90:20 and the supine 90:90 versus supine 30:30, revealed smaller and less consistent effects across early force-time points while all remaining pairwise comparisons demonstrated consistently large between-protocol differences. These groupings are perhaps unsurprising given that the LLB and standing 90:20 both involve hip extension and knee flexion moments, whereas the supine 90:90 and 30:30 emphasize knee flexion while precluding hip extension contribution, likely explaining the observed clustering and substantially larger between-group differences. As such, the choice of isometric posterior chain assessment is not trivial, as it fundamentally influences the magnitude and characteristics of the force output obtained, with meaningful implications for protocol selection in applied sporting environments.
While a substantial body of evidence has historically emphasized the validity and reliability of assessment methods,24–26 both of which remain essential prerequisites for informed decision-making in sport, these methodological standards alone do not guarantee successful implementation in applied settings. As Buchheit and Allen 27 argue, acceptable validity and reliability represent only one consideration for assessment implementation, as full utility may only be understood when deployed in high-performance sport environments across representative periods. Assessment methods that, despite demonstrating acceptable validity and reliability, are logistically burdensome, overly invasive, or fail to yield actionable insights are unlikely to gain traction among practitioners and athletes. 28 Similarly, Windt et al. 29 propose that successful adoption of assessment methods requires anticipating operational barriers and critically evaluating the usefulness of the information, amongst other considerations. In this context, factors such as test duration, participant perceptions of effort or comfort, and athlete apprehensions become equally important considerations, given that poor acceptability may undermine compliance and limit practical applicability regardless of measurement quality. The aim of the present study was therefore to evaluate the practical implementation factors alongside reliability and force-time characteristics, incorporating test duration and participant-reported perceptions via questionnaire to assess whether athletes experienced undue concern or discomfort that might compromise real-world use.
The observed differences in test duration and participant perceptions present a series of trade-offs rather than a clear hierarchy of protocol superiority. From a time efficiency standpoint, the supine 90:90, supine 30:30, and standing 90:20 protocols were relatively comparable, each requiring approximately 2:30–2:40 min for total assessment completion. The LLB, on the other hand, required notably longer (approximately 3:10–3:20 min), with the additional time primarily attributed to extended verbal explanation and setup, as well as between-limb setup duration. While this represents only an additional duration of 50 s at most, the difference reflects the greater complexity of positioning and setting up for the LLB, which may introduce a logistical burden for practitioners and athletes during routine implementation. The practical significance of this time difference is largely dependent on the size of the athlete cohort being assessed. For smaller squads, such as individual position groups in team sports, or rosters of 20–30 athletes, the cumulative difference remains relatively modest, approximately 15–25 min in total. In contrast, in sporting populations with substantially larger rosters, potentially exceeding 100 athletes, the 50-s differential compounds to an additional 80 min of testing duration. In environments where testing must be completed within narrow time windows or integrated alongside other training demands, this difference may shift from trivial to operationally significant, potentially necessitating additional testing sessions that further strain scheduling logistics. Compared to isometric plantar flexion assessments, where McMahon et al. 28 reported longer within-limb and between-limb setup durations, the present posterior chain protocols appear relatively time-efficient. However, the 50-s differential between protocols remains practically meaningful in large-scale testing contexts, nonetheless.
Beyond time efficiency, participants’ perceptions revealed more substantive differences. The supine 90:90 protocol was consistently rated as the easiest and most comfortable by participants across both sexes, with particularly pronounced differences among female athletes who rated it as significantly easier and more comfortable than the LLB. Similarly, the standing 90:20 was also rated as significantly easier than the LLB by female participants. The supine 30:30 occupied a middle ground, rated less favorably than the supine 90:90 but more favorably than the LLB, though these differences did not reach significance in post-hoc comparisons. While males showed similar trends in their preference patterns, the differences between protocols were considerably less pronounced and did not reach significance for any perceptual measure. Notably, post-exercise soreness ratings did not differ significantly across protocols for either sex, suggesting that concerns about residual muscular discomfort are unlikely to be a primary differentiating factor in protocol selection. Nonetheless, it is worth mentioning that the LLB consistently received the highest mean soreness rating across both sexes, which may indicate a tendency toward greater post-exercise discomfort despite the absence of significance. This interpretation, however, must be made cautiously, as a substantial number of participants elected not to respond to the soreness item, indicating they experienced no discernible soreness or discomfort either during or following the assessment. Rather than assigning arbitrary values that would misrepresent their experiences, these non-responses were treated as missing data. Consequently, the soreness ratings reflect only those athletes who perceive some degree of discomfort, which may have reduced statistical power to detect differences between protocols despite the observable trends. However, given that isometric contractions typically induce minimal post-exercise soreness, at least when compared to eccentric muscle actions, 30 it is plausible that no meaningful differences exist between protocols in this regard. Nonetheless, the trend toward higher soreness ratings for assessments performed at longer muscle lengths aligns with prior literature indicating that isometric contractions at extended muscle lengths may elicit greater post-exercise discomfort.31,32 This interpretation is complicated, however, by the standing 90:20 protocol, which involves the greatest muscle lengths of the four assessments, yet receiving lower soreness ratings than the LLB, suggesting that muscle length alone may not fully explain the perceived discomfort.
While participant perceptions, willingness to engage with an assessment protocol, and time efficiency represent critical implementation considerations, they must still be, as aforementioned, weighed against the measurement properties of each protocol. Importantly, these domains should not be evaluated in a vacuum but rather considered as equal components of a broader decision-making framework, where the practical value of an assessment emerges from the integration of what can be measured reliably with what can be implemented feasibly and sustained over time. In the present study, peak force demonstrated excellent reliability across all four assessment protocols for both sexes, indicating that practitioners can confidently monitor maximal force production regardless of protocol selection. While previous researchers have demonstrated excellent peak force reliability for the LLB, 17 the remaining assessments have typically shown variable reliability depending on the metric employed, with relative values often falling within the good range, although absolute values have typically demonstrated excellent reliability.14,33,34 The present investigation found excellent reliability for both relative and absolute measures across all four protocols, exceeding previously reported values for the supine and standing assessments. However, across all four assessments, reliability deteriorated when examining earlier force-time points, with marked differences between protocols. The standing 90:20 demonstrated moderate-good reliability across all rapid force production time points (50–250 ms), with the LLB following most closely, showing a similar pattern for the females, although poor reliability between 100–150 ms for males. These findings are consistent with previously reported reliability values for both the standing 90:20 and the LLB assessments, which typically reported similar reliability during early force-time points.17,35 On the other hand, the supine 90:90 demonstrated poor reliability across all early force-time points for females, including 50–100 ms for males, deviating quite substantially from that which has been reported previously in similar sporting populations. 13 Finally, the supine 30:30 maintained moderate reliability at late-stage force-time points and poor reliability at early-stage force production for males, though it should be noted that a limited body of evidence has reported on rapid force production reliability for this protocol.
Beyond reliability and acceptability, the magnitude of force production across protocols warrants consideration as well. The LLB and standing 90:20 produced comparable peak forces, suggesting they may be used interchangeably when maximal force production is the primary outcome. However, correlational analyses revealed that while mean forces were comparable, the relationship between individual scores varied by sex, thereby potentially holding true for males (r = 0.70, r2 = 0.48), but not in females (r = 0.46, r2 = 0.21). Moreover, these two protocols differed at late-stage time points (200–250 ms), with the LLB producing greater forces across both sexes. Additionally, both the LLB and standing 90:20 differed substantially from both supine assessment protocols at all force-time points, indicating that these protocols cannot be used interchangeably. Finally, the two supine protocols generally showed no differences from each other, aligning well with prior research,11,14 suggesting they may produce comparable force outputs despite minor variations in joint positioning. From an applied perspective, isometric posterior chain assessments have typically served two primary purposes: benchmarking strength values, 14 or monitoring neuromuscular fatigue. 16 From a benchmarking standpoint, either the LLB or standing 90:20 appears most appropriate given their higher force outputs, simultaneous emphasis on hip extension and knee flexion, 15 and consistent capture of rapid force production characteristics that may be most relevant in sporting contexts. However, practitioners should exercise caution when employing the LLB due to potential athlete apprehension and reduced acceptability, particularly among female athletes, giving a slight edge to the standing 90:20 assessment. On the other hand, for fatigue monitoring purposes, where frequent and repeated assessments are essential, the supine 90:90 may represent a more pragmatic alternative. Its excellent peak force reliability, which appears sufficiently sensitive to posterior chain fatigue following on-field activity, 1 combined with the most favorable participant perceptions, minimal setup and duration requirements, may facilitate sustained compliance over time. While the supine 90:90 may sacrifice the ability to reliably assess rapid force production, the operational advantages it offers may outweigh this limitation when peak force monitoring alone appears sufficient for detecting fatigue-related decrements. However, this interpretation warrants caution, as other research has reported acceptable rapid force production for similar supine protocols. 13 Nevertheless, if rapid force production is deemed essential for fatigue monitoring, the standing 90:20 remains a viable option, offering consistent reliability across the force-time curve with only marginally reduced participant perceptions compared to the supine 90:90.
Despite the widespread use of isometric assessments in high-performance sport, it is important to acknowledge that isometric and dynamic strength represent distinct neuromuscular constructs, with evidence suggesting limited proportionality between changes in these two strength qualities. 36 This distinction does not, however, diminish the practical utility of isometric assessments in applied settings. Rather, isometric protocols offer several advantages that dynamic tests cannot always replicate, including precise control over joint angles, 37 reduced fatigue burden, 37 good reliability at various force-time points, 38 and the ability to isolate specific muscle groups without the confounding influence of technique or coordinative demands. 37 Furthermore, their primary value in many high-performance environments lies not in predicting dynamic performance, but in monitoring neuromuscular status, 1 detecting asymmetries, 1 tracking rehabilitation progress, 39 and identifying athletes at elevated injury risk, 40 applications for which isometric measures have demonstrated meaningful sensitivity. In this context, the present findings contribute not only to the methodological literature on posterior chain assessment but to the broader question of which protocols are best suited to fulfil these applied purposes reliably and feasibly.
Limitations
A potential limitation of the study is that the reduced reliability observed at early force-time points may reflect the testing procedures employed. In prioritizing rapid assessments to mirror real-world sporting environments, as evidenced by the relatively brief test durations in Table 2, less emphasis may have been placed on extensive familiarization or standardization procedures that could improve the reliability of rapid force characteristics. 41 While this approach enhanced ecological validity, it may have compromised measurement precision at early force-time points. Moreover, considering the inter-trial rest periods were relatively brief, reduced reliability at the early force-time points across the assessments may have been influenced by residual fatigue from preceding repetitions. However, any such effect is likely minimal and more reflective of potential individual variability than a systematic group effect, as each successive repetition produced, on average, greater force across all four assessment methods.
Additionally, participant perceptions were assessed 24 h following completion of all four protocols to allow athletes to directly compare their experiences across assessments. This approach may have introduced potential confounds related to testing order and residual fatigue. Protocols performed earlier in the testing sequence may have been perceived as more demanding as they represent the athletes’ first exposure to maximal isometric contractions, while delayed onset muscle soreness from earlier assessments may not have fully resolved, potentially inflating discomfort ratings for later protocols. While extending inter-assessment intervals (e.g., 72 + hours) may have mitigated fatigue concerns, doing so would have substantially prolonged the study duration and risked introducing potential training-induced adaptations that could further confound results. The 24-h recovery period thus represents a compromise between minimizing residual fatigue and maintaining a feasible timeline, though the influence of testing order on perceptions cannot be entirely ruled out. However, any systematic bias related to testing order should be relatively well mitigated, given that protocol sequences were randomized on an individual level, distributing potential order effects across the sample rather than confounding specific protocols.
Conclusions
The results of this investigation demonstrate that no single isometric posterior chain assessment optimizes all implementation criteria simultaneously, and protocol selection should be guided by the specific objectives and operational constraints of the testing environment. Peak force can be monitored reliably across all four protocols, though the reliability of rapid force production varies considerably and represents the primary differentiating factor. The standing 90:20 and LLB produced the greatest force outputs and demonstrated more consistent measurement properties across all force-time points, though the LLB required notably longer setup time and was rated least favorably by participants. In contrast, the supine 90:90 and supine 30:30 offered superior time efficiency and participant acceptability but produced reduced force outputs and less stable rapid force outcomes. For benchmarking applications where assessments are infrequent, either the LLB or standing 90:20 may be appropriate, while for routine fatigue monitoring where sustained compliance is essential, the supine 90:90 represents a pragmatic and feasible alternative.
Supplemental Material
sj-pdf-1-spo-10.1177_17479541261459652 - Supplemental material for A multidimensional evaluation of various isometric posterior chain strength assessments: Comparative force production characteristics, administrative feasibility, and athlete-reported experience
Supplemental material, sj-pdf-1-spo-10.1177_17479541261459652 for A multidimensional evaluation of various isometric posterior chain strength assessments: Comparative force production characteristics, administrative feasibility, and athlete-reported experience by Adam E. Sundh, Nicholas J. Ripley, AJ Lamb, Devin S. VerVoort and Paul Comfort in International Journal of Sports Science & Coaching
Footnotes
Ethical considerations
This study was conducted in accordance with the Declaration of Helsinki and was approved by the Institutional Review Board at the University of Salford (reference no: 2025-7379-8844, approval date: 30 July 2025).
Consent to participate
All research participants completed and signed an informed consent form after reading a participant information sheet.
Author contributions
AES, PC and NJR contributed to the study conception and design. Material preparation was carried out by AES, AL, PC, NJR, and DSV. Data collection was performed by AES, and DSV. Data analysis was conducted by AES. The first draft of the manuscript was written by AES and all authors commented on previous versions of the manuscript. All authors read and approved of the final manuscript.
Funding
The authors received no financial support for the research, authorship, and/or publication of this article.
Declaration of conflicting interests
The authors declared no potential conflicts of interest with respect to the research, authorship, and/or publication of this article.
Data availability
Data supporting the findings of this study are available upon reasonable request to the corresponding author.
Supplemental material
Supplemental material for this article is available online.
References
Supplementary Material
Please find the following supplemental material available below.
For Open Access articles published under a Creative Commons License, all supplemental material carries the same license as the article it is associated with.
For non-Open Access articles published, all supplemental material carries a non-exclusive license, and permission requests for re-use of supplemental material or any part of supplemental material shall be sent directly to the copyright owner as specified in the copyright notice associated with the article.