
Abstract
NASCAR is the premier American motorsport, with millions of fans who tune in each week to watch drivers compete in a test of skill, endurance, and above all, speed. As with any sport, winning is paramount, and prior research has focused on modeling driver and team characteristics, as well as strategies to optimize race-day performance. However, no prior work has investigated ways to improve driver qualifying performance, a key factor that would naturally improve the likelihood of achieving a strong finishing position in the race that follows. To address this gap, we analyze qualifying lap data from the NASCAR AdventHealth400 using functional principal components analysis followed by agglomerative hierarchical clustering. This allows us to uncover distinct groups of drivers and extract typical behavior. We identify several braking, throttle, and steering strategies that are differentially associated with qualifying performance. By isolating the highest-performing clusters, we offer actionable insights that can be used to enhance qualifying efforts and, ultimately, race-day results.
Introduction
NASCAR (National Association for Stock Car Auto Racing) is one of the most popular motorsports series in the United States, featuring 38 race weekends that culminate in a yearlong championship with millions in prize money. The series has a strong fanbase and generates substantial economic activity through ticket sales, media rights, and sponsorships. 1 Sponsorship investments, in particular, have been shown to yield financial benefits for companies, reinforcing the sport’s commercial significance.2,3 Beyond financial considerations, success in NASCAR is heavily dependent on performance across a diverse set of tracks and conditions, where even small differences in execution can influence outcomes.
A critical factor in achieving strong race results is qualifying performance. Before every race, a qualifying session is held during which each driver completes one to two timed qualifying laps, though most drivers only attempt one. The driver first leaves the pit to complete a warm up lap and increase their speed (not recorded as an official qualifying lap time) and then their first qualifying lap begins as soon as they cross the start-finish line. The faster of the driver’s two laps is treated as their benchmark qualifying lap. Driver’s are then ranked from fastest to slowest according to this lap time, with the highest ranked drivers starting at the front for the race. A higher starting position provides a strategic advantage, reducing the likelihood of mid-pack incidents and allowing drivers to dictate race pace. Prior studies have demonstrated a strong correlation between qualifying position and final race results, indicating that a good qualifying position is a strong predictor of a great race result. 4 While race-day outcomes are influenced by fuel strategy, tire wear, and in-race decision-making, qualifying occurs in a controlled setting where all cars operate under standardized conditions. More specifically, all cars begin their qualifying lap under the same conditions (aside from car setup), even if these conditions might change over the course of the lap itself. This makes qualifying an ideal setting for isolating the impact of driver skill and vehicle setup. Additionally, motorsports present inherent crash risks, and understanding driving patterns during qualifying may provide insights into risk mitigation strategies. 5 Despite these advantages, systematic data-driven analyses of NASCAR qualifying performance remain limited.
The field of motorsports analytics has expanded considerably over time, with research addressing economic factors, race strategy, and predictive modeling. Studies on driver attributes have examined the effects of consistency, momentum, and status on race performance, though findings remain mixed.6,7 Advances in telemetry and communications data have supported race strategy optimization, 8 while predictive modeling has highlighted key determinants of race performance, including starting position and driver experience. 9 Additionally, strong correlations have been reported between qualifying position and final race results, 4 and the role of outcome uncertainty in NASCAR viewership has been examined. 10 While statistical analyses have helped explain performance trends, there is also a cultural aspect to NASCAR that influences team and driver decisions. Fan engagement, for example, is deeply tied to race performance, qualifying success, and perceived driver skill, 11 further underscoring the importance of understanding qualifying strategies.
Prior research on driver learning and feedback mechanisms has focused primarily on other motorsports, such as Formula Renault and motorcycle racing, demonstrating the benefits of multidisciplinary training and real-time feedback in improving driver performance.12,13 Machine learning techniques have been used to classify driving behaviors based on telemetry data,14–16 but little work has examined how specific driving strategies influence NASCAR qualifying outcomes. This gap underscores the need for a systematic approach to profiling qualifying performance.
In this study, we address this gap by applying functional data analysis (FDA) to NASCAR qualifying laps. By representing driver qualifying laps as functional data, we analyze how key driving features vary throughout the lap. To manage the high-dimensional nature of telemetry data, we employ functional principal component analysis (FPCA) to extract a small set of representative driving features. We then use hierarchical clustering to group drivers with similar qualifying behaviors, enabling the characterization of distinct driving styles. Our approach provides insights into the driving strategies associated with successful qualifying performance and identifies potential areas for improvement among underperforming drivers. This study contributes to the growing field of motorsports analytics by introducing a systematic, data-driven framework for evaluating NASCAR qualifying performance, offering actionable insights for teams seeking to refine driver strategies and enhance competitive performance.
The remainder of the article is organized as follows. The “Data” section describes the data, the preprocessing steps used to convert it into functional form, and results from exploratory analysis. The “Methods” section outlines the FPCA and feature-weighted agglomerative hierarchical clustering methods used to analyze the data. The “Results” section presents the findings from FPCA and clustering, highlighting distinct driver profiles based on brake pressure, steering angle, and throttle position. Finally, the “Discussion” section discusses the study’s limitations and directions for future research.
Data
To perform our analysis, we utilize qualifying session data for each driver from the 2024 AdventHealth 400, held at Kansas Speedway in Kansas City (See Figure 1). The dataset consists of two primary sources: In-Vehicle Operational Telemetry (IOT) data, which captures real-time vehicle dynamics and driver inputs, and position data, which records spatial movement along the track. The IOT data includes features such as steering angle, brake pressure, engine speed (in revolutions per minute), gear selection, throttle position, and timestamps. The position data provides the car’s location at each recorded time step, represented as
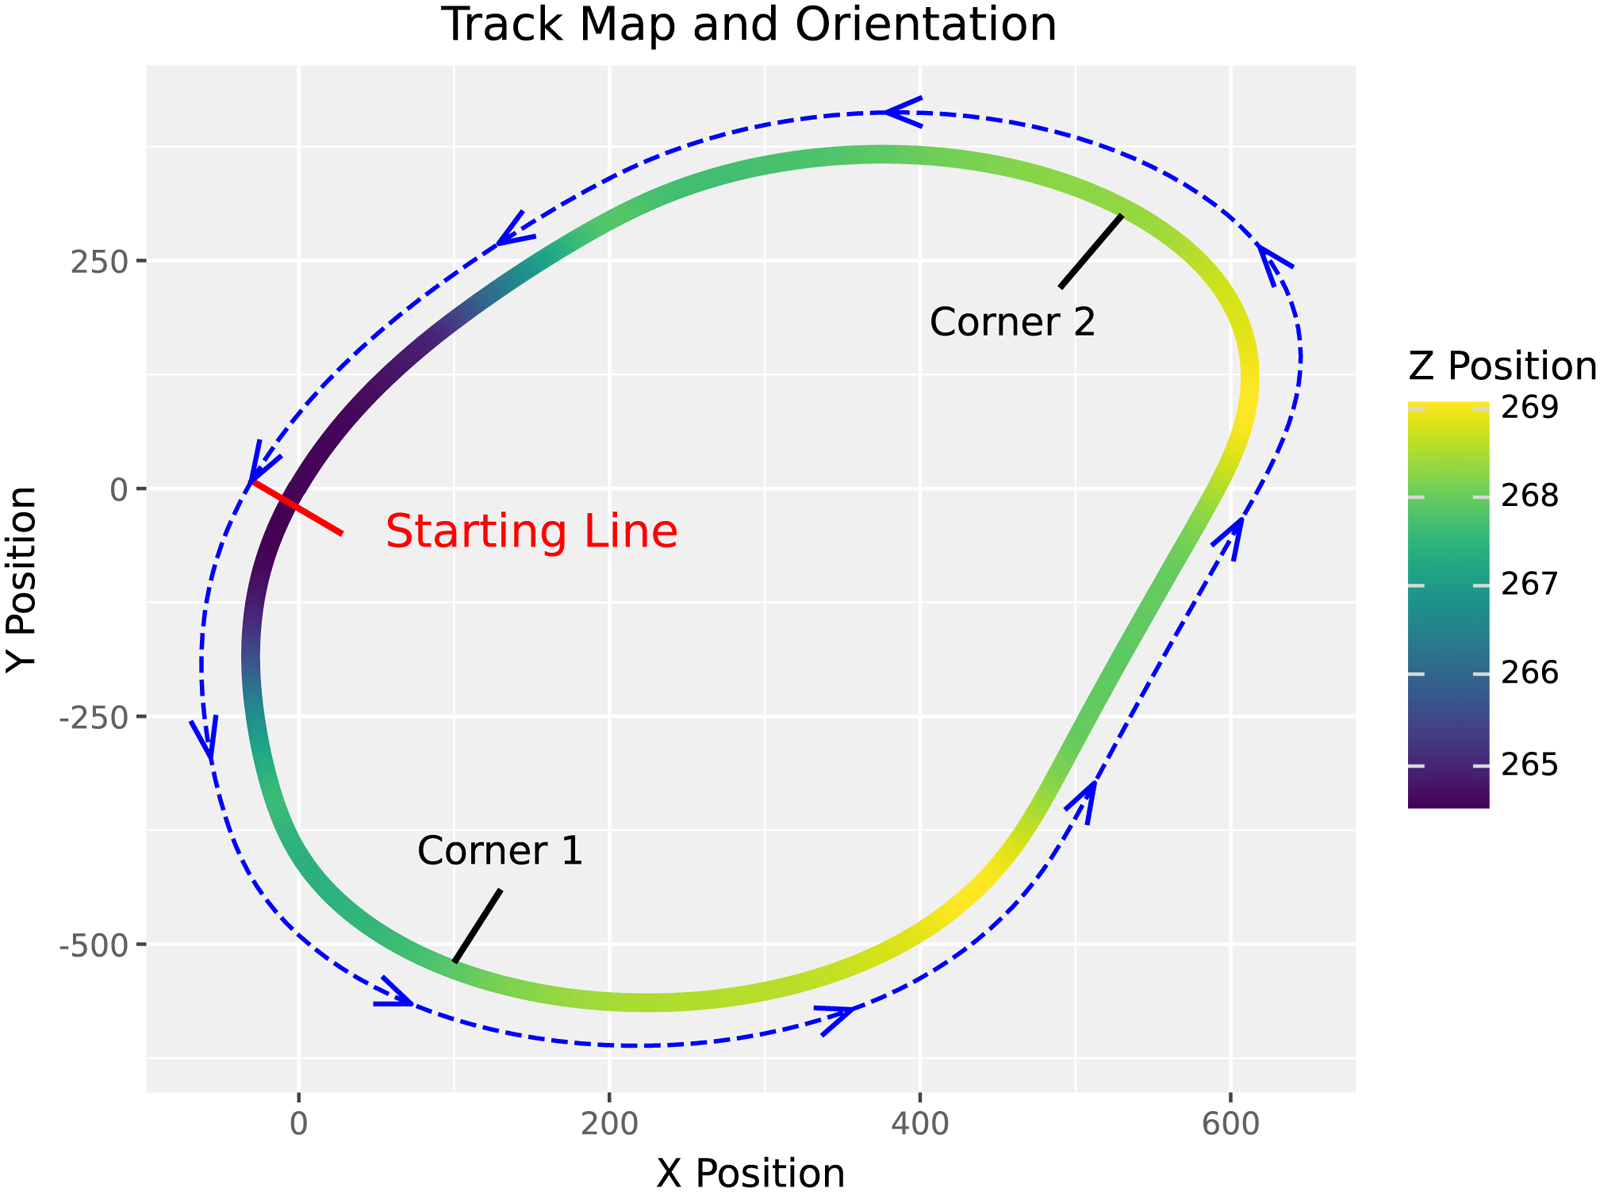
Kansas Speedway Track Orientation and Starting Line: The blue arrow shows the orientation of the track, and the red line indicates the starting line of the track. Note that drivers do not start from a stop when they begin their qualifying lap. Instead, they exit the pit ahead of the starting line and complete a warm up lap to ensure their speed is high enough when they begin their timed qualifying lap. The axes of the plot are unitless since the underlying data uses an arbitrarily defined grid to model the track.
Because our analysis focuses on the relationship between telemetry features and track position over a qualifying lap, we merge the IOT and position data for each car. However, these datasets are sampled at different rates, with position data recorded at approximately 50 records per second, while IOT data is sampled at around 9.1 records per second. This means that for each car there is a much greater number of position records than there are IOT records. Moreover, the mismatch in timestamps across these records makes it impossible to merge them directly. Otherwise, one could simply choose the position record corresponding to the time stamp of each IOT record. To synchronize these sources, we utilize linear interpolation to estimate the value of brake pressure, throttle position, and steering angle at timestamps associated with each location record based on the timestamps given for each IOT record. Linear interpolation is reasonable across each of the IOT features due to the high frequency nature of the data and the fact that drivers are not typically capable of modulating inputs much faster than a tenth of a second. Therefore, we can make the simplifying assumption that between any two given points, the rate of change in IOT values is constant without introducing significant estimation error. Additional raw data preprocessing steps are detailed in the “Data Filtering” section of the appendix.
Although most of the laps contained in the resulting data were valid, some contained missing data. In cases where missingness occurred at low rates between consecutive data points, linear interpolation was used to impute the missing values. Other imputation approaches can likely be utilized to similar effect. However, if at least 90% of the data was missing from a given IOT feature, we chose to exclude the associated lap from the analysis since any imputation of such large quantities of missing data would likely be unrepresentative. Accordingly, we excluded laps for cars 8, 33, 51, and 84 because each contained an insufficient amount of usable data. Car 15 was also removed from the analysis as its extreme outlier behavior led to unreasonable results. This choice is explained further in the “Results” section. The data processing procedure is summarized in Figure 2
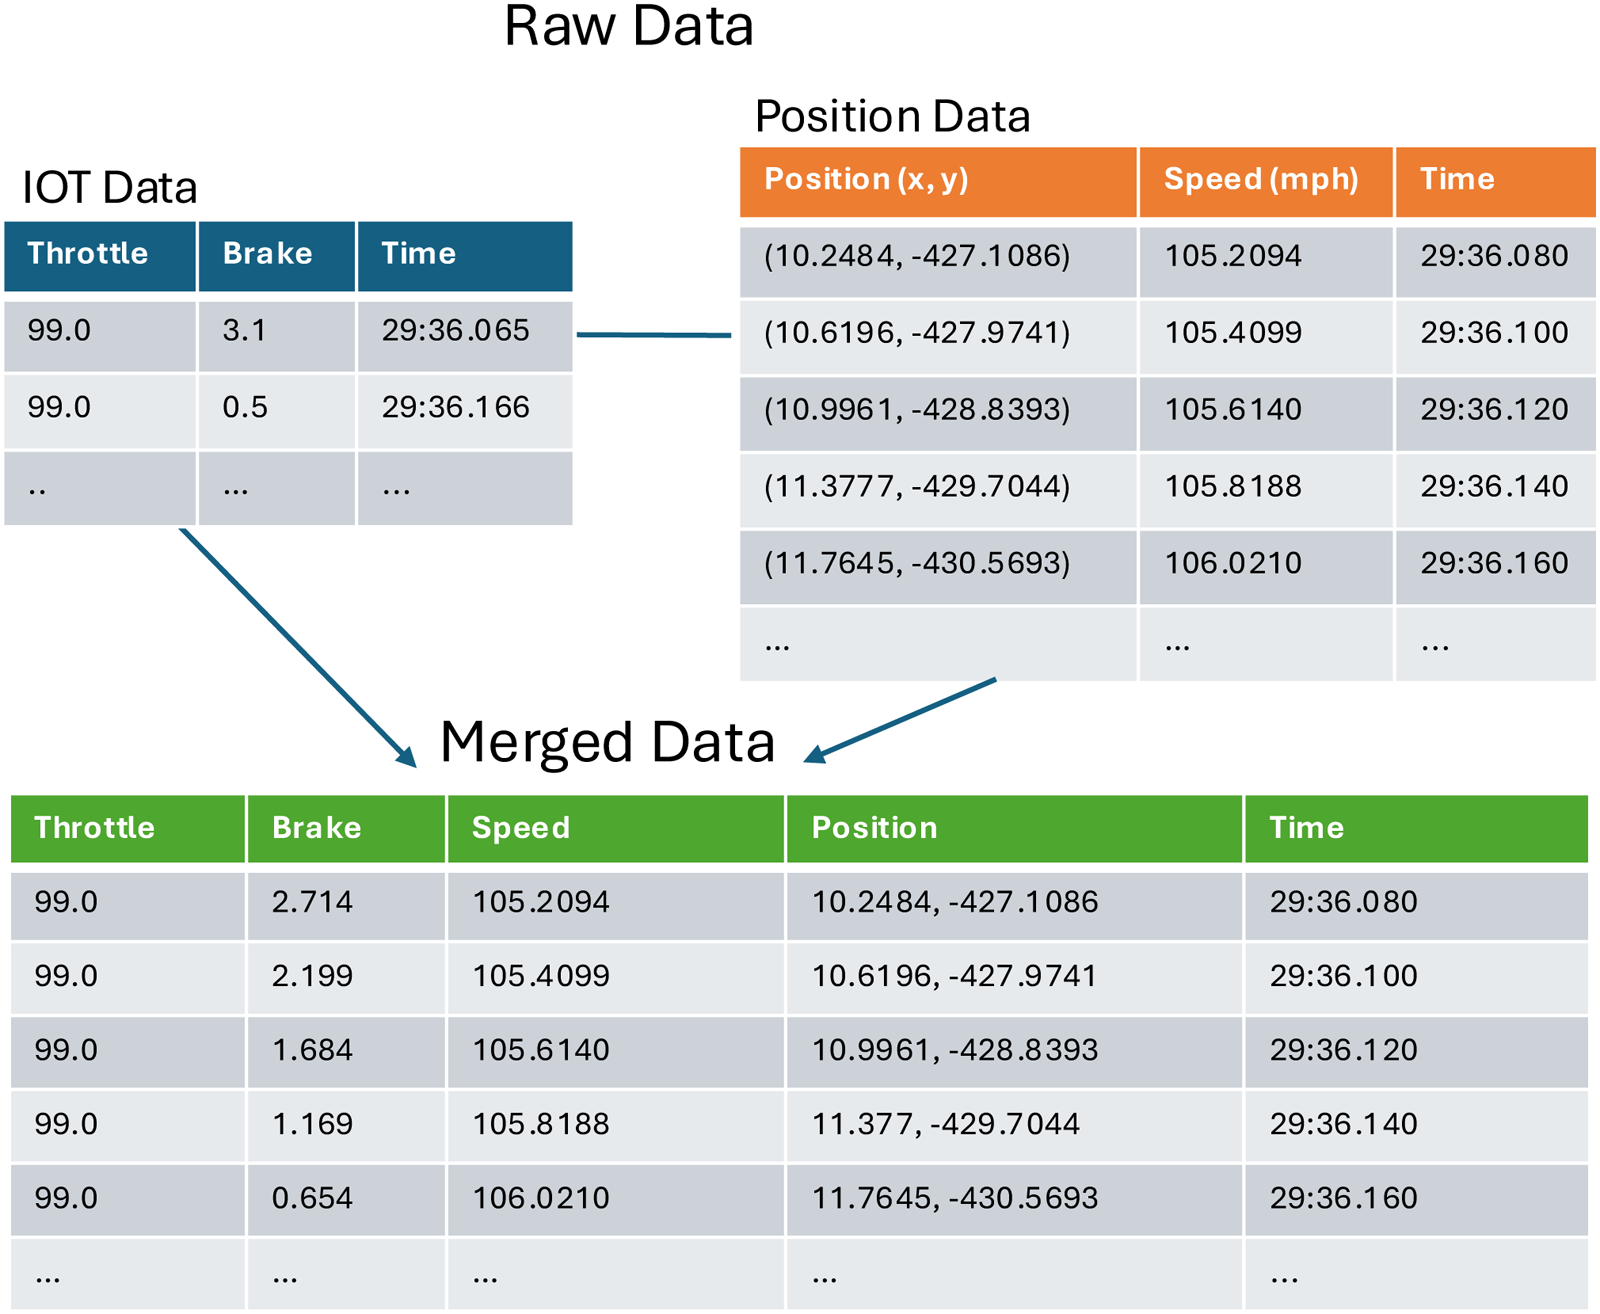
We first combine the IOT and position data of each car based on time, and then filter the resulting data for samples which belong to the actual qualifying lap.
To standardize interpolated laps across drivers and reduce computational complexity, we first identify a common reference driving line and then sample 500 evenly spaced points along it. This reference line is taken from the center line of the track. Using a fixed spatial reference helps to mitigate any bias that might occur by choosing a single driver’s lap as the baseline. We then utilize a specialized interpolation procedure to estimate the IOT values at the reference line. Further details on this procedure can be found in the “Location-wise Interpolation” section of the appendix.
This approach ensures that all drivers have comparable representations while preserving high-resolution telemetry patterns. Furthermore, these interpolated values can be trusted since this method effectively projects the reference location
As an initial exploratory analysis, we visualized the telemetry data for a single driver’s lap from a spatial perspective. These features demonstrate a strong spatial correlation, as brake pressure and steering angle increase as Car’s navigate each corner of the track. Throttle position input drops at each corner as well to assist in reducing corner-entry speed.
The mean and standard deviation of each feature over all qualifying laps are presented in Figure 3. Two points of peak break pressure occur near locations 100 and 310, and these locations correspond to corners 1 and 2 of the track. The standard deviation of braking input is greatest at corner 1, and is slightly lower at corner 2. Steering angle demonstrates similar deviation patterns, but these periods of input variance are drawn out over a corner as opposed to a very small set of locations at corner entry. In contrast to brake pressure, throttle position is minimized near locations 100 and 310. Yet, like the other two features, variance of throttle input is maximized at these points. Notice that the standard deviation of throttle position is slightly higher for corner 2 than corner 1—the opposite of the trend demonstrated by brake pressure. In practice, these patterns are likely observed because there are many different ways to minimize lap time while driving through a corner, but the fastest way to navigate a straight is to simply maximize throttle application, minimize brake pressure, and maintain a consntant steering angle input.
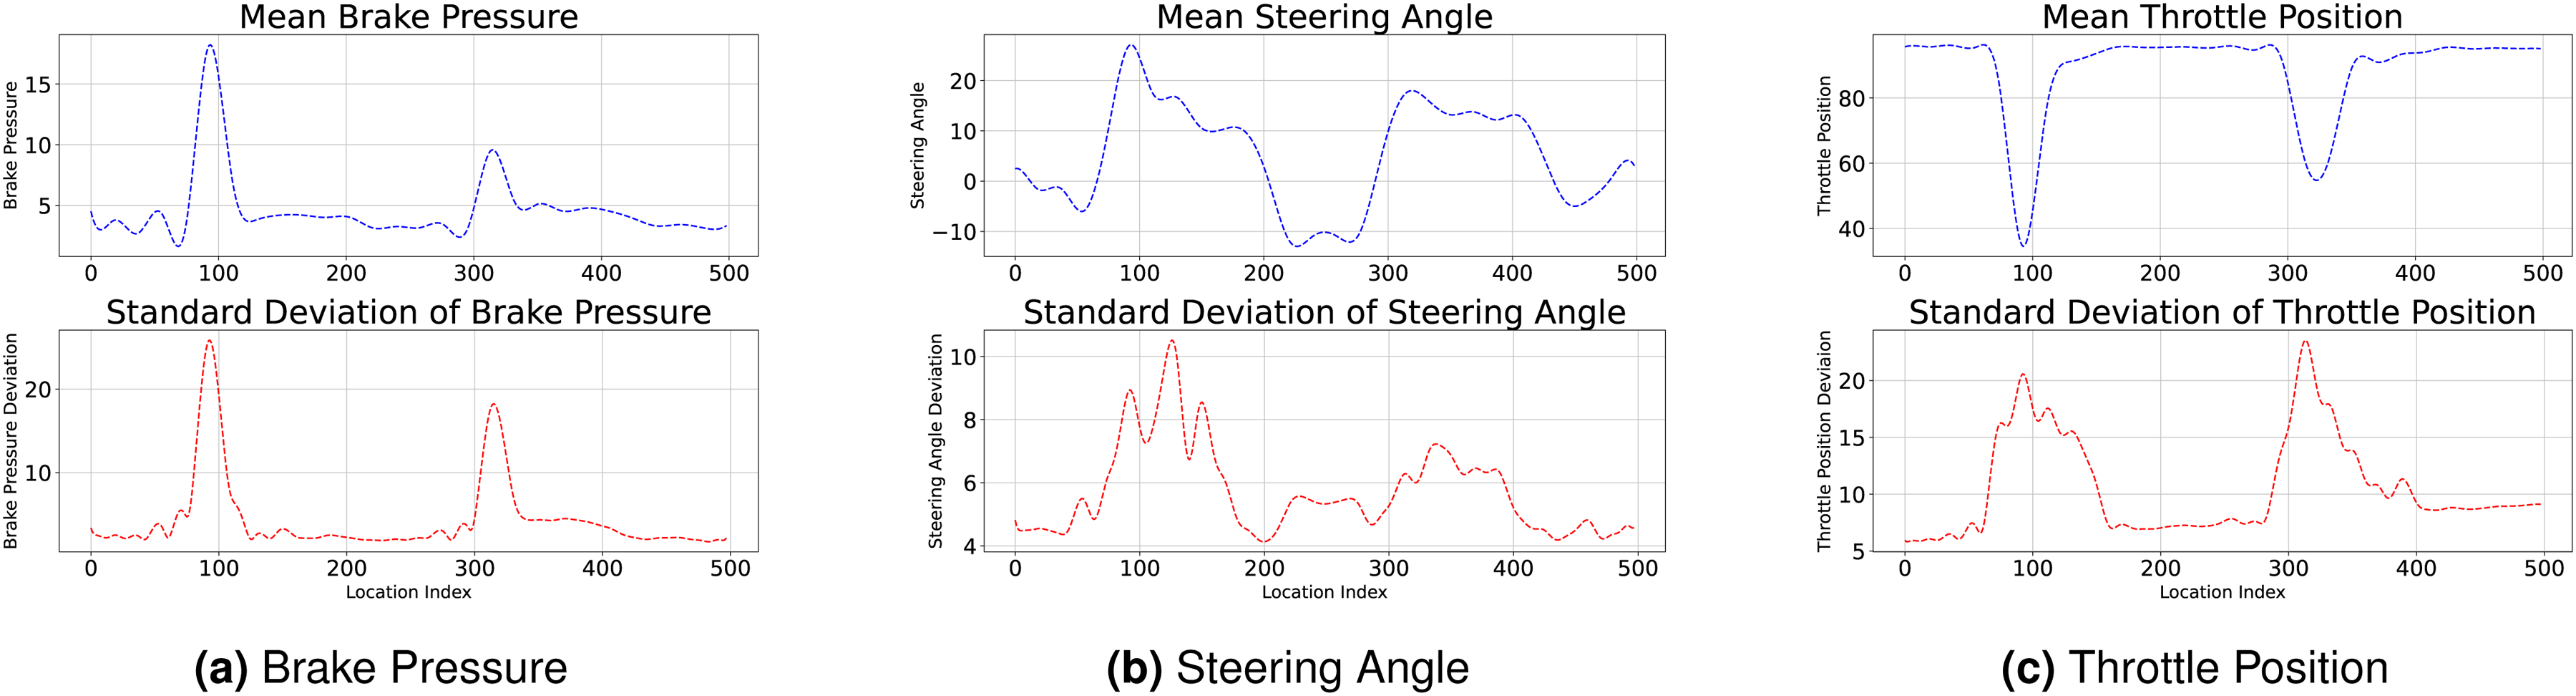
Mean and Standard Deviation of Driving Features Over a Lap. (a) Brake Pressure, (b) Steering Angle and (c) Throttle Position
Methods
In this section, we present the FPCA and the feature-weighted agglomerative hierarchical clustering method used to profile each driver’s qualifying performance.
FPCA
For each driver
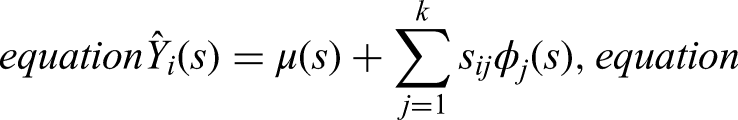
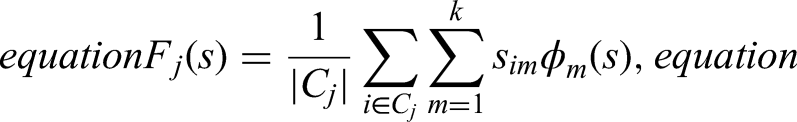
With FPCA, each function
This procedure is performed separately for each of the three features, yielding principal component scores that summarize their respective functional behaviors. Once principal components are determined for each feature, we concatenate the resulting scores across features, forming a final data matrix of size
Qualifying lap clustering
Having obtained FPC scores for each driver, we apply agglomerative hierarchical clustering 19 over the feature-weighted normalized component scores to group qualifying laps based on similarities in driving behavior. This method iteratively merges the two most similar clusters, measured by Euclidean distance, until only one remains. The hierarchical structure is visualized using a dendrogram, which guides the selection of the final number of clusters. By clustering drivers based on their functional representations, we identify distinct driving styles while preserving the continuous nature of the data.
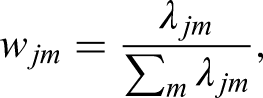
Before clustering, we standardize and weight the FPC scores to ensure comparability across features. Within each feature
To determine the optimal number of clusters, we evaluate both dendrogram structure and the corresponding linkage distances. Linkage distances indicate the dissimilarity between clusters at each fusion step where new clusters are formed by merging any two candidate clusters together. Several distance-based heuristics have been proposed to identify a meaningful cut point; for example, Mojena et al.
20
recommends selecting a threshold equal to the mean fusion level plus two to three standard deviations. We adopt a similar distance-based perspective, emphasizing not only the magnitude of the fusion distances but also the interpretability of the resulting clusters. In practice, this means choosing the clustering solution that maximizes separation between clusters while still yielding groups that are substantively coherent and interpretable. Once the clustering is finalized, we compute the mean FPC scores within each cluster to characterize distinct driving styles. The cluster-level representation for each feature is computed as
To identify an optimal driving style for emulation, we assess clusters based on their mean qualifying position and within-cluster variance. The cluster with the most compact grouping of high-performing drivers is selected as the benchmark for qualifying performance. This selection criterion ensures that the most effective qualifying strategies are identified, providing actionable insights for improving driver performance.
Results
Our analysis generates two series of results. The first is the result of FPCA over each of the three identifying features. The resulting FPC curves for each feature are displayed in Figure 4. Here, we find that for FPCs to account for 80% of the variance in each feature, two FPCs are needed for brake pressure, three FPCs for steering angle, and five FPCs for throttle position. This suggests that the variance structure of throttle position is more diffuse, with variability spread across multiple principal directions. Consequently, more components are needed to explain 80% of its total variation compared to brake pressure and steering angle. Additionally, each of these plots indicates that for brake pressure and throttle position, the dominant modes of variation occur at corners 1 and 2, which occur at locations
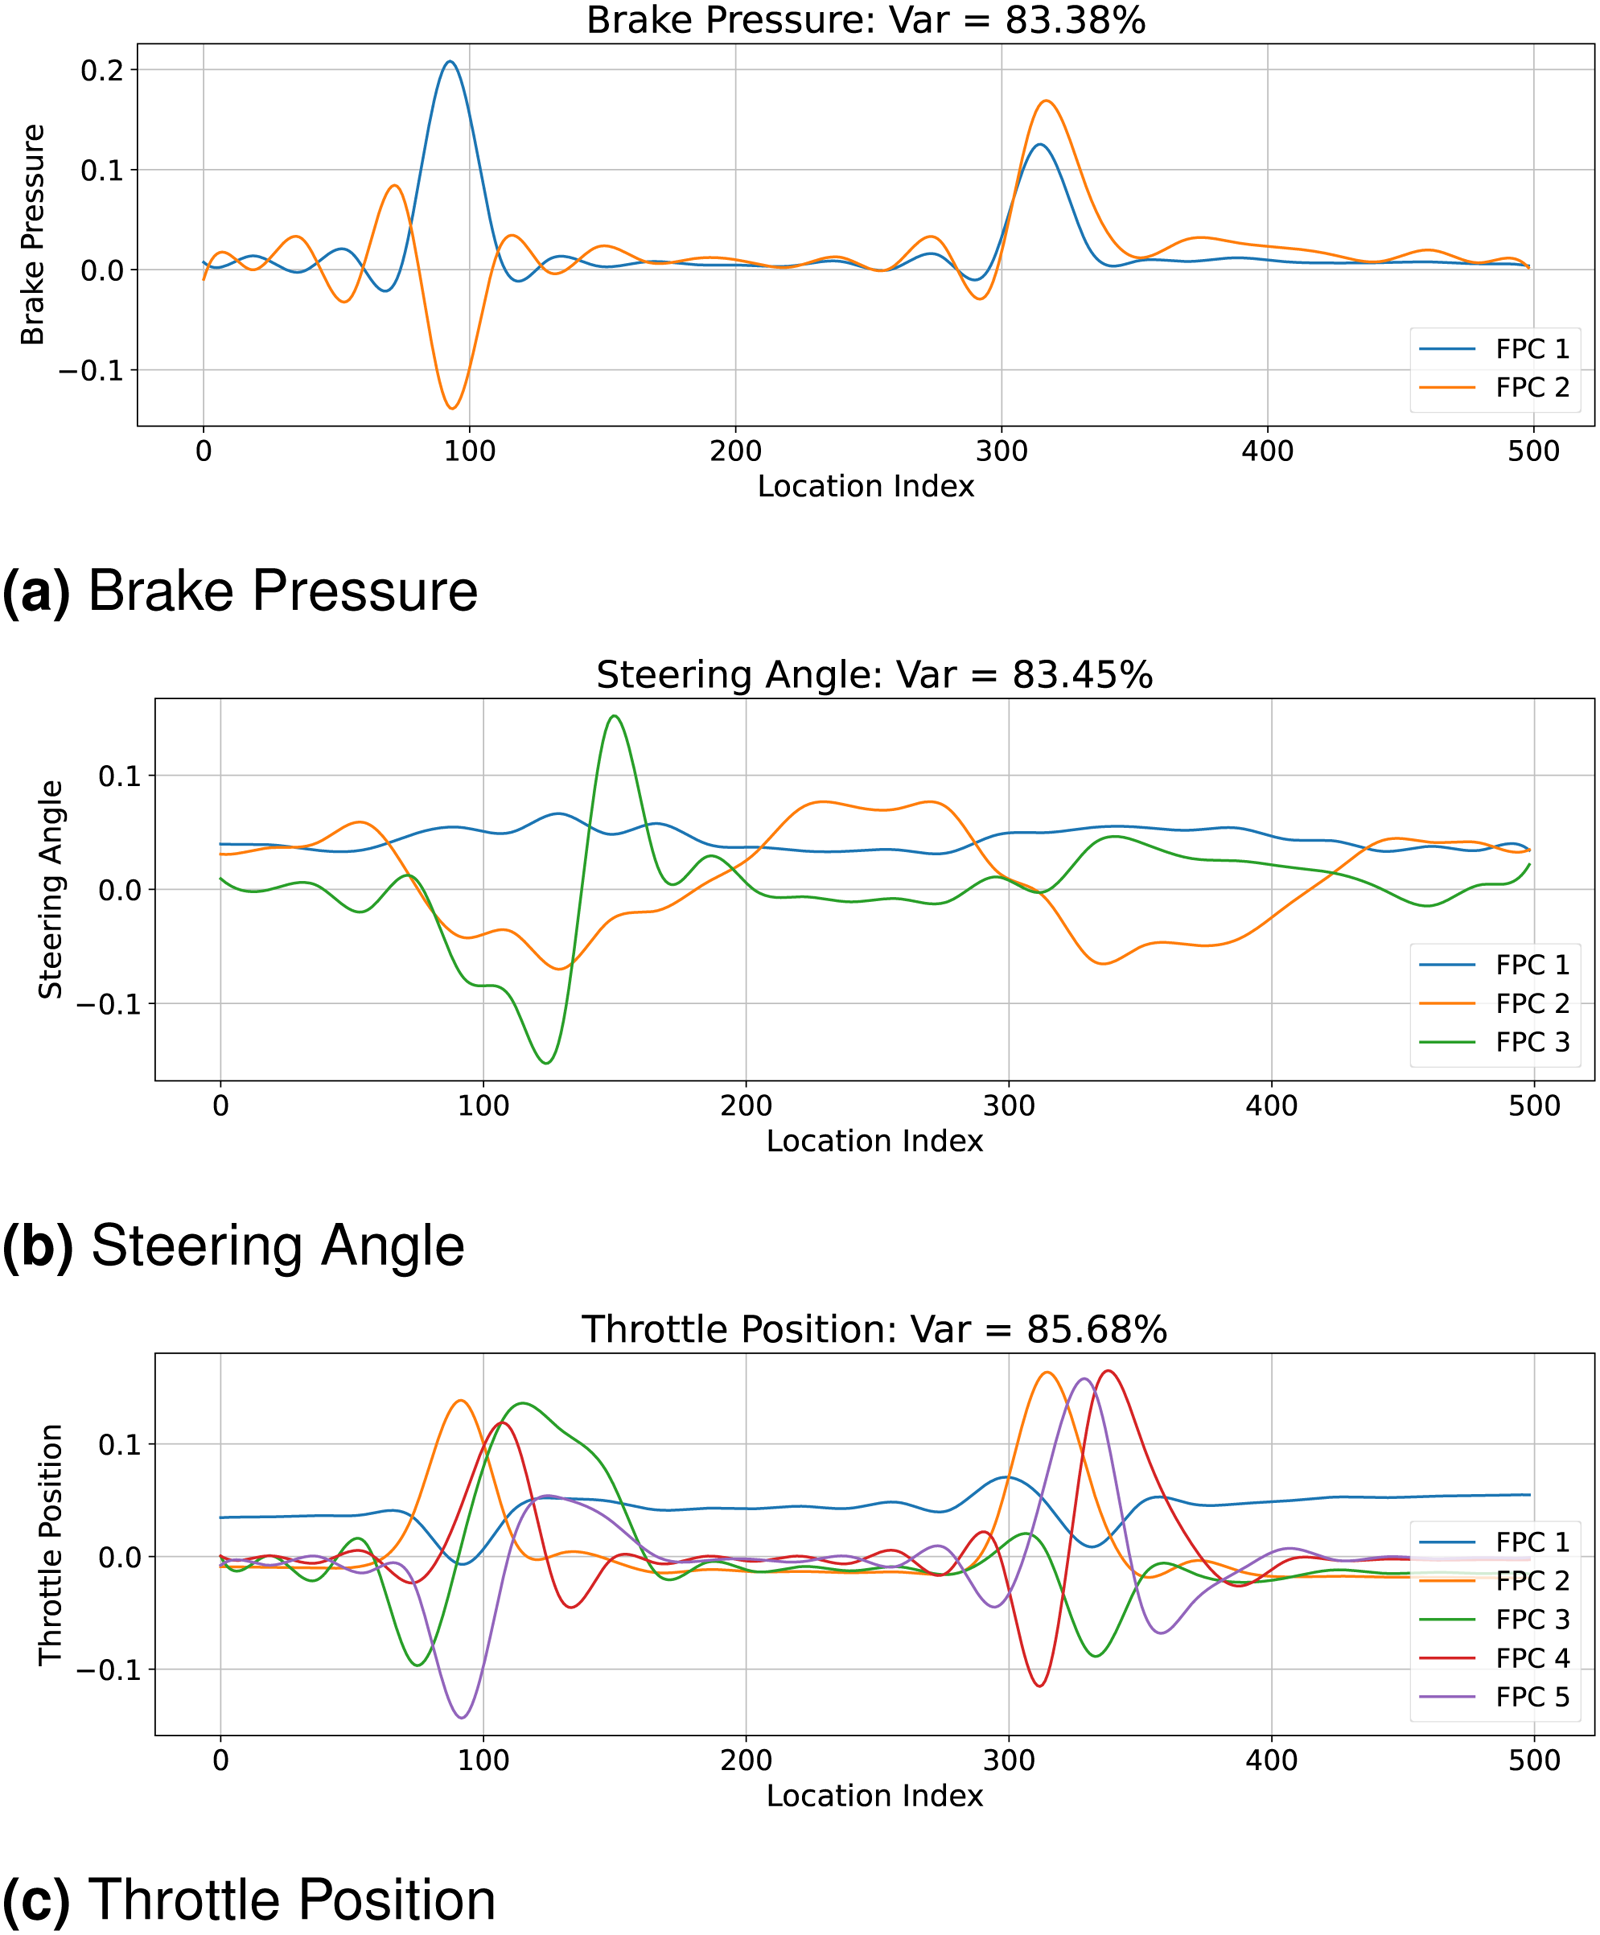
FPCA Accounting for 80% of Variance: Each plot shows the minimum number of principal components required to achieve an 80% variance threshold across each of the telemetry features. The regions of greatest variance occur at approximately 100 and 320 in each feature which makes sense since these are the regions where the two main corners of the track occur. On straights, we do not expect driver behavior to differ too much since all drivers should maximize throttle position and minimize brake pressure to achieve the greatest speed at these parts of the track. (a) Brake Pressure, (b) Steering Angle and (c) Throttle Position
Next, we cluster each of the 38 drivers according to their functional components scores for each feature. Cars 8, 33, 84, and 51 possessed insufficient data for analysis and so they are excluded from clustering. Additionally, car 15 was a significant outlier which led to an optimal clustering with only two clusters: one cluster including car 15 alone, and another cluster which contained every other car. This outcome has limited interpretability aside from the fact that car 15 is an outlier, so it was excluded from this analysis. From FPCA, we obtain 10 features. Namely, we include the 2, 3, and 5 FPC scores for each car which represent its brake pressure, steering angle, and throttle position inputs over the course of a qualifying lap. These features are then weighted according to the procedure described in the “Methods” section. The results of qualifying lap clustering performed over for these features results in the dendrogram presented in Figure 5.
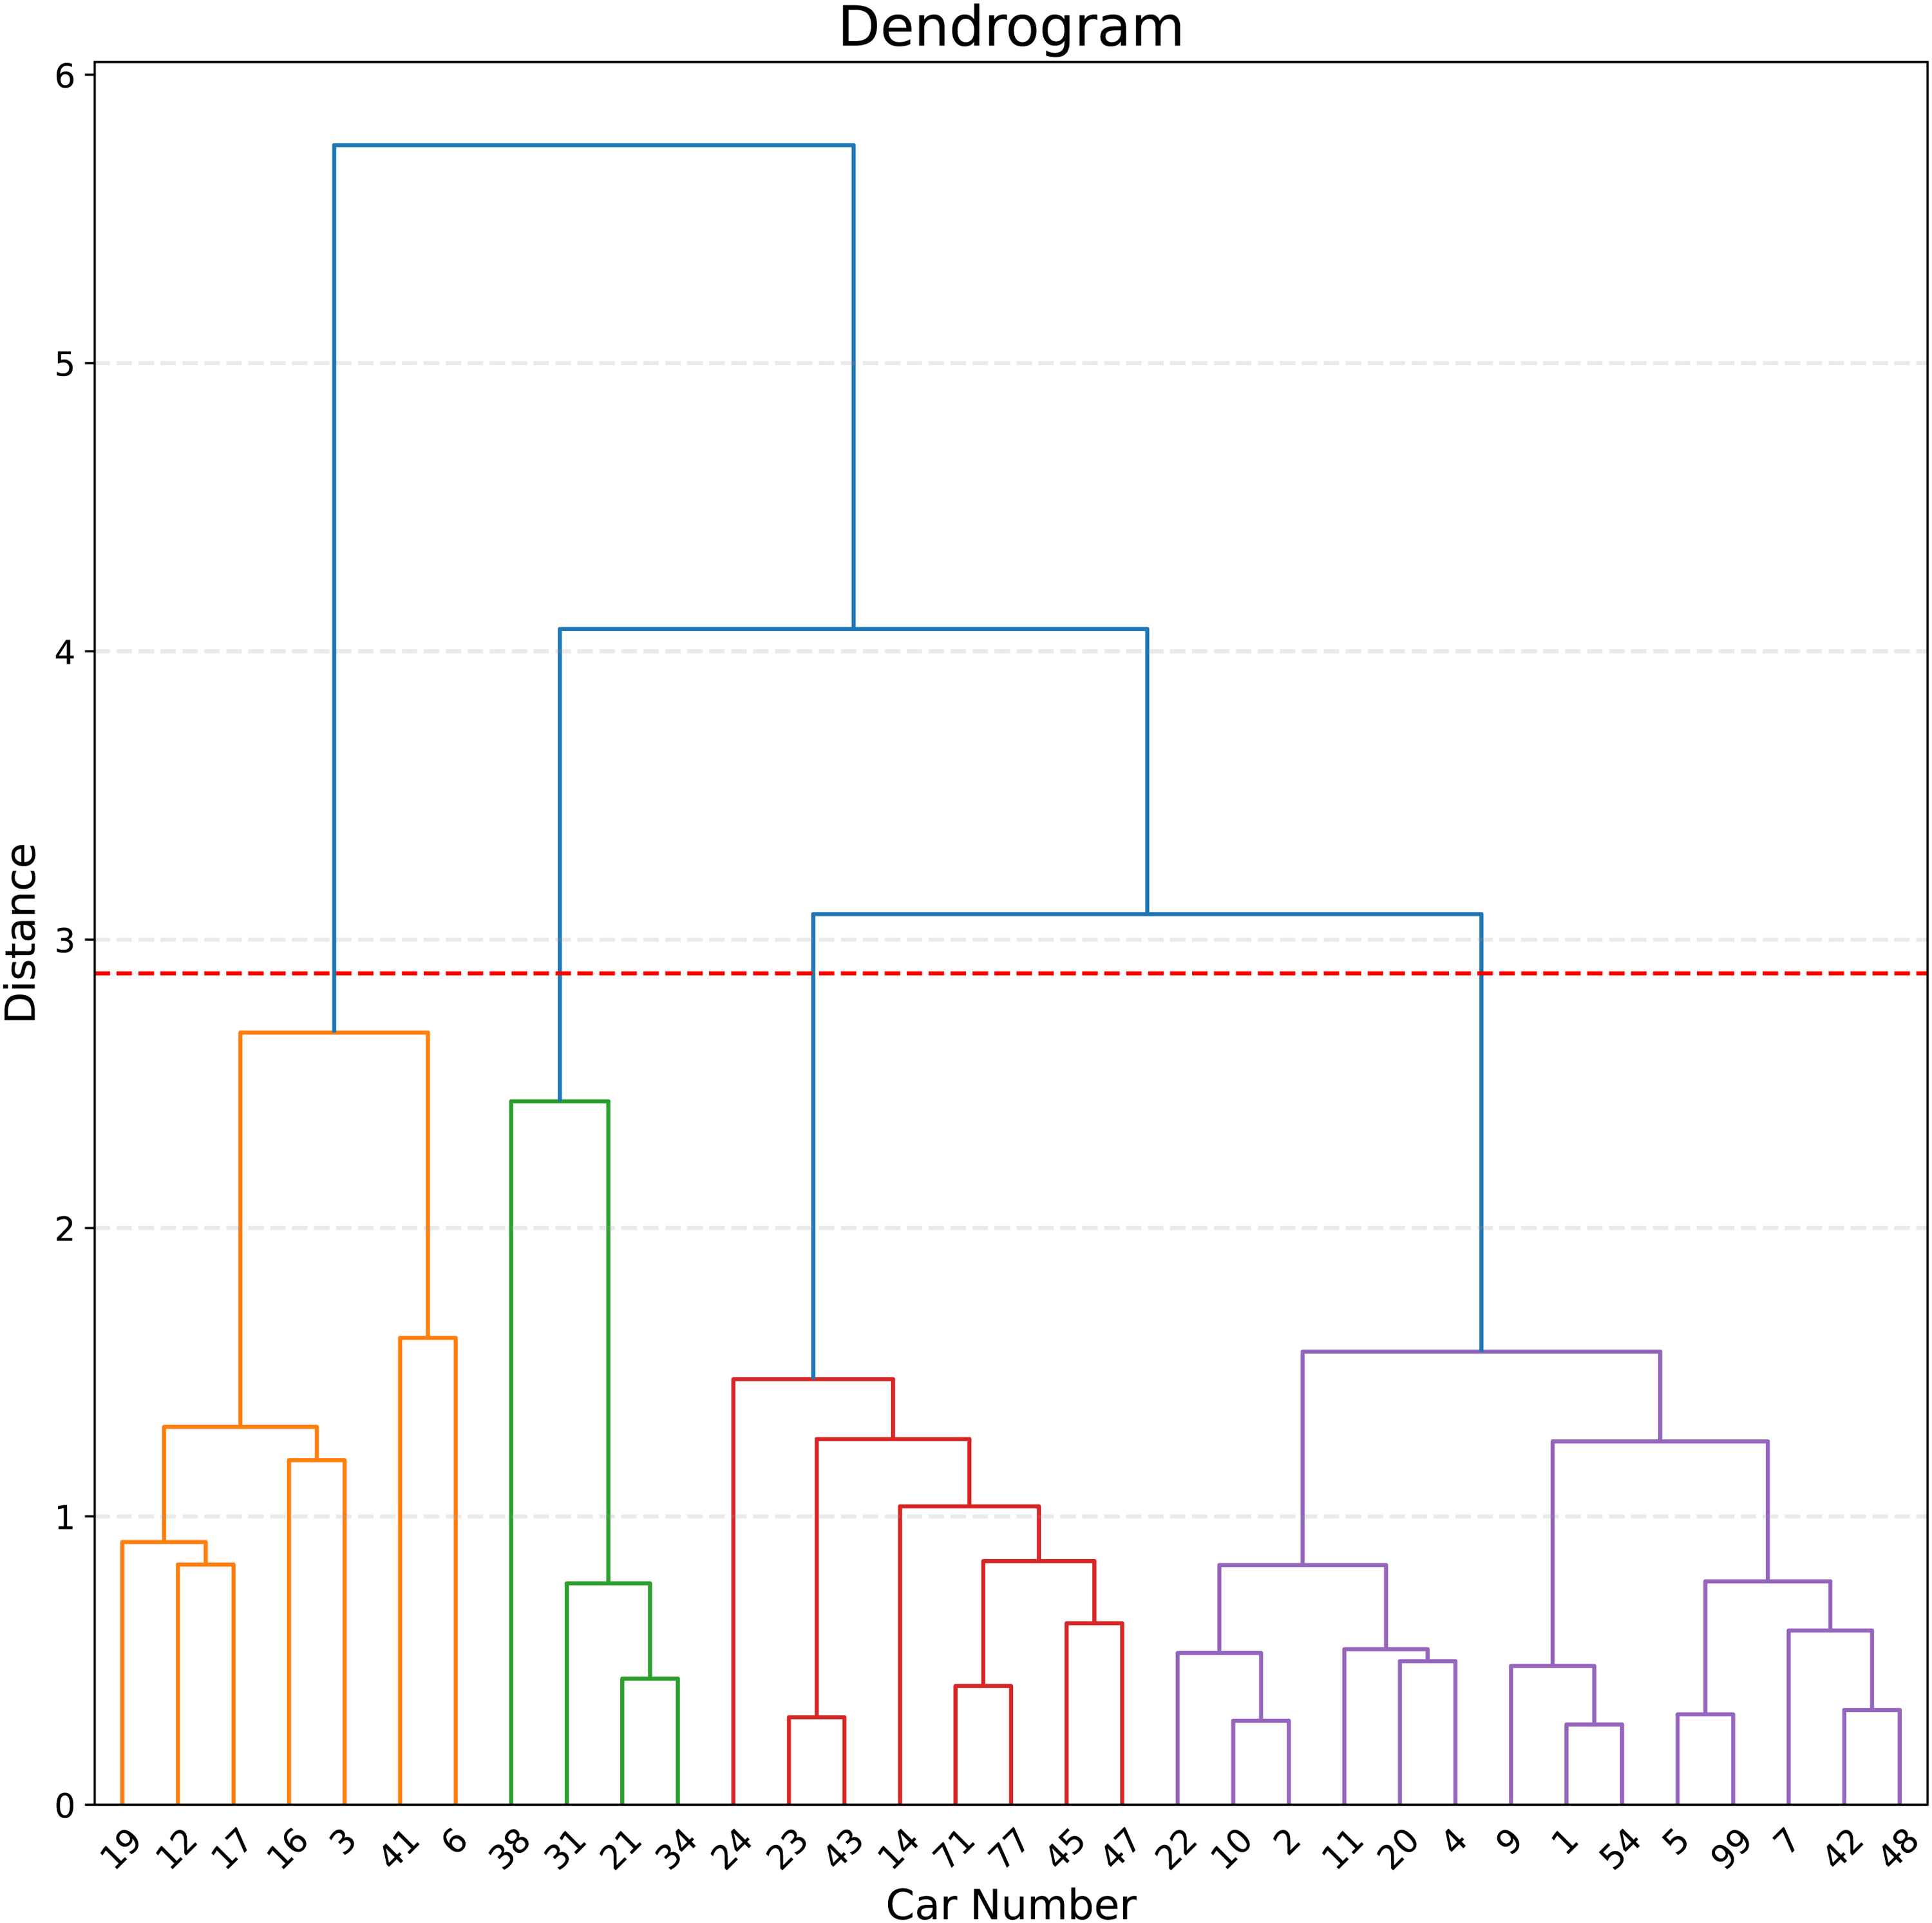
Hierarchical Clustering Dendrogram: We use dendrogram analysis to choose the optimal number of clusters. In particular, we chose to cut the dendrogram at the mean fusion level (distance) plus
In Figure 6, we present a scatterplot of the qualifying outcomes for drivers in each cluster. Through dendrogram analysis with a cutoff given by the mean fusion level plus
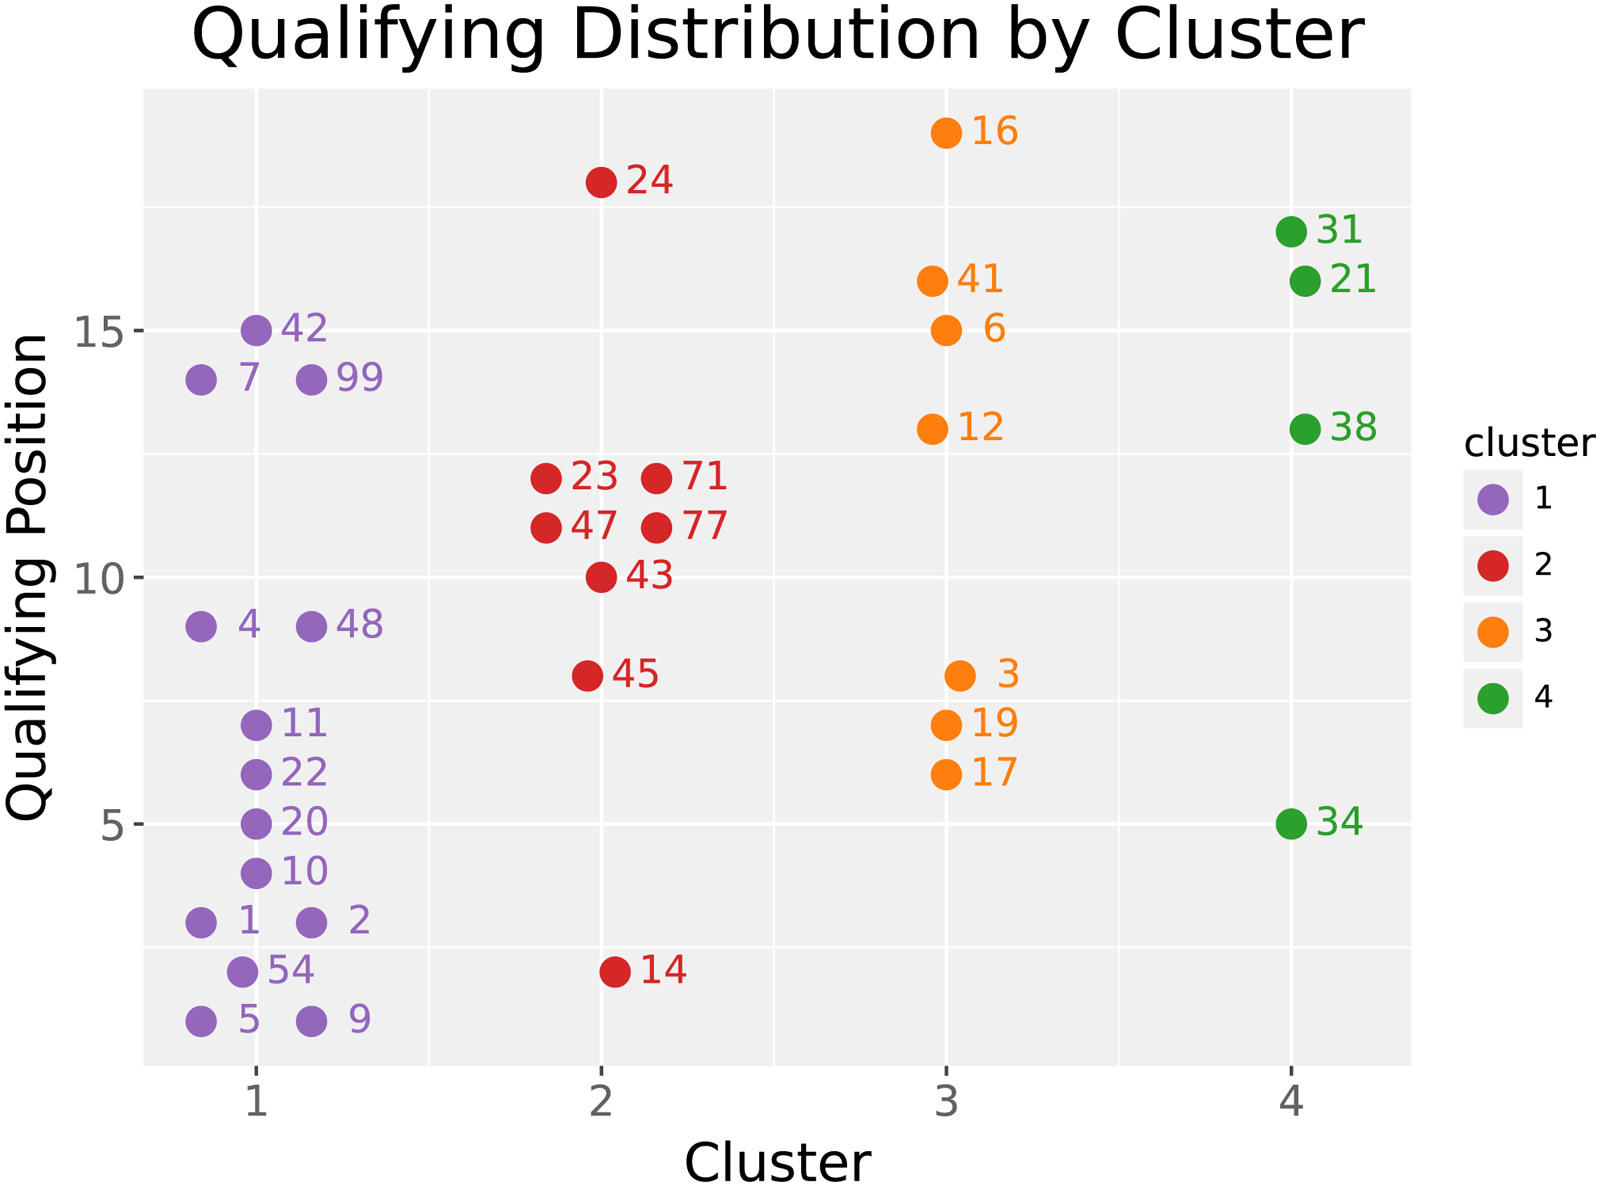
Clustering Results Excluding Outliers: Outliers are excluded from these results since including them leads to two clusters - one containing the outliers and one containing the rest of the samples. Thus, we can safely exclude them and continue by working on clustering the remaining samples in the non-outlier cluster. Specifically, one car (car 15) is excluded for being an outlier, while four cars (8, 33, 51, and 84) are excluded due to high levels of missing telemetry data.
Cluster 3 overlaps slightly with clusters 1 and 2, but achieves a worse median qualifying position of 13 and variance of 5.03. Cluster 4 also underperforms on the whole, achieving a median qualifying position of 14.5 and standard deviation of 5.43. The main outlier here is car 34, which manages to achieve a reasonable qualifying position, despite its adherence to a lower performance qualifying style.
The smoothed cluster-average behavior can be visualized by examining the curves constructed from each cluster’s mean FPC scores across each feature. In Figure 7, mean curves for clusters 1 (orange), 2 (green), 3 (blue), and 4 (red) are given. Minor differences between these clusters can be observed across each feature, but since clusters 1 and 4 are the most dichotomous in terms of qualifying behavior, their contrasts are of the most significant interest to us. Cluster 3 is also of interest, but it is so far removed from the other clusters that it effectively encompasses the outlier driving styles on the grid. By looking at graphs of brake pressure and throttle position, the most significant difference results from how drivers navigate each corner. At Kansas Speedway, there are two corners, one occurring around point 100, and the other near point 320. With respect to brake pressure, cluster 1 inputs more brake pressure than cluster 4. However, cluster 1 demonstrates higher minimum throttle position values at corner 1 (100) and corner 2 (320) than cluster 4. In other words, drivers in cluster 4 were able to navigate high speed turns by lifting off the throttle more precipitously, whereas drivers in cluster 1 applied the brakes more aggressively, while maximizing their throttle application. Notice, however, that the brake inputs observed by drivers in cluster 1 do not come close to the peak brake pressures applied by drivers in cluster 3. This indicates that using excessive brake pressure upon corner entry might lead to lost laptime over the course of a qualifying lap.
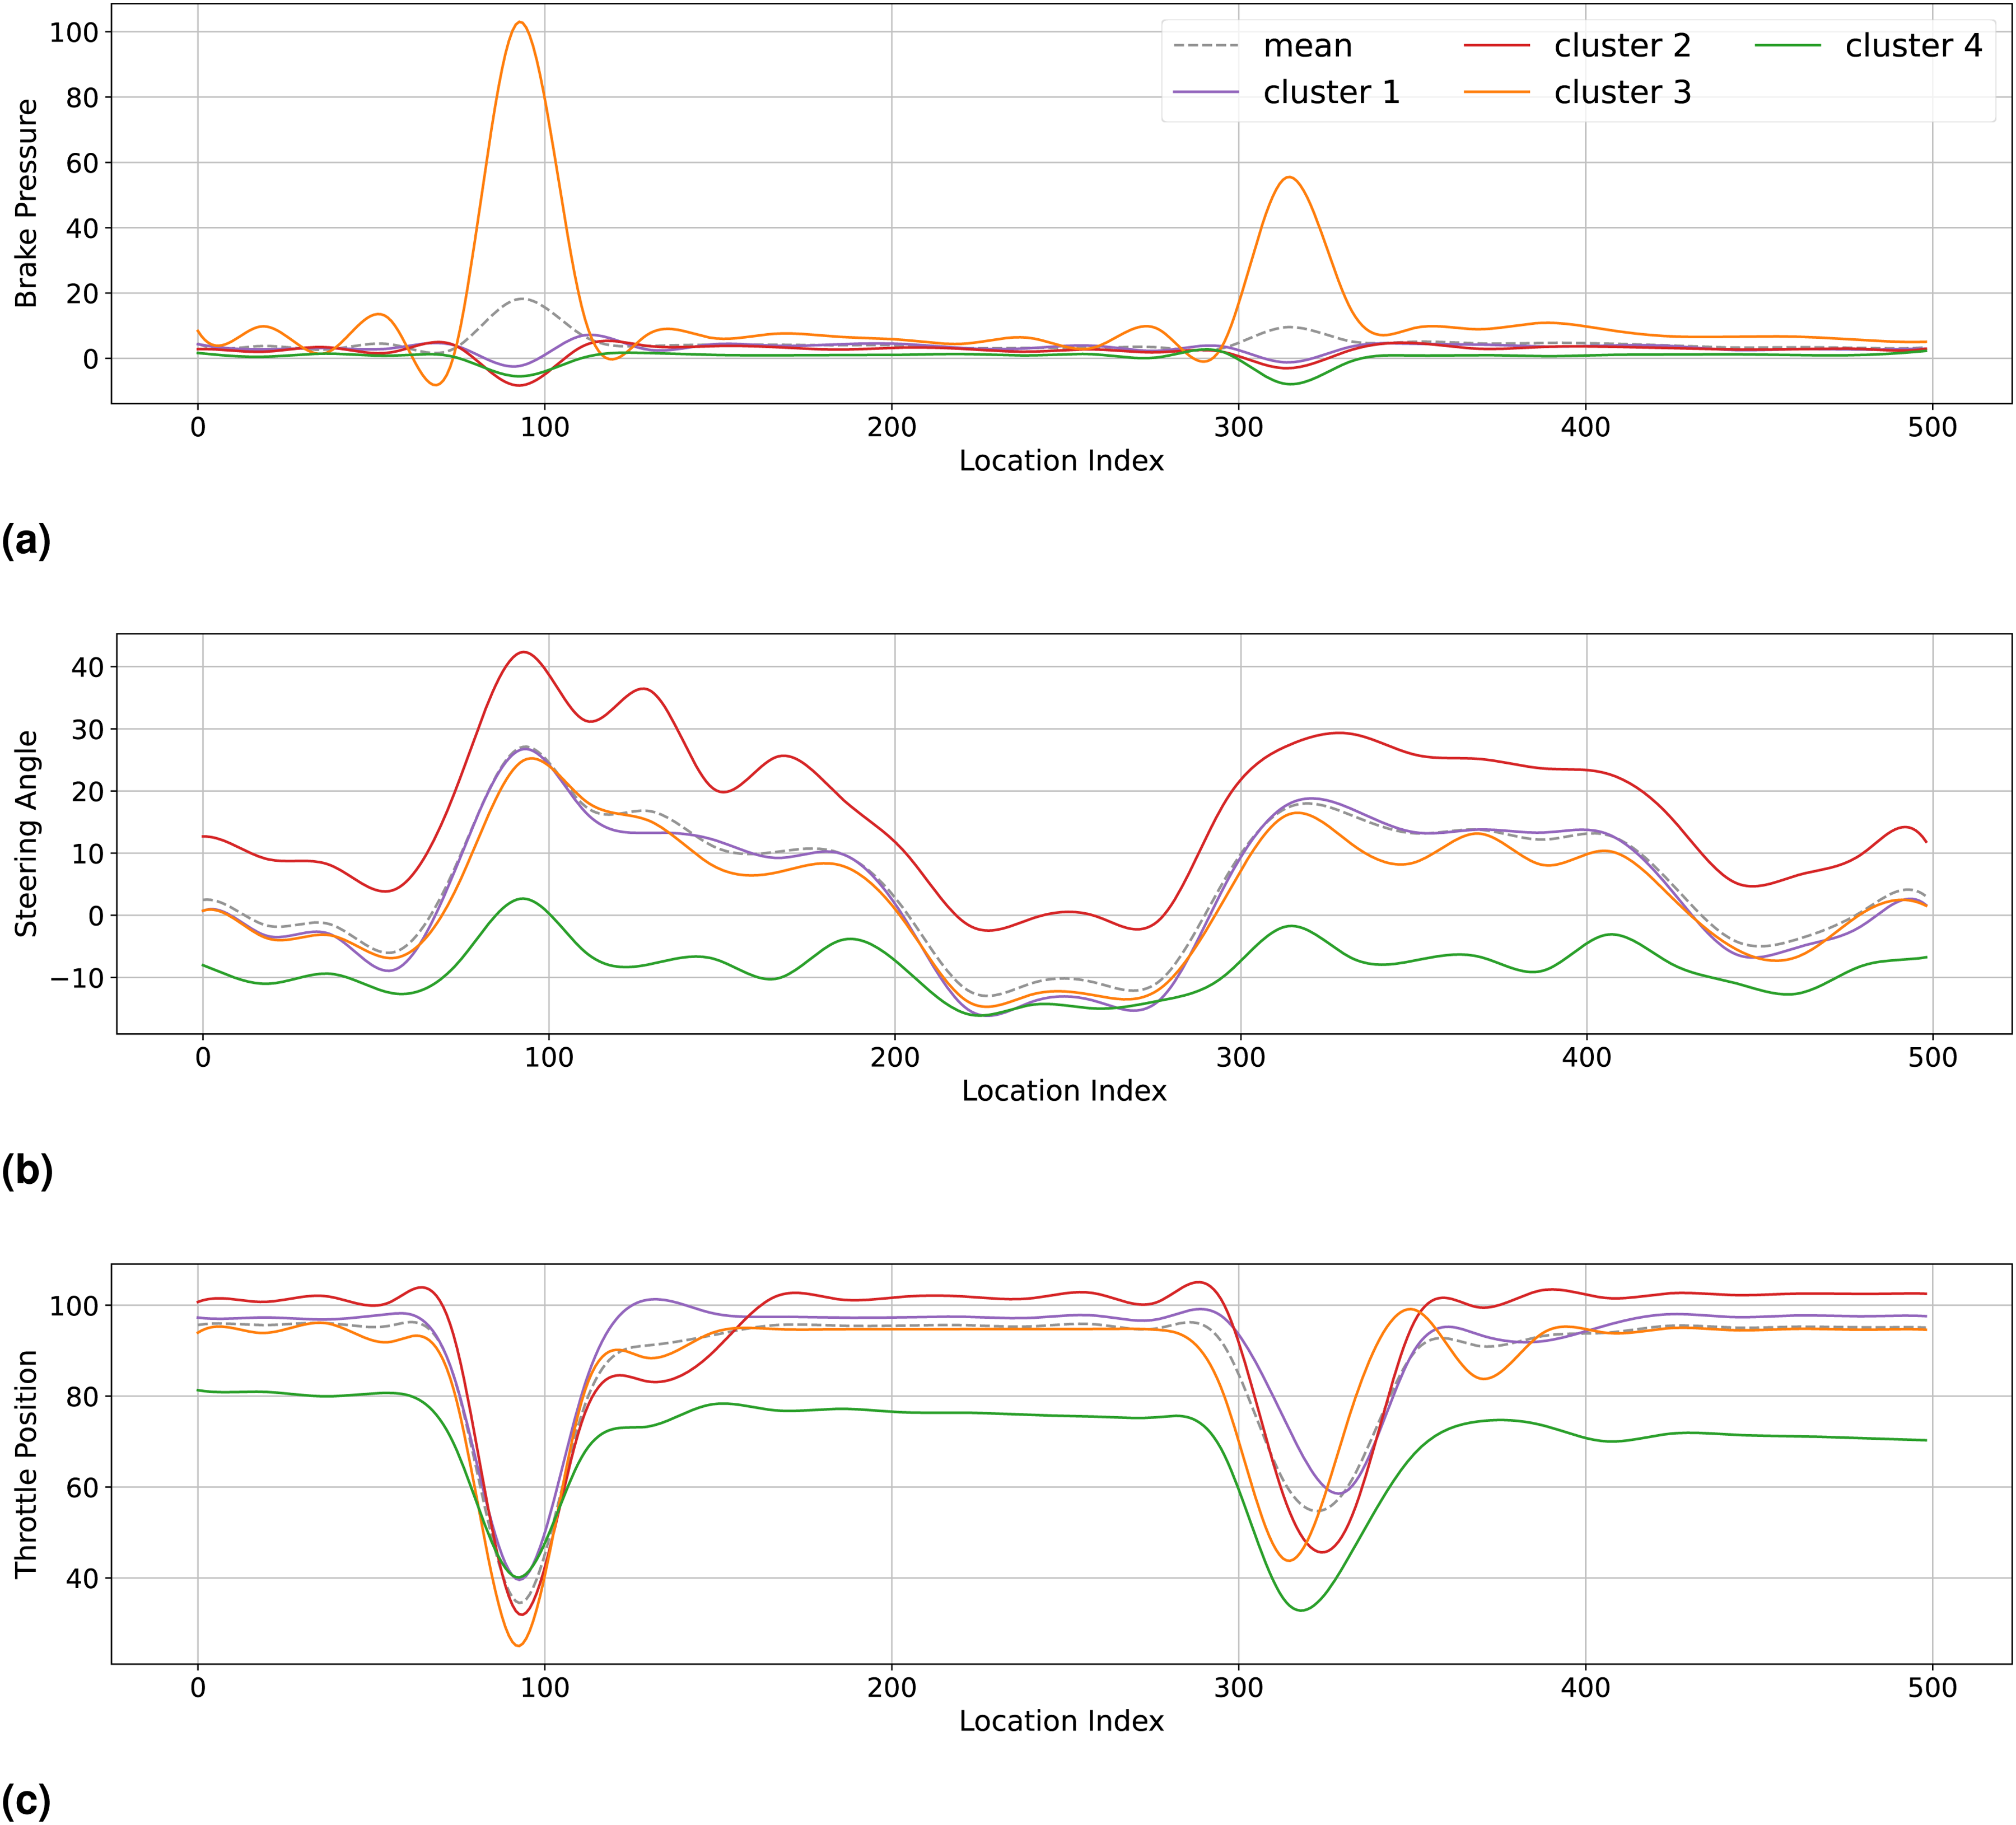
Typical Behavior Curves Grouped by FPCA Cluster. (a) Brake Pressure, (b) Steering Angle, (c) Throttle Position
This outcome poses some fascinating implications for how drivers may want to adjust their driving in order to improve their qualifying performance. Consultation with NASCAR domain experts indicates that although cluster 1 achieves a superior average qualifying position, it does so through a more aggressive driving style than is exhibited by cluster 2 or 4. This can negatively affect a driver’s performance over the course of a race since such a driving style might require a car setup which increases the rate of tire degradation. Moreover, not all drivers may be capable of quickly adjusting their driving style. Driving style is learned and ingrained over time, which means that making adjustments can be extremely difficult, and might even lead to baseline performance drawbacks. Any driving style recommendations made on the basis of our analysis should be carefully tempered by the whether the recommended style suits the driver.
Several steps have been taken to ensure that these clustering results are robust to clustering sensitivity. First, as mentioned in the “Data” section, we choose a fixed reference line based on the inner track line. This helps to avoid biasing our results towards any specific driver’s lap. Second, FPC-importance weighting (mentioned in the “Methods” section) helps to ensure that even as we add further variance components, their marginal contribution to the clustering outcome does not have an overstated effect on the final result. A sensitivity analysis was conducted with respect to chosen variance thresholds for the inclusion of FPCs for each feature, and we found that there was strong agreement between clustering results where the variance threshold was between 80 and 90%. Specifically, we used the Adjusted Rand Index (ARI)
21
to measure cluster agreement. The ARI measures the similarity between two clusters
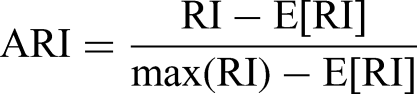
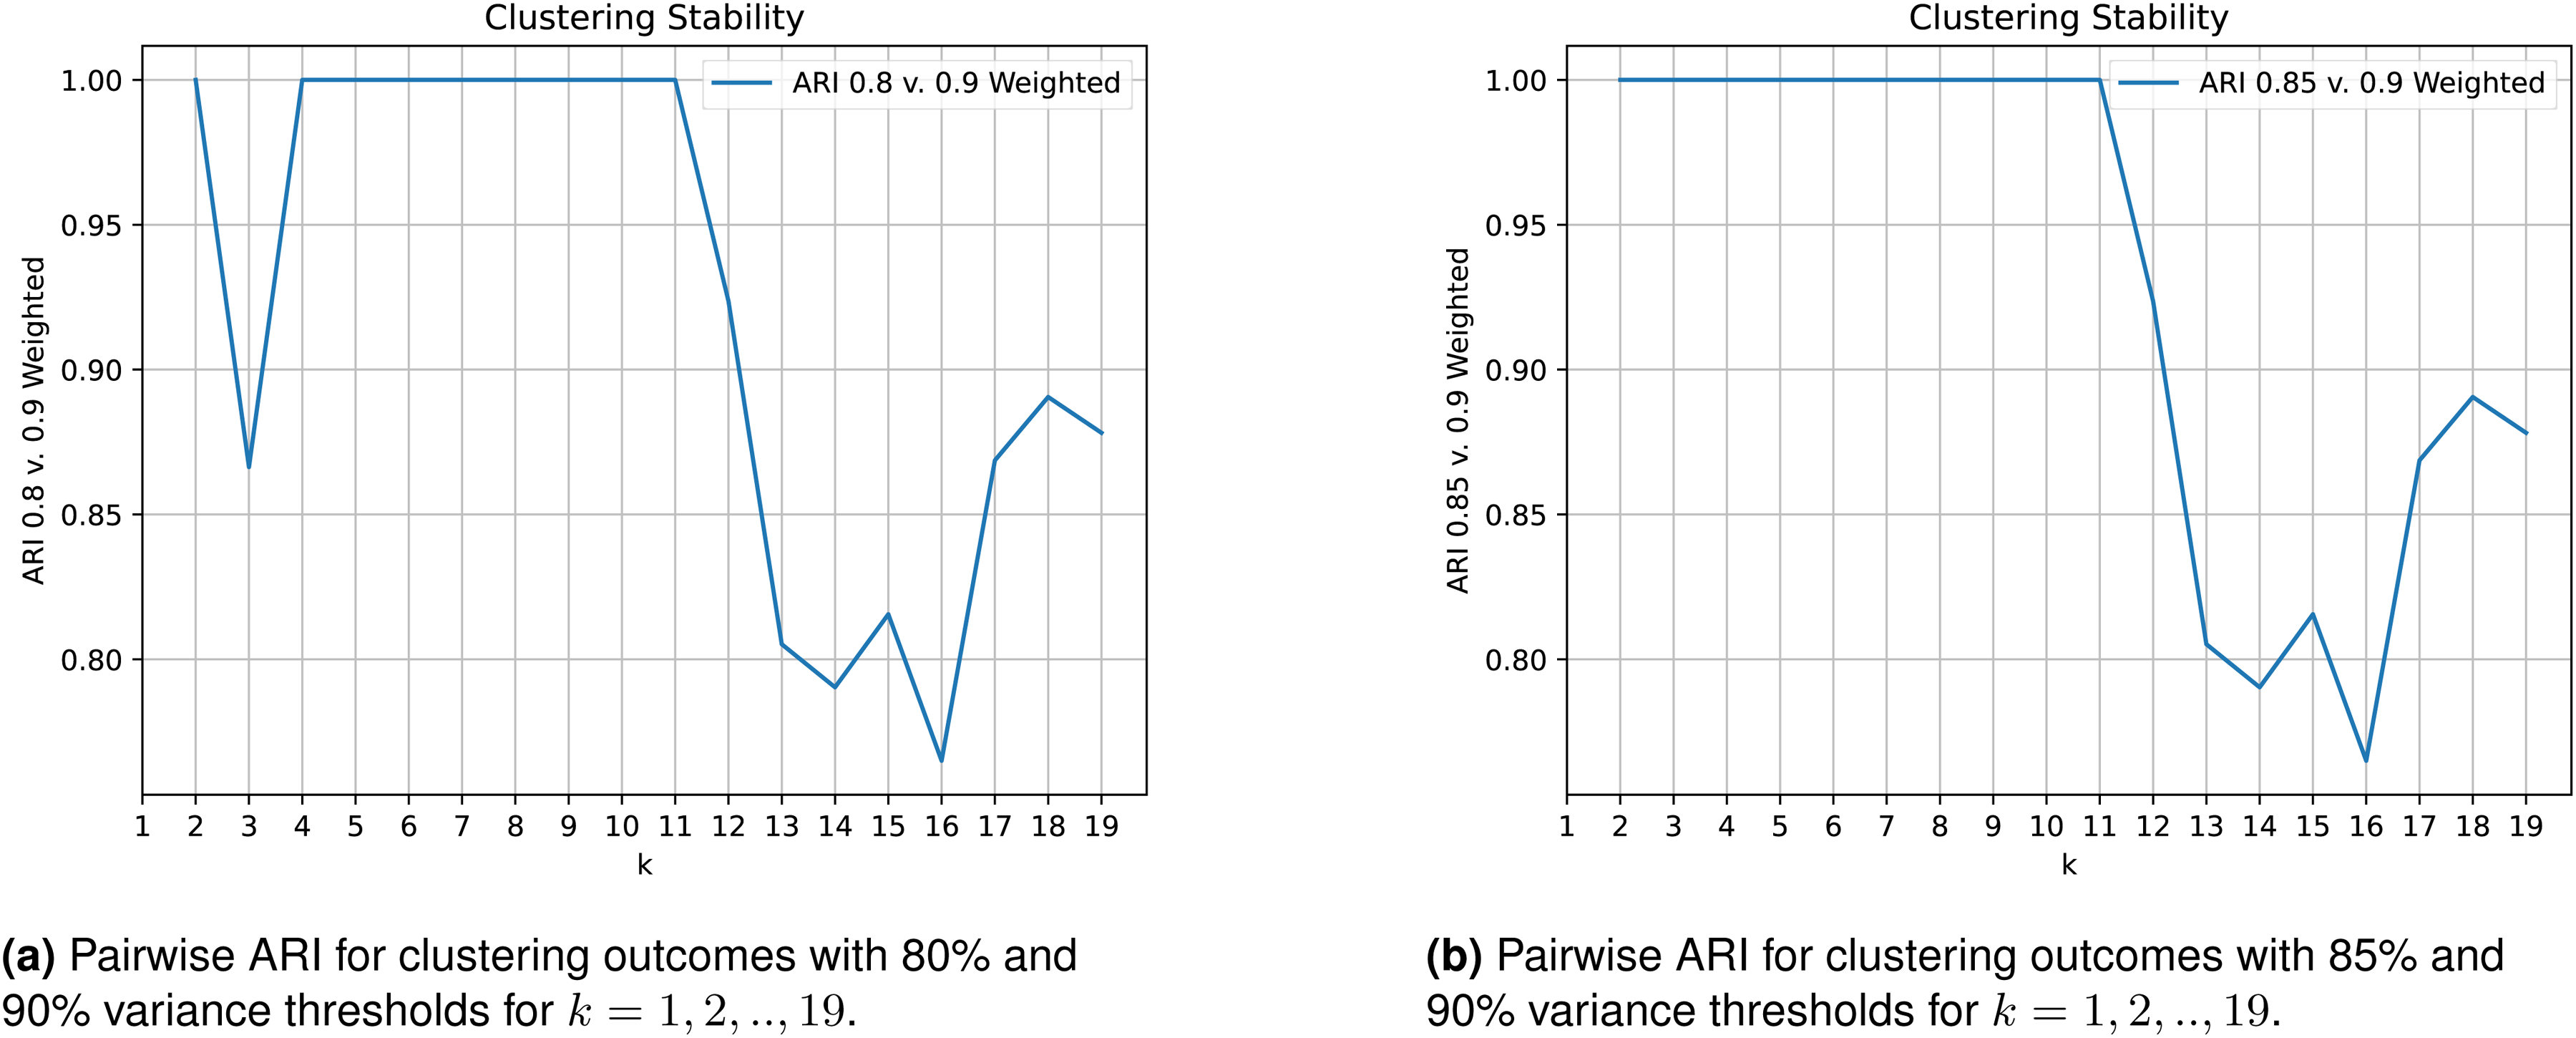
80% and 85% Variance Threshold clustering outcomes versus a 90% Variance Threshold: The Adjusted Rand Index, or ARI, (a value between
Discussion
This study proposed a novel framework for analyzing NASCAR qualifying laps, aiming to provide actionable insights that expedite the learning process over a NASCAR race weekend and allow team members and drivers of varying data literacy levels to improve more quickly. By combining IOT and position data, we developed a geometric interpolation procedure to align features along a common reference line, enabling meaningful comparisons across drivers. We then applied FPCA to reduce the dimensionality of the telemetry data, followed by feature-weighted agglomerative hierarchical clustering to group drivers based on their functional driving profiles. Our analysis identified distinct clusters of driving behavior, with one cluster emerging as a high-performing benchmark, characterized by strategic combinations of braking and throttle input through corners. These findings suggest that certain qualifying styles may be more effective, offering a data-driven basis for performance improvement. In particular, drivers in cluster 1, including drivers such as Kyle Larson (5), Chase Elliott (9), Ty Gibbs (54), Ross Chastain (1), and Austin Cindric (2) all achieve superior qualifying performance by maintaining a higher minimum throttle position at corners and applying slightly more brake pressure than drivers in cluster 2 or 4 to improve corner navigation. In contrast, drivers in cluster 3 including Derek Kraus (16), Ryan Preece (41), Brad Keselowski (6), and Ryan Blaney (12) achieve a much lower minimum throttle position at corner 1 and input more brake pressure on corner entry which also results in potentially slower qualifying lap times. By using our framework to analyze lap time data, NASCAR teams can identify meaningful trends more quickly which allows for faster driver and team performance improvement.
In practice, these methods have already yielded encouraging results. Our collaborators in NASCAR applied our method to every track and every car and found the resulting clusters helpful for identifying the most promising direction for driver performance improvement. Differences in car setup, innate driving style, and more mean that simply adapting to the driving style of the fastest driver is impractical for most drivers. However, drivers in the same cluster have already been identified as similar, so an underperforming driver is better positioned to imitate the style of the fastest driver in their own cluster. For example, an underperforming driver like John Hunter Nemechek (42) in cluster 1 requires fewer adjustments to match the driving style of Kyle Larson (5) than an underperforming driver in any other cluster since their driving styles have already been identified as similar. Furthermore, by automatically narrowing the scope of qualifying analysis, our methods accelerate the analytics process during each NASCAR race weekend. This opens up further time for NASCAR analysts to focus on the relevant data and find even greater performance improvements than was possible previously.
Several limitations should be acknowledged. First, while interpolation along a reference trajectory standardizes driver behavior for comparison, it may not fully capture the performance advantages conferred by individual racing lines. Second, the interpolation of IOT data—necessitated by differences in sampling rates—may introduce small inaccuracies. Third, although we used variance-explained weighting for the FPCA scores, the lack of consensus on feature-weighting strategies introduces subjectivity. Similarly, our choice of the number of clusters was based on dendrogram gaps, but no universally accepted criterion exists. Future work could improve the robustness of our methods through further simulation studies that assess weighting and clustering choices, as well as by applying the framework to laps from other tracks or seasons to determine whether the identified driving styles generalize. These extensions would enhance the scope and reliability of data-driven performance profiling in motorsports.
Footnotes
Ethical considerations
There are no human participants in this article and informed consent is not required.
Consent to participate
Not applicable.
Consent for publication
Not applicable.
Funding
The authors received no financial support for the research, authorship, and/or publication of this article.
Declaration of conflicting interest
The authors declared no potential conflicts of interest with respect to the research, authorship, and publication of this article.
Data availability
At this time, our data is not available for open access. However, this data may be published at some point in the future.