
Abstract
Rugby union is a high intensity contact sport where collision events are key determinants of match outcomes, yet the intensity profiles during the transition from elite under-20 (U20) to Senior professional (SP) levels remain poorly described. This study aimed to (i) characterise collision intensity profiles using wearable microelectromechanical systems across sixteen Elite U20 (U20) and twenty-six Senior professional matches, (ii) compare collision frequency and intensity between SP and U20 players, and (iii) examine positional differences in collision demands within each competition level, employing a Random Forest algorithm to classify collisions into six intensity zones (IZ) and determine Mean Maximal Collision Intensity (MMCI). The results reveal that SP players are exposed to a significantly greater collision frequency than U20 players in nearly all intensity zones (p < 0.05), with the most pronounced differences occurring in high-intensity zones IZ 5 (8.01–10.0 g; +17%) and IZ 6 (> 10.01 g; +36%). Furthermore, SP players experienced a significantly higher MMCI than U20 players (11.3 ± 1.2 g vs. 10.9 ± 1.4 g; p < 0.05). These differences were highly position-dependent, with inside backs and loose forwards showing the largest contrasts in exposure. These findings indicate that the progression to professional rugby is characterized by an increase in mechanical severity per contact event rather than a uniform increase in frequency. Consequently, strength and conditioning coaches should implement progressive, position-specific contact conditioning to safely prepare U20 players for the heightened physical demands of the Senior professional game.
Keywords
Introduction
Rugby union (RU) is a high-intensity contact sport contested by two teams of 15 players, in which matches consist of two 40-min halves.1,2 Performance relies on a complex combination of physical qualities, including maximal strength and power, repeated high-speed running, static efforts, and frequent physical contacts interspersed with periods of lower-intensity activity and recovery.3–5 Forwards comprising the front, second, and back rows, are central to set-pieces and physical contests such as rucks and scrums. Their greater body mass and strength profiles contribute to a higher frequency of intense contact situations. 5 Conversely, backs comprising halfbacks, centres, wings, and fullbacks, prioritise speed and agility to exploit possession, focusing on breaking the defensive line to create scoring opportunities. 5 Among these demands, collision events such as tackles, rucks, mauls, and scrums are key performance indicators in rugby from both attacking (e.g., ball carries) and defensive (e.g., tackles) perspectives.2,6–9
The quantification of collision demands in rugby has relied on manual counts of collisions events (e.g., tackles, ball carries, rucks, mauls and scrums), combined with qualitative assessments derived from video analysis.1,10 While video-based approaches provide valuable contextual information, they have been labour-intensive, time-consuming, and potentially subject to analyst bias. 7 These limitations are particularly problematic in professional environments where rapid turnaround between matches and training sessions is required. The widespread adoption of microelectromechanical systems (MEMS) that integrate global positioning systems (GPS) and inertial measurement units (IMUs) has enabled the automatic detection and characterisation of collisions.11,12 Several commercial systems provide proprietary algorithms to identify impacts and classify collision intensity using acceleration-derived metrics.13,14
Several authors have proposed intensity-based classification frameworks that use accelerometry-derived signals to distinguish low (e.g., 5–6.5 g), moderate (e.g., 6.51–8.0 g), and high-intensity (e.g., > 8.01 g) impact events.3,15 These approaches rely on peak acceleration-derived metrics (e.g., Player Load) to reflect the mechanical severity of contact events. These frameworks have been widely applied for impact classification in both RU and rugby league in multiple studies, including those by Lovell et al. (2013), 16 McLellan and Lovell, 15 Gabbett et al. (2013), 17 and Weaving et al. (2014). 18 In these studies, “impact classification” refers to any accelerometric event exceeding predefined thresholds including collision events among others (e.g., sprints, changes of direction, and jumps).
This methodological heterogeneity reinforces the need for approaches capable of distinguishing true collision events from non-collision high-acceleration events. Therefore, there is a need to provide objective, scalable, and contextually relevant quantification of collision demands across playing positions and competition levels. Repeated exposure to collision events has been associated with increased neuromuscular fatigue, 15 muscle damage, 19 and injury risk,2,7 with potential consequences for recovery and player availability. Particularly when comparing competition levels characterised by differences in body mass, speed, and physical confrontation. 20
To date, only one study has compared Senior and under-20 (U20) RU match demands from a locomotor perspective using GPS-derived metrics, reporting that differences between competition levels were not uniform and varied substantially by positional group. 21 Although such locomotor data provide valuable insight into movement-based demands during the U20-to-senior transition. Nevertheless, they do not quantify the frequency and intensity of contact events. Consequently, describing collision intensity profiles across age categories and positional groups remains essential to inform progressive contact conditioning and to support a safe transition to Senior professional competition.
Despite growing interest in collision monitoring, collision demands in U20 RU remain poorly described, limiting our understanding of how collision intensity profiles differ between U20 and Senior professional players. This transition phase represents a critical stage in player development, characterised by increased physical demands and the expectation of immediate performance at the Senior professional level. 21
Given the limited scientific knowledge in this area, this study aims to (i) apply a graded classification of collision intensity to characterise contact demands during match play, (ii) compare the frequency, and intensity of collisions between age groups (Senior professional vs. Elite U20), and (iii) compare collision frequency and intensity across playing positions (i.e., tight forward, loose forward, inside back, midfield back, outside back) within each age group, based on data collected across a competitive season.
Methods
Research design
A total of eighty-two male players from a single French club participated in this study. Players were equipped with MEMS inertial sensors (Catapult Vector S7, Melbourne, Australia) to capture data which reflecting whole-body movement data during live match play. A supervised Random Forest model previously validated for RU collision detection was applied to classify collision events. Collision intensity was further categorized into six predefined intensity zones (IZ 1 – IZ 6) based on resultant peak acceleration magnitude, and the Mean Maximal Collision Intensity (i.e., highest collision intensity value collected for each player per match; MMCI) was computed for each player across matches. Comparisons were then performed across functional playing groups and between competition levels to establish positional and developmental differences in mechanical collision demands.
Participants
Forty-six elite male RU players competing in the French Top 14 league (i.e., highest level of men's rugby in France) during the 2024–2025 season and thirty-six elite U20 academy players from the same professional club volunteered to participate in this study (Table 1). All participants were informed about the purpose, procedures, potential risks, and benefits of the study, and provided written informed consent prior to participation, including authorisation for image use. At the time of data collection, all players were healthy and free from injury.
Anthropometric characteristics of line by category.
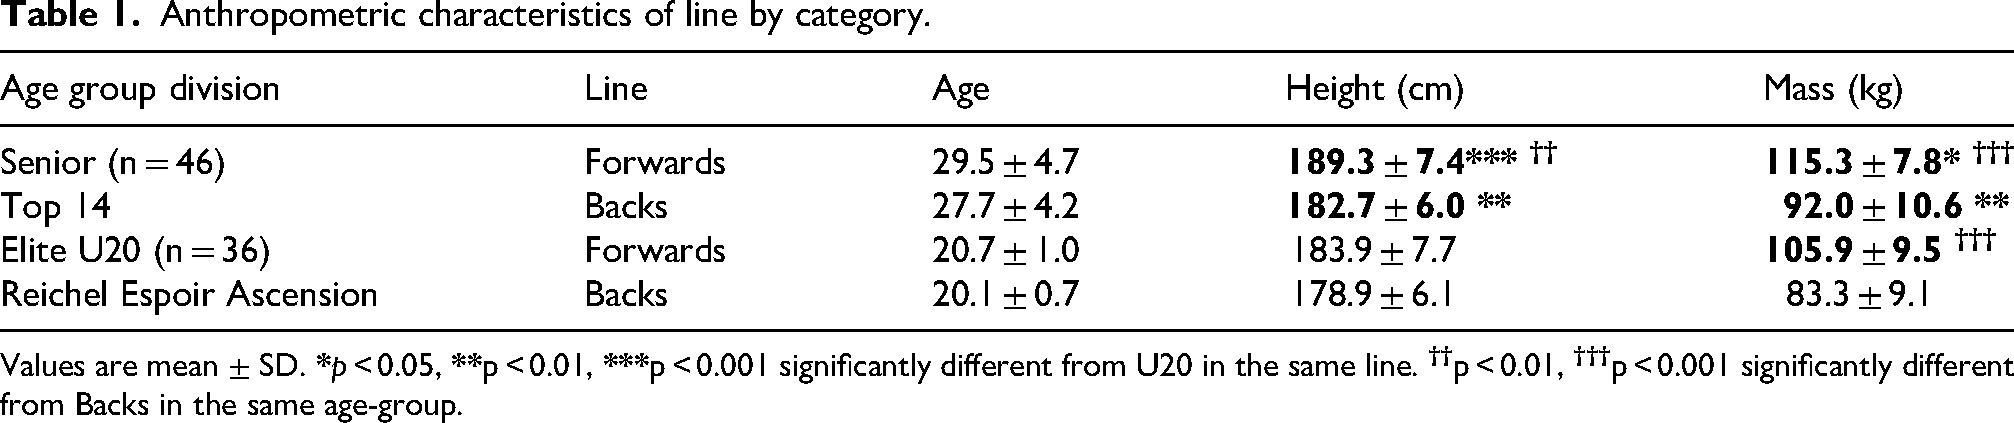
Values are mean ± SD.
Microelectromechanical sensors
Players wore Catapult Vector S7 device, positioned between the players’ shoulder blades in a customised compression vest. Each device contained an inertial sensor (i.e., tri-axial accelerometer, gyroscope, magnetometer) which captured data at 100 Hz (Figure 1). The positioning of the sensor on the upper thoracic spine enabled reliable capture of whole-body impacts while minimising motion artefacts caused by garment movement.
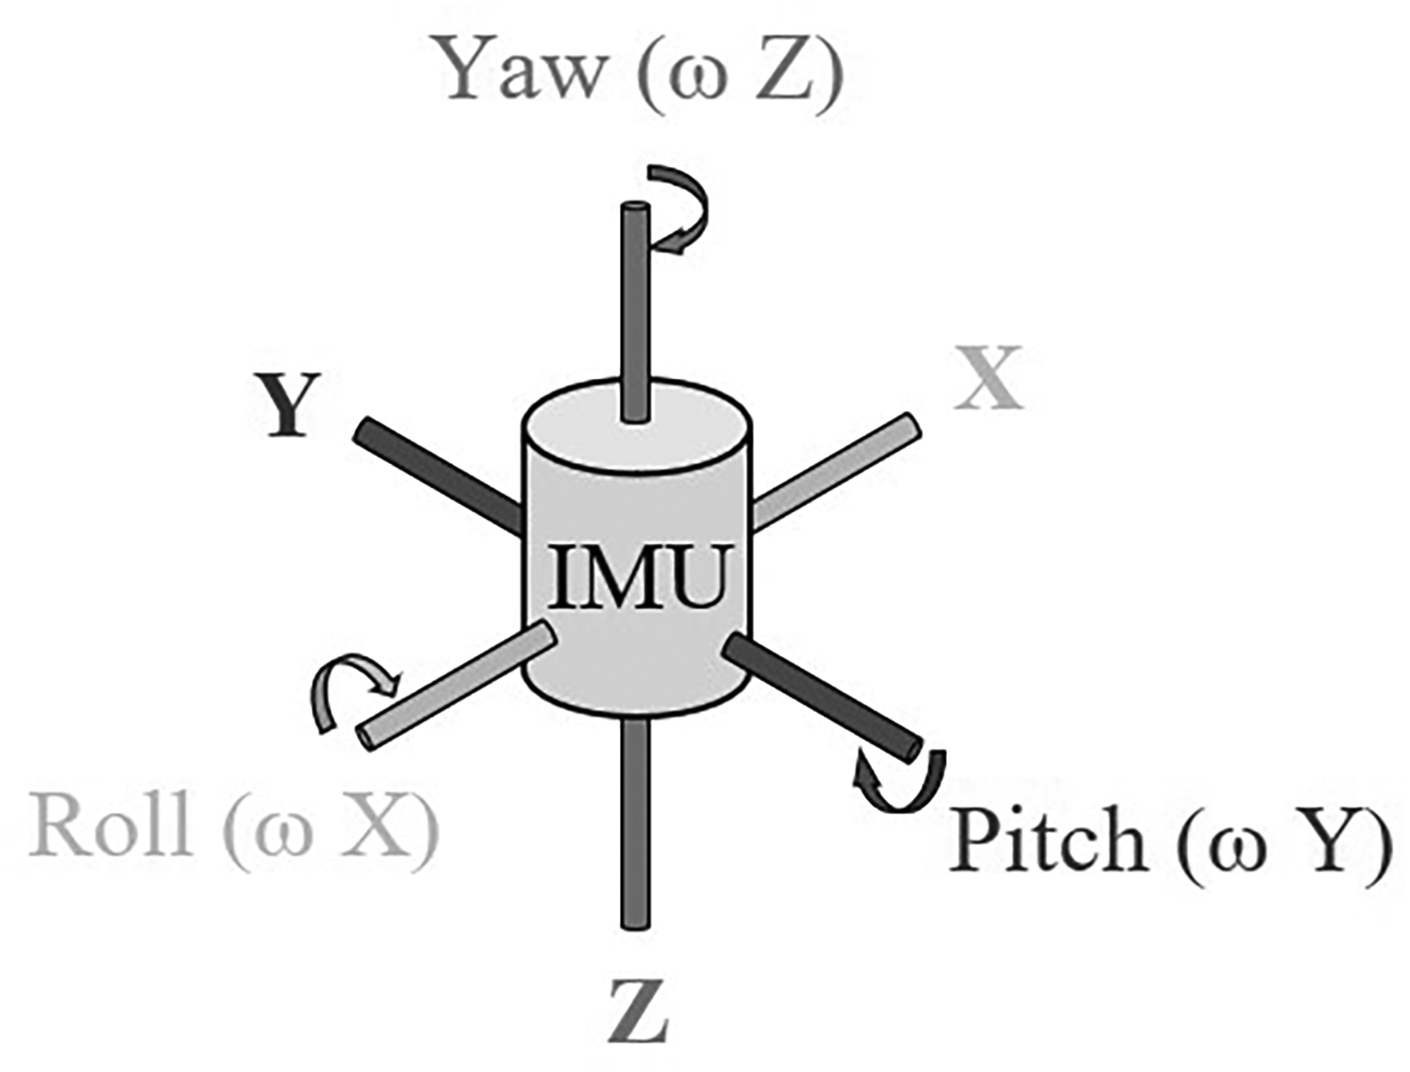
Schematic view of inertial measurement unit.
Data acquisition was conducted in live mode using OpenField software (v3.13.0, Catapult, Melbourne, Australia) for each match, and raw IMU files were subsequently exported for analysis. To facilitate synchronisation with match video, recording onset was aligned with the referee's whistle at kick-off. A staff member-initiated data collection in OpenField at each match to ensure accurate timestamping and data integrity.
Data preprocessing
IMU raw data were pre-processed to remove noise and improve signal quality. Each acceleration and angular-velocity axis was low-pass filtered using fourth-order, zero-phase Butterworth filter with a 20 Hz cutoff frequency (normalised frequency = 0.4), in accordance with Wundersitz et al. (2015). 22 This filtering preserved relevant biomechanical features while attenuating outliers and high-frequency oscillations commonly caused by rapid limb movement or harness vibration.23,24 However, a perfect separation between signal and noise cannot be guaranteed and residual noise may persist particularly during high-magnitude events. In this context, such noise could potentially lead to overestimation of values or misclassification of event by the classifier.
To limit the influence of noise, the filtered signals were segmented using a sliding window technique. Each window had a duration of 2 s, with a 50% overlap applied between consecutive windows to increase temporal resolution and ensure that transitions around impact peaks were adequately captured.
Within each window, descriptive features were derived from the accelerometer (X, Y, and Z axes) and gyroscope (ωX, ωY, and ωZ axes) signals. These included time-domain features (i.e., maximum, minimum, mean, and variance), distribution-shape features (i.e., skewness and kurtosis), and spectral features (i.e., spectral bandwidth and spectral centroid), computed separately for each signal axis across windows. In addition, a composite acceleration magnitude (Mag) was calculated as the root-sum-square of the acceleration across the three axes (Equation 1). This magnitude served as a global indicator of overall acceleration magnitude and complemented the axis-specific features. Features matrices were exported as structured CSV files for subsequent machine-learning analyses.
Collision events were identified using a supervised Random Forest algorithm developed using identical MEMS-derived accelerometer and gyroscope features. It was trained on collision types encountered in rugby union (e.g., tackles, rucks, mauls, and scrums) to ensure generalisation across contact configurations. The algorithm was previously validated against manual video-based annotations, achieving a precision of 88.4%, a recall of 87.2%, and an F1-score of 87.8% on an unseen match dataset, confirming its suitability for deployment in elite match-play contexts. For each 2 s window, the model estimated the probability of a “collision” label based on the extracted feature set. Windows exceeding the decision threshold (i.e., majority vote across trees) were classified as “collision” or “non-collision” event. Collision-event outputs were then aggregated at the player and match levels for subsequent intensity classification and statistical analyses.
Collision data
All matches included in this study were played during the 2024–2025 competitive season, from elite U20 matches (n = 16) and Senior professional matches (n = 26). Only data from players who participated for at least 20 min in a match were retained for analysis. This inclusion criterion was consistent with common professional rugby practices, in which player substitutions frequently occur around the 50-min mark for tactical reasons rather than injury-related reasons. Files corresponding to players with insufficient playing time (< 20 min) were excluded, as this threshold was below the mean minus two standard deviations (mean − 2 × SD), in accordance with previous recommendations. 25 This resulted in a total of 503 player-match exposures for SP players and 280 player-match exposures for U20 players, after exclusion of files corresponding to insufficient playing time.
For each detected collision, the maximum acceleration value (i.e., resultant acceleration magnitude) identified within the predefined temporal window surrounding the collision was extracted. The peak acceleration value (g) was used to assign an intensity category to each collision event.
Collision intensity was classified using a six-zones framework adapted from methodologies proposed by Cunniffe et al. (2009) 3 and Gabbett (2013), 17 and subsequently implemented in several studies examining contact demands in rugby.15,16,18,19 Each intensity zone (IZ) represents a progressive increase in mechanical load. IZ 1 corresponds to the lowest impact intensity, typically associated with low-velocity contacts, while IZ 6 represents the highest impact intensity and impact severity (IZ 1: 5.00–6.00 g; IZ 2: 6.01–6.50 g; IZ 3: 6.51–7.00 g; IZ 4: 7.01–8.00 g; IZ 5: 8.01–10.00 g; and IZ 6: >10.01 g).
In addition, a complementary metric, MMCI, was calculated to characterise the maximal mechanical demands experienced by players. For each player and each match, the highest collision intensity value (i.e., peak resultant acceleration) recorded among all detected collisions was identified. These maximal collision values were then averaged across matches to derive the MMCI for each player.
Collision distributions were subsequently analysed according to functional playing groups (tight forward, loose forward, inside back, midfield back, and outside back) and across competition levels (Senior professional and Elite U20) (Figure 2).
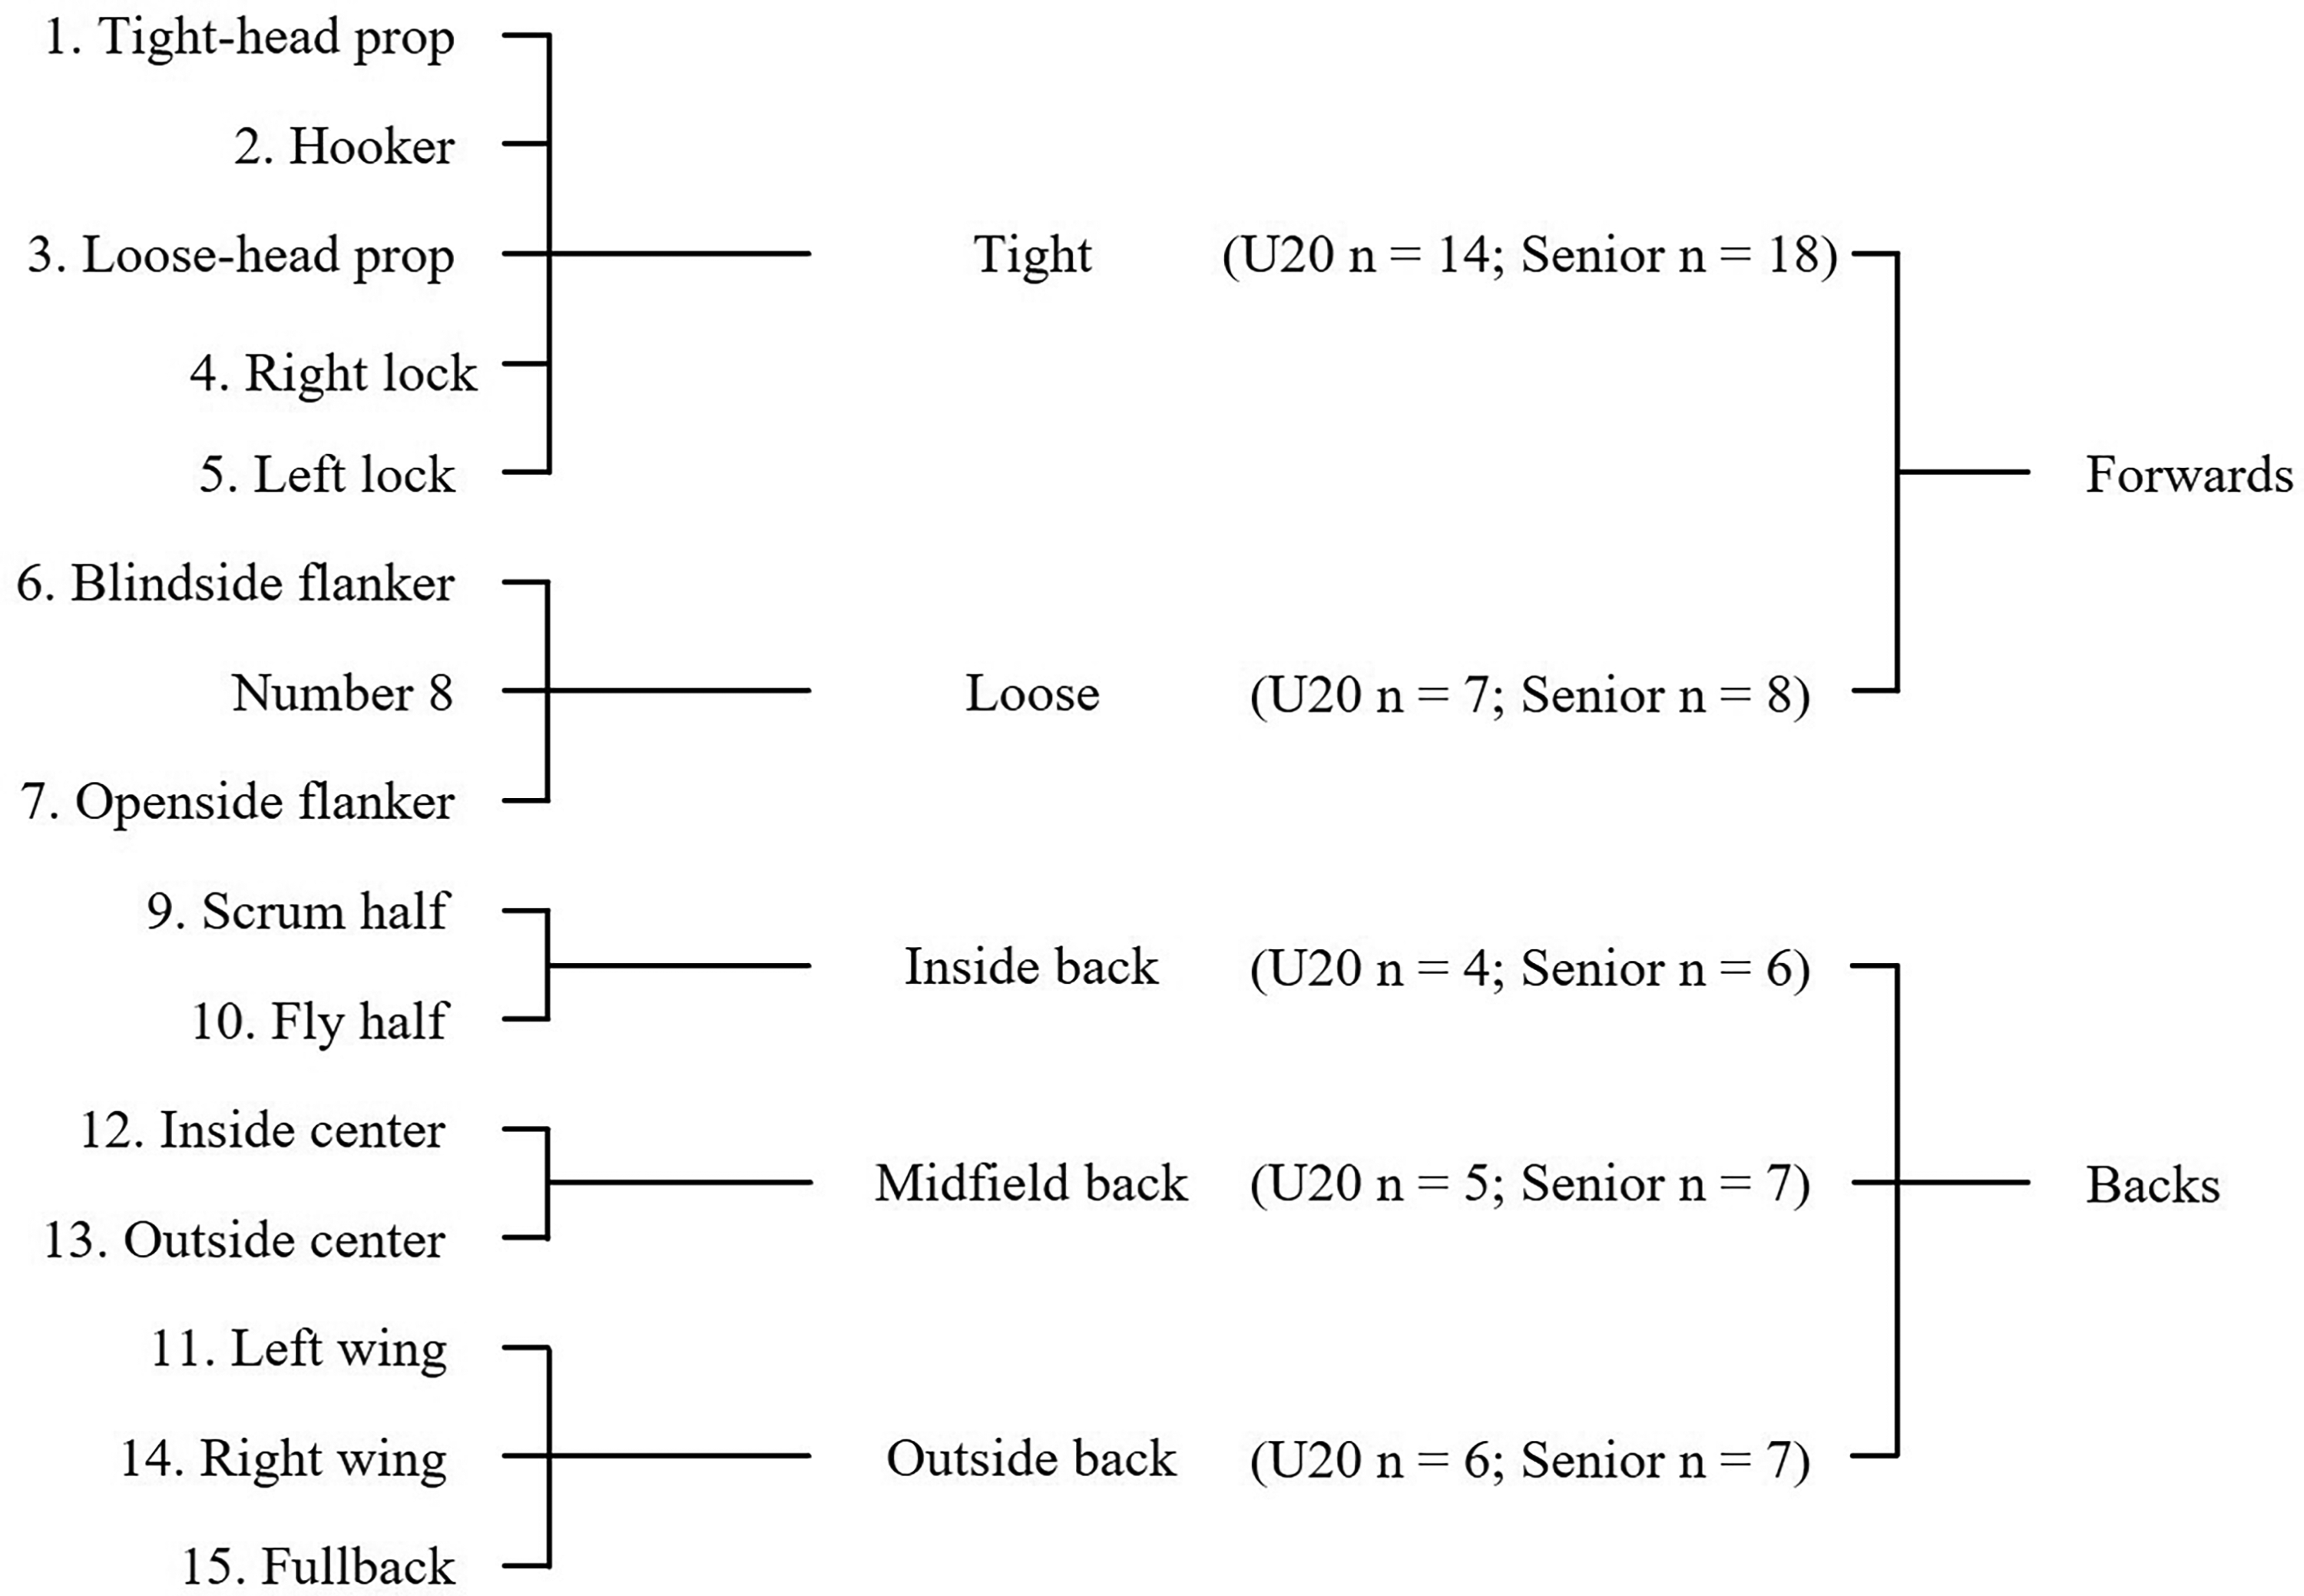
Playing position and repartition of player by position by category.
Statistical analyses
All data are presented as mean ± standard deviation (SD), unless otherwise stated. The Shapiro–Wilk test indicated violations of normality. Therefore, non-parametric statistical procedures were applied for all subsequent analyses. Differences in the distribution of collision frequencies across IZ (IZ 1 to IZ 6 and in MMCI) between playing groups (tight, loose, inside back, midfield back, and outside back) were assessed independently of competition level using a one-way non-parametric analysis of variance (Kruskal–Wallis test). Similarly, differences in collision intensity distribution between competition levels (Senior professional vs. Elite U20) were examined independently of playing position using the same approach.
Comparisons of collision intensity distributions across competition levels within identical playing groups were conducted using the Mann–Whitney U test, with competition level (Senior professional vs. Elite U20) as the between-group factor for each positional group. When a significant main effect was observed (p < 0.05), post hoc pairwise comparisons were performed using Dunn's tests with Holm–Bonferroni adjustment.
Effect sizes were calculated using Cohen's d and interpreted as follows: d < 0.2 trivial, 0.2–0.5 small, 0.5–0.8 moderate, and >0.8 large. Statistical analyses were performed using Python, with the level of statistical significance set at p < 0.05.
Results
Anthropometric data
Anthropometric characteristics of Elite U20 and Senior professional players are presented in Table 1. Across both categories, forwards exhibited greater body mass than backs (p < 0.001). When comparing competition levels, Senior professional players were significantly heavier than Elite U20 players in both forwards (115.3 ± 7.8 kg vs. 105.9 ± 9.5 kg; p < 0.001) and backs (92.0 ± 10.6 kg vs. 83.3 ± 9.1 kg; p = 0.016). Height was also significantly higher in Senior professionals than in Elite U20 forwards (189.3 ± 7.4 cm vs. 183.9 ± 7.7 cm; p = 0.029) but not among backs (182.7 ± 6.0 cm vs. 178.9 ± 6.1 cm; p = 0.089).
Collision frequency comparison between age groups
Across both competition levels, the distribution of collisions across IZ followed a similar pattern, with most collisions recorded in the lowest intensity zone (i.e., IZ 1). In Elite U20 players, IZ 1 accounted for 60.1% of all collisions, followed by IZ 2 (13.9%), IZ 4 (9.2%), IZ 3 (8.2%), IZ 5 (6.3%), and IZ 6 (2.2%). A comparable distribution was observed in SP players, with IZ 1 representing 58.7% of all collisions, followed by IZ 2 (13.4%), IZ 4 (9.4%), IZ 3 (8.4%), IZ 5 (6.8%), and IZ 6 (3.4%).
When all playing positions were combined (Table 2), Senior professional players exhibited higher collision frequencies (i.e., mean number of collisions per match) than U20 players in all IZ. Significant between-category differences were observed in IZ 1 (28.6 ± 6.4 vs. 26.2 ± 7.6 collisions·match−1, p = 0.002), IZ 2 (6.7 ± 2.2 vs. 6.2 ± 2.3 collisions·match−1, p = 0.048), IZ 3 (4.1 ± 1.7 vs. 3.8 ± 2.2 collisions·match−1, p = 0.044), IZ 5 (3.3 ± 1.6 vs. 2.7 ± 1.3 collisions·match−1, p = 0.013), and IZ 6 (1.5 ± 1.5 vs. 1.0 ± 0.8 collisions·match−1, p < 0.001), whereas no significant difference was observed in IZ 4 (p = 0.184). In addition, MMCI was significantly higher in Senior professional players than in Elite U20 players (11.3 ± 1.3 vs. 10.7 ± 1.5 g, p = 0.047).
Comparison of frequency of collision between professional senior and elite U20 for each playing position across intensity zone.
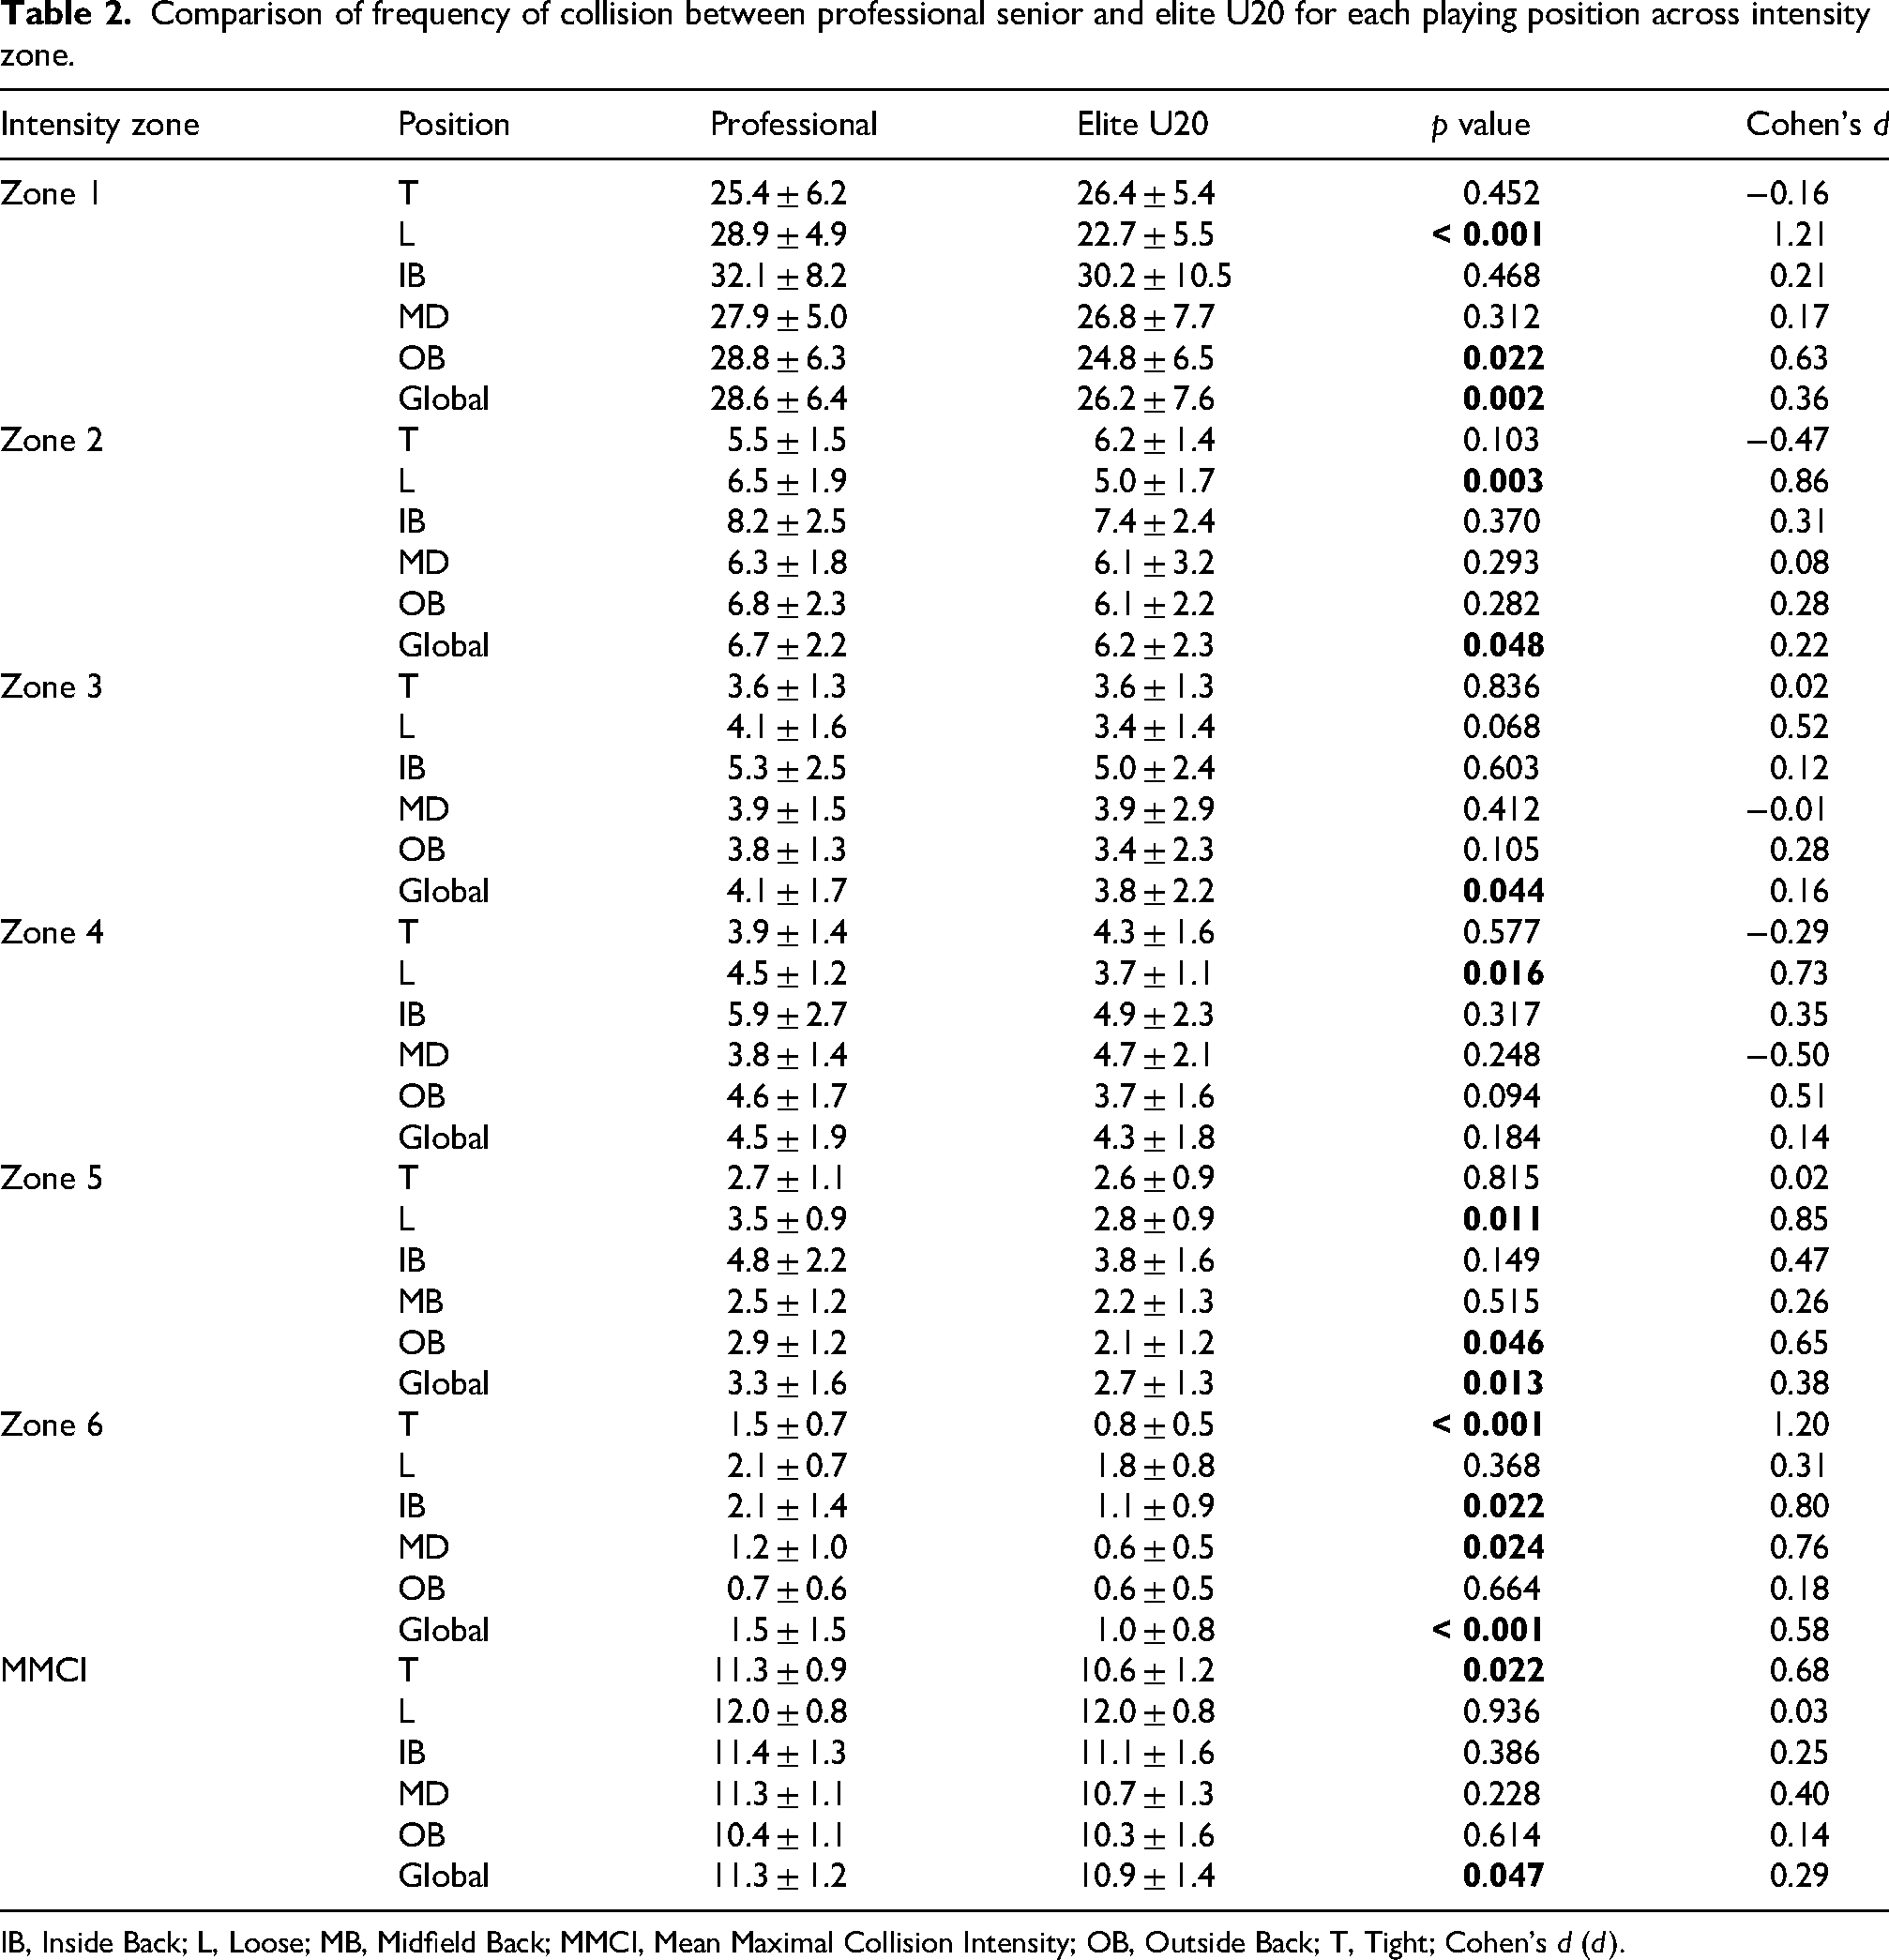
IB, Inside Back; L, Loose; MB, Midfield Back; MMCI, Mean Maximal Collision Intensity; OB, Outside Back; T, Tight; Cohen's d (d).
Collision frequency comparison between positions within each age group
Position-specific analyses revealed marked differences in collision exposure within both Senior professional and Elite U20 categories (Table 3). In both competition levels, inside backs and loose forwards consistently demonstrated the highest collision frequencies across multiple IZ.
Comparison of frequency of collision for playing position across intensity zone for Senior Professional and Elite U20.
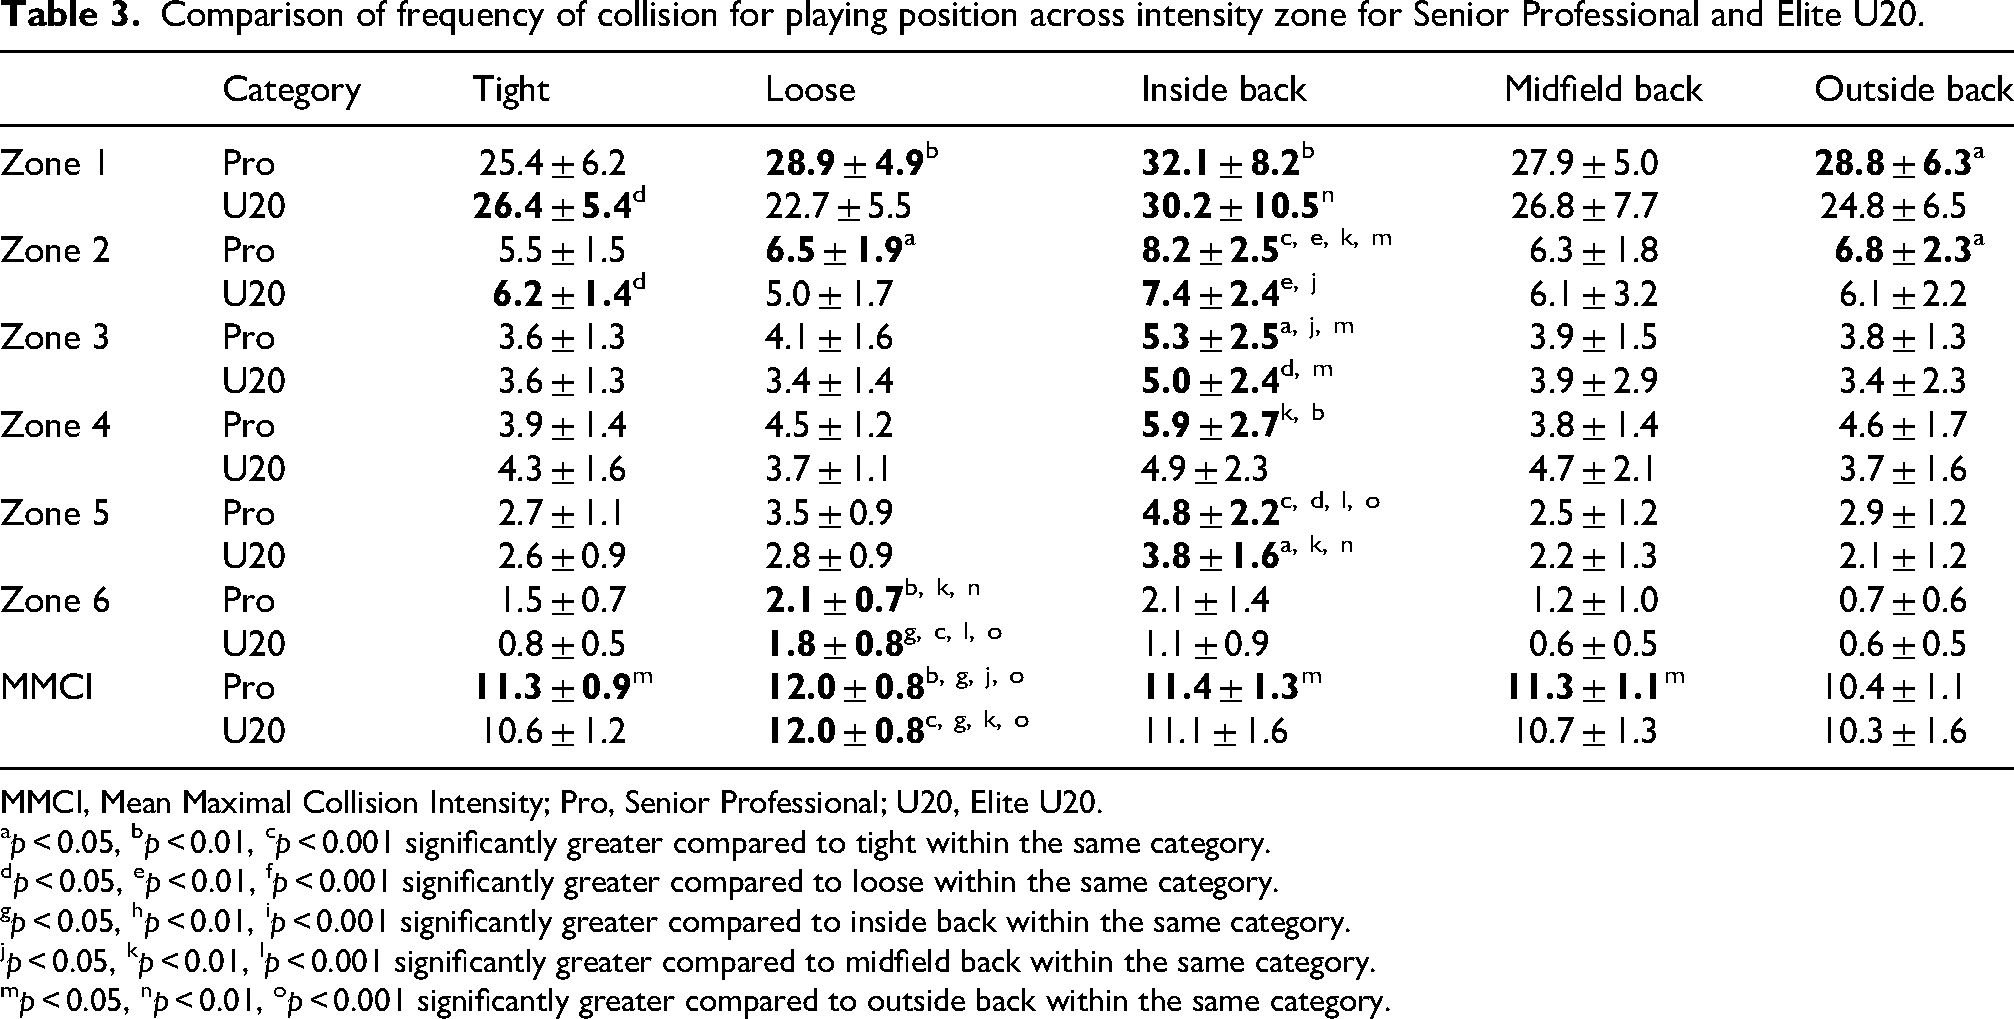
MMCI, Mean Maximal Collision Intensity; Pro, Senior Professional; U20, Elite U20.
p < 0.05, bp < 0.01, cp < 0.001 significantly greater compared to tight within the same category.
p < 0.05, ep < 0.01, fp < 0.001 significantly greater compared to loose within the same category.
p < 0.05, hp < 0.01, ip < 0.001 significantly greater compared to inside back within the same category.
p < 0.05, kp < 0.01, lp < 0.001 significantly greater compared to midfield back within the same category.
p < 0.05, np < 0.01, op < 0.001 significantly greater compared to outside back within the same category.
At Senior professional level, inside backs recorded higher collision frequencies than other positions across moderate-to-high IZ, including IZ 3 (5.3 ± 2.5 collisions·match−1; p = 0.014 vs. tight; p = 0.030 vs. midfield back; p = 0.047 vs. outside back) and IZ 5 (4.8 ± 2.2 collisions·match−1; p < 0.001 vs. tight forwards; p = 0.016 vs. loose forwards; p < 0.001 vs. midfield backs; p = 0.001 vs. outside backs). Loose forwards also exhibited particularly high collision exposure, sustaining greater collision frequencies than other positions, notably in IZ 6 (2.2 ± 0.8 collisions·match−1; p = 0.013 vs. tight; p < 0.001 vs. midfield back; p < 0.001 vs. outside backs).
In Elite U20 players, a similar positional pattern was observed. Inside backs recorded higher collision frequencies in IZ 3 (4.9 ± 2.4 collisions·match−1; p = 0.041 vs. loose forwards; p = 0.044 vs. outside backs) and IZ 5 (3.8 ± 1.6 collisions·match−1; p = 0.008 vs. midfield backs; p = 0.032 vs. tight forwards; p = 0.002 vs. outside backs). Loose forwards also exhibited particularly high collision exposure, sustaining greater collision frequencies in IZ 6 (1.8 ± 0.8 collisions·match−1; p < 0.001 vs. tight forwards, midfield backs, and outside backs).
Discussion
Summary of main findings
The present study aimed to characterise collision demands in elite rugby union by comparing collision frequency and intensity between Senior professional and Elite U20 players, and by examining positional differences within and across competition levels. The main findings indicate that Senior professional players are exposed to a greater collision load than Elite U20 players, particularly in the highest IZ (p = 0.013 and p < 0.001 for IZ 5 and 6, respectively), and experience higher mean maximal collision intensity (p = 0.047). In addition, collision demands differed markedly by playing position, highlighting substantial heterogeneity in mechanical exposure, particularly for inside backs and loose forwards. These results provide new insights into the collision demands associated with progression to professional rugby union and reinforce the importance of position-specific analyses.
Anthropometric considerations
The observed differences in anthropometric characteristics between Senior professional and Elite U20 players are consistent with previous literature21,26,27 For example, Senior front-row players were heavier than their U20 counterparts (119.1 ± 5.0 vs. 111.8 ± 5.6 kg), as were back-row players (117.7 ± 10.4 vs. 101.6 ± 3.9 kg), with Senior players also generally taller in these groups.
21
In our study, Senior professionals had greater body mass than Elite U20 players across both forwards
These differences likely reflect physical maturation and prolonged exposure to high-level training environments. 27 Higher body mass, particularly among forwards, has been consistently associated with the specific demands of this position, including repeated engagement in static and dynamic contact situations such as scrums, rucks, and mauls.21,26,27 These anthropometric differences likely contribute to the greater collision intensity observed among Senior professionals and should be considered when interpreting between-category differences in collision demands.
Between-category differences and positional differences in collision demands
When all playing positions were combined, Senior professional players experienced greater collision demands than Elite U20 players across several IZs, with the most pronounced differences observed in IZ 5 and 6 (+17% and +36%, respectively). These findings indicate that progression to Senior professional rugby is associated with an increase in collision frequency, but also with greater mechanical severity of contact events as reflected by the higher MMCI observed overall in Senior professional players (11.3 ± 1.2 g vs. 10.9 ± 1.4 g; p = 0.047, respectively for Senior professional and Elite U20).
The greater exposure to high-intensity collisions among Senior professional players likely reflects a combination of factors inherent to higher-level competition, such as potentially higher sprint speeds in the senior category, particularly in backs,28,29 differences in body mass between categories, and mismatches in mass between opponents (e.g., between the ball carrier and the tackler). Previous research has consistently shown that match demands increase with competition level, with elite and international competitions characterised by higher mechanical and physiological loads. 20 The present results extend these observations by demonstrating that collision intensity, rather than collision frequency alone, represents a key differentiating factor between Senior professional and U20 RU.
Importantly, the absence of systematic differences across all IZ suggests that the transition to professional rugby is not characterised by a uniform increase in contact exposure, but rather by a greater intensity in the most demanding collision events. These differences were most pronounced among loose forwards, inside backs, midfield backs, and tight forwards, indicating that the transition to senior competition is associated with increased mechanical demands across multiple positional groups. 21 This finding supports the notion that monitoring collision intensity profiles may be particularly relevant during the transition from Elite U20 to professional rugby. It may also reflect the influence of greater body mass, particularly in backs, on collision exposure and impact severity at the Senior professional level.
Collision frequency and intensity across playing position
When collision demands were compared between Senior professional and Elite U20 players within the same playing positions, relatively few differences were observed in low-intensity collision zones, whereas consistent differences emerged in higher IZ. In the highest-intensity zone (IZ 6), Senior professional players generally exhibited greater exposure for tight (+49%), inside backs (+47%), and midfield backs (+51%) than did Elite U20 players. Among loose forwards, Senior professionals recorded significantly greater collision frequencies across multiple IZ (∼ + 20% in IZ 1, 2, 4, 5; all p < 0.016), including moderate and high-intensity collisions. This likely reflects the increased physical demands placed on these players at the senior level, where loose forwards are required to repeatedly engage in both structured contact phases and high-velocity open-play situations.
Similarly, senior tight forwards experienced greater exposure to very high-intensity collisions (+11% in IZ 6, p < 0.001) and a higher MMCI (+6% vs. U20, p < 0.022), consistent with their involvement in repeated short-distance, high-force engagements during scrums, rucks, and close-range defensive actions. Tight forwards were primarily exposed to very high-intensity collisions, consistent with their role in repeated close-contact engagements involving short-distance engagements.13,30,31 This supports earlier findings indicating that front-row players are among the most heavily exposed to high-intensity impacts, despite relatively low pre-contact movement speeds. These findings are corroborated by the observation of Grainger et al. (2018) 32 and support the idea that loose and tight forwards exhibit a higher relative frequency of intense impacts (>9 g) than backs, particularly in the highest-intensity (i.e., >13 g). However, in the present study, inside backs also exhibited high values. This discrepancy may reflect methodological differences between studies, particularly the distinction between impact-based quantification and the detection of discrete collision events, as well as tactical and positional factors that may increase collision exposure in inside backs.
Inside backs and midfield backs also exhibited higher collision frequencies in the highest IZ at the senior level (+47% and +51% vs. U20 in IZ 6, respectively, for inside back and midfield back). These positions occupy central areas of the field and are frequently involved in both attacking and defensive collisions occurring at higher running speeds, which may explain their greater exposure to severe contact events in Senior professional competition.5,30 In addition, positional running-demand analyses have reported that inside back covered the greatest relative distance (78.5 m.min−1) and the greatest distance at high-intensity running speed (3171 m).25,33 These results reflect the unique role in following the play to distribute possession, and, as a result, they are in possession of the ball most often.5,30,34
In contrast, differences between categories were less evident for outside backs, reflecting their lower overall collision frequency despite exposure to occasional high-intensity impacts. This result aligns with the findings of Grainger et al. (2018) 32 indicate that inside backs experience a high frequency of impacts in intermediate zones (9.01–11 g).
Therefore, outside backs experienced lower collision frequencies overall but remained exposed to high-intensity collisions, reflecting the intermittent but potentially severe nature of contact events occurring at higher running speeds. 30 These results are confirmed by collision-load studies, in which backs experience fewer severe impacts (i.e., >13 g), but with higher absolute intensity when they do occur. 32
Substantial positional differences in collision exposure were observed within both Senior professional and Elite U20 categories, highlighting the heterogeneous nature of collision demands in rugby union. Loose forwards consistently demonstrated high collision frequencies across upper IZ, reflecting their dual involvement in structured contact phases and dynamic open-play actions. 30 Collectively, these findings indicate that the increased collision demands observed at the Senior professional level are position-dependent and primarily driven by an increased exposure to high-intensity collisions rather than by changes in low-intensity contact frequency.
The results revealed that senior professional players were more exposed to collisions, particularly in high-intensity zones, likely reflecting differences in competition demands, physical development, and tactical. This trend was confirmed by a more detailed analysis of each position, particularly among loose forwards and inside backs, which exhibited higher collision frequency and intensity profiles.
Limitations
Several limitations should be acknowledged. First, the study was conducted within a single professional club, which may limit the generalisability of the findings to other competitive contexts with different tactical approaches or playing styles.
The collision detection algorithm demonstrated very good performance. However, it is based on a supervised approach with specific classification criteria, 35 which may not cover the entire range of collision configurations. As Gastin et al. (2014) 36 point out, tackle detection often relies on a change in the MEMS orientation. However, some collisions do not cause a loss of balance or a fall (e.g., side collisions, mauls) and may therefore not be recorded.
Second, the technological limitations of accelerometers must be recognised. Despite recent improvements, their ability to detect low-speed impacts (e.g., rucks, mauls, or short tackles) remains challenging. 28 False positives can also occur, as noted by Grainger et al. (2018), 32 when the sensor records acceleration peaks due to impacts (e.g., jumps, changes of direction). These inaccuracies may affect the model's classification performance in certain IZs, particularly the lowest (IZ 1).
Third, the classification of high-intensity zones (> 5 g) is based on thresholds from the literature3,15–18 but remains subject to arbitrary choices depending on the reference studies.
Finally, as indicated by Coughlan et al. (2011) 37 and Grainger et al. (2018), 32 the definitions of an ‘impact’ or a ‘collision’ vary from one protocol to another, making comparisons between studies complex. This heterogeneity in thresholds and grouping methods (positions, intensity) has been identified as a major obstacle to standardising studies on contact loads in collision sports.29,38
Practical application
The results of this study have important practical implications for player development and load management in rugby union. The higher collision demands observed among Senior professional players, particularly in high-intensity zones, suggest that Elite U20 players may require progressive, structured exposure to contact loads to safely prepare for professional competition. A detailed understanding of collision loads across competition levels and playing positions may provide valuable insights into the positional requirements for performance, as previously reported in Senior professional rugby. 34
Such information can facilitate the planning and implementation of training programmes and long-term development pathways designed to provide position-specific physiological and mechanical adaptations, while ensuring that increases in training and match loads are applied appropriately to minimise injury risk. 7 Furthermore, the substantial positional variability observed highlights the need for individualised monitoring strategies. Tailoring training loads to positional collision profiles may not only support performance development and injury risk mitigation but also help practitioners identify players who are suitably prepared for an accelerated transition to Senior professional competition.
Footnotes
Acknowledgments
The authors thank Mr Boisbluche (Head of performance), Mr Demy and Mr Henry for their support during the experiments, as well as players for their contributions.
Ethics considerations
Ethical approval was waived for this study because it relies strictly on the retrospective analysis of anonymized performance and accelerometric data, routinely collected by the club for player monitoring during match play. No administrative or medical interventions were performed on the participants.
Consent to participate
All participants were informed about the purpose, procedures, potential risks, and benefits of the study, and provided written informed consent prior to participation, including authorisation for image use.
Consent for publication
All participants were informed about the purpose, procedures, potential risks, and benefits of the study, and provided written informed consent prior to participation, including authorisation for image use.
Author contributions
DLM and MP conceived and designed research; DLM and MP conducted the experiments; DLM analysed data; DLM wrote the original draft of the paper; MP critically reviewed and edited the paper. All authors have read and approved the manuscript prior to submission.
Funding
The authors received no financial support for the research, authorship, and/or publication of this article.
Declaration of conflicting interests
The authors declared no potential conflicts of interest with respect to the research, authorship, and/or publication of this article.
Data availability statement
The raw data supporting the findings of this study cannot be made publicly available due to confidentiality agreements with the participating club and the proprietary nature of the performance monitoring data collected during competitive match play.