






Abstract
Background
Practitioners increasingly seek proxy metrics that allow key neuromuscular qualities to be monitored using field-based tests. However, the extent to which countermovement jump (CMJ), sprint-based deceleration tasks, and isometric strength tests share underlying constructs remains unclear.
Purpose
To examine relationships between metrics derived from CMJ, assisted 30 m acceleration-deceleration (ADA30), and isometric belt squat (IBS) tests, and to identify candidate proxy metrics for acceleration, peak sprint velocity, and braking.
Methods
Twenty-four American football players completed CMJ no-arms-swing, ADA30 in assisted mode, and IBS at ∼120° knee flexion. From exports, 30 CMJ, 8 ADA30 phase 1a, and 9 IBS variables were retained. Spearman rank correlations were computed between CMJ–ADA30, CMJ–IBS, and ADA30–IBS pairs. False discovery rate was controlled using the Benjamini-Hochberg procedure (q = 0.10).
Results
Phase 1a peak assisted sprint velocity was associated with CMJ propulsive metrics (ρ = 0.61–0.81). CMJ braking phase variables were associated with IBS relative peak force, including relative braking force metrics (ρ = 0.63–0.66) and braking phase duration (ρ = −0.61). Braking phase duration and stiffness were associated with phase 1a peak deceleration (ρ = −0.58 and −0.57). Peak IBS rate of force development was counterintuitively associated with early assisted acceleration metrics, comprising phase 1a 0–5 m time (ρ = 0.58) and phase 1a peak acceleration (ρ = −0.57).
Conclusions
CMJ propulsive metrics appear to be robust proxy candidates for assisted peak sprint velocity, whereas CMJ braking phase variables and IBS force outputs may reflect indirectly neuromuscular capacities related to horizontal deceleration. Further work, including unassisted sprint and deceleration tasks, is required.
Introduction
In modern team sports, nearly all data-informed decisions made by coaching staff are based on testing data collected from players. This data primarily comes from training and match environments. 1 Due to limited time, equipment availability, and qualified personnel, it is practical to seek alternatives—known as proxy metrics—for tests requiring considerable time that show interdependencies among them. These indicators are derived from simple, repeatable and standardised tests that reliably reflect athletes’ complex neuromuscular abilities. Using such indicators allows for replacing some costly, time-consuming, or physically demanding field tests while still providing the necessary information for decision-making. In short, if a small set of carefully selected tests can measure key locomotion traits (e.g., acceleration, peak sprint velocity, or braking), daily monitoring can be more efficient, frequent, and less burdensome for both staff and players, without sacrificing diagnostic value and the quality of the final decision.2,3
The countermovement jump (CMJ) is one of the most widely used assessments in strength and conditioning. Beyond jump height, force–time data enable granular analysis of how this is achieved, 4 and available evidence suggests that many commonly reported CMJ metrics demonstrate acceptable, or at least close-to-acceptable reliability.5,6 Several studies have reported moderate-to-strong associations between CMJ-derived metrics—such as jump height, propulsive force/power, and modified reactive strength index (mRSI)—and sprint performance in team sport athletes and sprinters7–10 In parallel, horizontal deceleration has emerged as an important, and partly distinct, performance and injury-relevant capacity.11,12 High-intensity decelerations occur frequently in match-play and are associated with substantial mechanical load and soft tissue injury risk.13–15 Evidence linking CMJ force–time metrics with maximal horizontal braking ability remains limited and population-specific. In male university team sports athletes, Harper et al. (2020) 16 showed that selected CMJ variables differentiated athletes with higher versus lower horizontal braking performance after a 20 m acceleration-deceleration task. Concentric force and power appeared most relevant to average horizontal deceleration, whereas eccentric and concentric velocity and power characteristics were more relevant when braking was expressed as horizontal braking impulse (a momentum-related ouput influenced by participant body mass). In professional male basketball players, Philipp et al. (2022) 17 reported no significant correlations between CMJ force–time metrics and horizontal deceleration outcomes. However, median-split comparisons suggested favourable concentric velocity, power, and jump height profiles in athletes with superior average horizontal deceleration or relative braking impulse, and selected eccentric qualities in those with superior absolute braking impulse. Thus, CMJ braking and propulsive metrics should be interpreted as candidate, population-specific proxy indicators of neuromuscular qualities relevant to horizontal deceleration rather than definitive markers.
Isometric strength assessments—especially the isometric mid-thigh pull (IMTP)—are widely used to evaluate maximal force and rate of force development (RFD) in athletes using a standardised, controlled testing approach. Research has generally reported moderate-to-large correlations between IMTP force–time characteristics and sprinting, jumping, and change-of-direction performance, with acceptable reliability across athlete groups18–24 supporting the IMTP as an established isometric strength assessment. By contrast, squat-based isometric alternatives such as the isometric belt squat (IBS) remain less explored. Although Layer et al. (2018) 25 showed that IBS can generate approximately 20% higher peak vertical ground reaction force than a position-matched isometric back squat with lower lumbar moments, evidence linking IBS-derived metrics to locomotor performance remains limited. Recent work by Ward (2024) 26 suggests associations between IBS-derived 200 ms impulse and sprint split times, but comparable evidence for jumping, change-of-direction, and especially horizontal braking tasks is lacking. Thus, the broader locomotor relevance of IBS-derived force–time characteristics remains unclear and represents a gap in the current literature.
The advent of motorised resistance devices (MRDs) has facilitated precise assessment and training of both resisted and assisted sprinting. Importantly, beyond exposing athletes to unique locomotive demands, MRDs also function as measurement systems that provide concurrent kinematic outputs during task execution. Validation and reliability studies indicate that MRD-derived metrics (e.g., displacement, velocity, acceleration/force, phase-specific outcomes) are reproducible and sensitive to changes in loading across different tasks.27–29 Assisted, or overspeed sprinting using MRDs can expose athletes to near-maximal or supra-maximal running velocities while potentially placing unique demands on horizontal braking capacities when athletes are required to decelerate rapidly.30–34
For American football skill and running positions (e.g., wide receivers, running backs, defensive backs), performance depends heavily on repeated high-intensity accelerations, achieving high-velocity running, and aggressive decelerations to execute route changes and defensive reactions. 35 These locomotive demands share important similarities with those of wide players in, for example, soccer, rugby, handball or basketball, where frequent accelerations and decelerations contribute substantially to overall mechanical load.13–15 Accordingly, an improved understanding of the relationship between lower-body isometric force production, vertical jumping performance, and mechanical outcomes from horizontal locomotion, may help inform more targeted training prescription, and optimise monitoring frameworks by prioritising the most informative proxy measures. It could also stimulate new research directions aimed at clarifying how neuromuscular qualities transfer across movement tasks and sport-specific contexts.
Although CMJ force–time metrics have been linked to several athletic performance outcomes, their utility as practical proxy markers of horizontal braking capacity remains unclear. This gap is important because horizontal deceleration is receiving increasing attention in sports science, yet evidence linking simpler neuromuscular tests to braking performance remains limited and equivocal, particularly in well-trained populations. 36
The aim of this study was to examine the relationships between CMJ force plate metrics, MRD's assisted 30 m acceleration-deceleration (ADA30) performance, and IBS variables obtained using a portable fixed dynamometer in semi-professional, well-trained American football players occupying running/skill positions, with the aim of identifying candidate proxy metrics for locomotive capacities relevant to acceleration, peak sprint velocity, and especially horizontal braking.
Methods
Participants
Twenty-four male American football athletes from a Polish semi-professional team volunteered to participate in the study (mean ± SD: age, 23.5 ± 4.6 years; body mass, 90.6 ± 8.3 kg; and height, 179.7 ± 4.0 cm). The participants competed at the highest level of play in Poland. All participants played skill positions (including linebackers n = 7, tight ends n = 2, wide receivers n = 4, running backs n = 1, and defensive backs n = 10). They were accustomed to structured strength and conditioning programs and had completed at least three of the same test batteries in the previous 12 months. The average strength and conditioning training experience was (6.9 ± 4.0 years), and the average American football playing experience was (6.1 ± 4.3 years). The typical weekly volume during the testing period was 4.9 (±1.1) weekly strength and conditioning units per weekly microcycle, and 0.4 (±0.7) specific field units. All participants declared no acute musculoskeletal injuries and were cleared for complete training by the team medical staff. Inclusion criteria included participation in full training during the preparatory period and the absence of pain that limited training and testing. Exclusion criteria included acute musculoskeletal symptoms, functional limitations, a history of injury within the previous 6 months, and lack of consent to participate in the study.
The tests were performed three months before the start of the league, in the preseason period, during which the training programme focused primarily on physical preparation rather than tactical and technical content. In American football, scheduling a battery of neuromuscular tests approximately 8–12 weeks before the season is a typical approach, as it establishes a baseline for athletic readiness and provides a safe, practical direction for further periodisation of strength, power, and speed. This is the phase in which players typically demonstrate a high level of general physical preparedness, which facilitates the implementation of demanding neuromuscular tests.
No confounding factors were identified on the day of the study. Participants were instructed to refrain from intense training for 24–48 h before testing, and caffeine/supplementation standards were established. The study was conducted in accordance with the Declaration of Helsinki. Before testing, all participants signed informed consent to participate in the study, and were informed that they could withdraw from the study at any time without incurring any sporting or organizational consequences. The study received a positive opinion from the Research Ethics Committee at the Jan Długosz University in Częstochowa. Resolution No. KE-U/9/2026 of 19 January 2026.
Research protocol
A cross-sectional study design was used. All tests were conducted within a single morning session (08:00–11:00) following one rest day without formal training, and players were tested in small sub-groups to reflect applied practice and to allow natural verbal encouragement from teammates and coaches. The testing battery consisted of a standardised warm-up protocol, CMJ no-arms-swing performed on dual force plates, ADA30 in assisted mode on the MRD, and IBS at approximately 120° knee flexion using a portable fixed dynamometer. The order of tests was consistent across sub-groups.
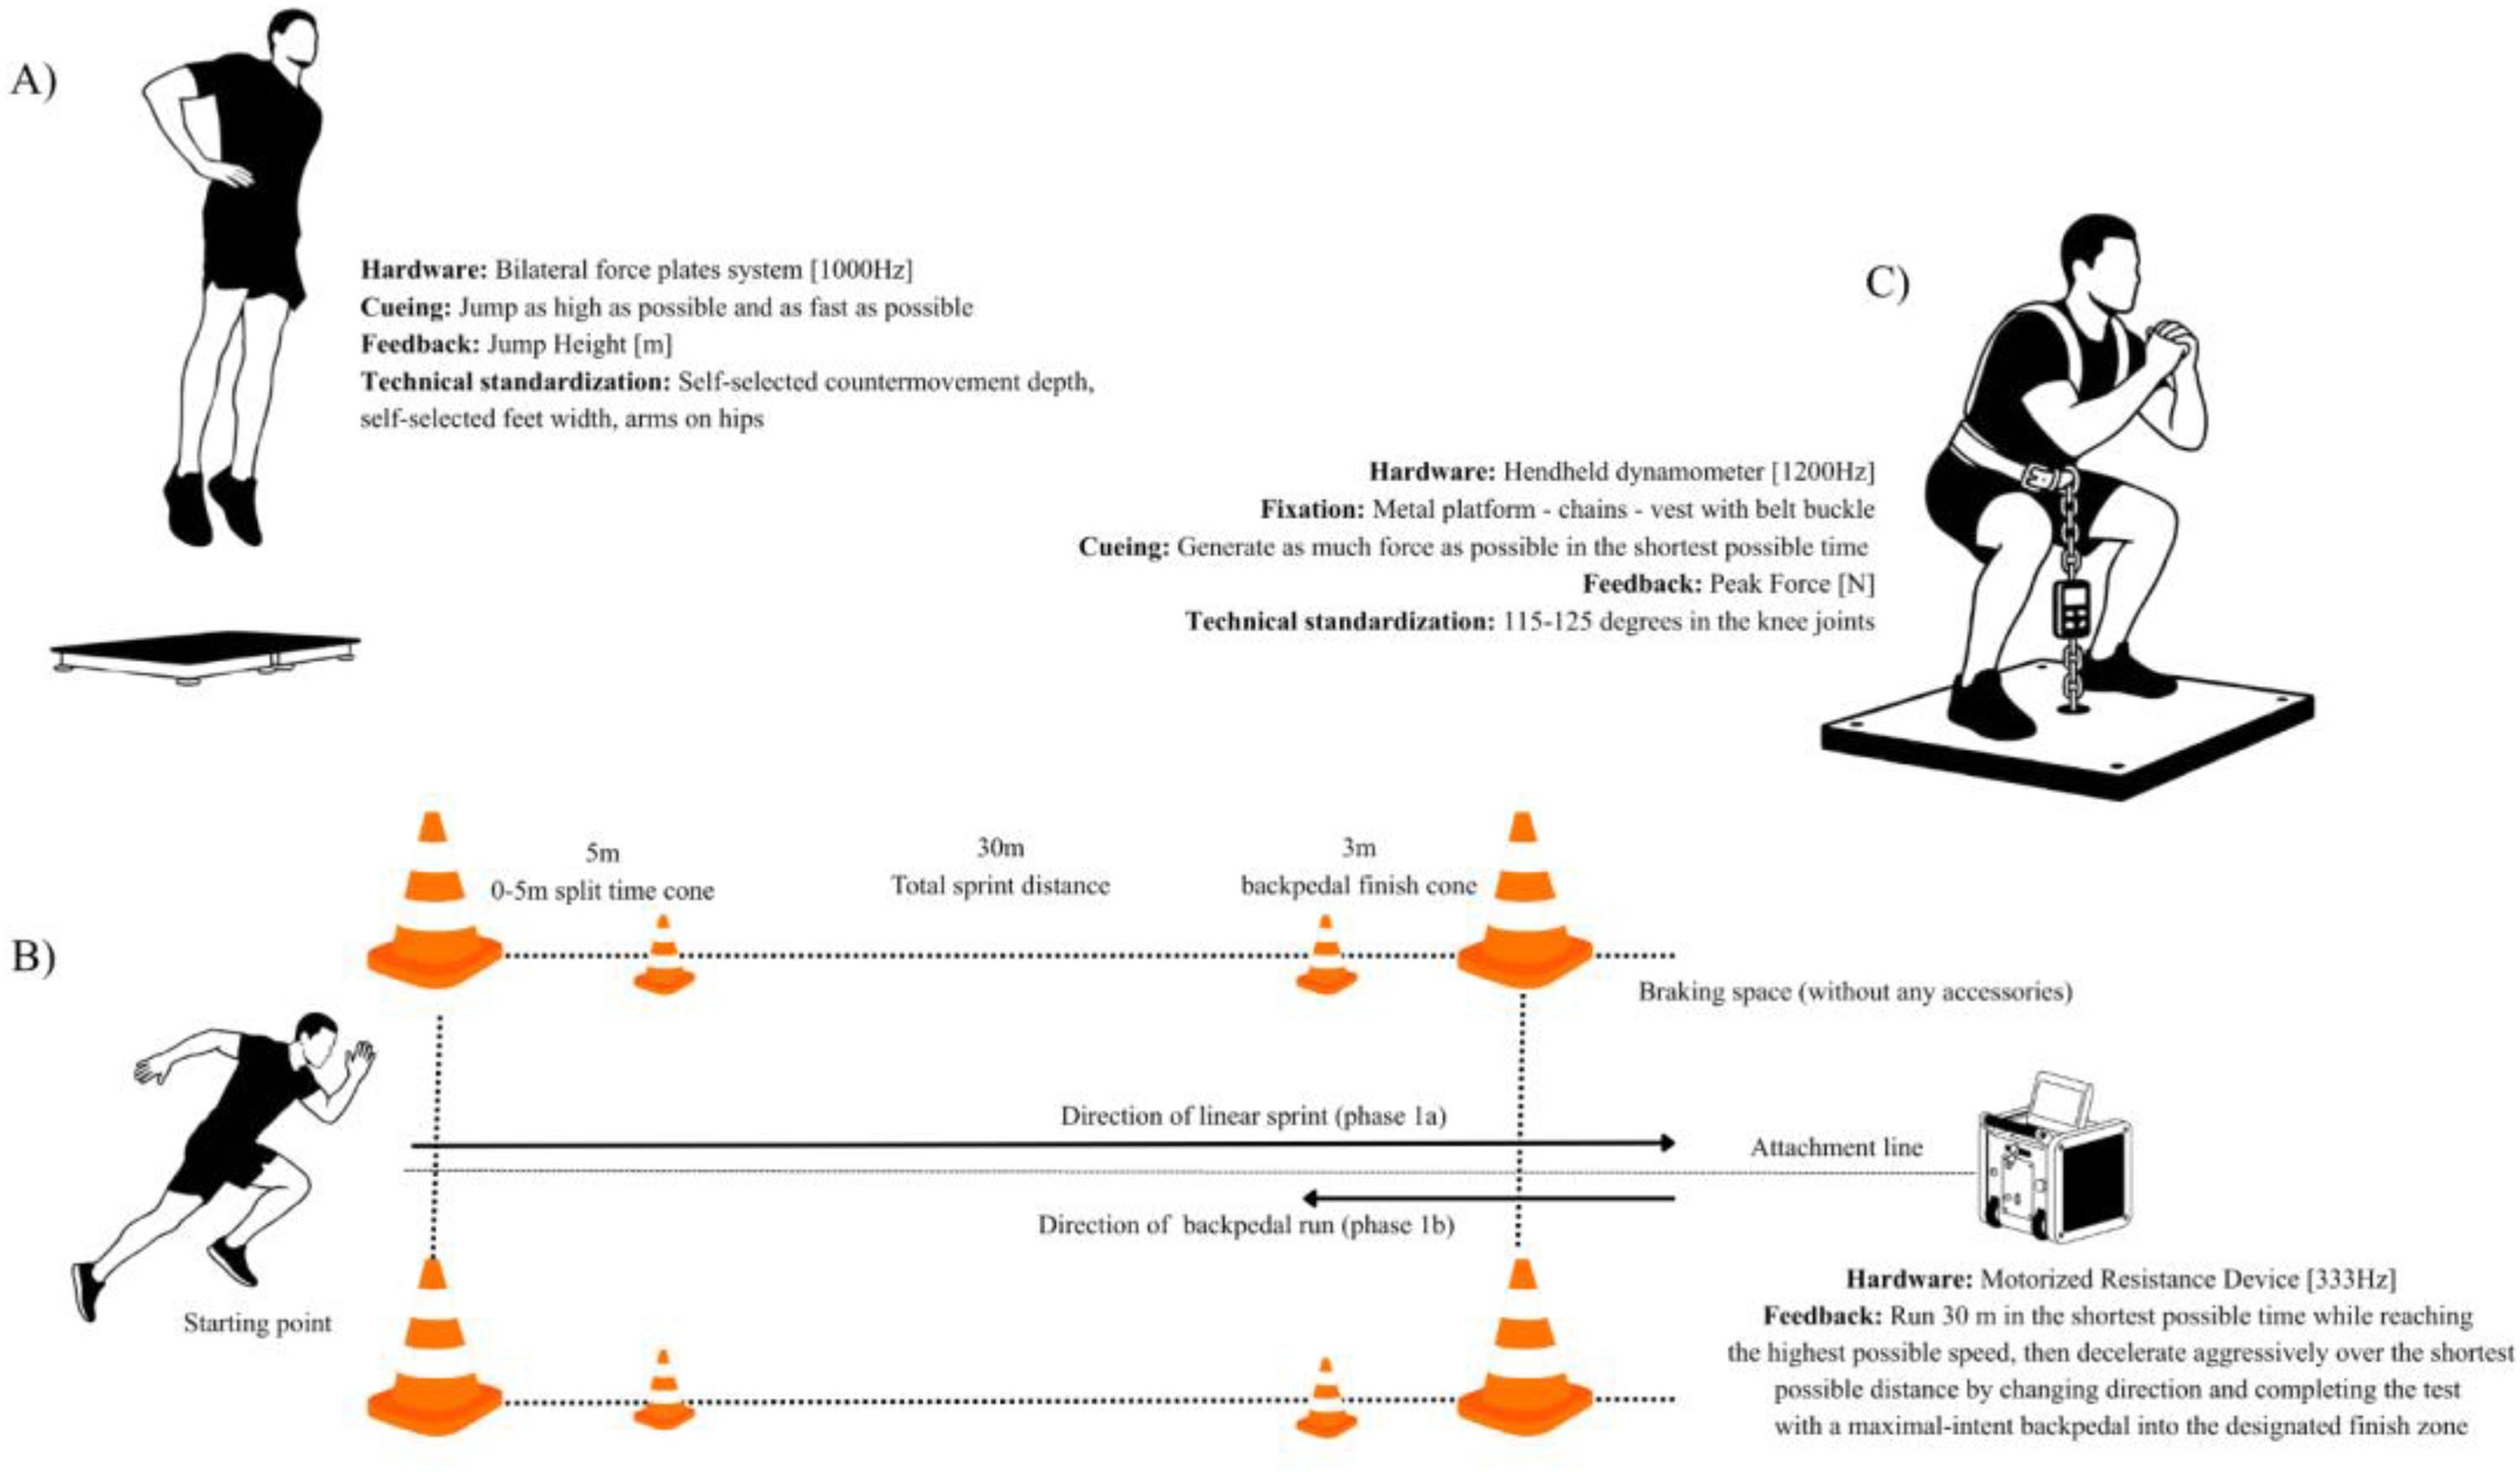
The figure shows a graphical representation of the tests performed A - countermovement jump (CMJ); B - assisted 30 m acceleration-deceleration (ADA30); C - isometric belt squat (IBS).
Warm-up
Players completed a ∼15 min warm-up based on the RAMP (raise–activate–mobilise–potentiate) model, 37 comprising: low-intensity running, skipping and mobility drills, lower-body and trunk bodyweight exercise, extensive low-amplitude plyometrics, and three progressive accelerations over 10 m. The same sequence was used for all sub-groups.
Countermovement jump (CMJ)
CMJ ground reaction force was sampled at 1000 Hz using a wireless dual force plate system (Hawkin Dynamics, Westbrook, Maine, USA) and transmitted in real time to the web-based Hawkin Dynamics Cloud via the Android Hawkin Capture application (version 9.10.1, Westbrook, Maine, USA). This system has demonstrated high criterion validity for assessing CMJ force–time variables compared with laboratory-grade force platforms.38,39 Athletes stood with feet approximately shoulder-width apart and hands-on-hips. After a stable quiet phase, they performed a self-selected countermovement and jumped vertically in response to an audio-visual cue from a tablet. Each athlete performed 3 maximal CMJs, separated by approximately 5 s. The instruction provided was: “jump as high and as fast as possible”. Feedback was given after each attempt in the form of jump height, and the force plates were zeroed regularly between participants to ensure calibration stability.
From the manufacturer's web-based export function, the following 30 CMJ variables were retained for analysis and categorised into: performance outcomes (e.g., jump height, mRSI), movement strategy and timing measures (e.g., countermovement depth, phase durations, time to take-off), and kinetic/kinematic metrics from braking and propulsive phases (force, velocity, power, and impulse). All relative force and power variables were normalised to body mass (%BM, W/kg, N·s/kg) to enable comparisons between athletes. A complete list of the extracted variables, units, and their operational definitions is provided in Supplementary Table S1. For each variable, the mean of three CMJ trials was used for analysis. A graphical representation of the test is in Figure 1A.
Assisted 30 m acceleration-deceleration (ADA30)
Assisted acceleration, sprinting and deceleration were assessed using a 1080 Motion Sprint 2 device sampling at 333 Hz (1080 Motion, Lidingö, Sweden), in the assisted mode. Data were streamed live to the web-based 1080 Motion Cloud via the Windows control application (version 1.9.14.2, Lidingö, Sweden). MRDs of this type have demonstrated good criterion validity for sprint time measurements and good-to-excellent test–retest reliability for phase-specific outcome metrics in team sports athletes.27–29 Application of resisted and assisted locomotion tasks using similar devices has been shown to acutely modify sprint performance and mechanical outputs.30–32,34 Key settings were as follows: assisted load of 3 kg in both “concentric” and “eccentric” phases (identical for all athletes); mode “no fly weight” (NFW) with an upper limit of 14 m/s as the target maximum velocity benchmark; run start and direction change identified automatically using default system thresholds; and athletes wearing a waist belt attached at the hips level. Testing took place on indoor artificial turf. No cones or visual markers were placed in the deceleration zone beyond 30 m, in order not to predefine or constrain the athletes’ braking distance or strategy. Immediately after the 30 m sprint segment, athletes were instructed to perform a maximal-intent backpedal, allowing the system to correctly detect the change-of-direction manoeuvre.
During the ADA30 test, participants completed two maximal trials, rested for about 5 min, and received feedback on phase 1a peak sprint velocity after each trial. Participants were instructed to: “run 30 m in the shortest possible time while reaching the highest possible velocity before decelerating aggressively over the shortest possible distance to change direction and complete the test with a maximal-intent backpedal into the designated finish zone”. Only variables from phase 1a were included in the analysis, while phase 1b (backpedal distance) was excluded. For statistical analysis, the best trial for each participant was chosen based on the highest phase 1a average deceleration (peak sprint velocity/braking time) value to highlight the whole braking component. A complete list of variables, units, and operational definitions is provided in Supplementary Table S2. A graphical representation of the test is in Figure 1B.
Isometric belt squat (IBS)
Maximal isometric lower-body strength was assessed using a portable fixed dynamometer (TruStrength, Hawkin Dynamics, Westbrook, Maine, USA) sampling at 1200 Hz, with data sent in real time to the web-based Hawkin Dynamics Cloud via the Android Hawkin Capture application (version 9.10.1, Westbrook, Maine, USA). Similar fixed-dynamometer configurations with the TruStrength device have shown high reliability for lower-limb isometric strength testing, including the IBS.40,41 Athletes wore a dedicated vest connected via a heavy chain to a metal base plate, positioning them in a half-squat stance; target knee flexion was ranged from 115–125 ° relative to full extension, verified using an analog goniometer during set-up. The dynamometer was zeroed before each effort, and athletes were required to establish a stable pre-tension level just below 300 N (system-defined onset threshold for net force), which served to standardise the starting position and achieve a more stable quiet phase prior to the maximal effort, with net values subsequently calculated relative to this threshold. Participants stood on a firm, level surface with their arms crossed over their chest or with their hands-on-hips to match CMJ posture. Each isometric trial lasted 5 s from the verbal cue, and participants performed two maximal effort trials separated by approximately 3 min of rest. They were instructed to: “generate as much force as possible in the shortest possible time”. Feedback in the form of peak force was displayed after each trial. Nine variables describing peak force and the IBS force–time characteristics were retained from the Hawkin Dynamics Cloud export. Relative variables (normalised to body mass) formed the basis of the main analysis. A complete list of metrics, units, and operational definitions is provided in Supplementary Table S3. For each variable, the mean of two trials was used in the analyses.10,18–20 A graphical representation of the test is in Figure 1C.
Data processing and sign conventions
All data were exported to .csv files and subjected to analysis within the Python programming environment, leveraging libraries including: Pandas, NumPy, and SciPy. As part of the initial data cleaning, decimal points and non-breaking spaces were converted to standard decimal point notation, before all columns, except identifiers (e.g., athlete name to ID), were converted to numeric data. No missing or incorrect data were recorded. For the CMJ: braking phase velocity, power, and stiffness data were negative, with lower values representing a greater performance magnitude. To maintain biomechanical interpretation, more negative values were assumed to indicate a higher magnitude of the parameter in the deceleration phase (i.e., potentially greater deceleration capacity or higher stiffness as computed by the manufacturer's algorithm). For the deceleration metrics in the ADA30 test (phase 1a average deceleration and phase 1a peak deceleration), values were reported as positive magnitudes, with higher values interpreted as more effective deceleration. Additionally, all time metrics in the ADA30 test (phase 1a time, phase 1a 0–5 m time, phase 1a deceleration time) were interpreted in such a way that lower values indicated better performance (faster acceleration or shorter deceleration time), while a shorter deceleration distance (phase 1a deceleration distance) was considered advantageous, indicating more efficient deceleration over a shorter distance. The sign and direction conventions used were explicitly considered when interpreting the statistical results, particularly the signs of the correlation coefficients for the inhibition and time-related variables, to avoid erroneous conclusions resulting solely from the arbitrary way of reporting values (negative vs. positive; less is better vs. more is better).
Statistical analysis
The statistical analysis was developed to identify potential proxy metrics. Therefore, a broad set of dependent variables were retained, but subsequent interpretation focused on FDR-significant and mechanistically plausible relationships to minimise the risk of data-driven over-interpretation. Given the sample size (n = 24) and the expectation of non-normal distributions, Spearman's rank-order correlation (ρ) was used to quantify monotonic relationships between:
- CMJ and ADA30 variables (30 × 8 = 240 pairs), - CMJ and IBS variables (30 × 9 = 270 pairs), - ADA30 and IBS variables (8 × 9 = 72 pairs).
In total, 582 cross-test correlations were calculated.
To address multiplicity while preserving reasonable sensitivity in this discovery-oriented analysis, the Benjamini–Hochberg procedure was applied across all 582 two-sided correlation tests to control the false discovery rate (FDR) at q = 0.10. This threshold was selected because the analysis was intended to identify candidate associations in a high-dimensional setting rather than to serve as a confirmatory test of a small number of prespecified hypotheses; in such contexts, FDR control is commonly used to balance false discoveries against loss of power. Benjamini–Hochberg-adjusted p-values (hereafter reported as q-values) are provided for all tests. Associations with q < 0.10 were considered statistically significant after FDR control and interpreted as candidate rather than definitive relationships. Associations with nominal p ≤ 0.05 that did not survive FDR correction were treated as exploratory only. For consistency with Table 1 reporting, 95% confidence intervals for Spearman's ρ were calculated using a Fisher z-transformation approximation (SE = 1/√(n−3)) and then back-transformed to the correlation scale. Effect magnitudes were interpreted descriptively using conventional thresholds (|ρ| < 0.10 trivial, 0.10–0.29 small, 0.30–0.49 moderate, 0.50–0.69 large, ≥0.70 very large). 42 As most force- and power-related outcomes were already expressed relative to body mass, additional body-mass-adjusted partial correlations were not performed in the primary analysis to avoid redundant adjustment. Absolute metrics were therefore interpreted with appropriate caution. When “lower is better” (temporal metrics) or when device-extracted signs were unintuitive (e.g., CMJ braking variables), correlation directions were interpreted using the sign conventions defined in the data-processing section. Correlation structures were visualised as half-matrix heat maps (upper triangle masked) for internal interpretation, and selected relationships were plotted as scatterplots. Intraday reliability was assessed across three CMJ trials in 24 athletes. This analysis was performed only for the CMJ, as it was the only test represented by the mean of at least three repeated trials. For each metric, absolute and relative reliability were quantified using CV% and two-way mixed-effects absolute-agreement single-measure ICC [ICC(A,1)], respectively, with 95% confidence intervals estimated by participant-level bootstrapping. SEM and MDC95 were also calculated, and analyses were restricted to complete athlete-level triplicates. Full reliability results are provided in Supplementary Table S5.
FDR-significant cross-test Spearman rank correlations (n = 24) between countermovement jump (CMJ), assisted 30 m acceleration–deceleration (ADA30; phase 1a metrics), and isometric belt squat (IBS) variables. Values are Spearman's ρ with 95% confidence intervals (95% CI), two-sided unadjusted p-values, Benjamini–Hochberg false discovery rate–adjusted q-values (q < 0.10), and qualitative magnitude descriptors.
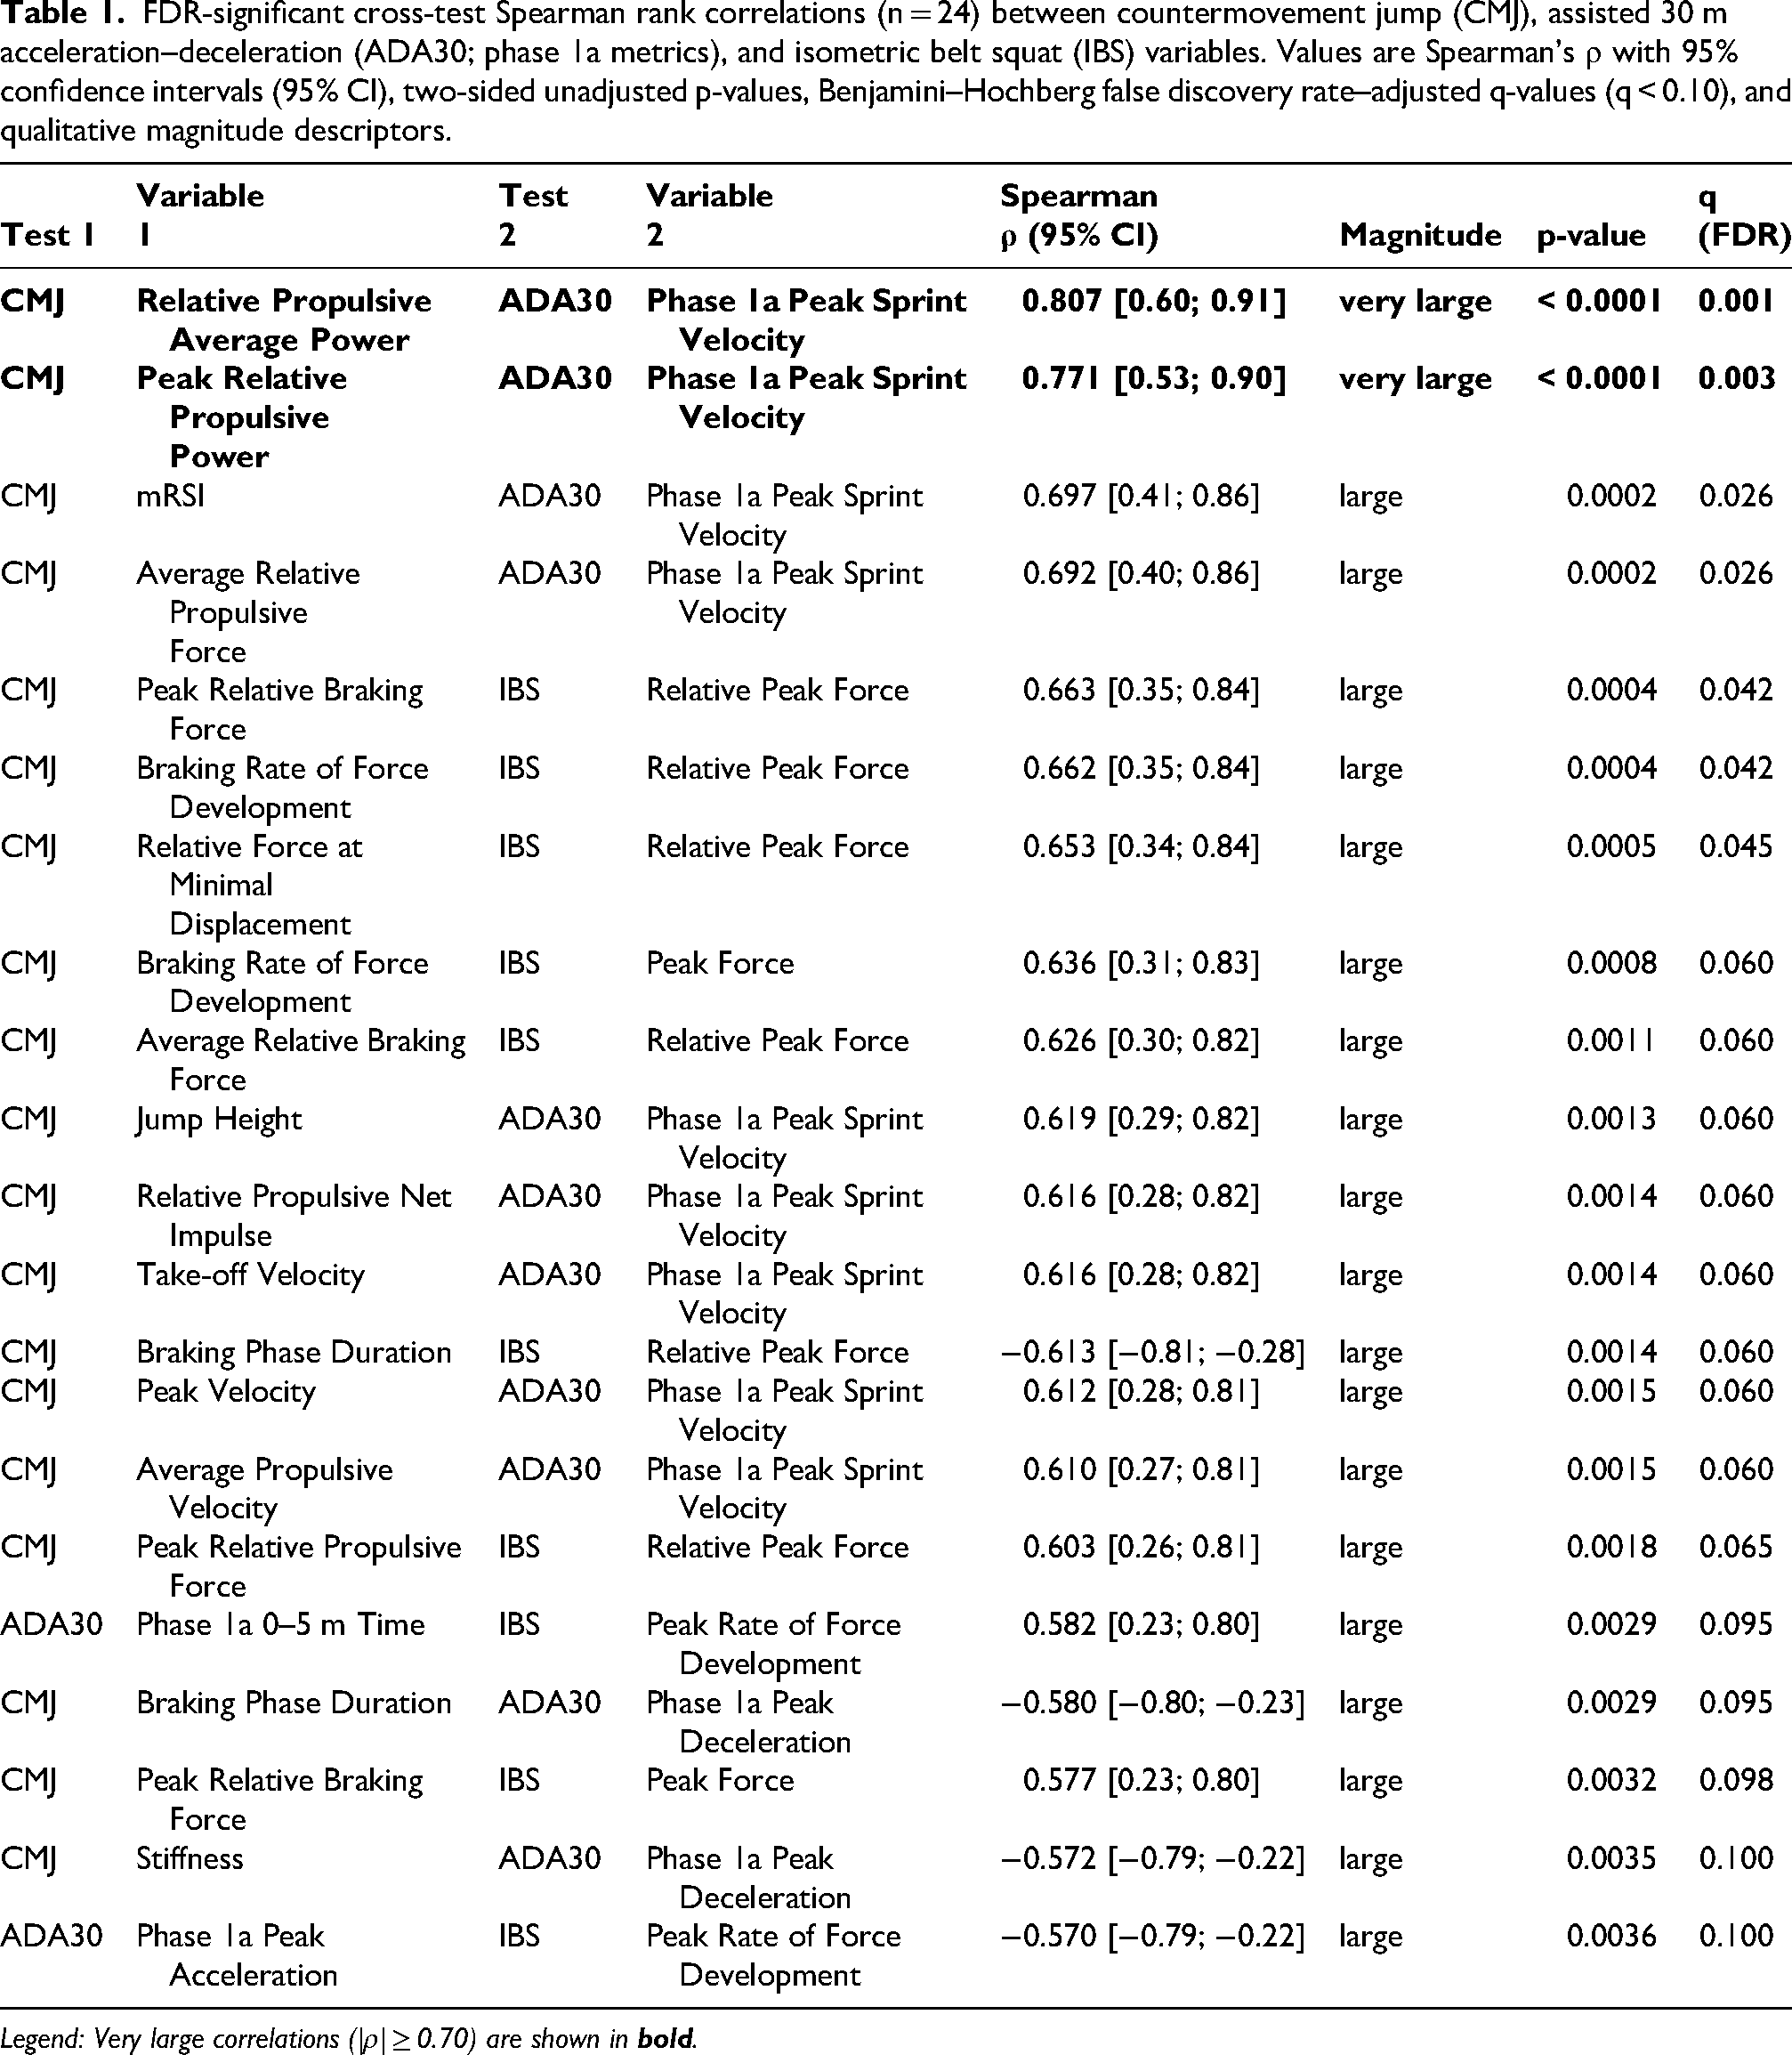
Legend: Very large correlations (|ρ| ≥ 0.70) are shown in
Use of AI tools
An AI-based writing assistant, Grammarly (web-based version, Pro license, at the time of analysis; Grammarly Inc., USA) was used to support linguistic revision, including grammar, spelling, stylistic, and consistency checks. Additionally, an AI-based large language model, ChatGPT (OpenAI, USA; version 5.5, Pro license), was employed to generate Python code for data processing. The generated scripts were executed within the same ChatGPT computational environment, and the resulting outputs were exported as comma-separated values (.csv) files for subsequent statistical analysis and figure preparation conducted by the authors.
Results
Exploratory Spearman correlation analysis (n = 24) revealed 21 statistically significant relationships between CMJ, ADA30, and IBS parameters (after FDR correction, q < 0.10). The full pairwise correlation matrix is presented in Figure 2. Detailed results of all significant relationships (along with ρ, p, and q values and qualitative effect sizes) are presented in Table 1.
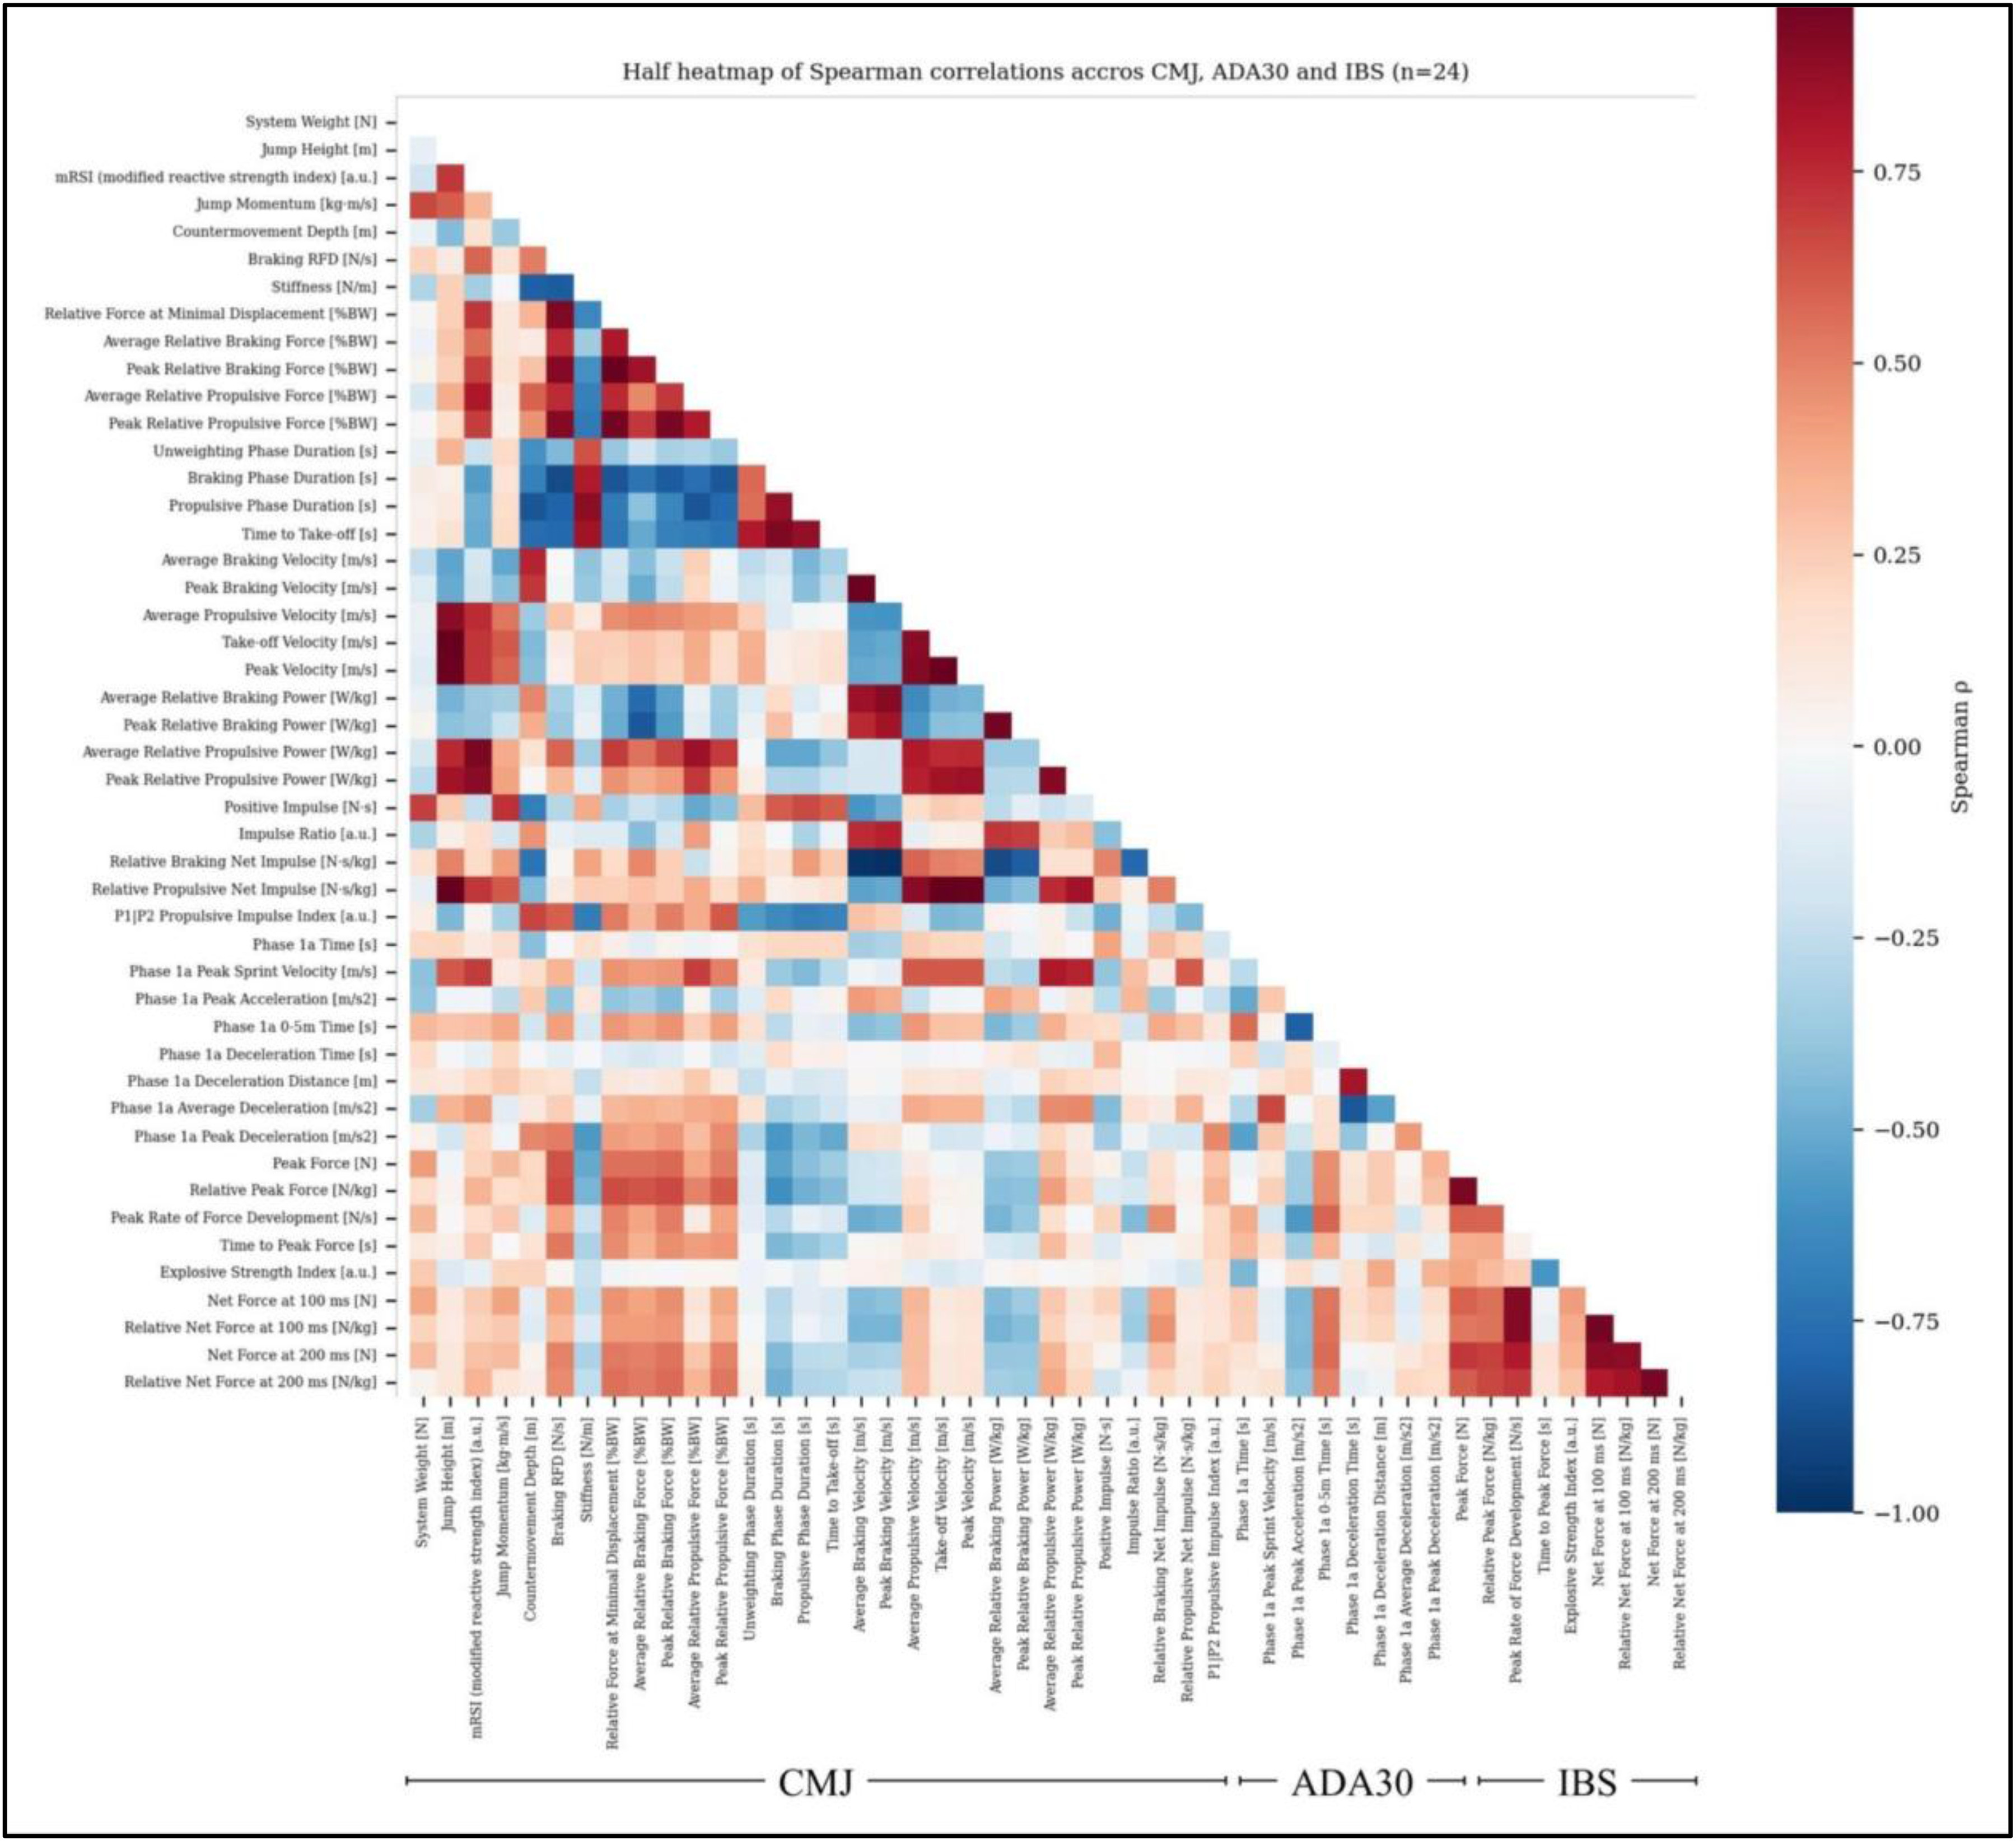
Heatmap of Spearman correlation coefficients (ρ) between CMJ, ADA30, and IBS variables (n = 24). Warm colors denote strong positive correlations, cool colors indicate negative relationships.
CMJ propulsive parameters and assisted peak sprint velocity
A distinct cluster of large-to-very-large positive relationships was identified between CMJ propulsive phase variables and ADA30 phase 1a peak sprint velocity. Phase 1a peak sprint velocity showed very large positive correlations with CMJ average relative propulsive power (ρ = 0.807; q = 0.001) and CMJ peak relative propulsive power (ρ = 0.771; q = 0.003). Several other CMJ variables—mRSI, jump height, average relative propulsive force, take-off velocity, peak velocity, average propulsive velocity, and relative propulsive net impulse—also showed large positive correlations with phase 1a peak sprint velocity (ρ ≈ 0.61–0.70; q < 0.06; Table 1). A representative examples of this trend are presented in Figures 3 and 4.
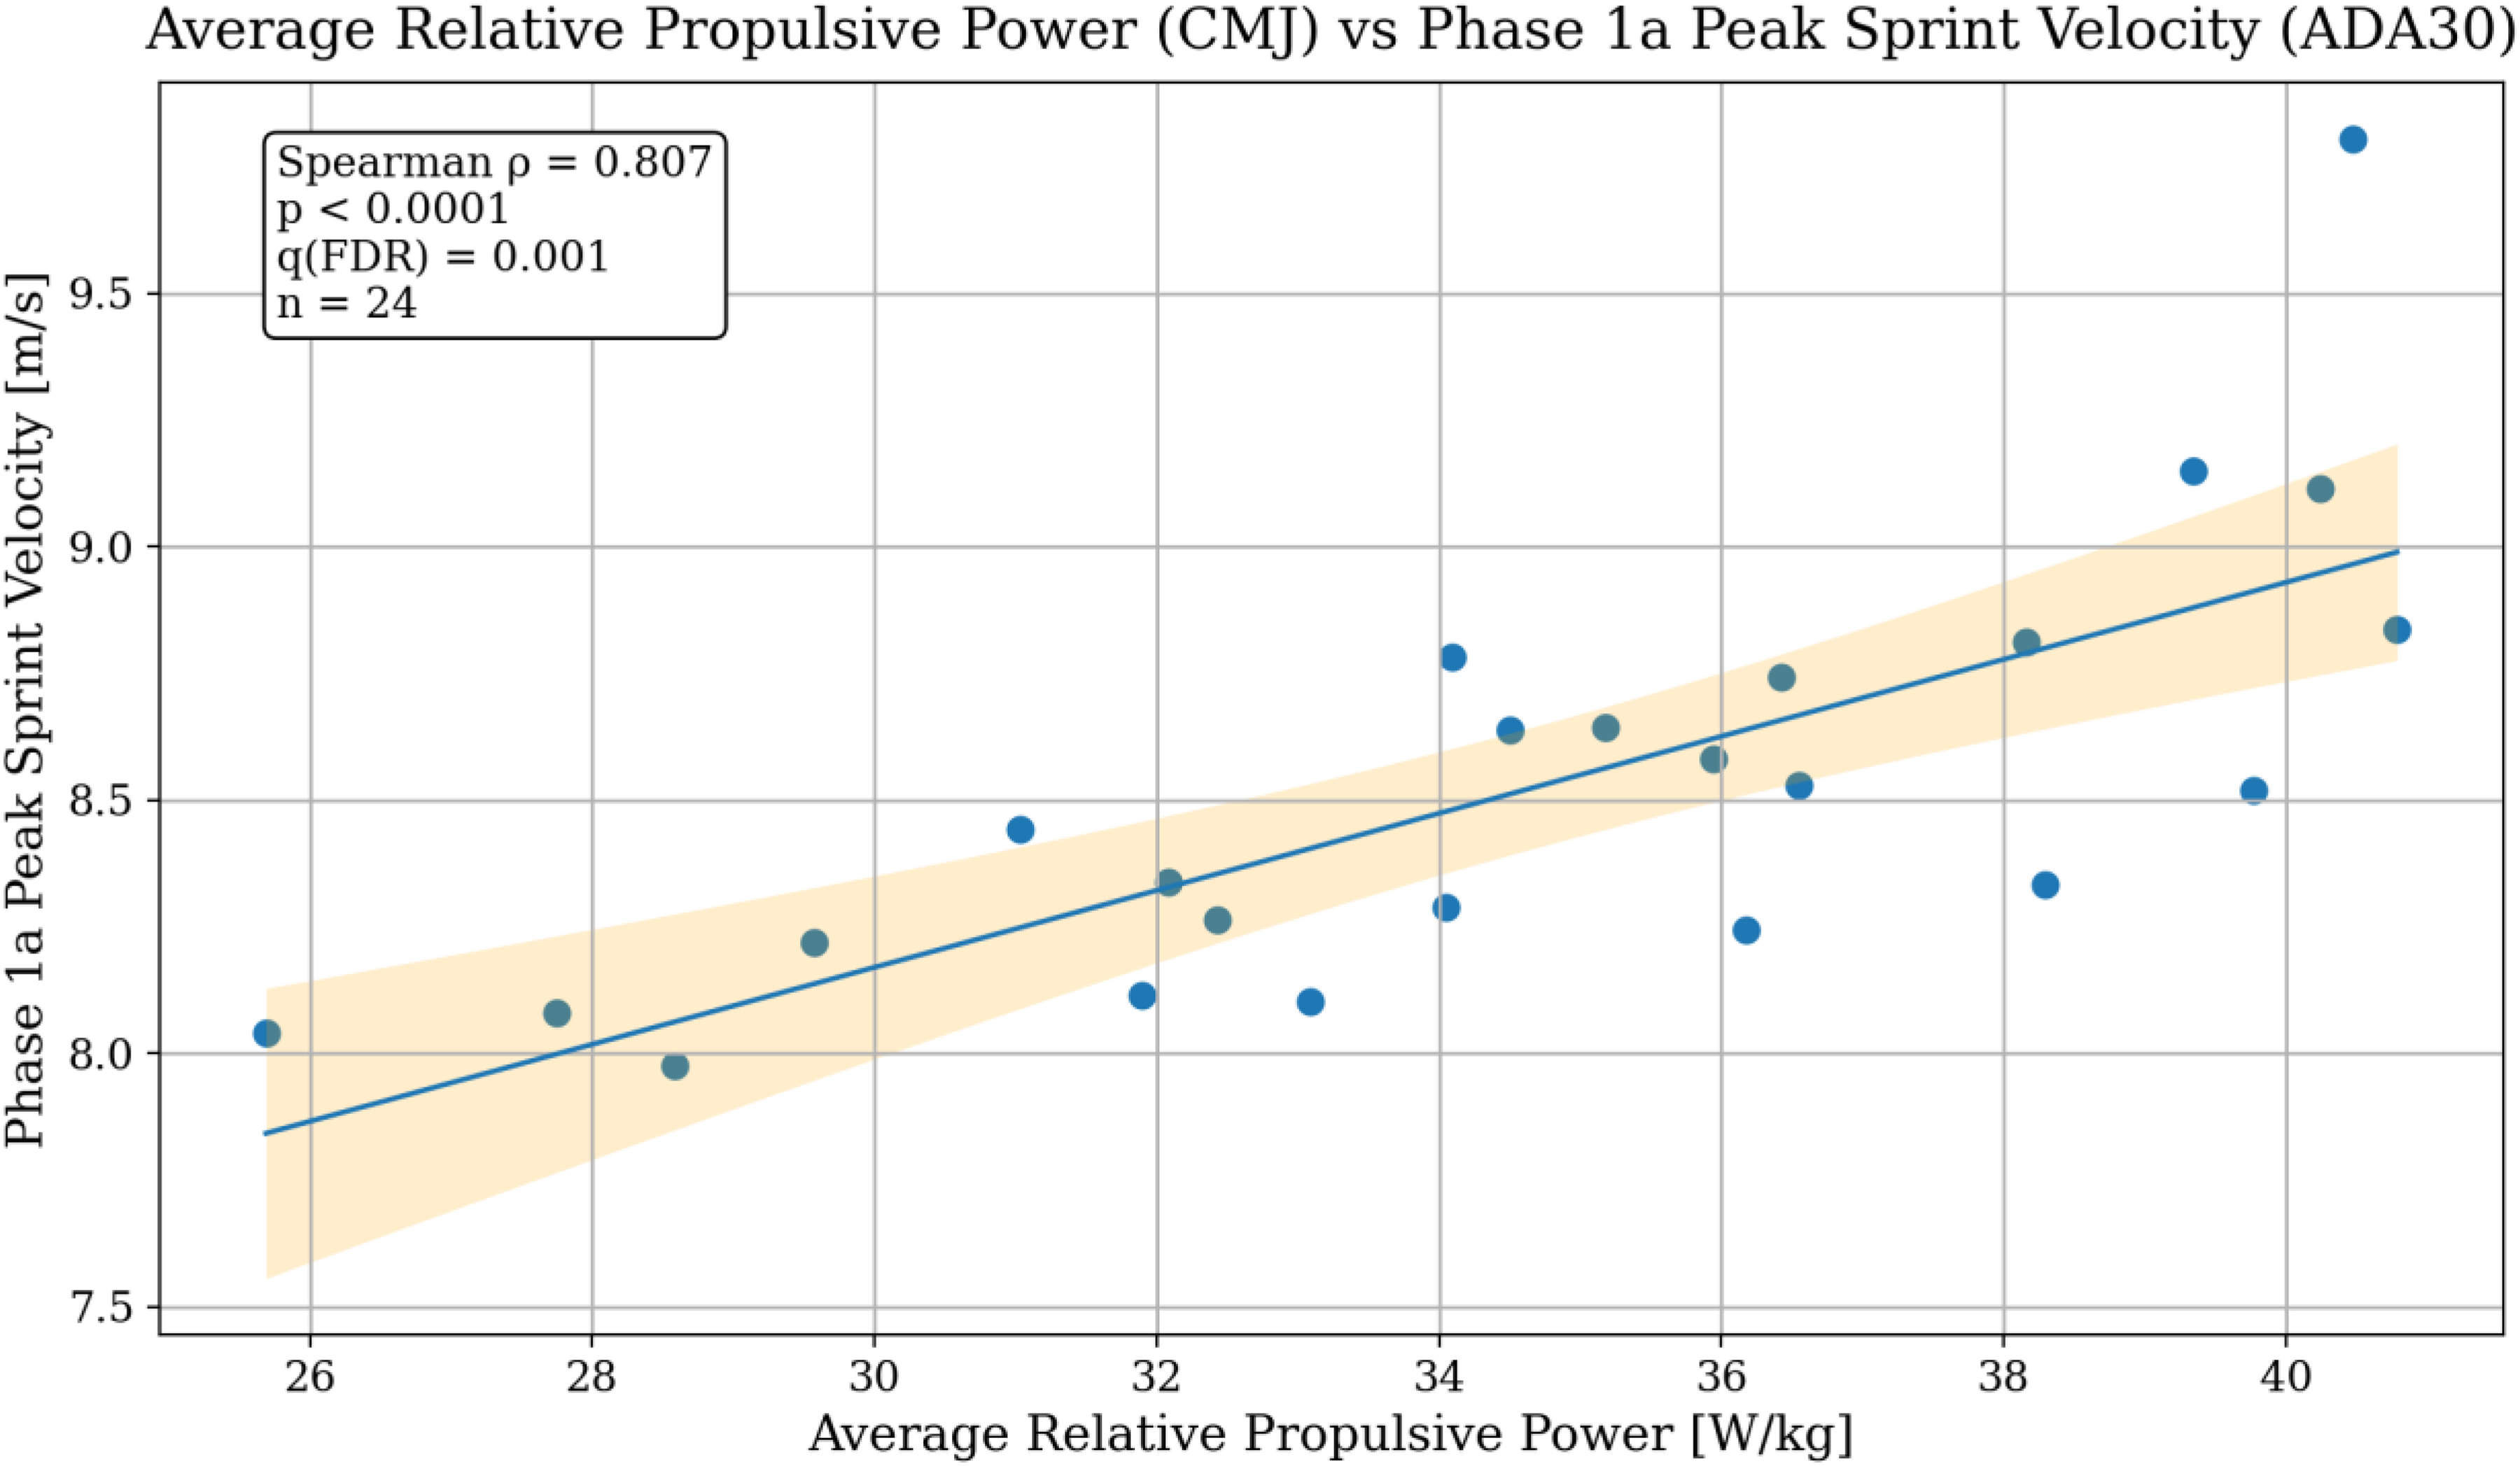
Scatterplot showing the relationship between CMJ average relative propulsive power and ADA30 phase 1a peak sprint velocity. A very large positive correlation is present (ρ = 0.807, q = 0.001), indicating that greater propulsive output in the CMJ is associated with higher assisted sprint velocity.
CMJ braking parameters, horizontal braking, and maximum force in the IBS
Significant relationships were observed between CMJ braking phase metrics and IBS isometric strength expression, as well as braking-related variables in the ADA30 task. Peak/average relative braking force, braking RFD, relative force at minimum displacement exhibited large positive correlations with IBS relative peak force (ρ ≈ 0.63–0.66; q < 0.06; Table 1). Braking phase duration was negatively correlated with both IBS relative peak force (ρ = –0.613; q = 0.060) and phase 1a maximal deceleration (ρ = –0.580; q = 0.095). CMJ stiffness was also negatively correlated with phase 1a maximal deceleration (ρ = –0.572; q = 0.100).
Isometric RFD and initial acceleration (0–5 m)
IBS peak RFD was associated with early phase 1a acceleration metrics. Specifically, peak RFD was positively correlated with phase 1a 0–5 m time (ρ = 0.582; q = 0.095, large) and negatively correlated with phase 1a peak acceleration (ρ = –0.570; q = 0.100, large; Table 1). Figure 5 illustrates these relationships.
All significant inter-test correlations with at least a large effect size (ρ ≥ 0.5) are additionally illustrated in Figure 5, providing a graphical complement to the data in Table 1.
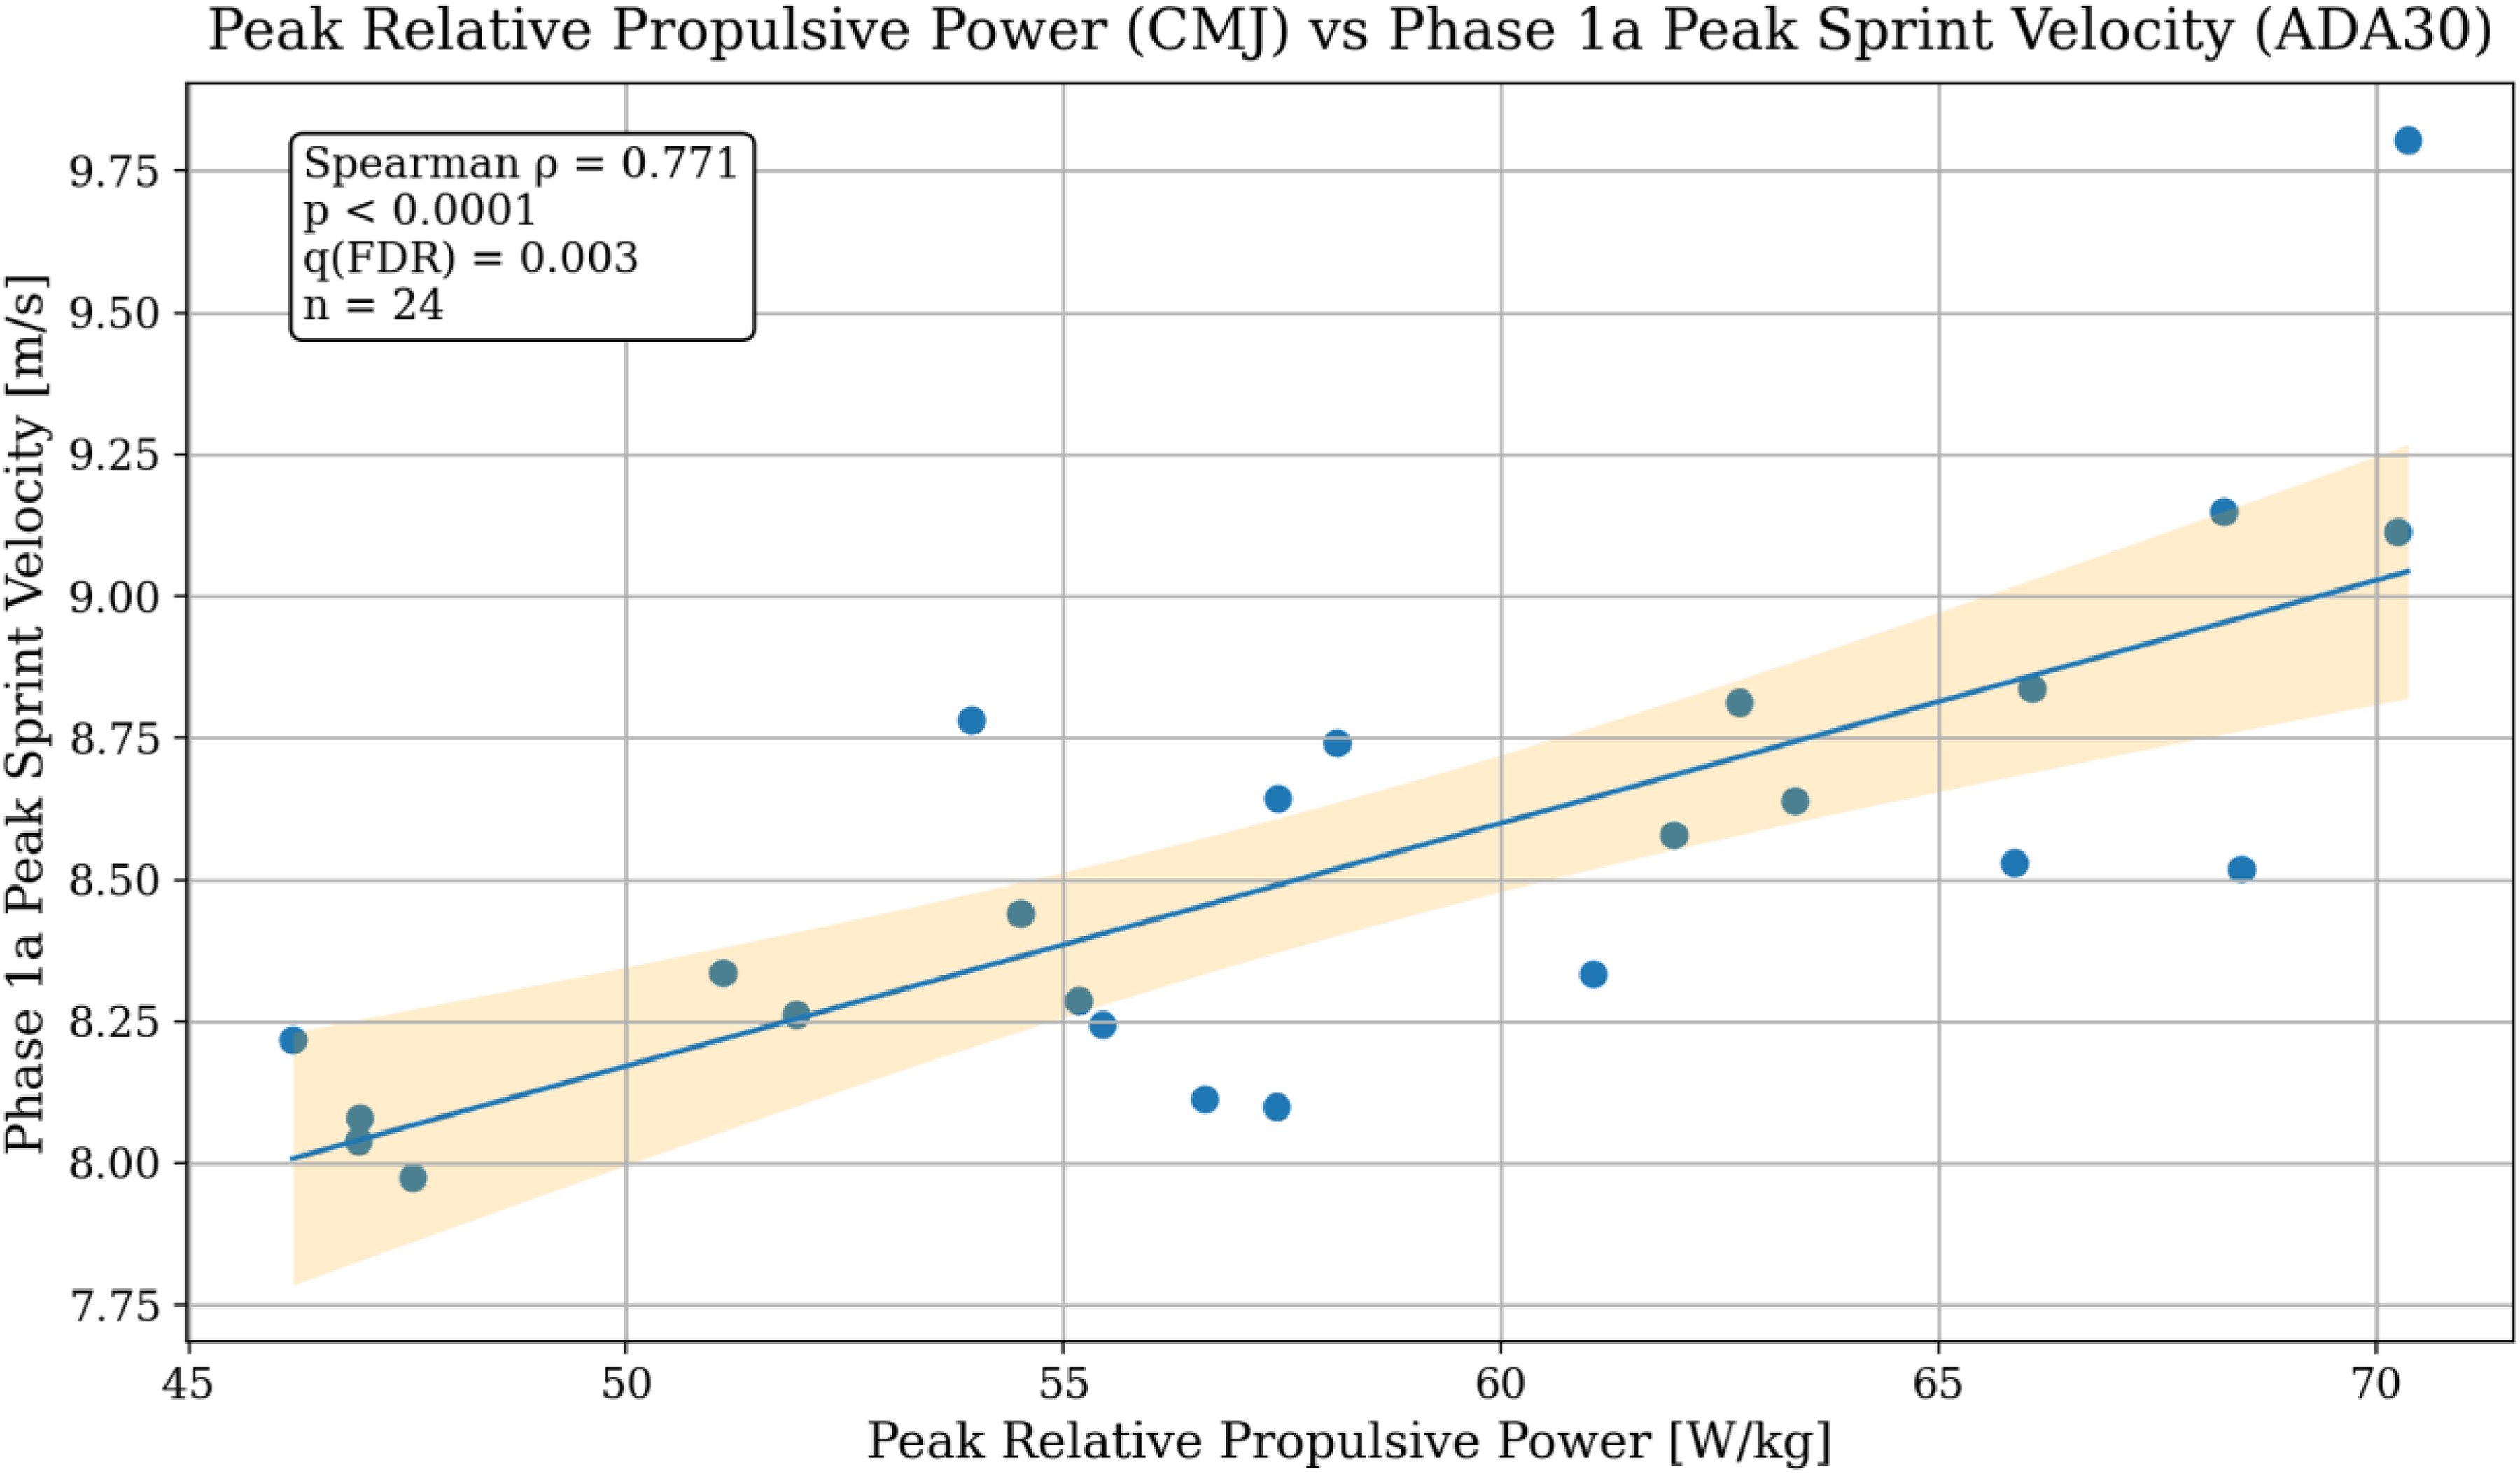
Scatterplot showing the relationship between CMJ peak relative propulsive power and ADA30 phase 1a peak sprint velocity. A very large positive correlation is present (ρ = 0.771, q = 0.003), indicating that greater propulsive output in the CMJ is associated with higher assisted sprint velocity.
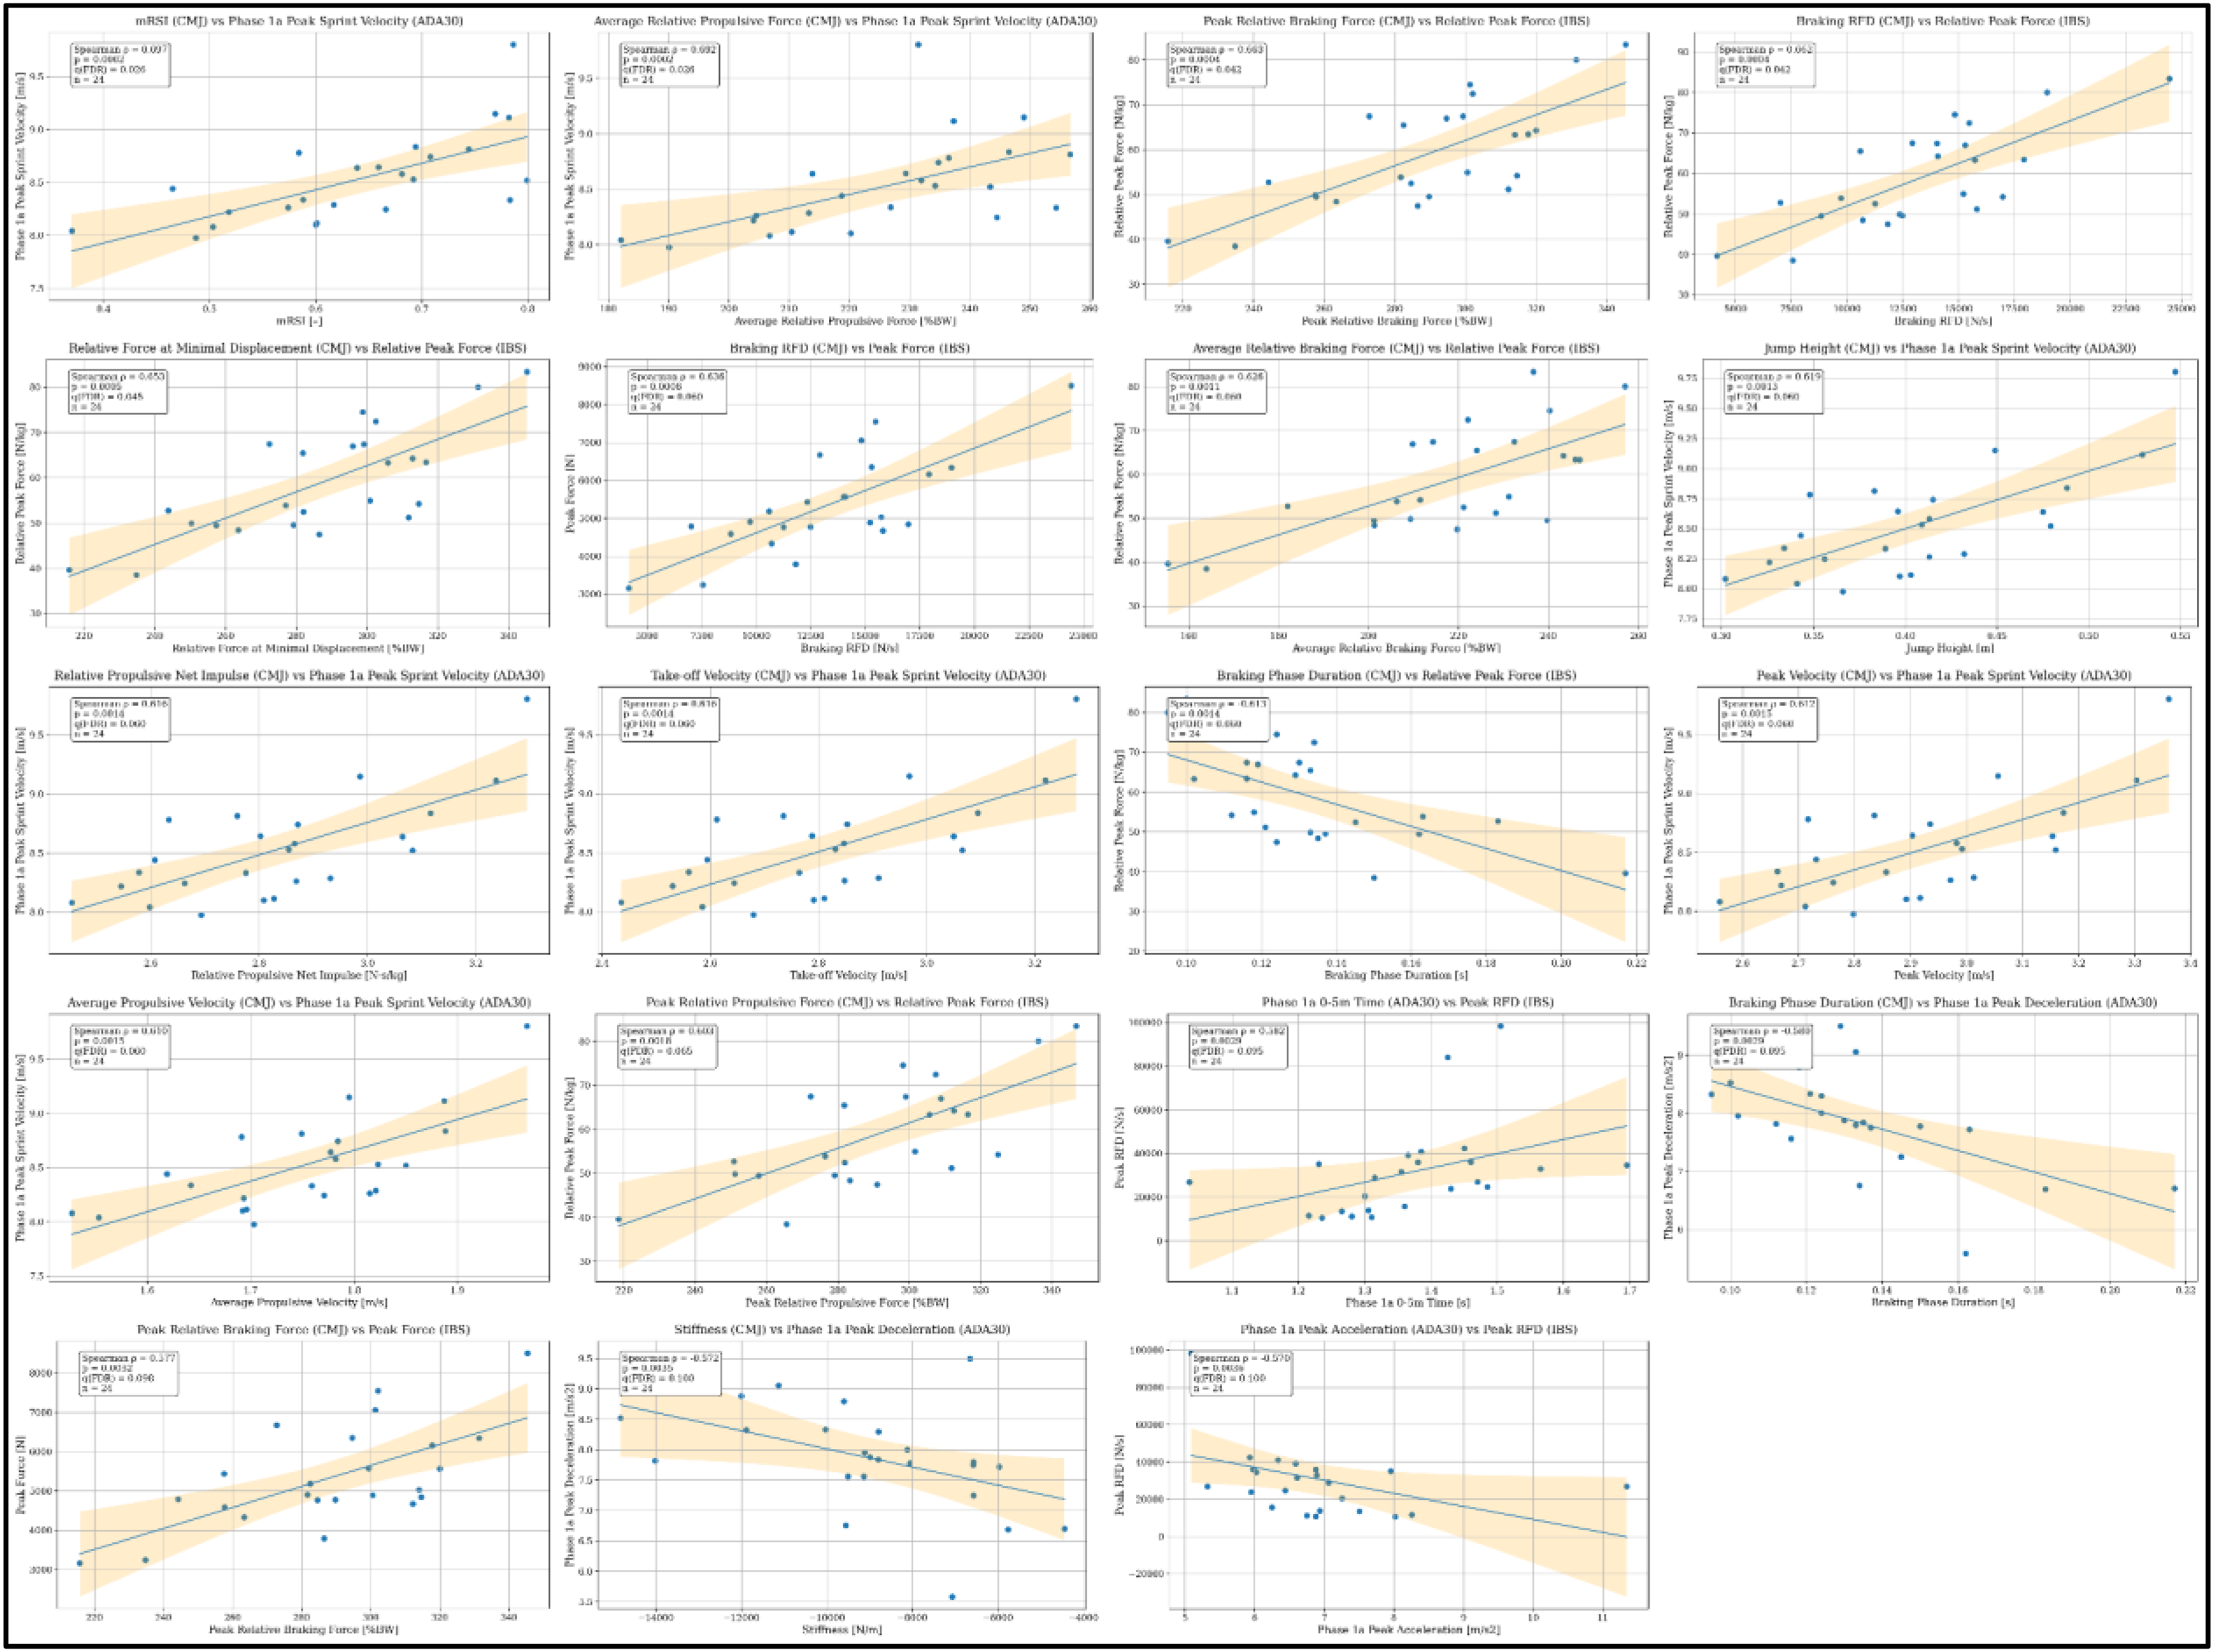
Scatter plots of all remaining large cross-test correlations between CMJ, ADA30 (phase 1a), and IBS variables.
Discussion
This study examined the interrelationships between CMJ force–time metrics, ADA30 outputs, and IBS force production characteristics in semi-professional American football players. The principal findings were that: (1) CMJ propulsive metrics were strongly associated with assisted peak sprint velocity; (2) CMJ braking phase metrics aligned closely with IBS force measures and, to a lesser extent, with horizontal deceleration; and (3) IBS peak RFD demonstrated complex, partly counterintuitive associations with early assisted acceleration metrics. These three tests were deliberately selected as complementary components of a broader neuromuscular profiling battery. While isolated results from any single task do not provide a complete picture of an athlete's profile, the present findings suggest that the combined use of CMJ, ADA30 and IBS may offer a repeatable, long-term mechanical assessment framework for sports with a substantial locomotive component.
CMJ propulsive metrics and assisted peak sprint velocity
The strongest and most coherent cluster of associations linked CMJ propulsive metrics to phase 1a peak sprint velocity under assisted conditions. Very large correlations were observed for average and peak relative propulsive power, and large correlations for mRSI, average relative propulsive force, jump height, take-off velocity, relative propulsive net impulse, peak velocity, and average propulsive velocity. Collectively, these relationships suggest that higher force-generating capacity in the vertical propulsive phase of the CMJ is associated with achieving the higher phase 1a peak sprint velocity under assisted conditions. Given that CMJ jump height is calculated from take-off velocity, and take-off velocity is determined by net vertical impulse, variables such as relative propulsive net impulse and take-off velocity largely represent different expressions of the same impulse–momentum construct. Therefore, reporting the entire continuum of impulse–momentum-related variables may offer limited additional interpretive value beyond jump height itself.
These effect sizes are comparable to, or slightly higher than, those reported between CMJ force–time metrics and maximal or near-maximal sprint speeds in footballers, sprinters, and rowing athletes.7–10,43 Mechanistically, CMJ propulsive force and power may relate to sprint velocity because both tasks require rapid production of large vertical support forces; while horizontal force orientation remains critical during acceleration, the vertical component dominates the ground reaction force profile during upright high-speed sprinting and has been linked to maximal running speed. 44
It is important to note that sprinting in this study was assisted, which alters absolute mechanical demands and segmental kinematics relative to unassisted sprinting.30,32,34 Nevertheless, the strong CMJ–peak sprint velocity relationships suggest that CMJ propulsive metrics may be used as practical proxies for high-speed running potential in similar populations, especially where MRDs are unavailable or frequent maximal sprint testing is constrained by scheduling or injury risk considerations. However, these between-athlete correlations should not be taken to imply that CMJ and sprint measures are interchangeable or that CMJ can replace direct sprint testing; longitudinal data are still needed to establish whether within-athlete changes in CMJ meaningfully track changes in sprint performance over time. These findings should not be interpreted as direct evidence that CMJ propulsive metrics predict unassisted maximal sprint velocity, but they are consistent with existing literature and warrant further corroboration.
Vertical braking behaviour, horizontal deceleration, and isometric strength
A second important cluster of findings involved CMJ braking phase metrics, ADA30 horizontal deceleration, and IBS force expression. Braking phase duration and stiffness both showed large negative correlations with phase 1a peak deceleration. Given that higher peak deceleration represents greater instantaneous braking magnitude, and shorter braking phase duration and higher stiffness magnitude are generally interpreted as favourable, these results imply that athletes who decelerate more intensely in the horizontal plane tend to present a short, stiff braking phase during CMJ. This may represent a novel contribution of the present study, as it raises the possibility that braking capacities are at least partly unified across tasks despite differences in the predominant direction of force application.
This interpretation aligns with the conceptual “Braking Performance Framework”, which emphasises the ability to tolerate and generate high forces within short time windows during deceleration tasks.11–13,33 Although authors did not directly measure ground reaction forces during horizontal deceleration, the relationships observed between CMJ braking characteristics and MRD-derived assisted deceleration outputs lend support to the idea that vertical jump testing can provide meaningful information about multi-faceted neuromuscular capacity.
From the authors’ perspective, this pattern contrasts with earlier work in mixed-sports university athletes, where CMJ propulsive variables were the primary discriminators between groups above versus below the median for horizontal deceleration ability, with jump-derived braking phase metrics playing a more limited role. These earlier findings may be, at least in part, population- or context-specific, reflecting the characteristics of a heterogeneous university sample with varied and often relatively limited exposure to systematic strength and conditioning. In many applied environments, enhanced propulsive capacities tend to differentiate athletes with substantial, long-term engagement in structured physical preparation from those with minimal training history, particularly in developmental cohorts drawn from multiple sports. 13 We suspect that higher training status—particularly within a professional strength and conditioning regime emphasising comprehensive eccentric training—may be associated with a more specific and intuitive coupling between vertical and horizontal braking capacities.
The relationships between CMJ braking phase metrics and IBS force production were particularly coherent. Relative peak force measured in IBS showed large positive correlations with several CMJ braking variables (peak/average relative braking force, braking RFD, and relative force at minimum displacement) and a large negative correlation with braking phase duration. These results are consistent with IMTP-based literature showing that higher maximal isometric force and RFD are associated with greater CMJ braking and propulsive outputs and better locomotive performance.10,18–20,22,23
From a practical standpoint, these findings suggest that IBS testing in a belt squat configuration may serve as a viable alternative to IMTP for profiling lower-limb force capacities that underpin vertical braking behaviour, and by extension, certain aspects of horizontal deceleration ability. Additionally, IBS has several applied advantages: grip is not limiting, set-up is relatively rapid, the position aligns closely with frequently prescribed squat variations, and loading is largely localised to the lower-body.
Isometric explosiveness and early assisted acceleration
The relationships between IBS peak RFD and early phase 1a acceleration metrics (0–5 m time and peak acceleration) were statistically large but directionally counterintuitive. Higher IBS peak RFD was associated with slightly longer (worse) 0–5 m time and lower measured peak acceleration under assisted conditions.
Several non-mutually exclusive explanations may be considered. First, under assisted conditions, a portion of horizontal acceleration is generated externally by the device. Athletes with greater isometric RFD may not need, or may not be able, to exploit their capacity in the same way as during unassisted or resisted sprinting.32,34 Second, athletes may adopt more conservative movement strategies to maintain stability at high assisted speeds, prioritising control over maximal horizontal push-off in the initial steps. Finally, with only twenty-four players, correlation estimates are susceptible to sampling variability, and some associations–especially those that are counterintuitive–may be specific to this cohort or protocol, as has been noted previously in small-sample strength-performance work.18,19
Overall, we view these RFD–acceleration findings as hypothesis-generating rather than definitive. They emphasise that isometric RFD measured in a belt squat position should not be assumed to directly reflect early horizontal acceleration capacity in an assisted sprinting context.
Practical implications for American football and related team sports
For practitioners working with American football skill/running positions, and potentially athletes in comparable roles in different team sports, these findings offer several tentative practical implications. CMJ propulsive metrics–particularly relative propulsive force, power, impulse, mRSI, jump height, and velocity–appear to provide useful but indirect proxy information about an athlete's ability to achieve high assisted running velocities. Monitoring these variables over time may therefore yield insights into changes in high-speed running potential, especially when direct sprint testing is constrained.7–9 CMJ braking phase characteristics—including braking phase duration, relative braking force, force at minimal displacement, stiffness, and braking RFD—appear to complement IBS force expression as potential indicators of braking-oriented neuromuscular capacity. Accordingly, athletes who display shorter braking phases, stiffer countermovement, and higher relative IBS peak force may possess a neuromuscular profile better suited to the intense deceleration demands of multidirectional field sports.11–13,33 At the same time, the complex and occasionally counterintuitive associations–particularly involving IBS peak RFD and early assisted acceleration–underline that no single measure can fully capture task-specific locomotive performance. Proxy metrics should therefore be interpreted within a broader framework that includes technical observation, positional role, fatigue state and tactical context. 15
Taken together, the present results support the concept of an integrated yet relatively lean monitoring battery combining: (1) vertical jumps, (2) assisted acceleration-deceleration tasks, and (3) simple, multi-joint isometric strength tests. These tools should be viewed as complementary sources of information rather than definitive stand-alone indicators. In this regard, proxy metrics remain simplifications of complex behaviours: their interpretation must always account for test context, technical execution and individual athlete characteristics, and should complement–rather than replace–direct assessments and broader performance monitoring. Practitioners are therefore encouraged to test their athletes across different environments and tasks to obtain the most robust, training-relevant insights. At present, the evidence base around proxy metrics is still at too early stage for coaches and practitioners to rely on them in isolation when making high-stakes programming decisions.
Limitations
This study involved a small sample of twenty-four semi-professional players, limiting statistical power and increasing susceptibility to sampling variability and correlation bias. Thus, the observed relationships may not generalise to elite or less experienced populations. Only two trials were collected for ADA30 and IBS, precluding a detailed assessment of within-session reliability, and cohort-specific reliability estimates were unavailable. An unassisted maximal sprint test was not included, preventing direct comparison between assisted metrics and traditional sprint performance measures.
The assisted sprint configuration (3 kg load, 14 m/s benchmark, NFW) likely altered running and braking mechanics relative to match-play conditions, reducing ecological validity, and brief velocity plateau before braking manoeuver may have influenced deceleration metrics. Additionally, the assisted load in the ADA30 test was applied as a fixed absolute value and was not normalised to athletes’ body mass.
All tests were performed within a single morning session, so cumulative fatigue may have affected later assessments, particularly IBS. Testing in sub-groups may also have introduced behavioural variability through imitation of teammates.
The ADA30 distance may be a protocol-specific limitation. Chen et al. (2024) 45 showed that 5 and 10 m sprint-stop tests are reliable and sensitive, while selected 20 m kinematic outcomes were less stable. Notably, authors suggest that high braking magnitudes can be achieved without substantially extending sprint distance, as average deceleration and horizontal braking force were not greater in the 20 m protocol. Therefore, ADA30 may have overemphasised high-velocity, high-momentum braking rather than efficiently assessing short-distance deceleration capacity.
Future recommendations
Future research should first seek to replicate and extend the present findings in larger samples, across different sports, positional groups, and competitive levels, to determine whether the observed interrelationships between CMJ, ADA30 and IBS metrics are robust or cohort-specific. Experimental designs should include unassisted high-intensity locomotion tests (e.g., recorded by radar-based/laser-based systems) and dedicated deceleration assessments with direct 3D ground reaction force measurements, which would not only anchor assisted running metrics against traditional performance markers but also provide a more detailed view of kinetic movement strategy, that is not accessible through conventional kinematic analyses based solely on displacement and time.
Longitudinal studies are warranted to track CMJ, ADA30 and IBS metrics over time across different seasonal phases, fatigue states and structured training blocks, while systematically manipulating training content (e.g., isolated sprint and deceleration work, isometric, eccentric or plyometric training). Such designs could enable researchers to identify which types and doses of training most effectively enhance key sport-specific locomotion manoeuvres, and to test whether the proxy metrics proposed here and elsewhere actually track performance in the target environment–quantified, for example, using GPS-derived indicators of high-speed running, acceleration and deceleration–rather than merely reflecting capacity in isolated testing tasks. In parallel, future work should examine how chronic training history and long-term athletic development influence the magnitude, reliability and interpretability of these proxy metrics in different populations, with particular attention to CMJ braking phase metrics, which are often considered relatively unreliable.
Further research should also compare alternative isometric testing configurations (e.g., joint angles, cueing/feedback strategies and fixation options) against a range of task-specific locomotive outcomes to clarify how maximal, starting and explosive isometric force capacities map onto key actions. Together, these lines of inquiry may help refine both the selection and application of proxy metrics within monitoring systems designed for high-performance sport, while acknowledging the complexity and context dependence of locomotive performance.
Conclusions
In semi-professional American football players occupying running/skill positions, this exploratory study demonstrated several notable interrelationships between CMJ, ADA30 and IBS metrics. First, multiple CMJ propulsive variables showed large-to-very-large positive correlations with ADA30 assisted phase 1a peak sprint velocity supporting their use as proxy markers of high-velocity running capacity under assisted conditions. Second, CMJ braking metrics showed large positive associations with IBS force variables, whereas selected CMJ braking characteristics—particularly braking phase duration and stiffness—showed large negative associations with ADA30 phase 1a peak horizontal deceleration. Together, these findings suggest that practitioners may gain a clearer understanding of an athlete's horizontal braking capacity by examining CMJ braking metrics alongside IBS force–time data. Finally, although IBS peak RFD showed statistically significant but directionally counterintuitive associations with the early phase of assisted sprinting (0–5 m time and peak acceleration), these results should be considered hypothesis-generating, indicating that RFD measured isometrically in a belt squat position is not a simple, direct predictor of early horizontal acceleration capacity under assisted conditions.
Supplemental Material
sj-pdf-1-spo-10.1177_17479541261465888 - Supplemental material for Interrelationships between countermovement jump, assisted acceleration–deceleration, and isometric belt squat metrics in American football players - exploratory study
Supplemental material, sj-pdf-1-spo-10.1177_17479541261465888 for Interrelationships between countermovement jump, assisted acceleration–deceleration, and isometric belt squat metrics in American football players - exploratory study by Karol Kruczek, Kacper Gregorczyk, Tim Gabbett, Jason Lake and Michał Nowak in International Journal of Sports Science & Coaching
Footnotes

Ethical considerations
This study was conducted in accordance with the Declaration of Helsinki and received a positive opinion from the Research Ethics Committee at the Jan Długosz University in Częstochowa, Poland (Resolution No. KE-U/9/2026 of 19 January 2026).
Consent to participate
Before testing, all participants signed written informed consent to participate in the study and were informed that they could withdraw at any time without incurring any sporting or organizational consequences.
Consent for publication
Not applicable. This article does not contain any individually identifiable personal data, images, or videos of participants.
Author contributions
Funding
The authors received no financial support for the research, authorship, and/or publication of this article.
Declaration of conflicting interest
This study was conducted using the Hawkin Dynamics force plate system and associated software/cloud platform. One author serves/has served as a scientific consultant for Hawkin Dynamics. This relationship had no influence on the study design, data collection, data processing/analysis, interpretation of the results, or manuscript preparation. All other authors declare no conflicts of interest.
Data availability
Supplemental material
Supplemental materials for this article are available online.
References
Supplementary Material
Please find the following supplemental material available below.
For Open Access articles published under a Creative Commons License, all supplemental material carries the same license as the article it is associated with.
For non-Open Access articles published, all supplemental material carries a non-exclusive license, and permission requests for re-use of supplemental material or any part of supplemental material shall be sent directly to the copyright owner as specified in the copyright notice associated with the article.
