
Abstract
Cross-national comparisons of fear of crime have been gaining in popularity within the academic community, as they allow for the examination of both individual and country-level correlates of this phenomenon. Nevertheless, the role of perceived victimization risk in fostering fear of crime with respect to various country specifics is often neglected. Drawing on data from the European Social Survey Round 5 (ESS R5), the aim of this study is to explore the relationship between fear of crime and risk perception in the context of 23 European countries. Risk perception is positively correlated with fear of crime in all of the analysed countries, although the strength of the relationship differs. Contrary to expectations, countries with a higher victimization rate exhibit a weaker relationship between fear of crime and risk perception, while in countries with a lower victimization rate, risk perception plays a relatively important role in shaping fear of crime. No effect of unemployment rate, size of migrant population or income inequality was found in the data.
Introduction
In recent years, fear of crime has often been studied internationally using data from extensive social surveys such as the European Social Survey (see Hummelsheim et al., 2011; Reese, 2009; Semyonov et al., 2012; Vauclair and Bratanova, 2017; Visser et al., 2013) or nationally using data with a nested structure containing information about counties or other territorial units of a given country (Gaitán-Rossi and Shen, 2018; Hanslmaier, 2013). The main objective of such scientific studies is to explain fear of crime using a number of individual and contextual variables, which are considered to be the most plausible correlates of the mentioned phenomena.
In these studies, however, scholars usually analyse fear of crime without taking into account the respondent’s perceived victimization risk – something that has been revealed to be an important predictor of fear of crime and mediator between fear of crime and individual or social factors such as gender, victimization experience and social incivilities (Ferraro, 1995; Ferraro and LaGrange, 1987; Gainey et al., 2011; Rountree and Land, 1996). This omission is likely due to the fact that there is still no consensus on the definition of fear of crime and that both phenomena – that is, fear of crime and risk perception – have often been used interchangeably. While questions measuring the feeling of safety in one’s neighbourhood served as the most frequently used indicators of fear of crime at the beginning of research in this field, over time, questions explicitly measuring the intensity of worries about various criminal offences or frequency of fearful episodes have become more preferable in the academic community. Furthermore, ‘feeling of safety’ indicators are being employed as measures of risk perception; that is, the probability of victimization, rather than fear of crime itself (Doran and Burgess, 2012; Farrall et al., 2009; Ferraro and LaGrange, 1987; Gray et al., 2011; Hale, 1996; Warr, 2000).
Drawing on data from the European Social Survey Round 5 (ESS R5) conducted in 2010 and 2011, the present study therefore aims to explore the relationship between fear of crime and feeling of safety as an indicator of risk perception by analysing 23 of the European countries that participated in the survey. The results of the analysis suggest that the strength of the relationship between the mentioned phenomena varies across the analysed countries and that these differences can partly be explained by the victimization rate in a given country.
Theoretical Background
Explanations of fear of crime at an individual level
At an individual level, we usually concentrate on victimization experience and individual vulnerability. The victimization perspective is based on the presumption that people who have become victims of crime fear crime to a greater extent than those who have no such experience (Akers et al., 1987; Farrall et al., 2009). Some studies, however, find only a weak or non-existent relationship between both variables (Ferraro, 1995; LaGrange et al., 1992; Wanner and Caputo, 1987), which gives rise to the so-called victimization paradox – that there are more people who fear crime than those who have been victimized in the past. One explanation for this paradox may be indirect victimization, which seems to be much more common than direct victimization, and is characterized by the individual knowing somebody (through direct contact or media; see Doran and Burgess, 2012; Hale, 1996) who has previously been victimized. Another explanation is individual vulnerability or sensitivity to risk. Generally, we consider two types of vulnerability – physical and social (Franklin et al., 2008; Skogan and Maxfield, 1981). In the first case, an individual is convinced that he or she can easily become a victim of physical assault, is not strong enough to resist a potential attack and that subsequent recovery would be painful and difficult. Social vulnerability, on the other hand, arises from the individual’s position in society. An increased risk of victimization, and hence higher fear of crime, is generally felt by those who cannot afford to secure their property against theft and whose economic situation does not allow for quick compensation for the losses caused by victimization. It is therefore evident that the theory of vulnerability mainly pertains to women, the elderly and people with low socio-economic status.
Gender is found to be the most consistent correlate of fear of crime. According to a number of studies (Akers et al., 1987; Ferraro, 1995; Jackson and Stafford, 2009; LaGrange and Ferraro, 1989; Warr, 1984), women declare higher levels of fear than men, which is usually explained by their higher sensitivity to risk and also by the fact that they perceive the consequences of potential victimization to be more serious than men, who tend to underestimate both the risk of victimization and its consequences (Agnew, 1985; Gilchrist et al., 1998; Sacco, 1990; Sutton and Farrall, 2005). Similarly, older people and those with lower degrees of education or those belonging to an ethnic minority – that is, people who are likely to have lower social status – are found to be more sensitive to risk and are prone to fear crime (Akers et al., 1987; Jackson and Stafford, 2009; Warr, 1984). The results, however, are not always as consistent as in the case of gender – some studies report a non-linear relationship between fear of crime and age, while some find a negative relationship between this phenomenon and age, education or ethnicity (Akers et al., 1987; Ferraro, 1995; Ferraro and LaGrange, 1992; Gainey et al., 2011; Jackson, 2009; LaGrange and Ferraro, 1989).
In addition to the aforementioned factors, the relationship between fear of crime and one’s living environment is also of interest. According to Lewis and Salem (1986) or Skogan and Maxfield (1981), fear of crime is a result of the disruption of social control in an area rather than individual experience with criminality. People thus tend to declare higher fear of crime in areas which are associated with a higher incidence of physical (vandalism, broken windows, dilapidated buildings and abandoned cars, trash and litter) or social (beggars, rowdy youth, inconsiderate neighbours) incivilities (LaGrange et al., 1992). In a similar vein, fear of crime is often associated with large cities and agglomerations, while in rural areas people feel rather safe and usually declare a minimal fear of crime (Sacco, 1985).
Fear of crime, risk perception and their mutual relationship
The conceptualization and operationalization of fear of crime, and consequently perceived victimization risk, has long been a subject of debate. As Gray et al. (2011: 4) state, fear of crime is ‘a slippery phenomenon’ that lacks clarity and poses many methodological problems. Similarly, Farrall et al. (1997: 658) admit that our understanding of fear of crime is largely based on the way it is measured rather than the way it is.
Ferraro and LaGrange (1987) first pointed out the necessity to distinguish different types of perception when analysing fear of crime and perceived victimization risk. While fear of crime, defined as ‘a negative emotional reaction to crime or the symbols associated with crime’ (Ferraro, 1995: 23; Ferraro and LaGrange, 1987: 72), can be categorized as an affective perception, evaluations of risk reflect our judgement and are thus grouped with cognitive perceptions. Based on their findings, the authors advise other researchers to explicitly ask respondents ‘how worried’ they are about different criminal offences in their everyday life. In line with these recommendations, studies like those by Callanan (2012), Ferraro (1995), LaGrange and Ferraro (1989), May et al. (2009) or large-scale representative sample surveys such as the British Crime Survey (BCS) use batteries of questions measuring fear of a relatively wide range of property and violent offences in order to capture the overall intensity of people’s fear of crime.
Nevertheless, Farrall and his colleagues (Farrall, 2004; Farrall and Gadd, 2004; Farrall et al., 1997) investigated the fear of crime ‘intensity’ measures by employing both a quantitative and qualitative approach and found that these indicators are likely to yield exaggerated levels of fear. Indeed, the authors looked back to results from different studies on fear of crime and were not willing to accept that a significant part of the population is fearful. They thus suggested concentrating on the frequency of fearful experiences (alternatively events (Hough, 2004) or episodes (Gray et al., 2008)) in the previous year rather than on the extent to which people fear crime in general, and employed a new set of indicators in light of this. The results of their analyses, for example, showed that approximately one-third of respondents (37 per cent) were worried about victimization in the previous year, but only less than one respondent out of 10 (8 per cent) was often and very fearful (Farrall and Gadd, 2004). It thus seems that the frequency with which respondents experience fear is relatively low. Similar findings were also reported by Gray et al. (2008), who compared ‘old intensity’ and ‘new frequency’ questions on fear of crime in BCS 2003/2004, or Farrall et al. (2009). In this regard, Hough (2004) or Jackson (2004) came to the conclusion that while questions on the frequency of fear of crime measure daily fearful experiences, ‘worry about’ indicators capture more general values or attitudes – fearfulness thus refers to a mental event while anxiety or worries represent mental states (Hough, 2004).
As already mentioned, Ferraro and LaGrange (1987) proposed that perceived victimization risk is based on cognition and can thus be defined as a subjective assessment of the probability or likelihood of future victimization (Ferraro, 1995). They, however, also asserted that risk perception can be equally well measured by asking respondents how safe they feel in a particular neighbourhood (see also Rountree and Land, 1996). In accordance with these assumptions, Loewenstein et al. (2001) or Slovic et al. (2004) (see also Jackson, 2006; Slovic and Peters, 2006) acknowledge that risk perception can be understood in two fundamental ways – as a cognitive rational decision based on probability calculus and formal logic or as a predominantly intuitive and automatic feeling. Moreover, Slovic et al. (2004: 311) explicitly define risk perception as ‘the feeling that tells us whether it is safe to walk down this dark street’. By the same token, Mesch (2000: 54) states that risk perception refers to ‘the judgement of risk and assessment of safety in the immediate surrounding area’.
Since there are essentially two approaches in understanding risk perception, there are also two main approaches in measuring it. For example, Ferraro (1995), Ferraro and LaGrange (1992) and LaGrange et al. (1992) created a battery of questions asking respondents to rate their likelihood of becoming victim to the same property and violent criminal offences which the authors used to measure fear of crime (see above). Similarly, in studies by Callanan (2012) and May et al. (2009), risk perception is measured as the likelihood of becoming victim to seven different crimes.
On the other hand, there are a number of studies which consider risk perception to be an assesment or feeling of safety. Shippee (2012: 126) uses two questions in order to measure risk perception, one of which asks respondents to agree or disagree with the claim that ‘The neighourhood is safe’. Earlier, Kanan and Pruitt (2002: 533) included the more conventional questions ‘how respondents rate their neighbourhood in terms of personal safety’ and ‘how safe respondents feel out alone in the neighbourhood at night’. The latter was also consireded as an indicator of risk perception in the study by Gainey et al. (2011: 127). Finally, Franklin et al. (2008: 210) measure risk perception using a question originally incorporated in the National Crime Victimization Survey ‘How safe would you feel walking alone during the day [night] in the area where you live?’
Based on these studies, we believe that the ‘feeling of safety’ indicator captures individual risk perception and we thus employ the question ‘How safe do you – or would you – feel walking alone in this area after dark?’ – included in the data used in our subsequent analysis – as an indicator of perceived victimization risk (see below). In line with the original work by Ferraro and LaGrange (1987: 76) we thus argue that the question on the feeling of safety: is not an emotional reaction to crime, but rather a judgment about the likelihood of criminal victimization for the individual. A person who says he or she would not feel very safe may not be afraid at all, but simply aware of the relative risk.
Regardless of the methodological issues associated with the measurement of fear of crime and risk perception, the relationship between these phenomena is very well established and has been confirmed by a number of studies (Ferraro, 1995; Gainey et al., 2011; LaGrange et al., 1992; Rountree and Land, 1996; Warr, 1984; Warr and Stafford, 1983). Those who perceive their victimization risk to be higher fear crime to a greater extent than those who do not find themselves at risk of becoming a victim of crime. According to Ferraro (1995) and LaGrange et al. (1992), the perceived victimization risk substantially increases fear of crime and mediates the effect of individual (e.g. gender, age, victimization, etc.) and social (e.g. social disorganization and cohesion, neighbourhood incivilities, etc.) factors. In the same regard, a strong relationship between fear of crime and risk perception as well as the mediating effect of risk perception was also confirmed by Gainey et al. (2011), and although Wyant (2008) earlier came to the conclusion that the effect of social incivilities does not have to be entirely moderated by the perceived victimization risk, his data suggest that risk perception remains an important correlate of fear of crime.
Explanations of fear of crime at a country level
When examining fear of crime across countries – that is, with respect to different cultural and social backgrounds – a number of contextual variables are usually considered, with crime or victimization rate, unemployment rate, size of migrant population and income inequality being the most frequently used in analysis (Reese, 2009; Vauclair and Bratanova, 2017; Visser et al., 2013). It is, however, quite difficult to arrive at a conclusion regarding their significance since some studies use the question on feeling of safety – that is, risk perception – as a proxy for the indicator of fear of crime. For example, Hummelsheim et al. (2011) report slight explanatory power of registered crime and victimization rate as well as income inequality on the feeling of safety, while the unemployment rate explains about one-third of country-level variability. It is, however, benefits in kind for families and children, expenditure on education, employment rate and expenditure on disability that rank among the most influential country-level factors. On the contrary, Vauclair and Bratanova (2017), who computed an overall index of fear of crime by averaging the scores of three variables, two of which measured respondents’ worries of their home being burgled and becoming victim to a violent crime and the third focusing on feeling of safety, found income inequality to be an important predictor of fear of crime, despite the fact that the total crime rate per country, Human Development Index (HDI, viz. Vauclair and Bratanova, 2017) and proportion of ethnic minorities were also controlled for. An interesting study is one by Visser et al. (2013), who examined individual and country-level factors influencing both fear of crime and feeling of safety separately. While fear of crime was primarily fostered by victimization rate, feeling of safety was strongly associated with the level of social protection in a given country, which is in accordance with the previously mentioned study by Hummelsheim et al. (2011). Unemployment rate and size of migrant population however proved to be non-significant in both cases.
With respect to the relationship between fear of crime and crime or victimization rate, existing research confirms that fear of crime is higher in areas with a higher number of victims or officially registered offences (e.g. Hanslmaier, 2013; Visser et al., 2013). Nevertheless, Ferraro (1995) and Miethe and Lee (1984) have already pointed out that this is inherently a rather complex relationship. They found that criminality is likely to influence fear of crime indirectly. In other words, its effect on fear of crime can be partly mediated by other variables such as perceived victimization risk (see also Farrall et al., 2009). Similarly, Lorenc et al. (2012) argue that a highly criminogenic residential environment can foster an individual’s perceived victimization risk, which in turn heightens the individual’s fear of crime.
Research Hypotheses
Drawing on previous research which discusses the important role of perceived victimization risk in predicting individual fear of crime, and with respect to the differences in cultural and social backgrounds across Europe, the aim of the present study is to explore the relationship between risk perception and fear of crime while taking into account different individual and country-level characteristics. We thus postulate the following hypotheses:
Hypothesis 1: There is a relatively strong relationship between fear of crime and risk perception in the sense that people who declare a higher perceived victimization risk fear crime to a greater extent than those who find it to be relatively low.
Hypothesis 2: Although there is a positive relationship between fear of crime and risk perception, the strength of the relationship varies by country.
Hypothesis 3: Higher levels of fear of crime are associated with higher victimization rates while the effect of other country-level characteristics is negligible.
Hypothesis 4: The differences in the strength of the fear of crime–risk perception link can be partly explained by variations in victimization rates across European countries.
Methods
Data
The study uses data from the fifth wave of the European Social Survey Round 5 (ESS R5), 1 which includes a set of indicators on fear of crime, feeling of safety and personal victimization, supplemented with country-level data from various official statistics. The ESS R5 is part of an ongoing European Social Survey (ESS) project that was first conducted in 2002/2003 and takes place every two years. These long-term comparative data meet the highest methodological standards and provide information on the values, attitudes, behaviour, socio-demographic and socio-structural characteristics of European nations (Jowell et al., 2007).
In all 23 of the selected countries 2 – Belgium, Bulgaria, Cyprus, Croatia, the Czech Republic, Germany, Denmark, Estonia, Spain, Finland, France, United Kingdom, Greece, Hungary, Switzerland, Ireland, Netherlands, Norway, Poland, Portugal, Sweden, Slovenia, Slovakia – data collection was conducted in late 2010 and early 2011. There was a total of 43,962 respondents included in the analysis, ranging from 1082 (Cyprus) to 3032 (Germany) respondents for each country. For the entire analysis, we applied a weight to control for the composition of the population in each country, that is, d-weight in the ESS R5 data.
Analytic strategy
In order to test our hypotheses, we used a multilevel modelling approach which allowed us to examine the influence of individual and country-level characteristics net of each other. First, to assess the nature of the relationship between risk perception and fear of crime, we estimated a model with individual-level variables. Second, we considered risk perception as a random effect to determine if the strength of the relationship between risk perception and fear of crime differed across the analysed countries. Third, we tested the influence of country-level variables on fear of crime. Finally, we included interaction terms between risk perception and country-level variables in order to ascertain if the variations in the strength of the fear of crime–risk perception link can partly be accounted for due to the different cultural and social backgrounds of the analysed European countries.
Indicators of fear of crime and risk perception
To measure fear of crime, we used two questions from our data: ‘How often, if at all, do you worry about your home being burgled?’ and ‘How often, if at all, do you worry about becoming a victim of violent crime?’ With these indicators, we captured the frequency of fearful episodes that respondents experience (Farrall, 2004; Farrall and Gadd, 2004; Farrall et al., 1997) rather than the intensity of worries about different criminal offences that are commonly used, for example, in BCS questionnaires (Gray et al., 2008).
A four-item response scale was used ranging from all or most of the time (coded ‘1’), some of the time (coded ‘2’), just occasionally (coded ‘3’) to never (‘4’). For the sake of easier interpretation however, we inverted the scales so that the category all or most of the time equals ‘4’. Subsequently, the overall index of fear of crime was computed as a mean of the two mentioned variables (Cronbach’s alpha = 0.73).
With respect to a number of previous studies focusing on the fear of crime–risk perception link (e.g. Ferraro, 1995; Ferraro and LaGrange, 1987; Gainey et al., 2011; Rountree and Land, 1996), we used the question ‘How safe do you – or would you – feel walking alone in this area 3 after dark? Do – or would – you feel…’, with response categories ‘1’ = very safe, ‘2’ = safe, ‘3’ = unsafe, ‘4’ = very unsafe, as an indicator of risk perception in this study.
Means of fear of crime and risk perception as well as associations between these variables for all of the analysed countries are presented in Table 1. In general, fear of crime across European countries was found to be rather low. The highest level of fear of crime was found in Greece (2.5), the lowest in Croatia (1.4). In some countries we can observe relatively significant differences in the levels of fear of crime and risk perception. For example, fear of crime in the Czech Republic is relatively low although its inhabitants feel rather unsafe in comparison with other countries. The opposite can be found in the case of Finland, which, after Norway and Denmark, ranks among the safest countries, although the average level of fear of crime is higher than we might expect and thus places Finns in the second half of the chart. Finally, associations between fear of crime and risk perception are presented ranging from 0.30 for Finland and 0.61 for Bulgaria.
Fear of crime and risk perception by country.
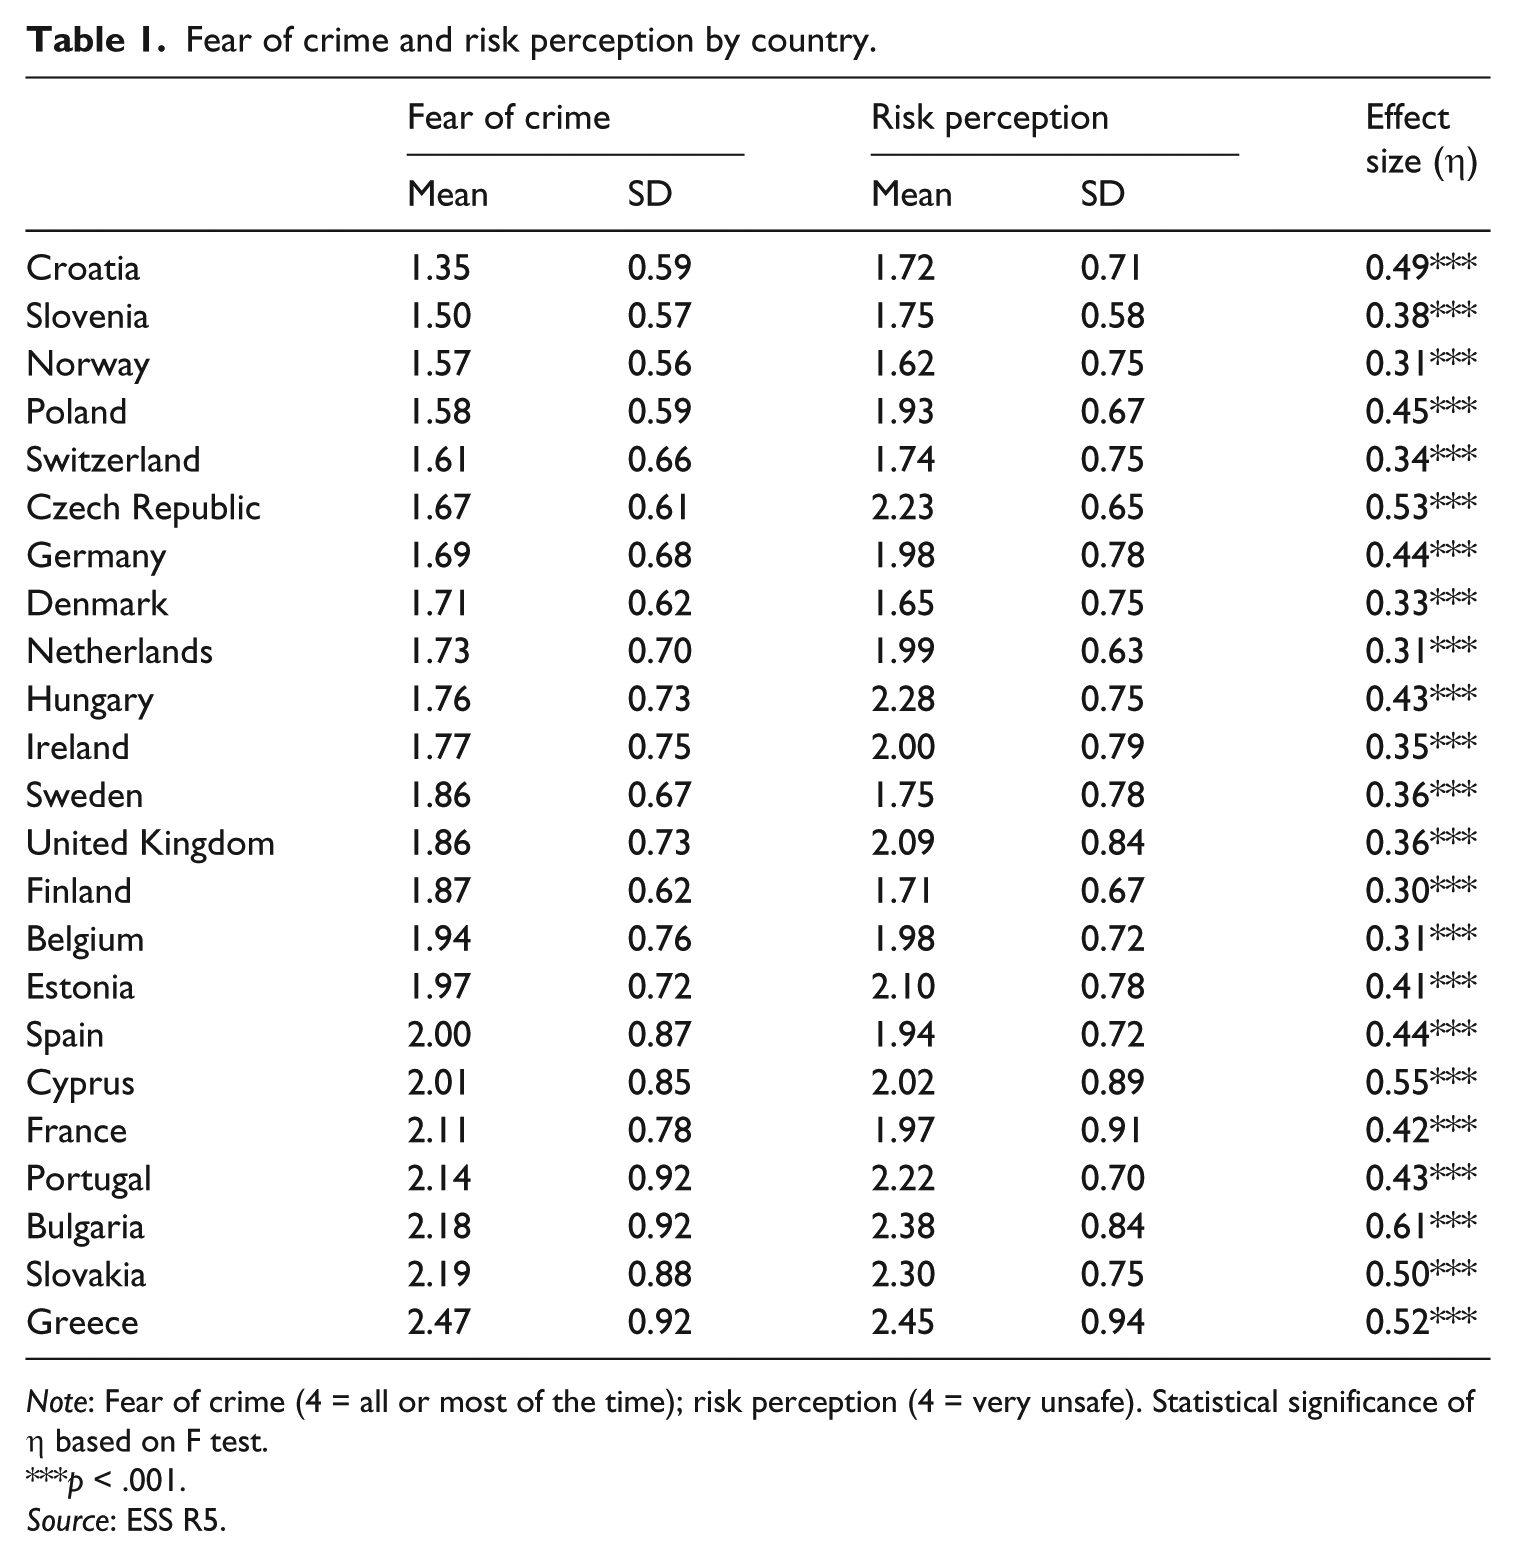
Note: Fear of crime (4 = all or most of the time); risk perception (4 = very unsafe). Statistical significance of η based on F test.
p < .001.
Source: ESS R5.
Individual-level variables
At an individual level (see Table 2), variables measuring vulnerability – that is, gender (1 = male), age, education and relative deprivation – enter the analysis. Nearly half (47 per cent) of our sample is male and the age of the respondents ranges from 14 to 101 years (with a mean of 47 years). We used the years of completed full-time education to measure the respondent’s level of education. The average number of years of completed full-time education in our sample is 12 years. Among the analysed countries, Portugal has the lowest score (seven years) and Ireland the highest (14 years). Relative deprivation was measured using one question: ‘Which of the descriptions on this card comes closest to how you feel about your household’s income nowadays?’ with response categories living comfortably on present income (coded as ‘1’), coping on present income (‘2’), finding it difficult on present income (‘3’) and finding it very difficult on present income (‘4’). Nine per cent of the respondents in our sample found it very difficult to live off of their present income. Almost three-quarters of them (71 per cent) live comfortably or cope with their household’s income. An indicator measuring victimization experience (1 = yes) considers both personal victimization and the victimization of a household member: ‘Have you or a member of your household been the victim of burglary or assault in the last five years?’ Seventeen per cent of our sample reported to be victims of such events. With respect to studies (LaGrange et al., 1992; Lewis and Salem, 1986; Skogan and Maxfield, 1981) that indicate a significant relationship between fear of crime and one’s living environment, it would be convenient to control for the level of social disorganization, incivilities or social cohesion. Since our data do not contain such indicators, we controlled for place of residence with the response categories big city, suburbs (coded as ‘1’), medium, small city (‘2’) and countryside (‘3’). Finally, we added descriptive statistics for risk perception. Over three-quarters of the individuals in our sample (77 per cent) reported feeling very safe or safe. A minor percentage of them (5 per cent) declared that they felt very unsafe.
Descriptive statistics of the individual and country-level variables and their association with fear of crime (N1 = 43,962; N2 = 23).
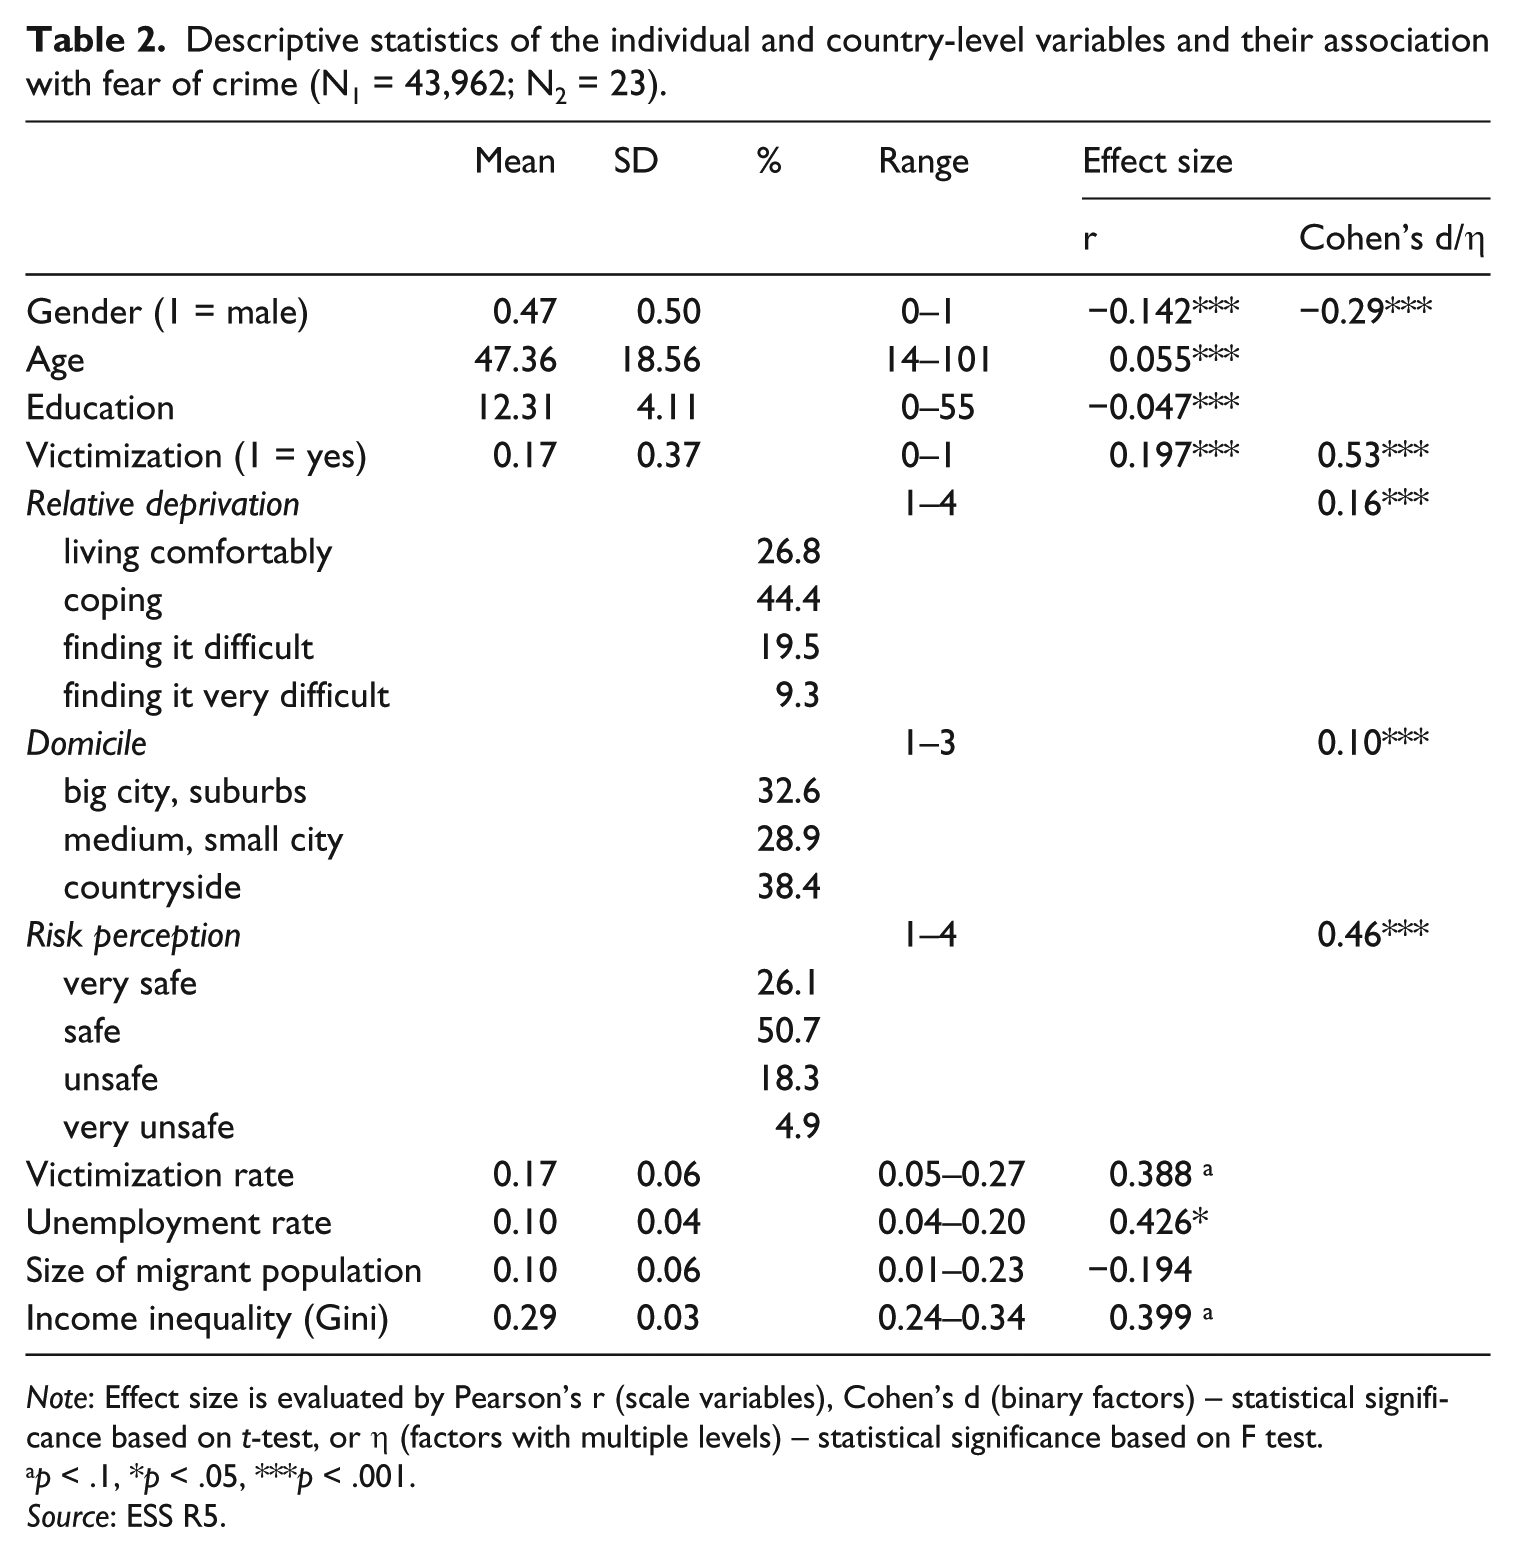
Note: Effect size is evaluated by Pearson’s r (scale variables), Cohen’s d (binary factors) – statistical significance based on t-test, or η (factors with multiple levels) – statistical significance based on F test.
p < .1, *p < .05, ***p < .001.
Source: ESS R5.
Table 2 also conveys the strength of the association of the mentioned variables with fear of crime. At the bivariate level of analysis, we found higher fear of crime among women, older and less educated people and those who find it difficult or very difficult to live comfortably on their present income. On the other hand, living in the countryside is associated with lower levels of fear. As expected, there is a relatively strong association of fear of crime with victimization experience as well as fear of crime with risk perception – victims of crime and those who declare high risk perception prove to be more frequently fearful than non-victims and those who assess their risk of victimization as relatively low.
Country-level variables
At a country level, we included victimization and unemployment rate, size of migrant population and the Gini coefficients as indicators of income inequality. 4 The victimization rate was calculated using individual-level data and represents the percentage of those who have been victimized during the previous five years in a given country (see above). The unemployment rate – that is, the percentage of unemployed people within the total labour force – in every country surveyed was obtained from the International Labour Organization (2016). The size of the migrant population – that is, the percentage of migrants within the total population of a given country – was obtained from the World Population Policies (United Nations, 2010). Finally, Gini coefficients for all countries are available in the Eurostat (2017) EU-SILC survey.
Descriptive statistics and associations between fear of crime and country-level variables are also displayed in Table 2. At the bivariate level of analysis, unemployment rate is moderately correlated with fear of crime. We also find an association with victimization rate and income inequality, although it is only marginally significant. Correlations between country-level variables are displayed in Table 3. A significant correlation was found between income inequality and unemployment rate (0.48), which, however, did not cause any problems in terms of multicollinearity regarding the subsequent multilevel analysis.
Pearson correlations between country-level variables (N = 23).
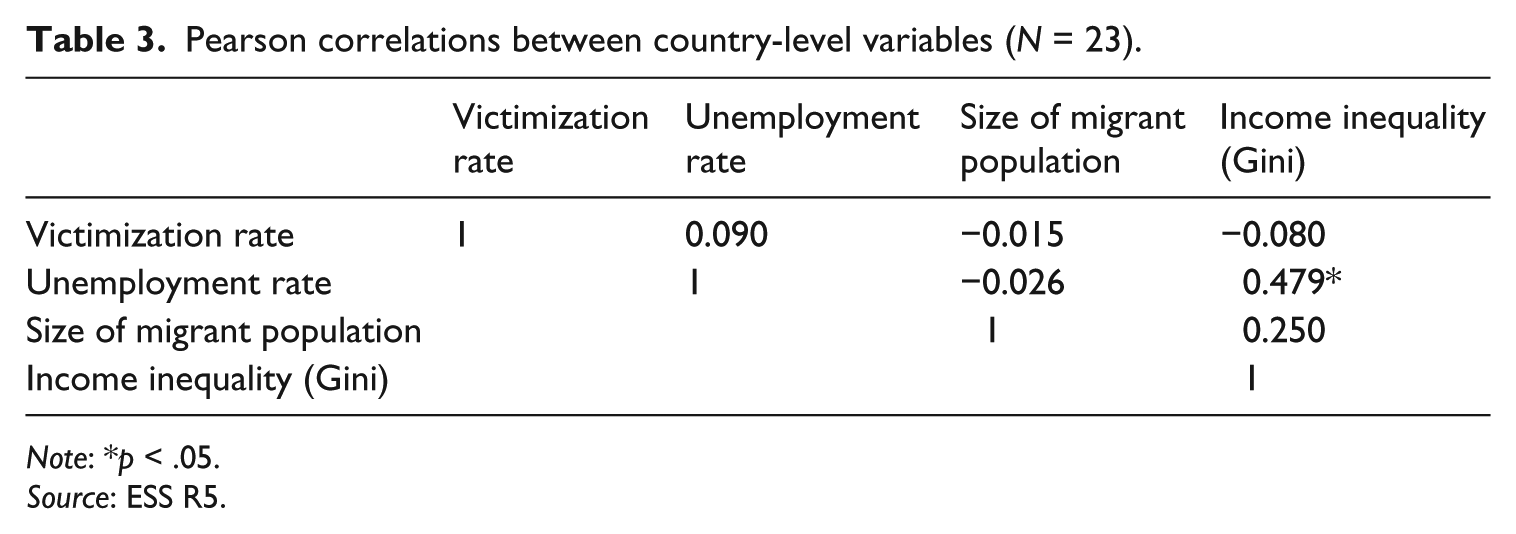
Note: *p < .05.
Source: ESS R5.
Results
As already mentioned, the multilevel regression analysis enabled us to determine if the nature of the relationship between fear of crime and risk perception changes across countries and how a given country’s context – that is, victimization and unemployment rate, size of migrant population and income inequality – can influence such a relationship. The results of the analysis are shown in Table 4.
Multilevel regression models for fear of crime (N1 = 42,005; N2 = 23).
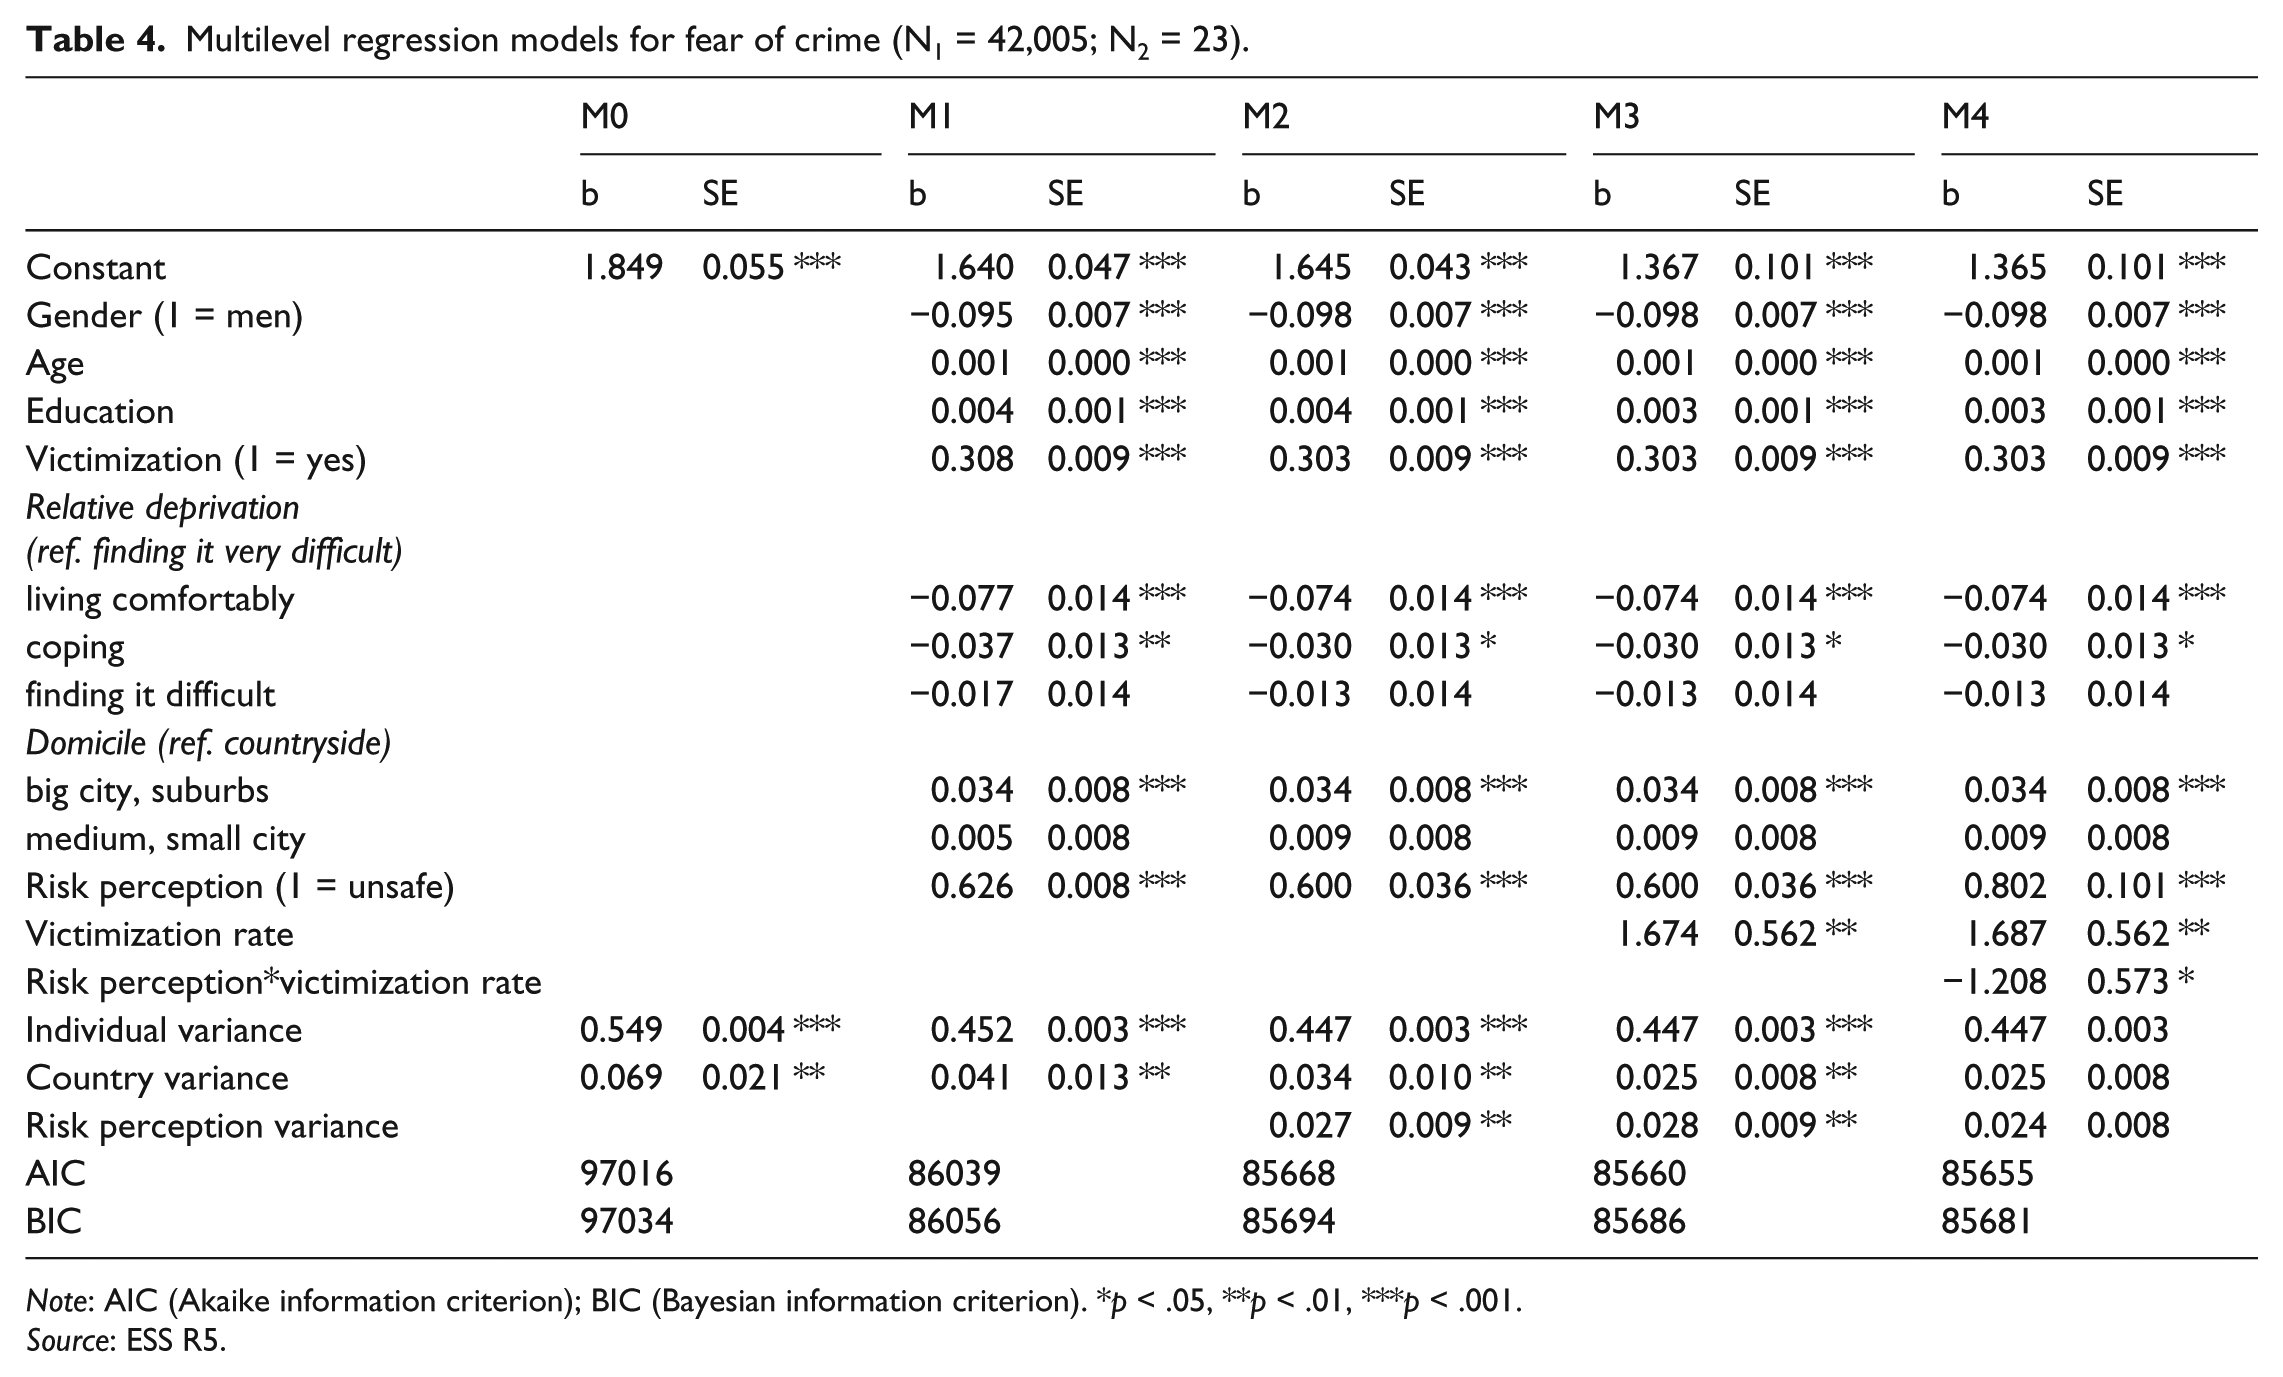
Note: AIC (Akaike information criterion); BIC (Bayesian information criterion). *p < .05, **p < .01, ***p < .001.
Source: ESS R5.
The basic model (M0), which estimates the differences in fear of crime at both an individual and country level, but does not include any explanatory variables, shows that approximately 11 per cent (Intraclass Correlation Coefficient (ICC) = 0.112) of differences in fear of crime can be attributed to the respondent’s country of origin, which in this case justifies the application of multilevel modelling.
The first model (M1) considers all individual variables including risk perception 5 as fixed effects; that is, we assumed that the slopes of these variables and fear of crime do not vary across the analysed countries. All variables entered in the model were statistically significant. The data suggest that women, older and more educated people and victims fear crime more often than their counterparts. Furthermore, fear of crime is characteristic for those who find it difficult to live comfortably on their present income and those living in big cities and suburbs rather than in the countryside. Finally, in line with Hypothesis 1, people who perceive their victimization risk to be higher are more prone to fear crime than those who perceive it to be rather low.
In the second model (M2), risk perception is considered to be a random effect. We thus assume that slopes of this variable and fear of crime vary across countries. In other words, we expect the strength of the relationship between risk perception and fear of crime to be different in each of the analysed countries. The results of the analysis confirmed this assumption (Hypothesis 2). Moreover, on the basis of the estimated model, we can say that the coeficient of risk perception in these countries ranges from 0.55 to 0.65 (95 per cent confidency interval) 6 when other variables included in the model are controlled for. The relationship between risk perception and fear of crime is therefore positive (those who feel unsafe fear crime to a greater extent than those who feel rather safe) in each country; however, the strength of the relationship differs across the analysed countries.
In the subsequent analysis, we posed the question whether or not fear of crime as well as differences in the fear of crime–risk perception link can be at least partly attributed to the specific cultural or social backgrounds of each country. In order to ascertain the unique effect of victimization and unemployment rate, size of migrant population and income inequality on our dependent variable, we estimated four different models into which each of the country-level variables were entered separately (not presented here). The only significant association was found with respect to fear of crime and victimization rate (M3; b = 1.674). We can thus corroborate Hypothesis 3 – inhabitants of countries with a higher victimization rate fear crime to a greater extent than those living in countries with a lower proportion of victims. On the other hand, unemployment rate, size of migrant population and income inequality have no impact.
The final model (M4) contains an interaction term between the victimization rate and risk perception (Hypothesis 4). Contrary to our expectations, however, it was found to be negative (b = −1.208), meaning that in countries with a lower victimization rate, the relationship between risk perception and fear of crime is stronger than in countries where the proportion of victims is higher. In other words, the data suggest that in countries with a low proportion of victimized inhabitants, the role of risk perception in shaping fear of crime is more pronounced than in countries where people encounter crime to a greater extent.
Discussion
Fear of crime represents a complex social phenomenon that is currently being examined on both an individual and country level. A number of studies point to its association with gender, age, victimization experience as well as victimization rate, social protection and income inequality. Nevertheless, their findings, especially in terms of country-level analysis, seem to be largely inconsistent. In our opinion, this may be primarily due to the differences in measurement methods employed for fear of crime. While some authors measure fear of crime using questions asking respondents about the intensity of their worries about different types of criminal offences or the frequency of fearful episodes (e.g. Visser et al., 2013), others work only with the question on feeling of safety (Hummelsheim et al., 2011) or incorporate it in overall indexes of fear of crime (Vauclair and Bratanova, 2017). According to the influential work of Ferraro and LaGrange (Ferraro, 1995; Ferraro and LaGrange, 1987) and Rountree and Land (1996) however, both concepts embody something slightly different. While fear of crime can be seen as an emotional response to crime, feeling of safety is more frequently understood as an indicator of perceived victimization risk. Moreover, risk perception reveals to be an important predictor of fear of crime and mediator between fear of crime and other individual factors. It has also come to light that environments with a higher crime rate or other social problems can foster individual risk perception, which in turn heightens fear of crime (Lorenc et al., 2012). This study therefore strove to examine the relationship between fear of crime and feeling of safety as an indicator of risk perception while controlling for other individual and contextual variables.
To our knowledge, there are four main limitations in this study: first, it concerns the indicators used to measure fear of crime and risk perception; given that our data contain only two questions on fear of burglary and violent crime, we were not able to control for fears of other types of criminal offences. Further research could therefore test the consistency of our findings by using more specific measurement methods for the mentioned phenomena. On a similar token, since our data do not include any indicators specifically asking respondents about the likelihood of being victimized in the future, risk perception is measured using only one question on the feeling of safety in one’s neighbourhood. Although this is a common measure of risk perception (e.g. Ferraro and LaGrange, 1987; Franklin et al., 2008; Gainey et al., 2011; Kanan and Pruitt, 2002; Rountree and Land, 1996), some studies still employ it as a proxy for the indicator of fear of crime. Second, since we are working with data from a large international survey aimed at comparing different phenomena across all participating countries, there is always the danger that the indicators used in our study (especially fear of crime, risk perception or victimization experience) are understood differently by respondents in different countries. However, in our case, it was not possible to proceed with an equivalence analysis to ascertain if this also held true for our study, as victimization and feeling of safety were measured using only one and fear of crime using only two questions. Third, our data do not allow us to control for various neighbourhood characteristics that could be important with respect to risk perception and its relationship to fear of crime. As already confirmed by a number of studies (Farrall et al., 2009; LaGrange et al., 1992; Lewis and Salem, 1986; Skogan and Maxfield, 1981), the absence of social disorganization and incivilities or high informal social control and strong community cohesion can lower one’s risk perception and diminish fear of crime among residents. Finally, the study is based on cross-sectional data which do not allow us to evaluate the causal direction or reciprocity of the analysed relationships. In this respect, we can only make assumptions about the nature of such relationships and therefore it would be more appropriate to work with longitudinal data. Our findings are, however, based on previous research and theoretical approaches aiming to explain the nature of fear of crime.
Despite the mentioned limitations, our study shed light on several important findings. In line with existing research (Farrall et al., 2009; Ferraro, 1995; Gainey et al., 2011; LaGrange et al., 1992; Rountree and Land, 1996; Wyant, 2008), we confirm the significant role of risk perception in fostering individual fear of crime in all of the analysed countries. As expected, there is a strong positive relationship between both variables in the sense that people who perceive their victimization risk to be higher fear crime to a greater extent than their counterparts.
The multilevel analysis, however, shows that the strength of the relationship significantly differs across countries and it is thus convenient to consider if these differences can be attributed to the different social backgrounds of the analysed countries. For this purpose, a set of contextual variables commonly analysed with respect to fear of crime or feeling of safety was thus considered in the analysis. Based on previous research, we expected fear of crime to be primarily associated with a given country’s victimization rate, with the effect of other country-level variables being negligible. The data confirmed this assumption – a higher victimization rate leads to higher fear of crime. On the contrary, unemployment rate, size of migrant population and income inequality remained non-significant. A possible interpretation for such a result could be that fear of crime, measured as the frequency of fearful episodes, is indeed driven by factors reflecting the criminal situation in a given country and thus people’s experience with crime. On the other hand, political, economic and social factors such as unemployment rate, size of the migrant population and income inequality are more likely connected with broader social anxieties and concerns (cf. Hummelsheim et al., 2011).
Finally, the data suggest, quite surprisingly, that in countries with a higher proportion of victims such as Nordic countries, Spain, Estonia, Belgium or France, risk perception does not play as important role in shaping fear of crime as in countries whose people encounter crime to a lesser extent; that is, predominantly post-communist countries (Croatia, Slovenia, Poland, the Czech Republic or Slovakia) as well as Germany and Cyprus. Conversely, in countries with a lower victimization rate, the relationship between fear of crime and risk perception is relatively strong. This is particularly important for practitioners and policy makers who should think not only about how to protect people from crime, but also how to make them feel safe in their environment. A potential pathway towards reducing the public’s feelings of insecurity and unsafety could be to place greater emphasis on one’s living conditions, especially in connection with community prevention programmes and public services (see also Gainey et al., 2011) which help maintain mutual interaction and communication among its residents, and also to aid in strengthening welfare measures within European countries and enhancing people’s economic and social independence (Hummelsheim et al., 2011; Visser et al., 2013). Future research could, however, also focus on indicators such as personal well-being or interpersonal and institutional trust since, for example, Scandinavians, who constantly report the lowest feeling of safety, rank among the most satisfied, happy and trusting people in Europe, while the level of self-declared well-being and trust in police or courts in post-communist countries, whose inhabitants feel rather unsafe, is relatively low.
In conclusion, our study confirms that the fear of crime–risk perception link varies in terms of its strength and that such variation can partially be accounted for by considering the victimization rate in a given country, with a lower victimization rate leading to a stronger relationship between fear of crime and risk perception. It thus seems that crime prevention may not be a sufficient enough measure in decreasing fear of crime and that efforts aimed at reinforcing the perception of safety in a given country are an important step in controlling fear of crime across Europe.
Footnotes
Declaration of Conflicting Interests
The author(s) declared no potential conflicts of interest with respect to the research, authorship, and/or publication of this article.
Funding
The author(s) disclosed receipt of the following financial support for the research, authorship, and/ or publication of this article: This text was created with support of the Ministry of Education, Youth and Sports of the Czech Republic, grant project no. LM2015066.