
Abstract
Introduction:
We aim to compare the upper lip bite test with the modified Mallampati test as predictors of difficult laryngoscopy and/or difficult intubation among morbidly obese patients.
Methods:
A total of 500 morbidly obese patients (body mass index > 40 kg/m2) undergoing general anaesthesia with tracheal intubation are included in this prospective single-blinded observational clinical study. The preoperative airway assessment is obtained by the modified Mallampati test and upper lip bite test. The difficulty of laryngoscopy is assessed by an experienced anaesthetist in patients adequately anaesthetised and fully relaxed. The view is classified according to Cormack and Lehane’s classification. Modified Mallampati test III or IV and upper lip bite test III are considered positive tests. Difficult laryngoscopy is defined as Cormack and Lehane’s classification III and IV, whereas difficult endotracheal intubation is defined as an intubation difficulty scale ⩾ 5.
Results:
The incidences of Cormack and Lehane’s classification III and IV and intubation difficulty scale ⩾ 5 are 9.4% and 11.8% respectively. The specificity, positive predictive value and accuracy are higher with the upper lip bite test. The combination of the upper lip bite test and the modified Mallampati test improved these measures. The likelihood ratio + was significantly higher for the upper lip bite test (6.35 and 9.47) than for the modified Mallampati test (3.21 and 3.16).
Conclusion:
The upper lip bite test is a test with high sensitivity, specificity, negative predictive value and accuracy making it a favourable test for identifying easy and difficult intubations and laryngoscopies in morbidly obese patients.
Keywords
Introduction
One of the main achievements of anaesthetists and intensivists is airway management. Tracheal intubation problems are a major contributor to the morbidity and mortality experienced with general anaesthesia (GA). An unexpected difficult intubation can be more harmful than a planned intubation when a serious airway condition is detected prior to anaesthesia. Therefore, if intubation seems to be difficult or impossible after the anaesthesia induction, severe oxygen desaturation may occur when the patient cannot be adequately oxygenated, due to failed intubation, failed mask ventilation or failed supraglottic ventilation. A simple bedside orofacial examination was used by investigators to predict difficult intubation (Khan et al 2003, Mallampati et al 1985). Mallampati et al (1985) introduced the Mallampati test which was revised by Samsoon and Young (1987) and called the modified Mallampati test (MMT). This test was a well-recognised screening test that classified the appearance of the oropharyngeal structure. Khan et al (2003) initiated the upper lip bite test (ULBT) as a bedside screening test for potentially difficult laryngoscopy.
The occurrence of obesity in the adult population in modern societies is growing around the world. Currently, morbidly obese patients (MOP) undergo more and more surgical interventions. Obesity is associated with several physiologic and anatomic changes such as decreased pulmonary and thoracic compliance, increased upper airway resistance due to additional parapharyngeal tissue and inappropriate ventilation and perfusion (Adams & Murphy 2000). These changes can have a negative outcome on airway management. Despite adequate preoxygenation preceding elective operation, obese patients are subject to rapid oxygen desaturation during periods of apnoea (Brodsky et al 2002), leaving less time for safe tracheal intubation trials. Several articles have documented that endotracheal intubation is more difficult in obese patients when compared with lean patients (Adams & Murphy 2000, Brodsky et al 2002, Juvin et al 2003, Samsoon & Young 1987, Voyagis et al 1998, Wilson et al 1988). The reported incidence of a difficult intubation was 15.5% in obese patients undergoing GA (Juvin et al 2003).
To the best of our knowledge, the value of ULBT in the prediction of difficult intubation has been investigated in low-weight patients (Badheka et al 2016, Dawood et al 2021, Eberhart et al 2005, Khan et al 2003, 2009, Myneni et al 2010, Safavi et al 2011, Shobha et al 2018) but not in those suffering from morbid obesity (MOP). The main objective of this study was to compare ULBT with MMT as predictors of difficult laryngoscopy and difficult endotracheal intubation in MOP (body mass index (BMI) > 40 kg/m2).
Materials and methods
This is a prospective, single-blind observational clinical study conducted with the authorisation of the Institutional Ethical Committee (Ethical Committee N° CEHDF 506). Informed consent was received from all eligible study patients. A total of 50 consecutive male and female patients of ASA physical status III or IV, aged 18–60 years, and MOP (BMI > 40 kg/m2) scheduled to undergo elective surgery under GA were prospectively involved. Edentulous patients, limited mouth opening, emergency, patients with pharyngolaryngeal pathology, compromised critical airway, a history of thyroid or neck surgery, previous radiotherapy of the neck, burns, limitation of cervical movements or limitation of temporomandibular joints, pregnancy and inability to sit were excluded from this study.
The patients’ airways were evaluated before the operation with two assessment tools (MMT classification and ULBT) by the same anaesthetist, not involved with the intubation of the patients’ airways to avoid interobserver variability. The MMT classification was defined by Samsoon and Young (1987) and mentioned in four classes according to the anatomical structures (Appendix 1). A flashlight was then used to assist in determining the oropharyngeal class. The patients were in a sitting position with maximum mouth opening and tongue protrusion; they were not asked to say ‘ah’ (Amadasun et al 2010). The ULBT assessed the ability of the patient to bite the upper lip with lower incisors in a sitting position and graded it in three classes (Appendix 2) (Khan et al 2003).
The patients were correctly placed in a head-up laryngoscopy position with an assumed horizontal line connecting the patient’s sternal notch to the external auditory meatus with the help of a pillow. This position facilitated alignment of the laryngeal, pharyngeal and oral axis of the airway in morbidly obese and large-framed patients (Collins et al 2004). A standardised GA protocol was administered in all patients by an experienced anaesthetist having more than 10 years of practice with a high level of airway management. After pre-oxygenation with 10 L/min O2 (FiO2 100) for 3 min, propofol (2.5 mg/kg), fentanyl (1 μg/kg) and rocuronium (1 mg/kg) were administered based on lean body weight at anaesthesia induction. All intubation attempts were made after verification of adequate paralysis, defined as the lack of response to the train of four or to a single ulnar nerve contraction stimulation. Anaesthetists, who were not aware of the preoperative MMT and ULBT classes, rated the difficulty of laryngoscopy at intubation, which was achieved with the patient properly anaesthetised and completely relaxed on the operating room table.
The initial laryngoscopy was performed with a Macintosh No. 4 blade (Welch Allyn Inc., Skaneateles Falls, NY) suitable for the jaw length and size in this category of MOP. Nevertheless, in case of difficulty and if the second attempt did not give a good laryngoscopic view, a C-Mac video laryngoscopy with D-blade (Karl Storz, Tuttlingen, Germany) paired with an Eschmann stylet and an adjustment of the head position according to the situation was used. The intubation difficulty scale (IDS) developed by Adnet et al (1997) on the basis of seven variables associated with difficult intubation (Appendix 3) was used to assess the difficulty of endotracheal intubation. The IDS score is generated by adding the values of N1 to N7. A score of 0 indicated an easy intubation. An IDS score from 1 to 4 indicated slight difficulty, and an IDS score ⩾ 5 indicated moderate to major difficulty (Adnet et al 1997). For the scope of this study, patients were divided into two groups: group 1: IDS score < 5 (easy and slight difficulty) and group 2: IDS score ⩾ 5 (difficult intubation). The laryngeal visualisation without external laryngeal pressure was classified in accordance with the method reported by Cormack and Lehane (1984) (Appendix 4). While grades I and II represented an easy laryngoscopy, grades III and IV were considered difficult. Preoperative assessment data and intubation scores were used to determine the accuracy of each of the above tests and their combination to predict difficult laryngoscopy and/or difficult intubation.
Statistical analysis
The sample size was calculated using the area under a receiver operating characteristic (ROC) curve (AUC) to detect an absolute difference of 10% (0.1) (AUC (0.6–0.7)) between two tools (ULBT and MMT) in predicting difficult intubation. Considering the prevalence of difficult intubation to be 12% (Shiga et al 2006) among obese patients undergoing GA, we determined that a minimum of 458 patients would be required with a type 1 error (α) of 5% and power (1–β) of 80% using a two-sided alternative hypothesis. We enrolled 500 consecutive patients for better corroboration of the study.
Data was analysed using kappa agreement between tests. Sensitivity (Se), specificity (Sp), positive and negative predictive values (PPV and NPV), accuracy (Acc) and likelihood ratios for positive and negative tests (LR+ and LR–) were calculated for each test with their 95% confidence interval (95% CI) according to standard formulas. (The definitions of the aforementioned statistical terms have been provided in Appendix 5). Statistical analysis was achieved using SPSS software version 17 (SPSS, Chicago, IL, USA) and MedCalc Software bvba (Ostend, Belgium, v.14.12.0). Data were processed by using Fisher’s exact and Mc-Nemar tests. The AUC was considered the main end-point of the study to assess the clinical usefulness of the test. Usually, tests with an AUC value ⩾ 0.7 are accepted to be of clinical relevance. Differences between the AUC values of both predictive tests were calculated, and a p-value of 0.05 was defined as statistically significant.
Results
A total of 500 patients were included in the study. Demographic data and clinical characteristics of the study population are presented in Table 1. There was no significant difference between easy or difficult endotracheal intubation regarding these data. Notably, 47 patients had a difficult laryngoscopy exhibiting laryngoscopy view grade III or IV, and 59 patients were found to have difficult endotracheal intubation (IDS ⩾ 5). The incidences of difficult laryngoscopy (grades III and IV of Cormack and Lehane’s classification (CLC)) and difficult endotracheal intubation (IDS ⩾ 5) were 9.4% and 11.8%, respectively, in our study. There were no failed intubations. In 59 of the patients presenting with a difficult intubation, 42 patients required an alternative technique to intubate the trachea. In these 42 difficult cases, the C-Mac video laryngoscopy with D-blade was used coupled with Eschmann stylet. In 7 patients of the 59 who presented a difficult intubation, hypoxemia (SaO2 < 85%) was reported during intubation, but there were no cases of postoperative morbidity or mortality related to difficult intubation.
Demographic and clinical characteristics of the study population
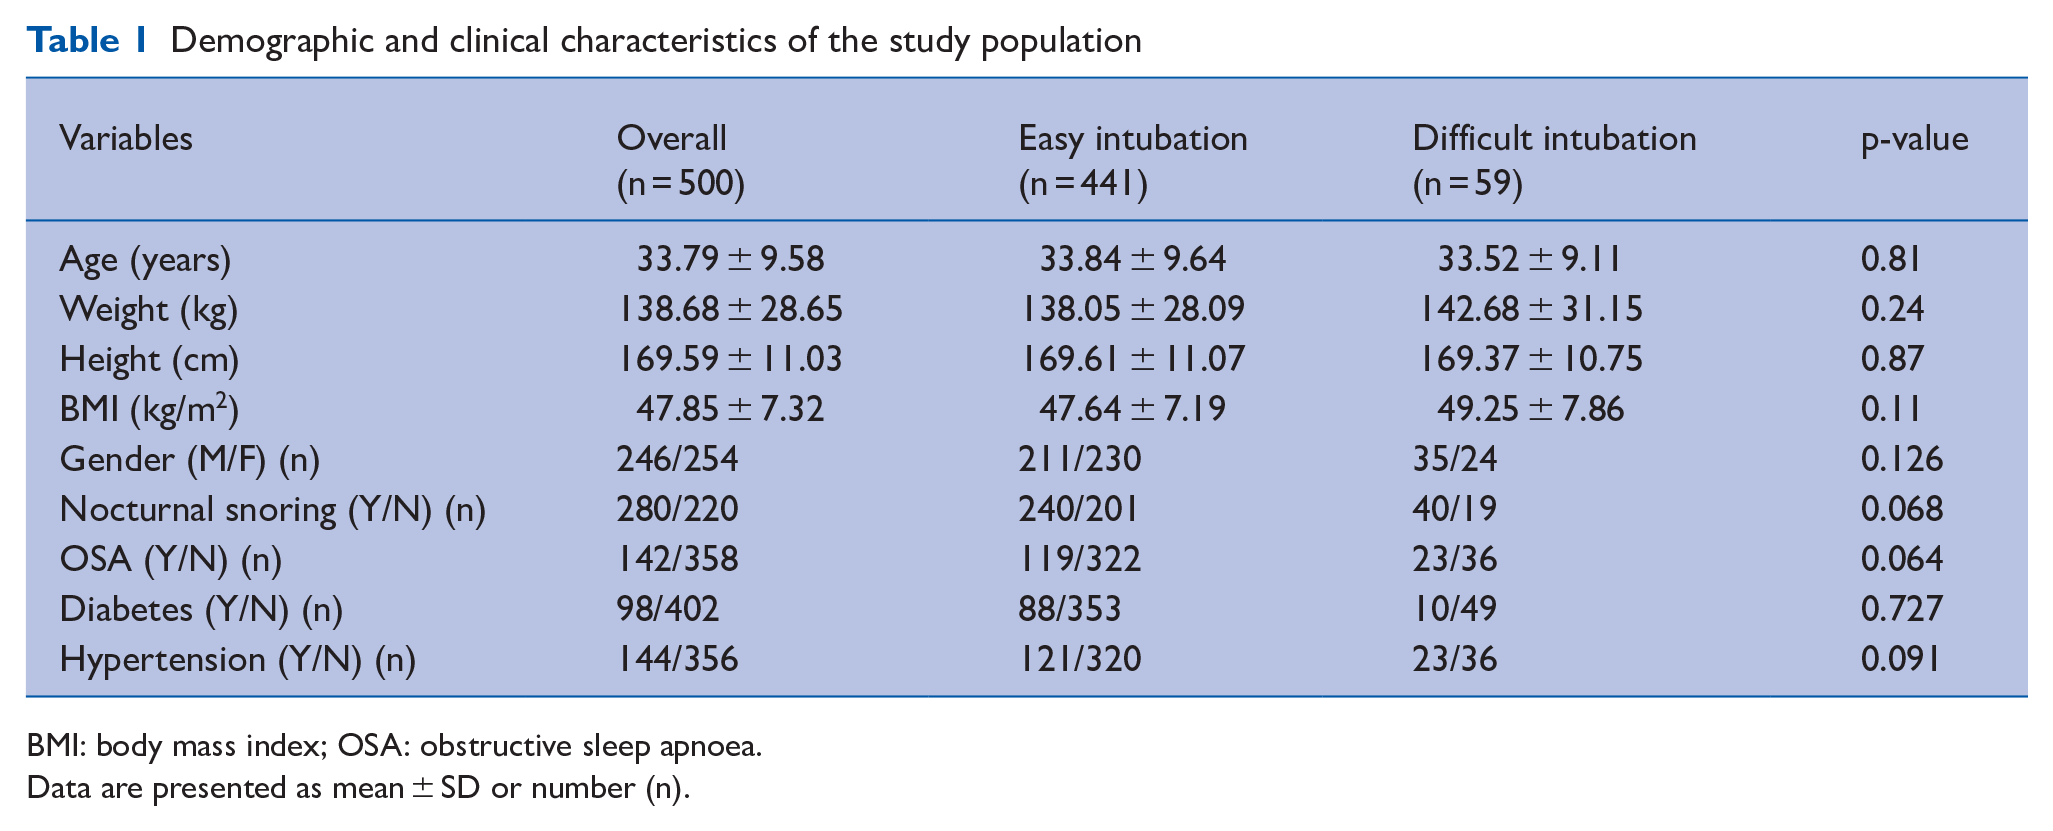
BMI: body mass index; OSA: obstructive sleep apnoea.
Data are presented as mean ± SD or number (n).
Modified Mallampati class III or IV and upper lip bite class III were considered predictors of difficult intubation. In this prospective blinded study, we found that 372 patients had modified Mallampati class I or II and 128 patients had class III or IV, whereas 432 patients were assessed to have upper lip bite class I or II and 68 patients class III (Figures 1 and 2). A significant agreement was found between MMT, ULBT, the association MMT-ULBT and laryngoscopic view and IDS (p < 0.01). Kappa coefficient for the ULBT was higher as compared with MMT concerning the laryngoscopic view (0.403 versus 0.265) and the IDS (0.54 versus 0.292), but the greatest agreements seen were between the association MMT-ULBT and laryngoscopic view (Kappa coefficient = 0.515) and between the association MMT-ULBT and IDS (Kappa coefficient = 0.769) (Table 2).
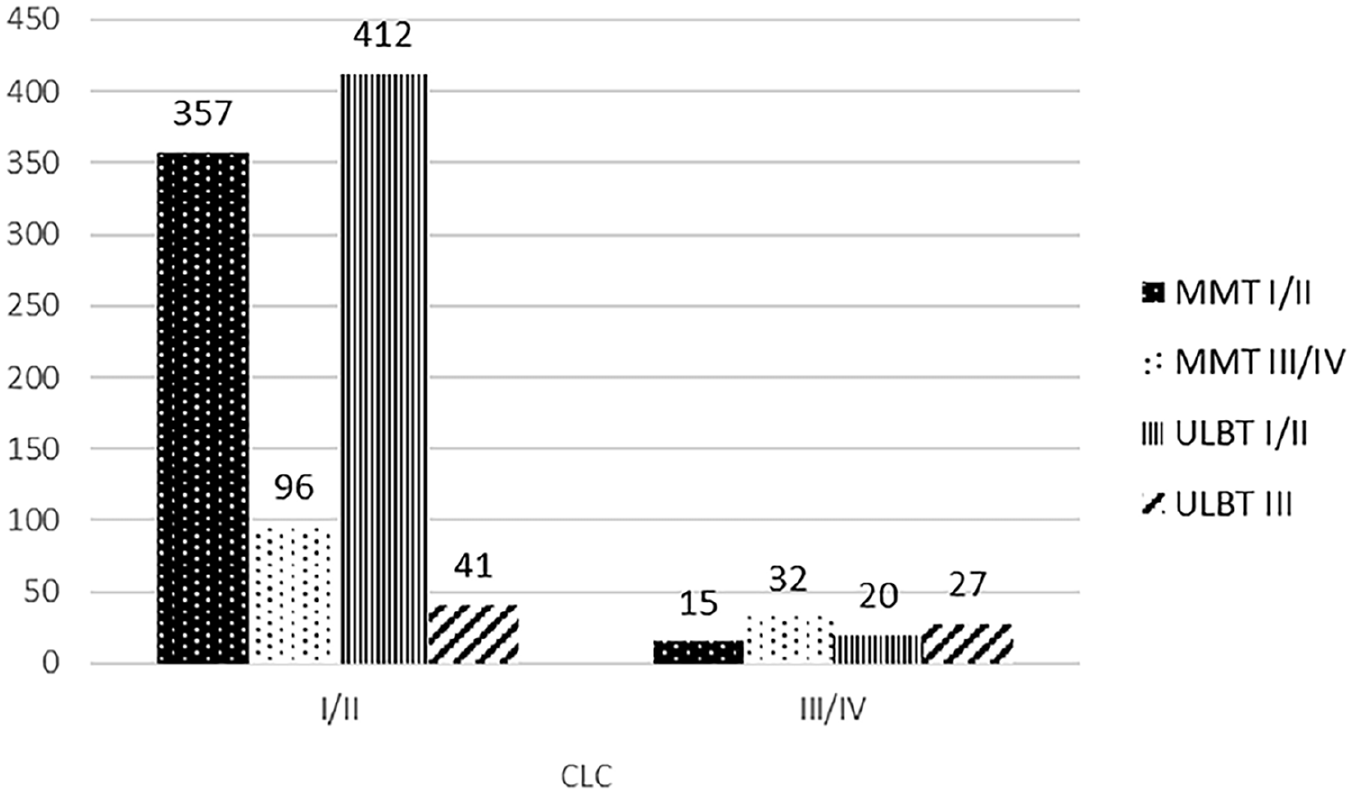
Comparison MMT versus ULBT regarding laryngoscopic view
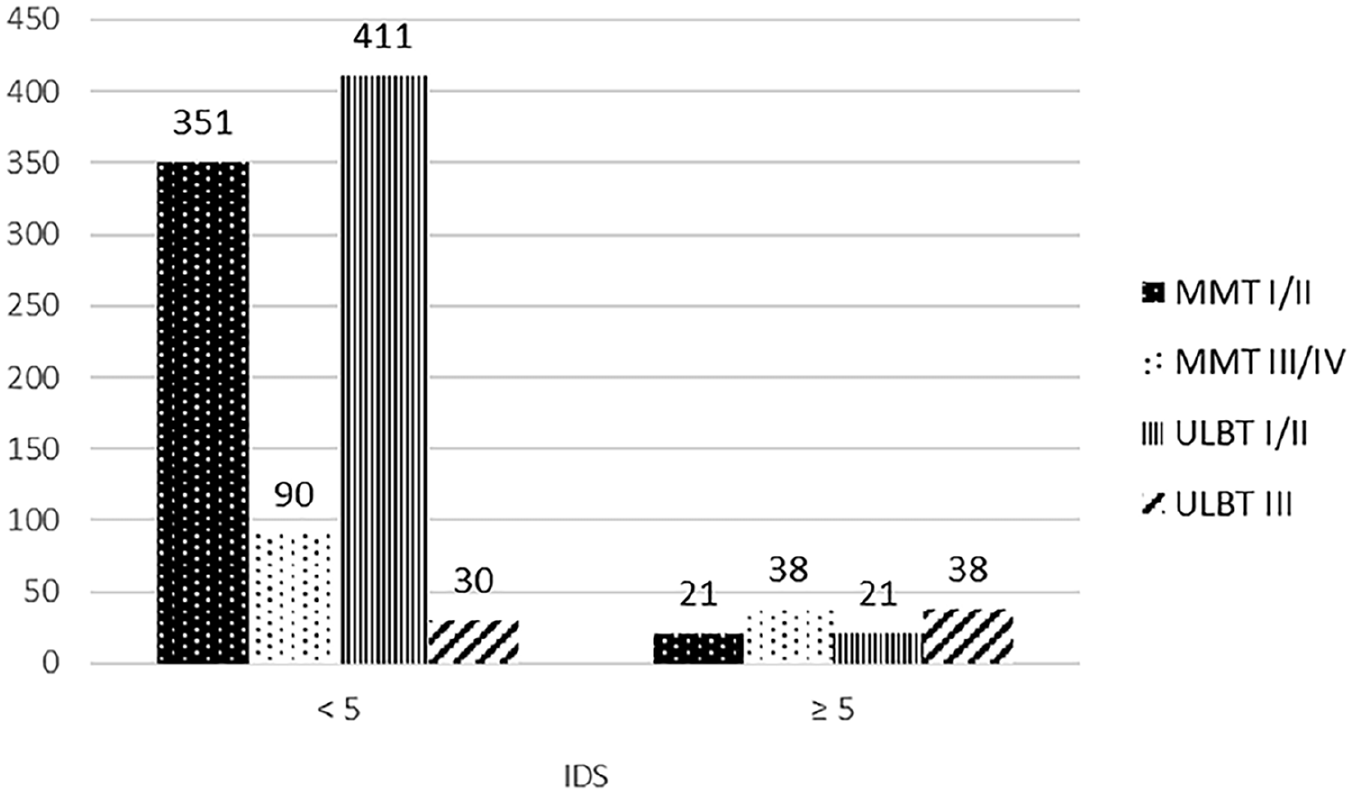
Comparison MMT versus ULBT regarding difficult intubation
Agreement of modified Mallampati test (MMT), upper lip bite test (ULBT) and the combination MMT-ULBT with laryngoscopic view and intubating difficulty scale (IDS)
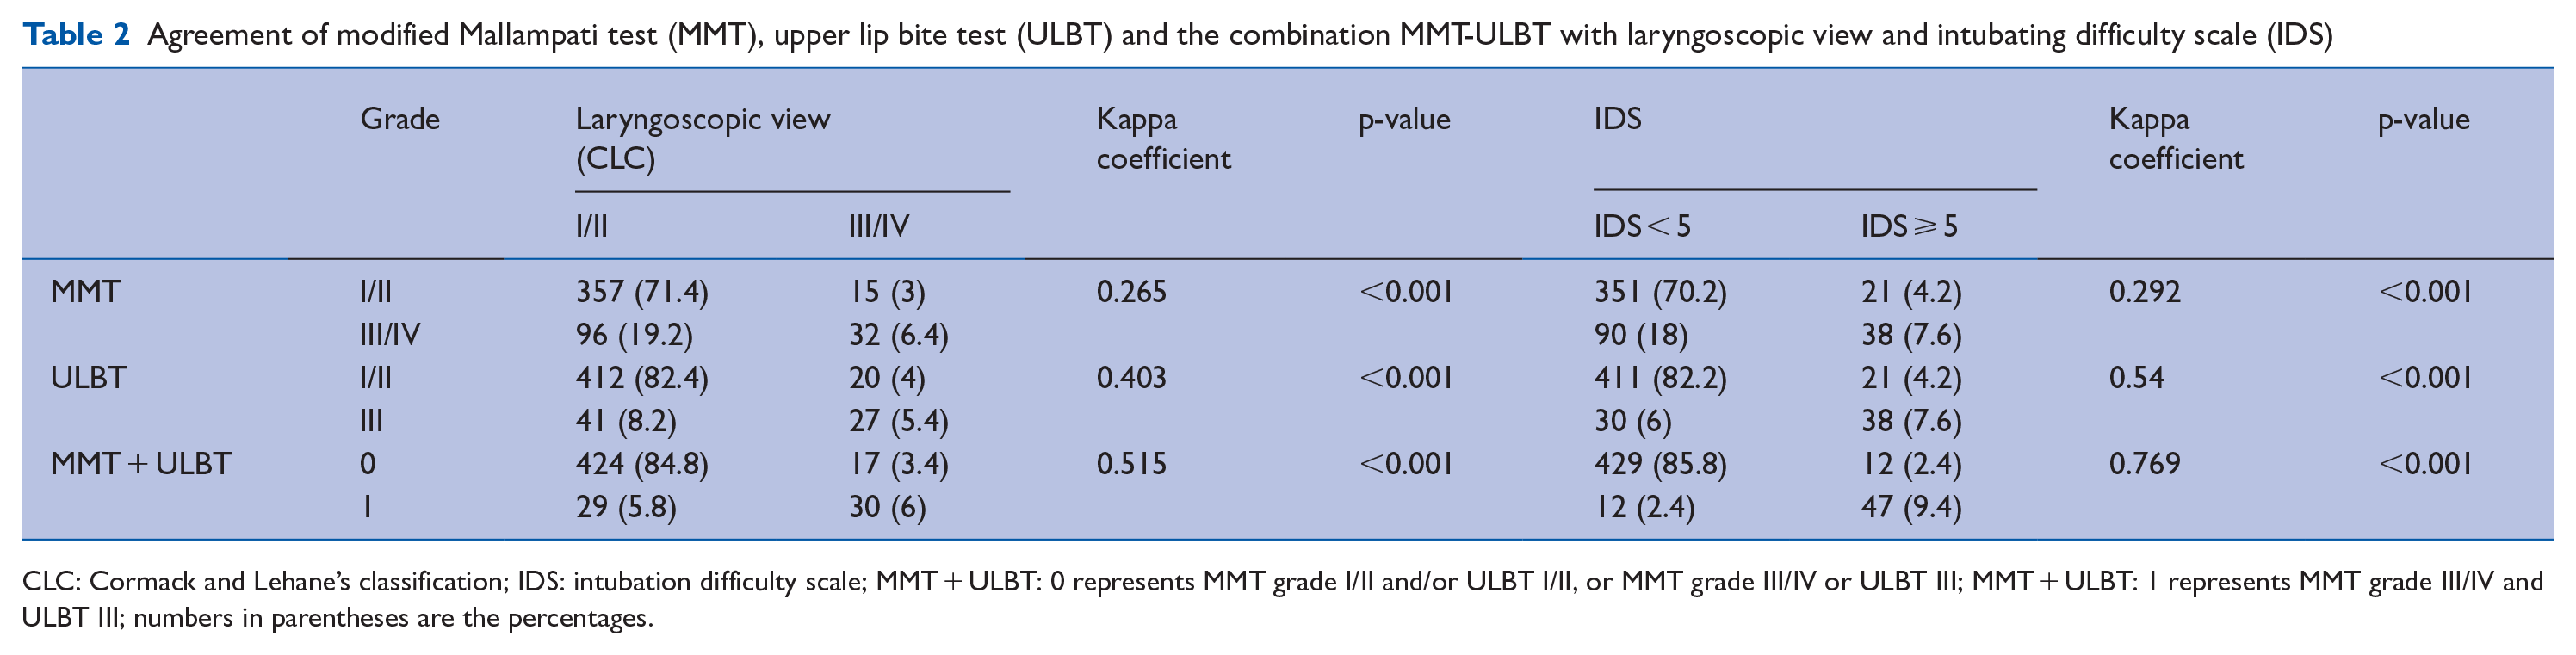
CLC: Cormack and Lehane’s classification; IDS: intubation difficulty scale; MMT + ULBT: 0 represents MMT grade I/II and/or ULBT I/II, or MMT grade III/IV or ULBT III; MMT + ULBT: 1 represents MMT grade III/IV and ULBT III; numbers in parentheses are the percentages.
Se, Sp, PPV, NPV, Acc, LR+, LR– for MMT, ULBT and association MMT-ULBT as predicting tests for (a) difficult laryngoscopy and (b) difficult intubation among MOP are shown in Table 3. The ULBT could easily predict 57.45% of difficult laryngoscopies and 64.41% of difficult intubations. Similarly, it could predict 90.95% of easy laryngoscopies and 93.2% of easy intubations. Furthermore, 95.37% of the laryngoscopies and 95.14% of intubations declared easy were in fact easy, while 39.71% of laryngoscopies and 55.88% of so-called difficult intubations were in fact difficult during the laryngoscopic intubation attempt. In general, 87.8% of easy and difficult laryngoscopies and 89.8% of easy and difficult intubations were correctly predicted with ULBT. The NPV of MMT, ULBT and the association MMT-ULBT were high, indicating that these tests could predict easy laryngoscopy and intubation.
Sensitivity, specificity, positive and negative predictive values, accuracy, likelihood ratio (positive and negative tests) and area under the receiver operating characteristic (ROC) curve of modified Mallampati test (MMT), upper lip bite test (ULBT) and the association MMT with ULBT, regarding the laryngoscopic view (Cormack and Lehane’s classification (CLC)) and intubating difficulty scale (IDS)
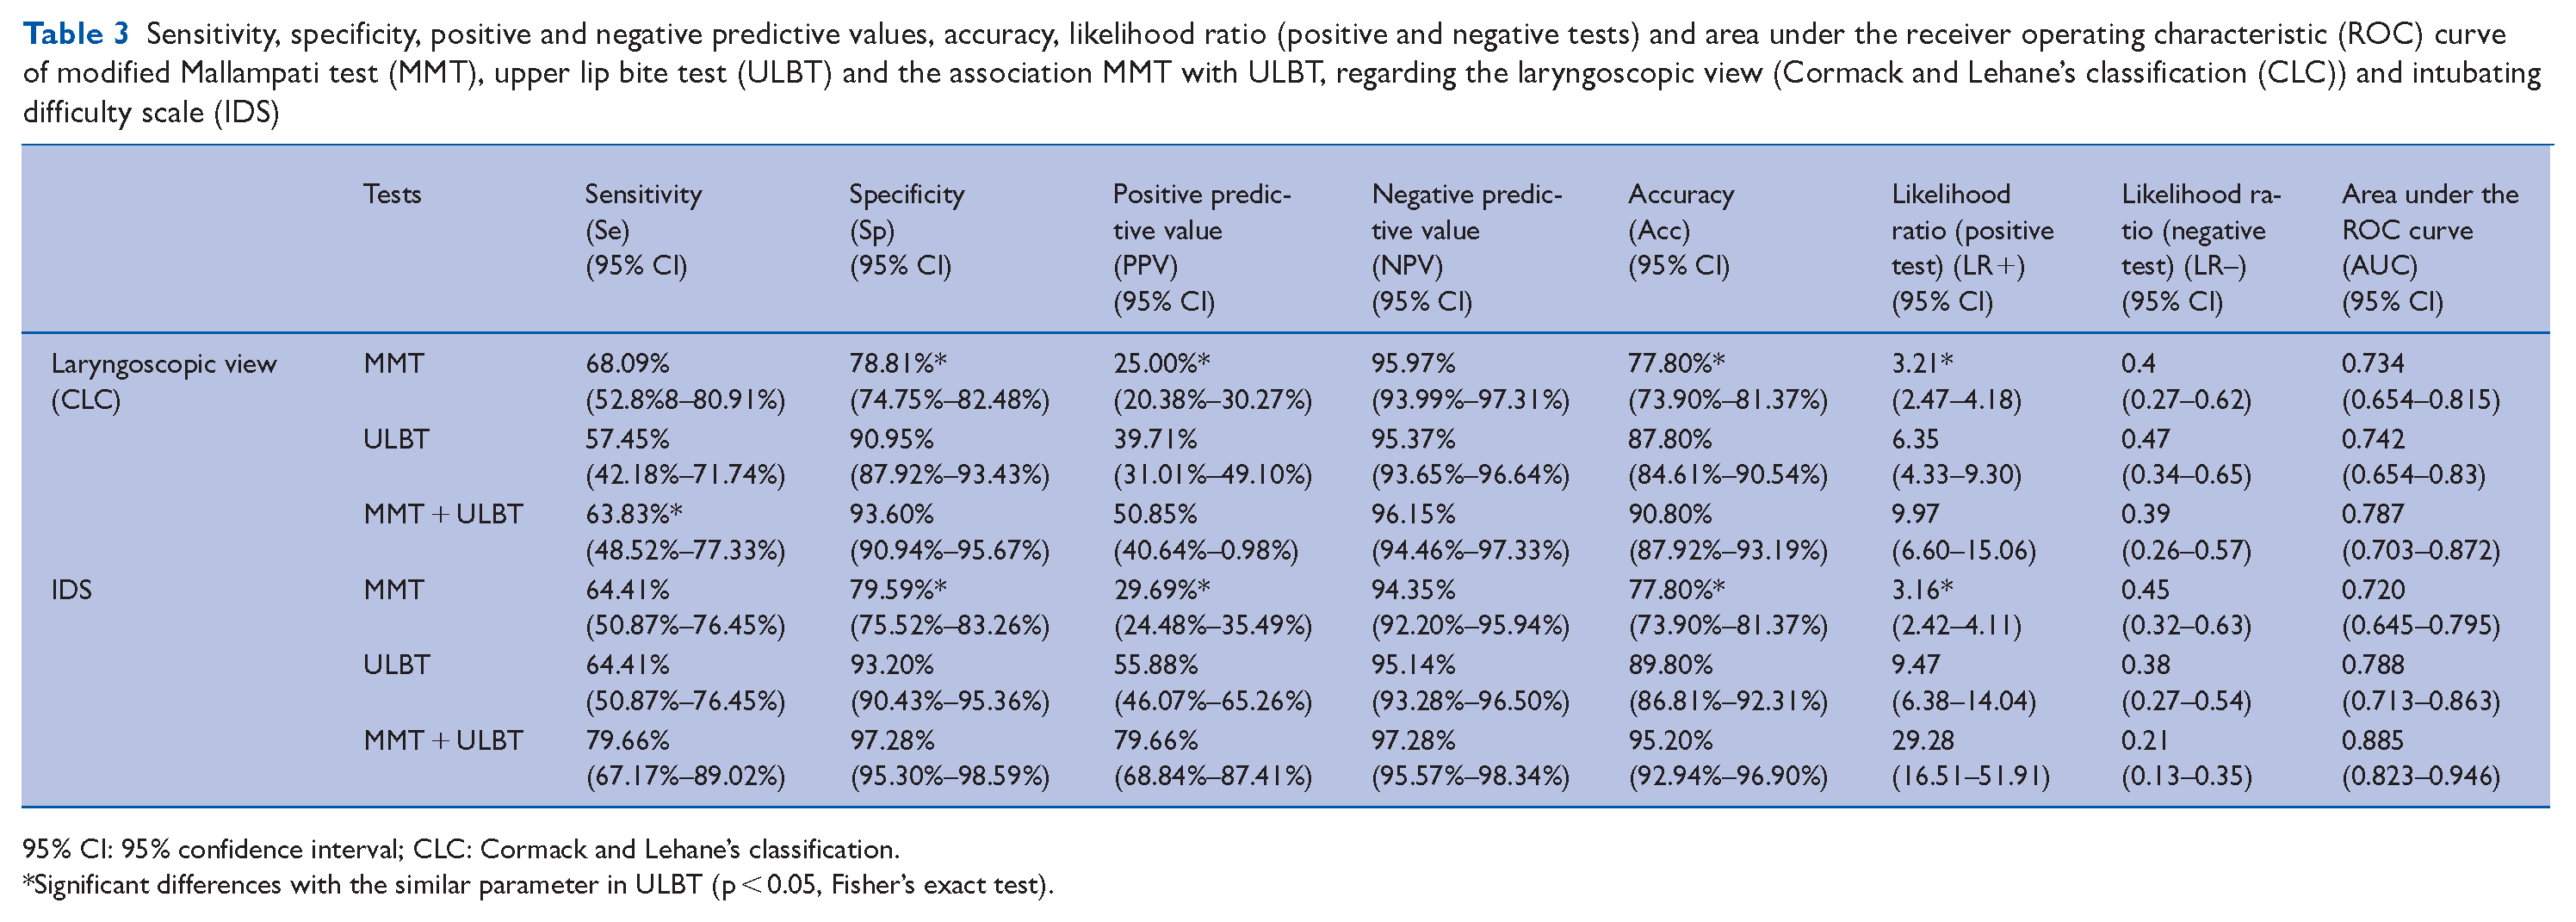
95% CI: 95% confidence interval; CLC: Cormack and Lehane’s classification.
Significant differences with the similar parameter in ULBT (p < 0.05, Fisher’s exact test).
ULBT had a higher level of Sp, PPV and Acc when compared with MMT. We further found that the combination of ULBT with MMT improved the Sp, PPV and Acc in comparison with those achieved with ULBT alone concerning the laryngoscopic view and the IDS. The combination of the tests was the key finding of our study.
The likelihood ratio for a positive test was significantly higher for ULBT (6.35 and 9.47) than MMT (3.21 and 3.16). Moreover, the association MMT-ULBT enhanced the LR+ compared with ULBT alone.
The primary outcome of this study was that the AUC of the ROC was higher for the association MMT-ULBT (AUC = 0.787) than the MMT (AUC = 0.734) and the ULBT (AUC = 0.742) concerning the laryngoscopic view (Figure 3) and was highest for the association MMT-ULBT (AUC = 0.885) and the ULBT (AUC = 0.788) than the MMT (AUC = 0.72) concerning the intubating difficulty scale (Figure 4). The difference of both ROC curves was not statistically significant.
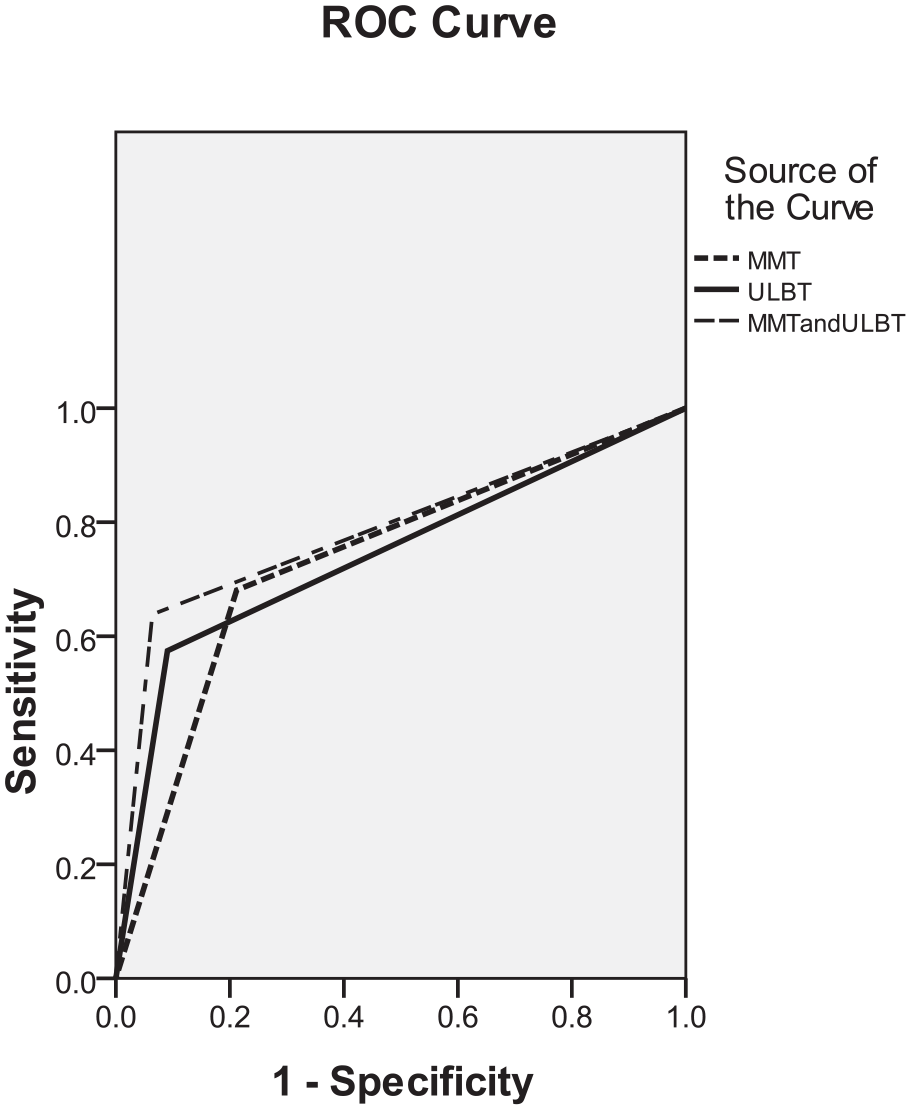
ROC curve of MMT, ULBT and the association MMT + ULBT for the laryngoscopic view
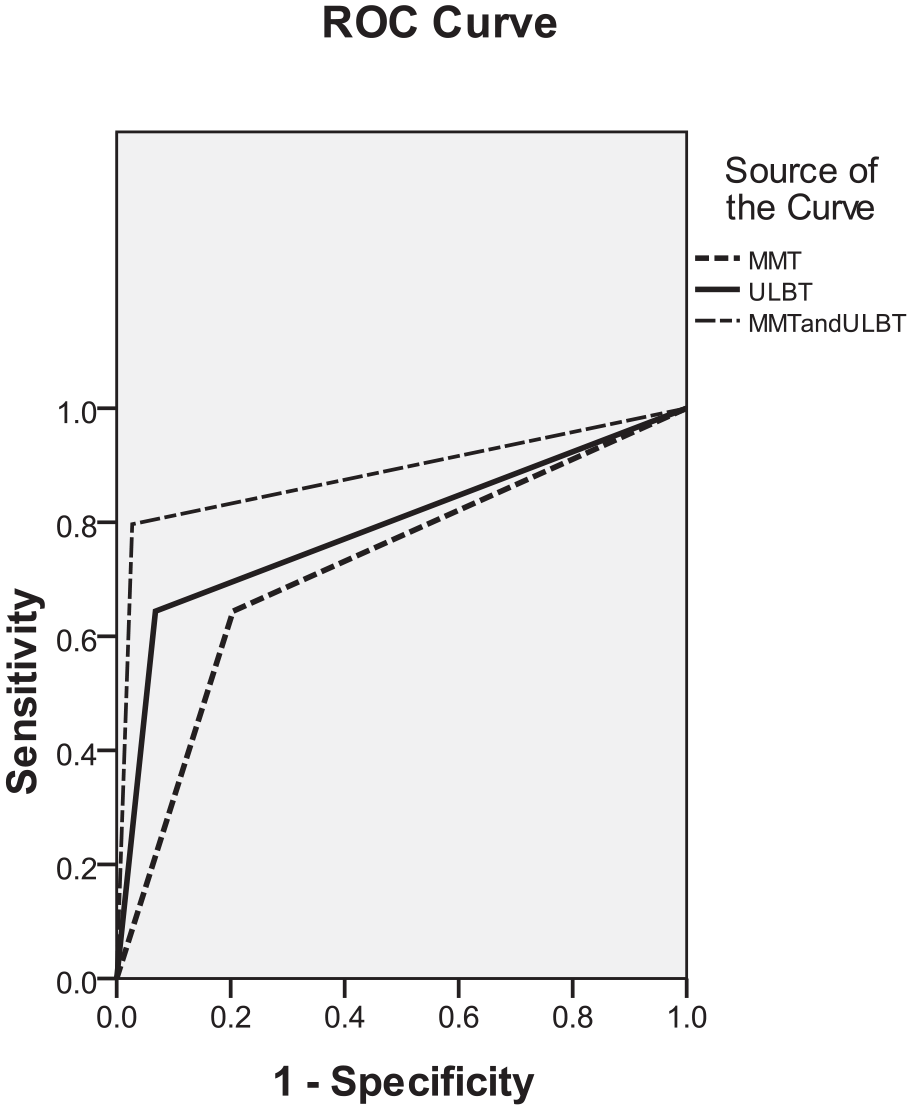
ROC curve of MMT, ULBT and the association MMT + ULBT for the Intubating Difficulty Scale (IDS)
Discussion
Unexpected difficult tracheal intubation was a major determinant of anaesthesia-related morbidity and mortality (Savva 1994). For Wilson et al (1988), a body weight exceeding 95 kg, was recognised as a risk factor for difficult intubation. A meta-analysis carried out by Wang et al (2018) concerning the relationship between body mass index and difficult management of tracheal intubation by direct laryngoscopy revealed that obesity was involved in an elevated risk of difficult intubation, difficult laryngoscopy and a Mallampati score ⩾ 3 in adult patients undergoing GA. Our data agreed with several review articles supporting an increased incidence of DI in MOP (Collins et al 2006, Juvin et al 2004, Shiga et al 2006). The incidence of difficult laryngoscopy in obese patients seemed to be 12.7% (95% CI, 11.5%–14.0%) (Shiga et al 2006). In our study, the incidence of difficult laryngoscopy and difficult intubation were 9.4% and 11.8%, respectively.
Difficult laryngoscopy was not necessarily associated with difficult intubation. This was commonly the case in obese patients, as shown by Juvin et al (2003). The incidence of difficult laryngoscopy was comparable in obese and lean patients. In that case, some obese patients were hard to intubate while laryngoscopy was easy. The fact that cases of easy laryngoscopy coincided with difficult intubations suggested that, to the degree of difficulty of the intubation, one had to add extrinsic factors (individual competence, manoeuvres performed, instrumentation, relaxation of the laryngeal musculature and others) which were hard to standardise when predicting intubation by the grade of difficulty in laryngoscopy (García-Guiral et al 1997). In reality, the factors involved in complicated laryngoscopy did not represent the true range of challenging situations that might make intubation easy or difficult. Therefore, the commonly agreed Cormack and Lehane laryngoscopy vision rating scale was not suitable for assessing difficult intubation in obese patients (Juvin et al 2004). Juvin et al (2003) supported the statement that difficulties in intubation and laryngeal visualisation during laryngoscopy were separate issues (Khan et al 2003) and that tracheal intubation was more pronounced in obese patients. The medical literature on this topic was unclear due to the disagreement on the definition of ‘difficult intubation,’ with differences between authors. For this reason, we choose to evaluate the difficult laryngoscopy and tracheal intubation separately. An objective scoring system (Adnet et al 1997), the IDS score, was proposed to rate intubation difficulty in obese patients (Juvin et al 2003).
As difficult intubation occurred rarely and was not easy to define, the investigation for a predictive test that is easy to use and accurate in prediction was ongoing. It was substantiated that if difficult laryngoscopy and /or difficult intubation were foretold, skilled assistance and specialist equipment could be supplied to improve life-threatening conditions. The preoperative airway screening test should be extremely sensitive to predict the maximum number of patients with difficult laryngoscopy and/or tracheal intubation correctly, and highly specific to predict easy laryngoscopy and/or tracheal intubation correctly. The test should also have a high PPV with minimal negative predictions (to prevent adverse and even fatal consequences) (Dawood et al 2021). Although the diagnostic accuracy of these screening tests differed between trials, this was due to differences in the incidence of difficult intubation, insufficient statistical power, different test thresholds or differences in patient demographics (Shiga et al 2005).
We found the specificity, PPV and accuracy of the ULBT to be better than the MMT, but the sensitivity and negative predictive value of both tests were similar. These results showed that ULBT was superior to MMT in identifying easy laryngoscopy and tracheal intubation. Brodsky et al (2002) found that a Mallampati score of 3 or 4 was a predictor of difficult intubation in obese patients. However, according to the previous study, the sensitivity, specificity and negative predictive value of the Mallampati score were low (Benumof 1991), which called into question the validity of this predictive factor in clinical settings. Dawood et al (2021) and Shobha et al (2018) showed that ULBT is the most accurate predictive test for difficult laryngoscopy in apparently normal patients. Allahyary et al (2008) found that the ULBT as a single test in obstetric patients was highly sensitive (94.6%) and specific (97.6%), and as a result, the ULBT was reported as a valuable predictor of difficult laryngoscopy in this population, compared with the MMT.
Khan et al (2003) showed that the ULBT has a high accuracy, specificity and NPV. On the contrary, our study showed the PPV of the ULBT in MOP to be better than those of Khan et al (2003, 2009) 39.71% of the laryngoscopies and 55.88% of intubations considered difficult were, in fact, difficult during laryngoscopic intubation attempts. This difference could be related to the selection of MOP in our study. Furthermore, Roth et al (2019), showed, in a systematic review on bedside tests for predicting difficult airways, that for difficult laryngoscopy, the sensitivity and specificity (95% CI) of the ULBT were 0.67 (0.45–0.83) and 0.92 (0.86–0.95), respectively. In addition, they mentioned that for detecting difficult laryngoscopy, the ULBT had the highest sensitivity (0.67, 0.45–0.83) when compared with other tests (the Mallampati test, Wilson risk score, thyromental distance, sternomental distance) (Roth et al 2019). These results were consistent with our study. A meta-analysis of bedside screening test performance done by Shiga et al (2005) showed that the bedside test combinations added some supplemental diagnostic value over the value of each test alone in predicting difficult intubation in patients without airway pathology. In our study, we found that the combination of MMT and ULBT had a lower sensitivity than the MMT alone concerning the laryngoscopic view; however, this combination had higher specificity, PPV and Acc than the MMT alone. However, this combination showed a minor superiority to the ULBT alone concerning the specificity, PPV and Acc.
The AUC of the ROC was higher for the association ULBT-MMT, AUC = 0.787 (0.703–0.872) and 0.885 (0.823–0.946), than the MMT, AUC = 0.734 (0.654–0.815) and 0.72 (0.645–0.795) concerning the difficulties in laryngoscopy and intubation, respectively, but the differences of both ROC curves were not statistically significant. Our results in MOP are similar to those of the original study of Khan et al (2003) over all the population. On the contrary, Eberhart et al (2005) found that the AUC of the ROC was lower for the ULBT than the MMT with a difference statistically significant. This measure of a predictive test was preferable to the accuracy because it was unrelated to the incidence of difficult intubation. The accuracy of the prediction was likely to be biased by different incidences of the predicted event.
The LR+ was 6.8 for ULBT, while it was only 2.5 for MMT in the original paper of Khan et al (2003). In this study, the LR+ for ULBT (6.35 and 9.47) was higher than for MMT (3.21 and 3.16) in MOP. Furthermore, this measure may be useful as a predictive tool for intubation and laryngoscopic difficulties in our routine practice (Eberhart et al 2005).
Concerning the ULBT, it has many evident benefits. First, ULBT considers the temporal mandibular joint (TMJ) and its optimal execution for subluxation, to evaluate the airway appraisal, a good excursion at the TMJ coupled with subluxation of the mandible helps in achieving a lower score of ULBT thus confirming a wide opening of the mouth and easy glottic exposure owing to a large anterior laryngeal space. These characteristics of the ULBT make this test unique in assessing the airway and providing the observer with a definite clue in delineating cases in which laryngoscopy and intubation would be easy (Khan et al 2014). Second, the three classes of ULBT are easily delimited and well-defined, allowing inter-observer variation to be very rare, and its application is not related to the level of competency or expertise (Bukhari et al 2018). There was less likelihood of misinterpretation when performing the test compared with MMT in which a different way of performing the test can be used (e.g., performing the test with or without phonation). As shown in the study of Adamus et al (2011) and Eberhart et al (2005), the increase in interobserver reliability to the Mallampati score could be another major advantage of ULBT. Third, ULBT considers several limitations related to traditional methods of airway assessment (Bukhari et al 2018).
ULBT also had several restrictions: it was not suitable for toothless patients and there was considerable racial disparity in human mandibular morphology and maxillary structures (Myneni et al 2010). This test is based on the upper lip mucosa, which is a soft tissue. The nature of the soft tissue profile is affected by many factors other than the skeletal hard tissue profile, including ethnicity. Therefore, ethnic differences should be considered when evaluating parameters related to soft tissues such as the ULBT (Kim et al 2019). For that, this test may not be suitable for certain population groups (Badheka et al 2016, Dawood et al 2021, Khan et al 2009, Myneni et al 2010, Safavi et al 2011, Shobha et al 2018) and its accuracy must be calculated separately for each population.
Our study had several limitations. First, as it was impossible to maintain blindness of the study group, the accuracy of this test, the IDS score could be intentionally increased because the anaesthetist knew the primary purpose of this study. However, the fact that the same anaesthetic procedure was used for all patients, the fact that the preoperative tests (MMT and ULBT) were assessed by the same anaesthetist, and the IDS and laryngoscopic view were assessed by another anaesthetist who was blinded to the preoperative tests may have minimised the investigator bias. Second, our study concerned only the elective surgical patients, and emergency patients were not considered. Even though the internal validity in the present study seemed adequate, it might not be applicable to all subgroups of the general population (e.g., patients for emergency caesarean sections or toothless patients).
In conclusion, although this study showed a higher PPV of ULBT compared with MMT, in MOP, the ULBT was a test with high specificity, NPV and Acc, making it a suitable test for detecting easy and difficult intubations and laryngoscopies in MOP. As Wilson (Wilson et al 1988) stated, ‘No test is likely to be perfect, therefore, it remains essential that every anaesthetist must be trained and equipped to deal with the much less common situation, unexpected failure to intubate’.
Footnotes
Appendix
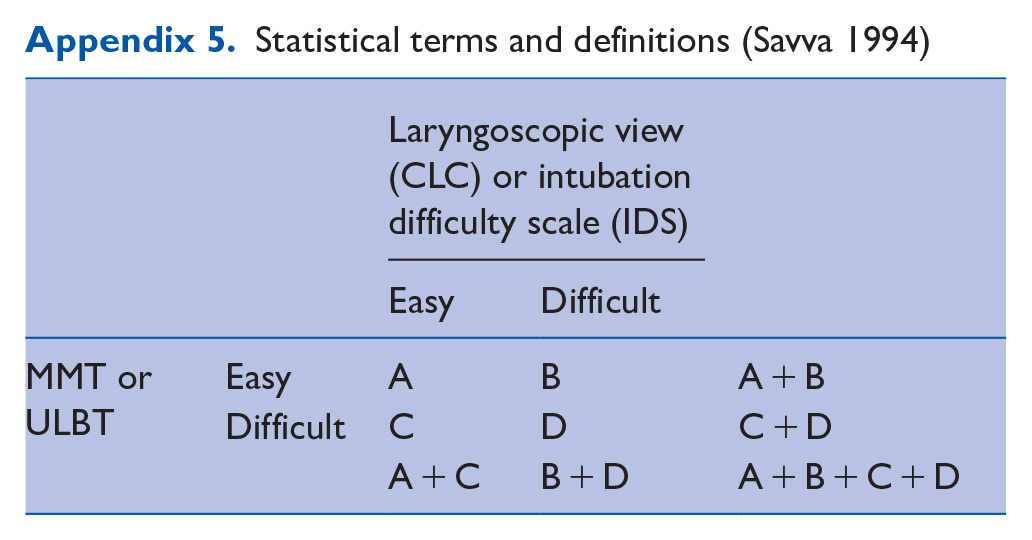
Statistical terms and definitions (Savva 1994)
| Laryngoscopic view (CLC) or intubation difficulty scale (IDS) | ||||
|---|---|---|---|---|
| Easy | Difficult | |||
| MMT or ULBT | Easy | A | B | A + B |
| Difficult | C | D | C + D | |
| A + C | B + D | A + B + C + D | ||
CLC: Cormack and Lehane classification.
True positive = a difficult laryngoscopy or intubation that had been predicted to be difficult (A).
False positive = an easy laryngoscopy or intubation that had been predicted to be difficult (B).
True negative = an easy laryngoscopy or intubation that had been predicted to be easy (D).
False negative = a difficult laryngoscopy or intubation that had been predicted to be easy (C).
Sensitivity = the percentage of correctly predicted difficult laryngoscopies or intubations as a proportion of all intubations that were truly difficult, i.e., true positives/(true positives + false negatives), A/(A + C).
Specificity = the percentage of correctly predicted easy laryngoscopies or intubations as a proportion of all intubations that were truly easy, i.e., true negatives/(true negatives + false positives), D/(B + D).
Positive predictive value = the percentage of correctly predicted difficult laryngoscopies or intubations as a proportion of all predicted difficult intubations, i.e., true positives/(true positives + false positives), A/(A + B).
Negative predictive value = the percentage of correctly predicted easy laryngoscopies or intubations as a proportion of all predicted easy intubations, i.e., true negatives/(true negatives + false negatives), D/(C + D).
Accuracy = the percentage of correctly predicted easy or difficult laryngoscopies or intubations as a proportion of all laryngoscopies or intubations, i.e., (true positives + true negatives)/(true positives + true negatives + false positives + false negatives), (A + D)/(A + B + C + D).
Likelihood ratio positive = Sensitivity/(1 − Specificity).
Likelihood ratio negative = (1 – Sensitivity)/Specificity.
AUC of a ROC-curve (area under a receiver operating characteristic curve) =, sensitivity × (1 – specificity)/2 + (sensitivity × specificity) + (1 – sensitivity) × specificity/2).
Acknowledgements
None.
Presentation
None.
Declaration of conflicting interests
The author(s) declared no potential conflicts of interest with respect to the research, authorship and/or publication of this article.
Funding
The author(s) received no financial support for the research, authorship and/or publication of this article.