
Abstract
The synthesis of MAX phases has been extensively investigated over the past two decades due to their unique mechanical and tribological properties. Theoretical calculations showed that Zr-based MAX phases possess a remarkable hardness and elastic modulus. Therefore, their fabrication is an interesting topic. MAX phases with the highest content of Zr2AlC phase can hardly obtained. Simultaneous synthesis and sintering of Zr2AlC MAX phases are a challenging issue. In this research, Zr2AlC was prepared through spark plasma sintering using different stoichiometries of ZrH2:Al:C, at 1100°C, 1225°C, and 1300°C. The optimum sintering condition for achieving a MAX phase with high amount of Zr2AlC (69.9 wt.%) was obtained by the stoichiometry of 2:1.3:0.95, at 1300°C, 30 min. Physical properties (density, porosity, and phase content) as well as hardness, and tribological properties of the sintered samples were also investigated through XRD, SEM, and EDS analysis. The stoichiometry of 2:0.8:1.2 showed the highest wear resistance.
Introduction
MAX phases are layered materials with a hexagonal structure. The general formula of these compounds is M n +1AX n .1–3 In this formula, “M” represents transition metals (metals on the left side of the central part of the periodic table); “A” displays elements of groups 12 to 16 of the periodic table (the right part of the periodic table), and the letter “X” illustrates carbon and/or nitrogen elements.4–6 This group of materials exhibits the properties of metals, such as flexibility, high toughness, and machinability. On the other hand, they possess the properties of ceramics, such as low density, high elastic modulus, and considerable wear, corrosion, and oxidation resistance.6–8
Zirconium carbide (ZrC) due to its desirable properties such as high melting point, considerable hardness, and improved mechanical properties is widely used in various industries. MAX phases of the Zr-Al-C system, including Zr3AlC2 and Zr2AlC, can also be employed as structural materials in various industries, including aerospace and automotive, many advanced applications such as electronic devices, thermal radiators, high temperature compounds, as a protective coating to enhance the wear resistance, oxidation resistance, and corrosion resistance of various substrates, and also as precursors for synthesizing tribo-corrosion and -oxidation protection MXenes films.4,6,9
For the first time, Lapaw et al. 10 investigated the synthesis and sintering of the Zr3AlC2 MAX phase by hot pressing. For this purpose, they mixed the primary powders (ZrH2:Al:C) with a stoichiometric ratio of 2:0.8:1.2 to achieve a Zr3AlC2 phase; then they cold pressed the mixed dried powders under a pressure of 20 MPa, followed by hot pressing at three temperatures of 1475°, 1525°, and 1575°C. However, instead of Zr3AlC2, they achieved Zr2AlC MAX phase with a purity of about 67 wt.%. In another study, 11 this group tried to achieve the Zr3AlC2 MAX phase (M3AC2) based on the stoichiometry of 1.95:0.94:3 of the same raw materials (M4AC3). The prepared mixed powders were hot pressed at the temperature of 1500°C for 30 min. They obtained 61 wt.% Zr3AlC2 phases, in accordance with a lower amount of ZrC and ZrAl2 phases.
In a separate study, Kara et al. 12 mixed ZrH2:Al:C powders with a stoichiometric ratio of 2:0.8:1.2 for 1 h to synthesize Zr2AlC. After drying, the mixed powders were hot pressed at the temperature of 1200°C for 1 h. They obtained about 67 wt.% Zr2AlC and 33 wt.% ZrC phases. The effect of sintering temperature to synthesize zirconium-based MAX phase by self-combustion synthesis (SHS) method was studied by Kovalo et al. 13 They mixed the Zr:Al:C powders with the molar ratio of 2:1:1 in air for 1 h. In their research, the desired MAX phase was not achieved due to the improper milling conditions and low sintering temperature. In a recent study, 14 Perevislov et al. attempted to fabricate Zr2AlC and Zr3AlC2 by a combined method (high temperature sintering + SPS). However, their optimal synthesis temperature was 1525°C and the purity of the Zr2AlC MAX phase was not satisfactory (52.8 vol.%).
Most of the conducted studies on the synthesis of Zr2AlC MAX phase were carried out by hot pressing or SHS methods. Up to our knowledge, fewer studies have been reported on the synthesis and sintering of Zr2AlC MAX phase through SPS method. Therefore, we tried to reach Zr2AlC MAX phase using SPS. Since the formation of Zr-Al-C MAX phase is strongly dependent on the stoichiometric ratio of starting materials, different ratios of raw materials were examined in this study to attain a high percentage of MAX phase in the final body. Also, SPS temperature was changed to achieve the optimum conditions for the sintering and synthesizing of this MAX phase. The effects of the mentioned variables on the microstructure, phase composition, hardness, and finally, wear resistance of the prepared samples have been investigated. So far, the wear behaviour of Zr2AlC MAX phase has not been reported yet.
Materials and methods
Raw materials
High purity commercial powders including zirconium hydride (ZrH2, Merck No.7704–99–6, d90 of 45.0 µm, 99%), aluminium (Al, Merck No. 7429–90–5, d90 of 5.0 µm, 99%), and fine activated carbon powder (C, Merck No. 7440–44–0, d90 of <100.0 µm, >98%) were used as raw materials in this research. SEM micrographs of the starting powders are shown in Fig. 1. As can be seen in Fig. 1(a), zirconium hydride powder has an irregular shape (with an average particle size of about 6.0 µm). The morphology of Al powder is spherical and its average particle size is about 1.2 µm (Fig. 1(b)). The morphology of flake graphite powder is also shown in Fig. 1(c).
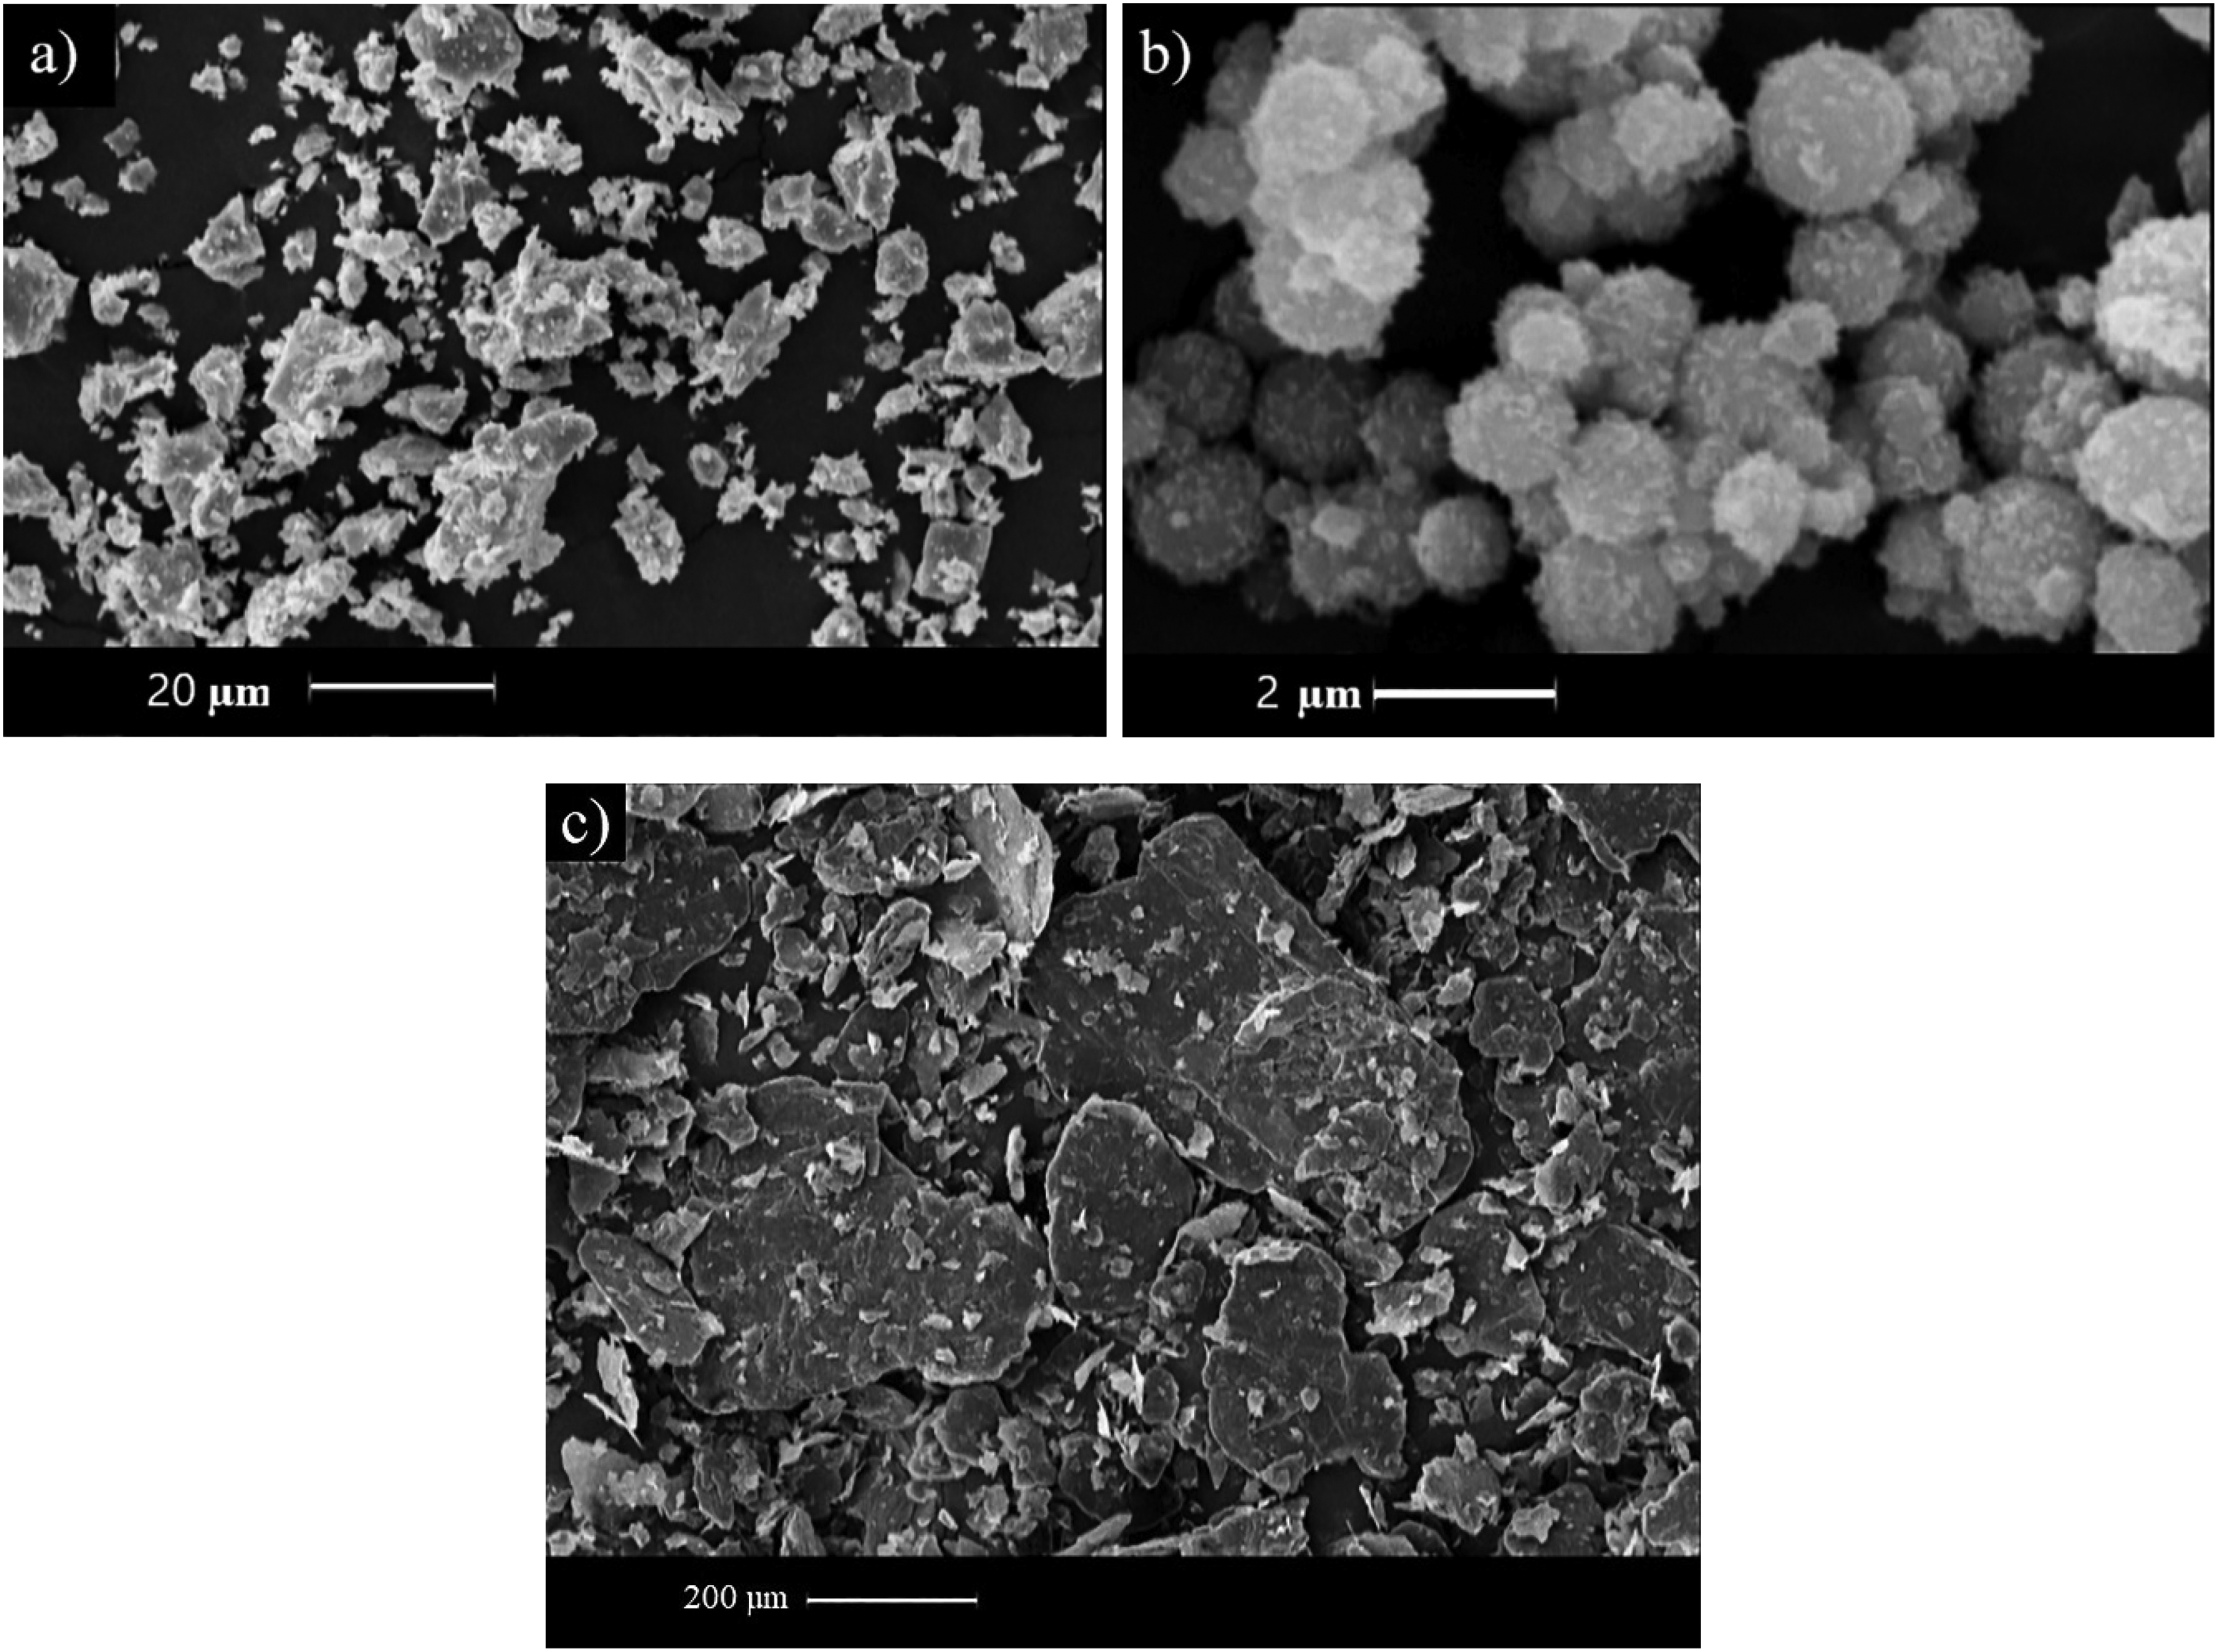
FESEM micrographs of the starting powders; (a) ZrH2, (b) Al, and (c) C powders.
Sample preparation, mechanical milling, and sintering
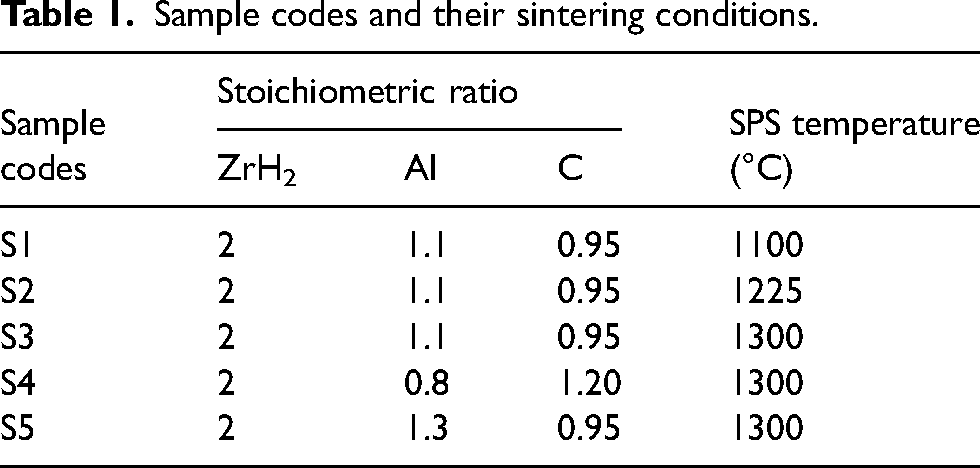
The theoretical stoichiometric ratio of Zr:Al:C in Zr2AlC MAX phase is 2:1:1. Therefore, three molar ratios of ZrH2:Al:C of 2:1.1:0.95 (S1, S2, and S3 samples), 2:0.8:1.2 (S4 sample), and 2:1.3:0.95 (S5 sample) were considered in this study (Table 1). According to the previous study, 13 it seems that the evaporation of Al during sintering and its wasting during the milling process cannot be avoided. Therefore, similar to our previous study, 6 the amount of aluminium was set more than that of the stoichiometric value (S1, S2, S3 samples). The stoichiometry of S4 sample was considered according to previous study, 6 to compare the effect of higher graphite content on the purity of Zr2AlC phase. Finally, due to the high SPS temperature which leads to considerable aluminium evaporation, the stoichiometry of 2:1.3:0.95 (extra amount of Al) was set for S5 sample (Table 1). The process of mechanical milling was done in a high-energy planetary ball mill machine (MITR-YXQM-2L) with stainless steel cup (250 cc) and balls, in different sizes, under argon gas (99%), for 8 h. The ball to powder weight ratio was considered as 10 to 1 and the milling speed was set at 250 rpm. According to previous experiences, 6 it is well known that longer milling time results in Al evaporation and sticking of powders to the wall of the cup, that can lead to the deviation from the desired stoichiometries of starting powders. Also, it has been shown that 15 longer milling times lower the purity of the final products.
Sample codes and their sintering conditions.
After the milling process, the milled powders were sintered by the SPS equipment (Labox 225) at 1100, 1225, and 1300°C for 30 min in a high vacuum condition (10−1 Pa). The graphite die with 15 mm diameter and 10 mm thickness was used in this process. A heating rate of 100°C/min and a pressure of 30 MPa were considered for this process. 15 The on-off pulsed current pattern of SPS processing was 12–2.
Characterization of the sintered samples
After the SPS process, the surfaces of the samples were sanded to remove graphite foils. At least three samples (with 15 mm diameter and 6 mm thickness) were used for each test. The density and apparent porosity of samples were measured by Archimedes method according to the ASTM B962–17 standard. 16 Phase composition of the sintered samples was identified by XRD analysis (X-ray diffractometer, Philips PW3710). The content of each constituent after sintering was estimated by Rietveld refinement analysis. Crystalline phase specification was obtained with the X’pert High Score Plus software and using ICDD (International Centre for Diffraction Data) database. Rietveld refinement analysis was used to calculate weight percentages accurately and to determine the crystallographic information of the phases. The standard cards for the refinement of Zr2AlC and ZrC phases were used (98–011–0247) and (74–1221), respectively. It is widely recognized that the effectiveness of Rietveld refinement can be evaluated through two parameters, namely “Sigma” and “R” values. Throughout the Rietveld analysis undertaken in this investigation, the Sigma and R values consistently fell below 2 and 10, respectively, affirming the credibility of the quantitative analysis. Furthermore, all peaks were well covered by the CIF cards of related phases.
To investigate the microstructure of the sintered samples, a field emission scanning electron microscope (FESEM, TESCAN FESEM MIRA II-LMU) equipped with energy dispersive spectrometry (EDS) was used. Also, average grain size was measured through Image J software.
Vickers hardness values of the samples were measured by a force of 30 N for 5 s (ASTM 92–82). 17 An average of five indentations were considered for the hardness value. The dry sliding wear test was performed at room temperature by the pin on disc method according to ASTM G99–05 . 18 The wear tests parameters were selected according to our previous studies.6,15 The used pin was tungsten carbide (WC) which has a hardness of 75 HRC and 10 mm diameter. The specimens were prepared in the form of discs with a diameter of 15 mm and height of 5 mm, for the wear test. The distance of the WC pin from the center of samples was adjusted to be 3 mm. The applied normal load was 30 N. The sliding distance for all samples was 100 m (3287 turns). The volume loss due to wear of the samples in the tests was calculated based on the Equations V = πRd3/6r (mm3), Wear rate = V/N.S (mm3/N.m). 18 In these Equations, “V” is the wear volume, “R” is the radius of the wear path (3 mm), “d” is the width of the wear path, “r” is the radius of the pin (5 mm), “N” is the normal load (30 N), and “S” is the sliding distance (100 m). After the wear test, wear mechanisms of the samples were examined by FESEM-EDS analysis.
Results and discussion
Sample preparation: mechanical milling
Figure 2(a) shows the XRD patterns of the milled and unmilled powders (ZrH2, Al, and C) with the stoichiometry of 2:0.8:1.2. It should be noted that with 8 h of milling, similar to other MAX phases,6,15 no peaks related to intermetallic compounds of Zr-Al system or other similar compounds were observed in the powder mixture. This shows that the alloying did not occur during the ball milling process. One of the advantages of the milling process is the increase of the energy of the powder mixture which facilitates the chemical reactions.10,11 By a more precise look, it can be deduced that after 8 h of milling, the peaks were slightly widened; which is the result of the internal stress and crystallite size reduction during the milling. 6 It can be seen that the C peaks have disappeared after 8 h of milling. The disappearance of graphite peaks has been attributed to its amorphous nature after milling and also decreasing its particle size. 19
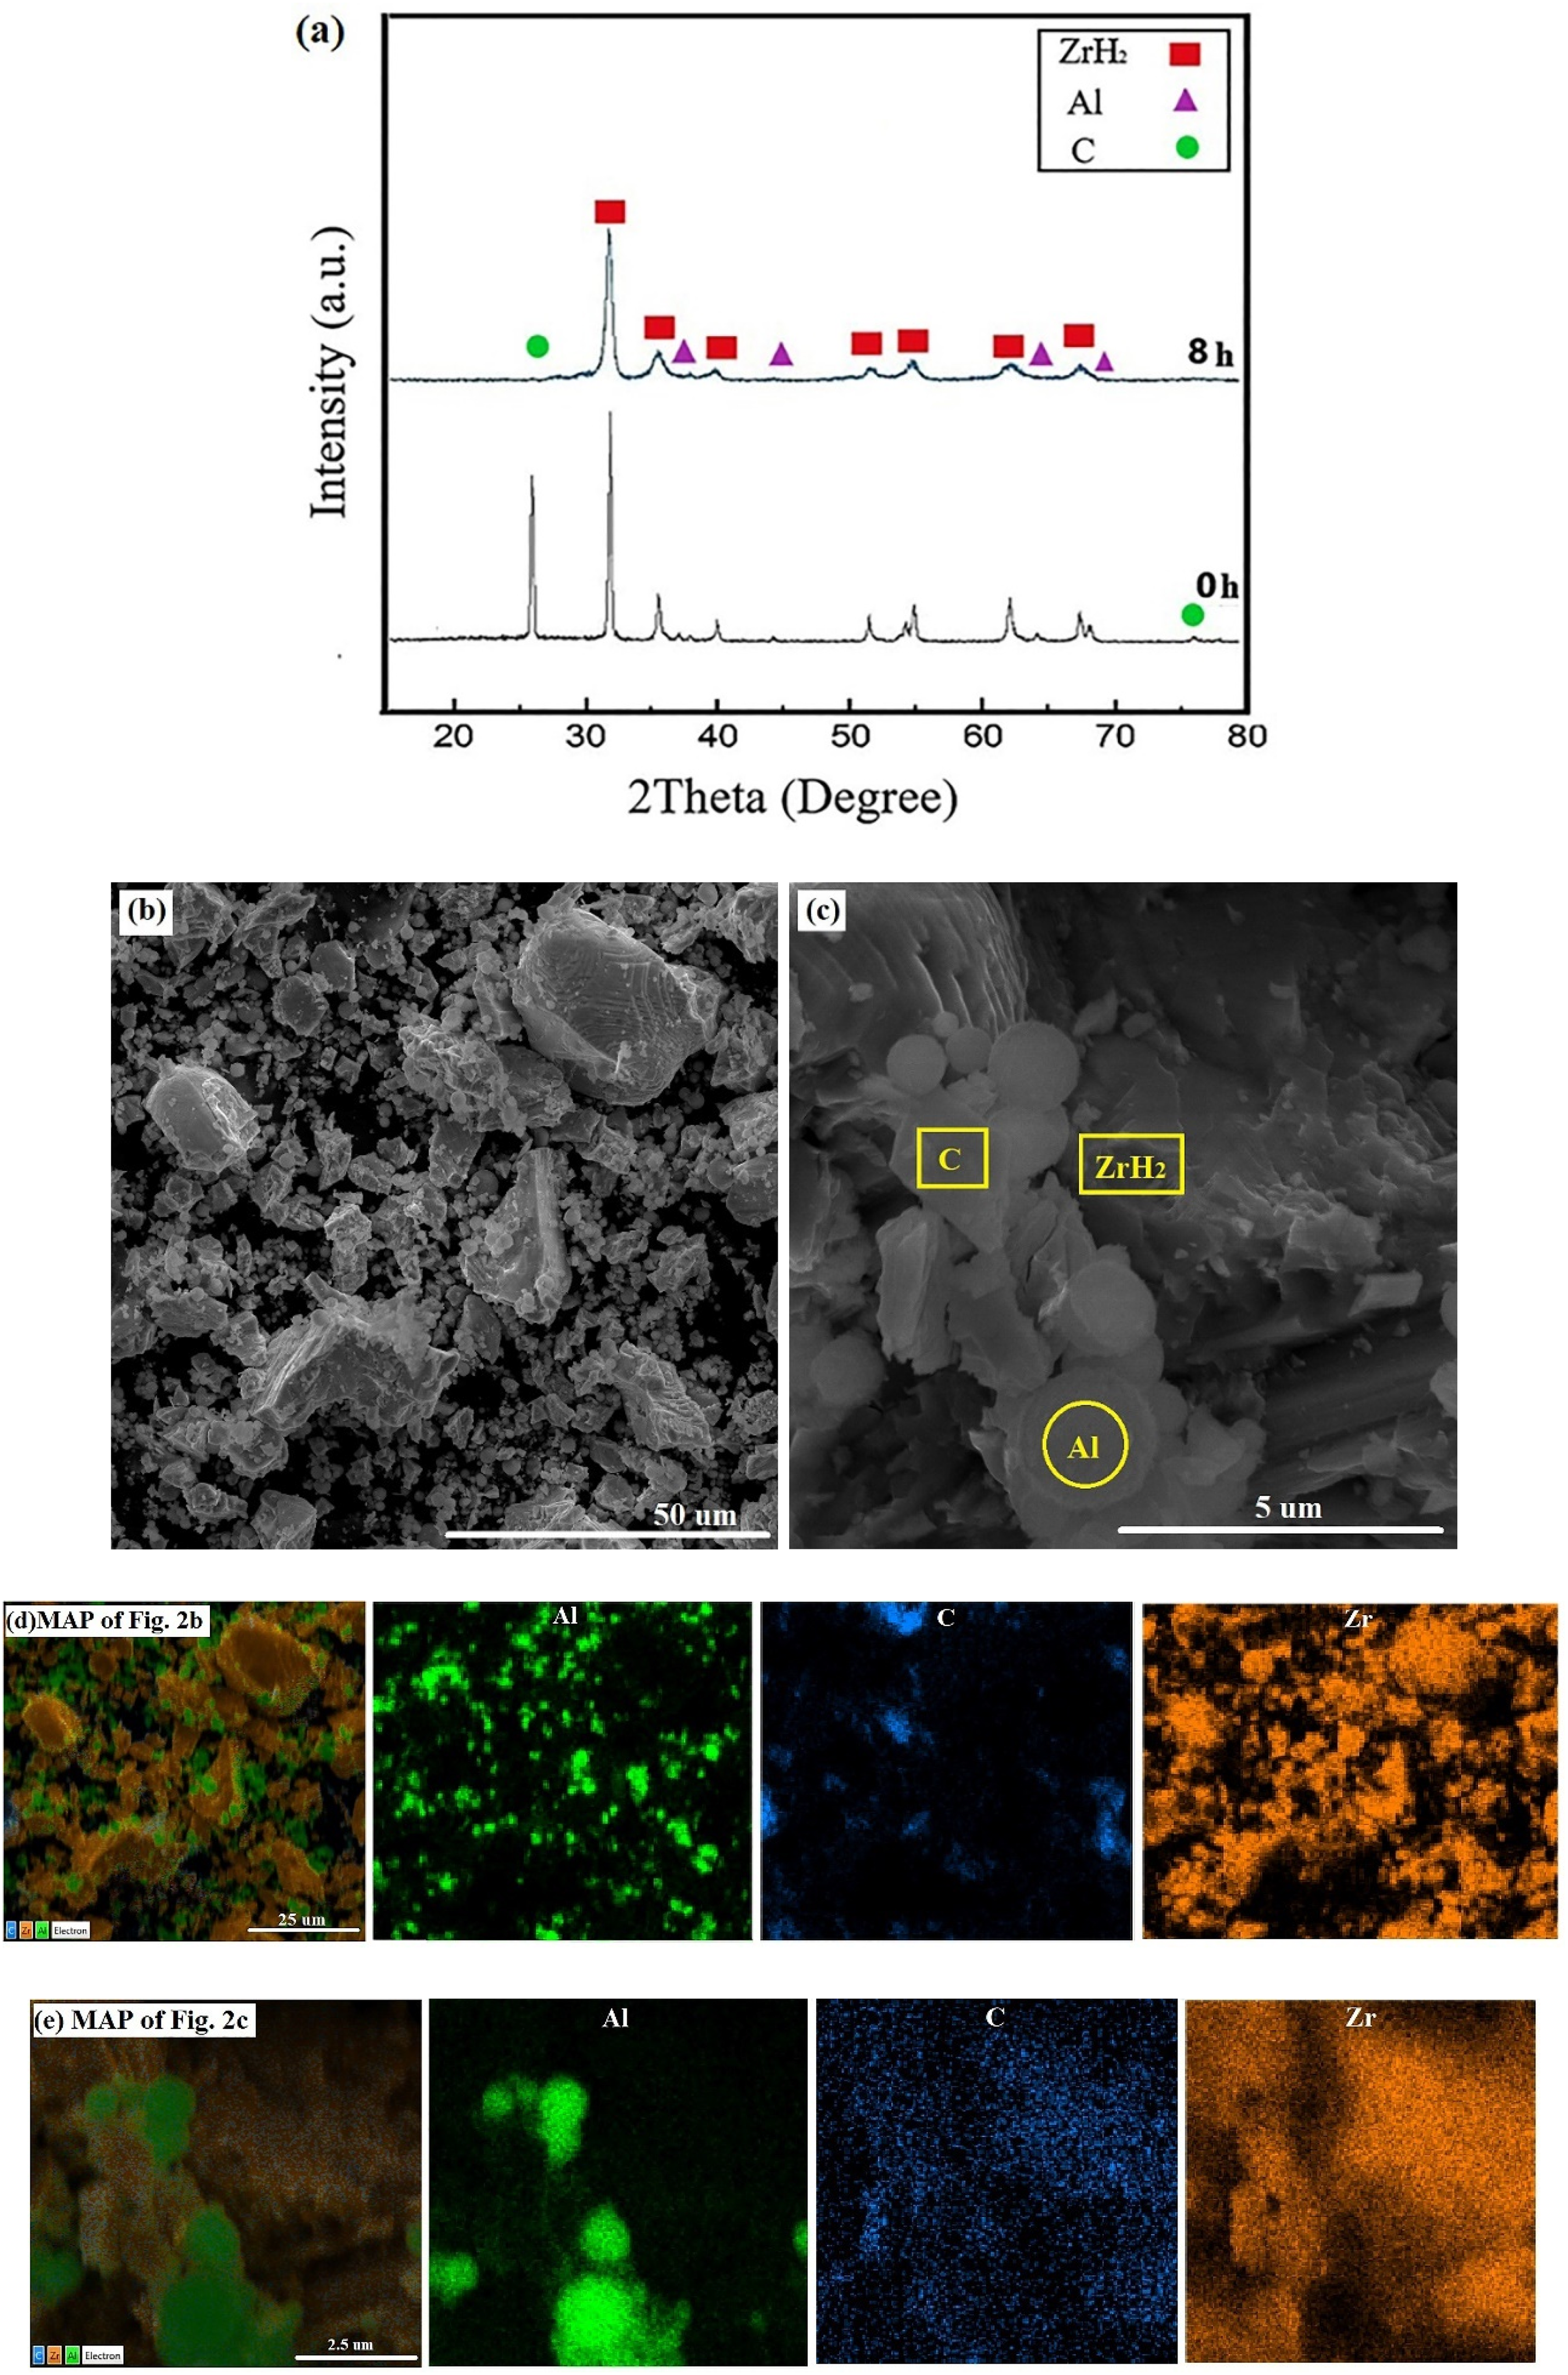
(a) XRD patterns of the unmilled (0 h) and milled (8 h) ZrH2-Al-C powders mixture; (b and c) FESEM micrographs of the powder mixture after 8 h of milling:(d) MAP analysis of Fig. 2(b), (e) MAP analysis of Fig. 2(c).
Figures 2(b) and (c) show the SEM micrographs of the powder mixture after 8 h of mechanical milling. Considering Fig. 1, prior to the milling process, the particles of each raw material have different morphologies and various sizes. However, the morphology of the milled powder is more homogeneous, and the mixed powders are well-distributed. This can be also confirmed through the MAP analysis of Fig. 2(b). Figure 2(d) shows that Zr, Al, and C elements are in close proximity to each other. As measured with the aid of image analysis, the average particle size of the milled powders reached less than 5.0 µm. The comparison of Figs. 1 and 2(b), (c) confirms that particle size refinement has occurred during the milling process. This refinement can facilitate the sintering process via the increment of dislocations and grain boundaries which are preferred paths for the element's diffusion.20,21
Phase analysis of the sintered samples
Influence of sintering temperature on the formation of Zr2AlC phase
This is the first time to study the synthesizing of Zr2AlC through SPS. Therefore, in the first try, according to the previous work, 6 the SPS temperature and the stoichiometric ratio were considered as 1100°C and 2:1.1:0.95, respectively (S1 sample). As an initial experiment, the sintering temperature of S1 sample (1100°C) results in a high porosity (14%) and insufficient strength. Since the sintering process was incomplete at the temperature of 1100°C for the Zr2AlC samples, S1 sample was not considered in the rest of the study. Therefore, to achieve a higher consolidation, the SPS temperature was increased to 1225° (S2) and 1300°C (S3). In Fig. 3, the XRD patterns of the sintered samples at two different ranges have been presented. As can be seen, the main phases of S2 and S3 samples are Zr2AlC and ZrC. Also, it is evident that increasing the sintering temperature from 1225° to 1300°C enhances the intensity of Zr2AlC peaks (2θ=34.7° and 37.5°), and decreases the intensity of ZrC peaks (2θ=31.5° and 34.0°). This shows the positive effect of SPS temperature increment on the formation of the Zr2AlC phase and reduction of the ZrC by-product phase. Increasing the SPS temperature (more than 1300°C) may result in the evaporation of Al, and reduction of the Zr2AlC phase content.
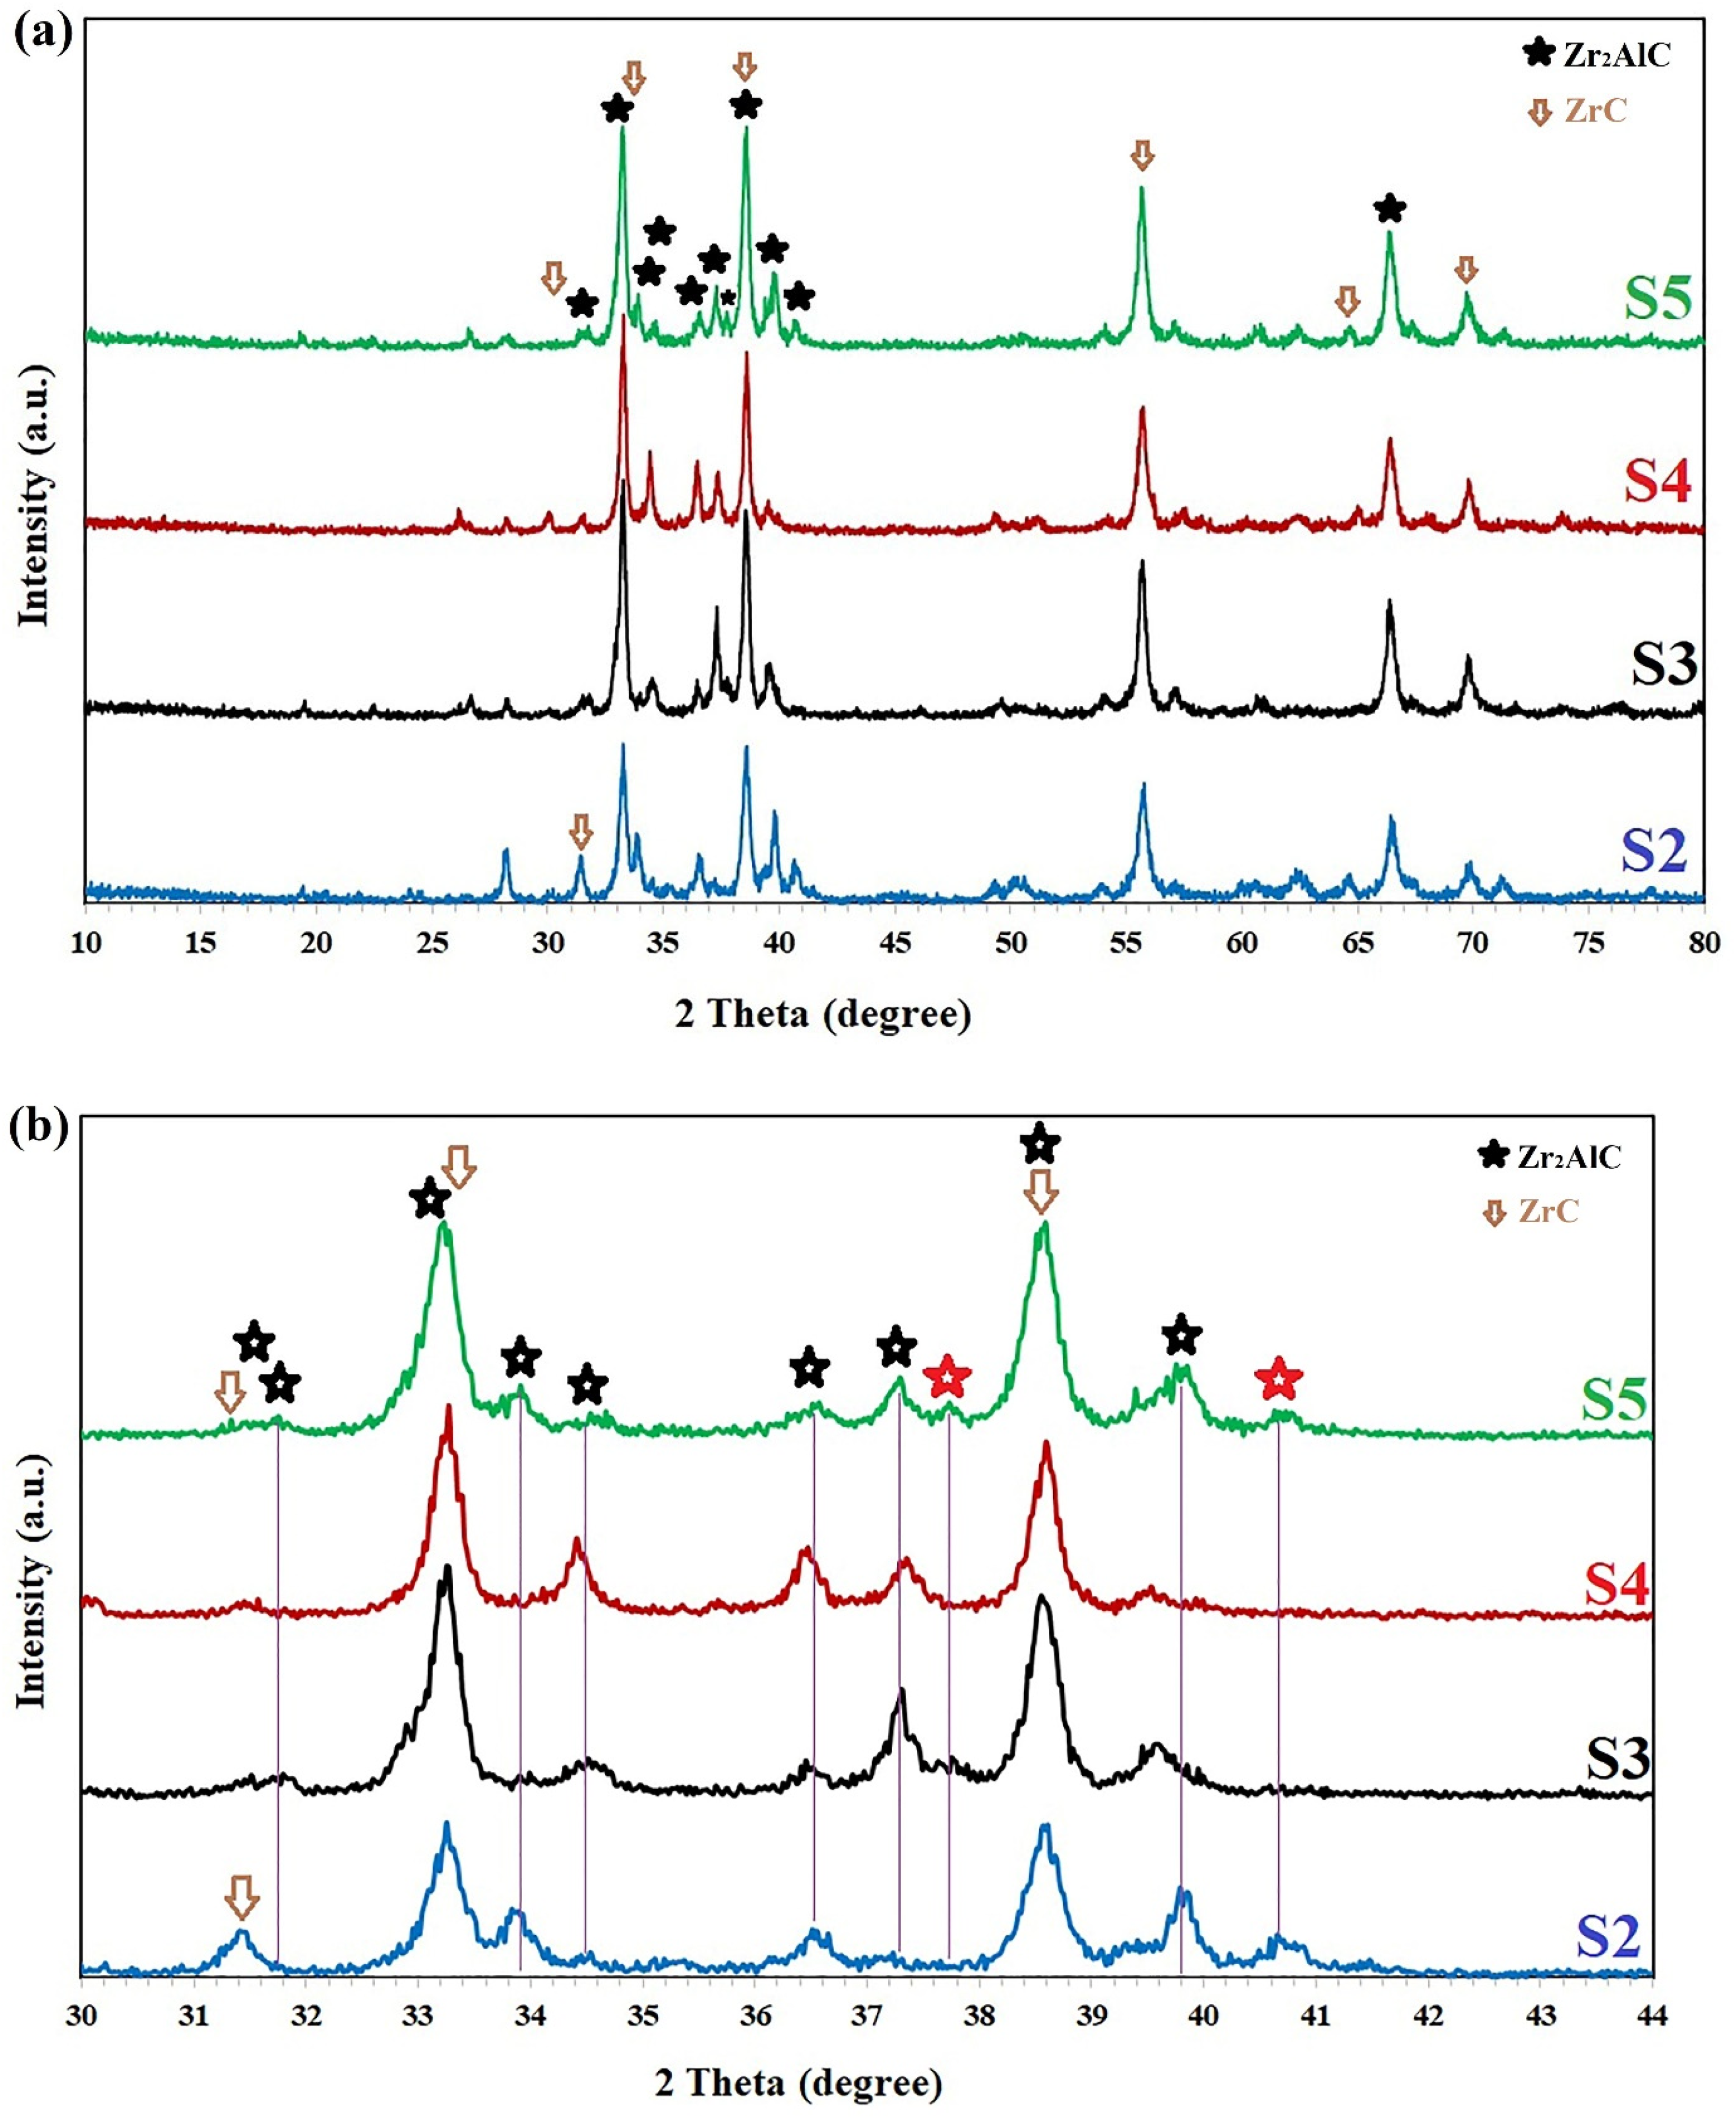
XRD patterns of the sintered samples in two magnifications.
To assess the phase contents of the samples, Rietveld refinement analysis was performed and the refined patterns were represented in Fig. 4. The provided refined patterns approve the great compatibility between the experimental and calculated curves which confirm the reliability of the obtained results from this analysis. According to this analysis, it was found that increasing the SPS temperature from 1225°C (S2 sample) to 1300°C (S3 sample) enhances Zr2AlC content from 37.0 wt.% to 61.6 wt.%. It should be noted that according to reaction 1 and the related thermodynamic data,13,14 increasing SPS temperature can facilitate the Zr2AlC phase formation
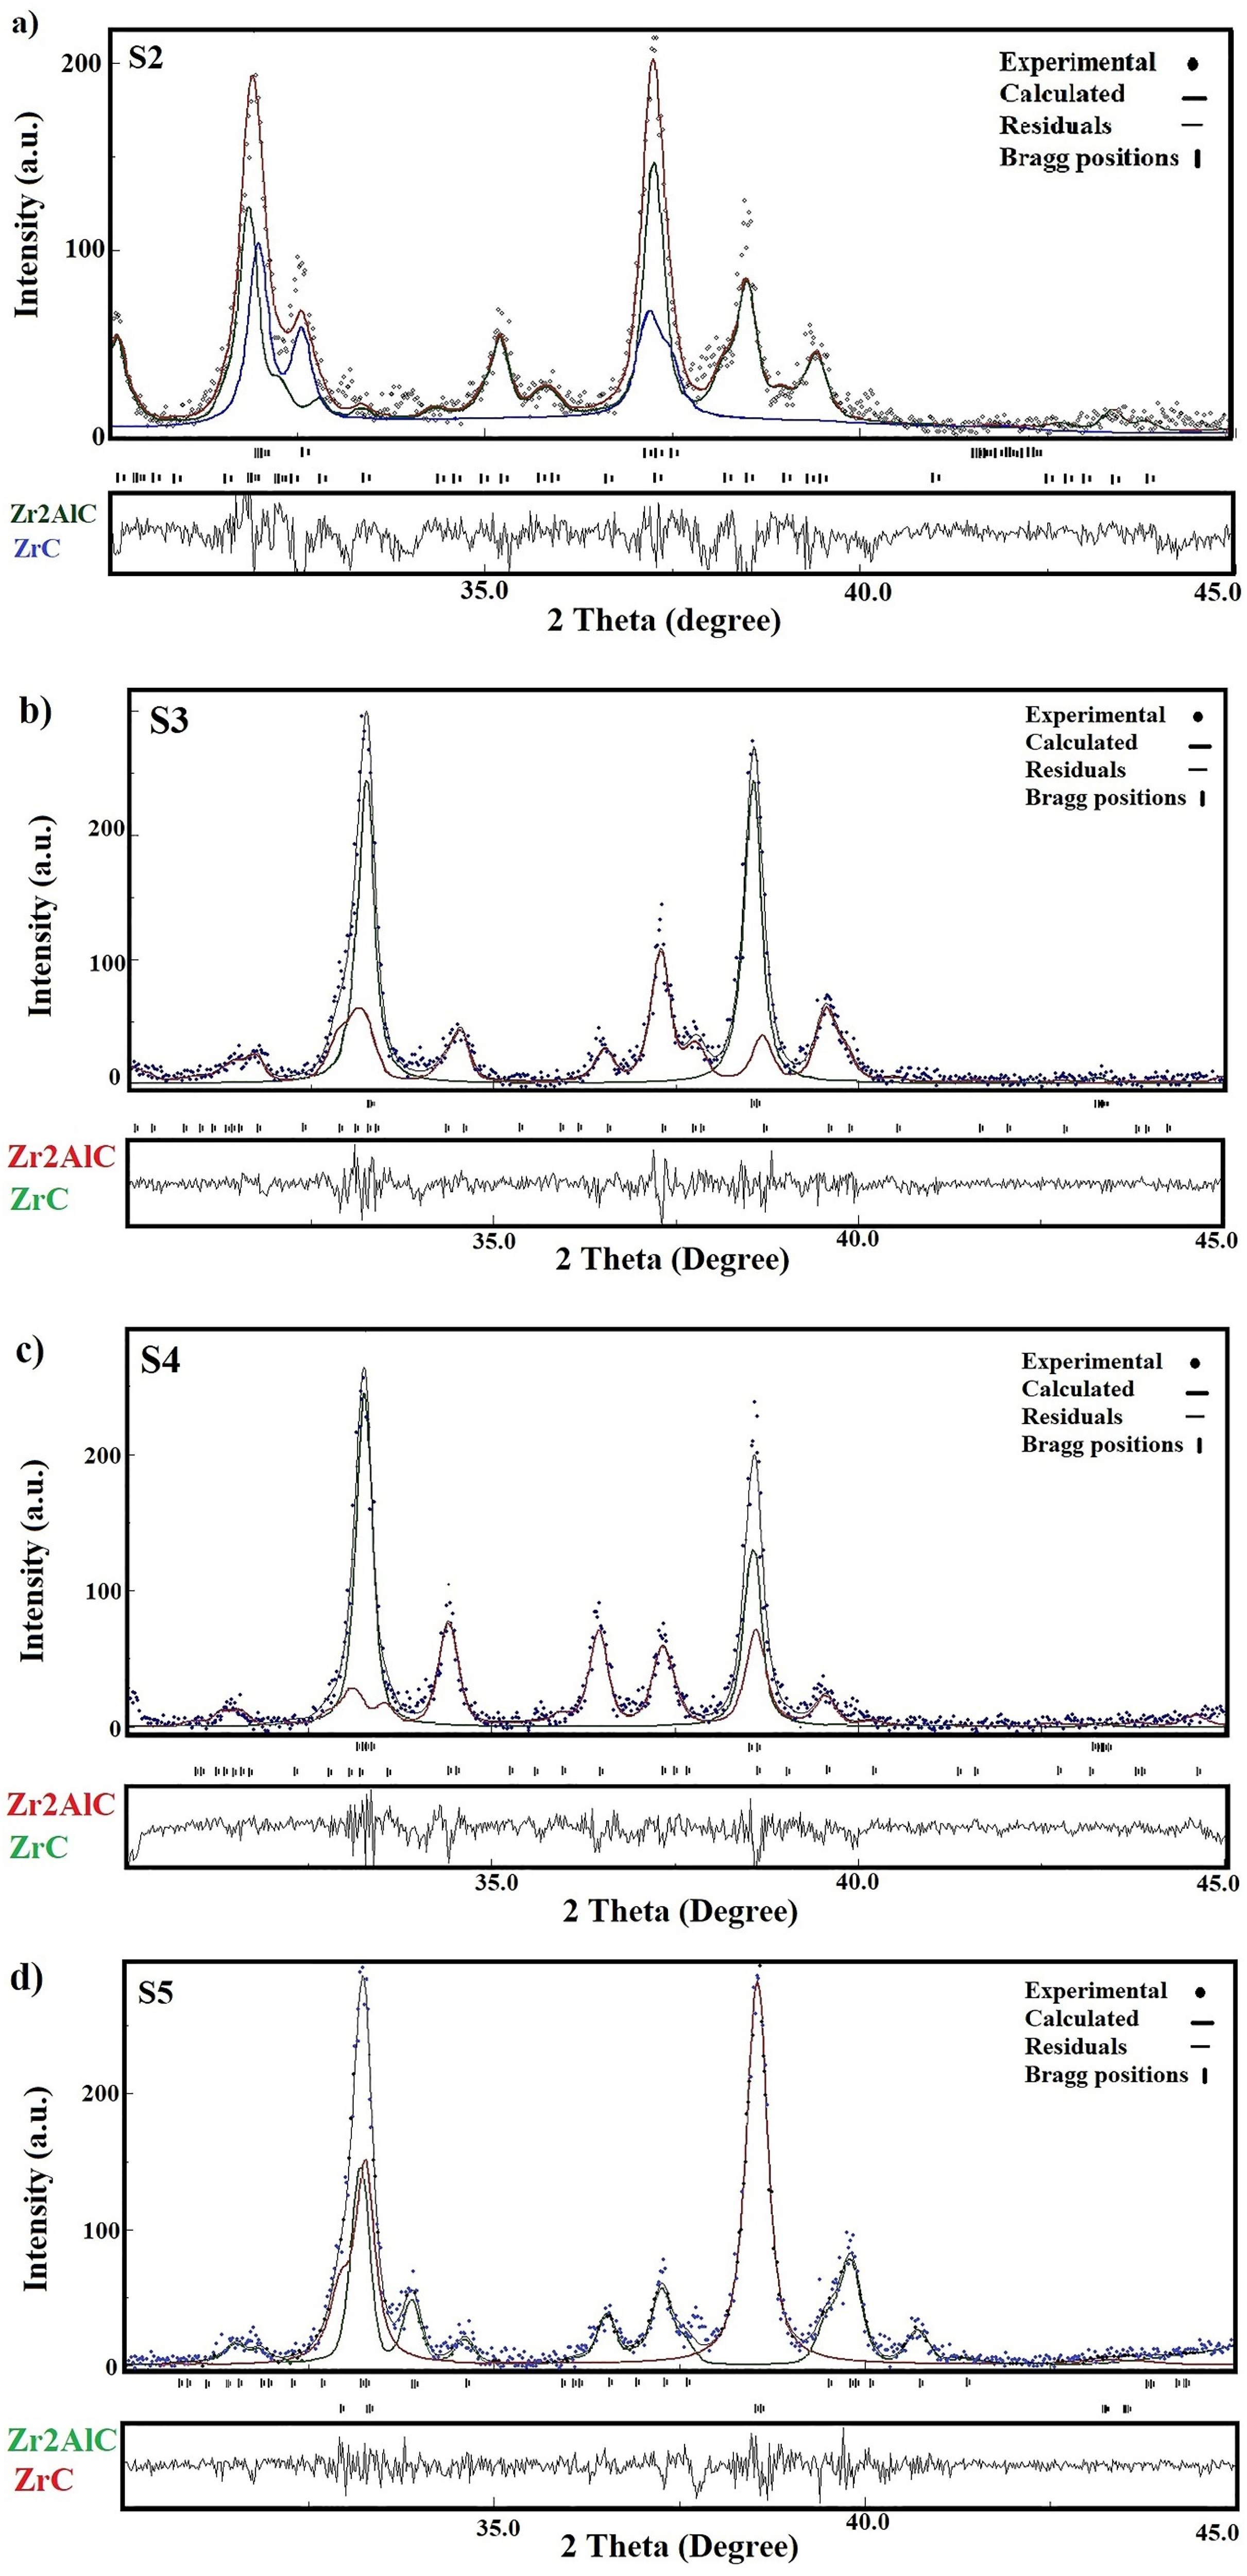
Rietveld refined XRD patterns of (a) S2, (b) S3, (c) S4, and (d) S5 samples.
2Zr + Al + C → Zr2AlC Reaction 1 13
Effect of the starting materials stoichiometry on the formation of Zr2AlC phase
To investigate the effect of the stoichiometric ratio of raw materials on the formation of the Zr2AlC MAX phase, extra graphite and extra Al (more than the stoichiometric ratio) were considered in S4 and S5 samples, respectively. The XRD patterns of these samples at the temperature of 1300°C for 30 min are shown in Fig. 3.
According to Fig. 3, by increasing the stoichiometric ratio of graphite to 1.2 (S4 sample), the amounts of ZrC (39.1 wt.%) and Zr2AlC phases (60.9 wt.%) did not change remarkably, in comparison to S3 sample. This means that higher amount of graphite did not help the formation of Zr2AlC. In fact, increasing the amount of carbon aids in the formation of the ZrC phase within the structure. On the other hand, in the presence of excess carbon at high sintering temperature, aluminium evaporates from the structure, eventually reducing the formation of the Zr2AlC MAX phase. According to reaction 2 (Ref. 13 ) at 1300°C, MAX phase decomposes into ZrC and intermetallic.
3Zr2AlC + 2C → 5ZrC + ZrAl2 + Al(g) Reaction 2 13
Also, with the increment of the fraction of Al from 1.1 to 1.3 (S5 sample), the amount of Zr2AlC phase has been further increased (69.9 wt.%). The intensity of the Zr2AlC peaks was increased compared to S3 and S4 samples, and interestingly, two new peaks of this MAX phase also appeared in the related XRD patterns (at the angles of about 2θ=38.0° and 41.0°). This shows that the formation of Zr2AlC and the growth of its relevant planes have been increased with the enhancement of Al in the starting powders. Surprisingly, the amount of ZrC phase has been obtained as low as 30.1 wt.% (lower than the previous study 10 ). The highest reported content for Zr2AlC in Ref. 10 at the optimum hot-pressing temperature of 1525°C was 67 wt.%. Also, Perevislov et al. 14 achieved 52.8 vol.% of Zr2AlC (46.5 wt.%) at the optimum condition.
Due to the probability of aluminium evaporation during the SPS process, the formation of ZrC was favoured in S3 and S4 samples. However, in S5 sample which contains 30 wt.% excessive aluminium, Zr2AlC fraction has been increased which approves the positive influence of this parameter on the purity of samples.
Lattice parameter is an important factor in diffusion and phase formation. Standard lattice parameter of ZrC phase is 4.72 Å 22 ; this value was calculated as 4.66, 4.64, and 4.63 Å for the sintered S3, S4, and S5 samples, respectively. The lattice parameter of ZrC was decreased in S3 sample perhaps due to the diffusion of Al atoms in the cubic structure of the ZrC phase. The Zr–Zr and Zr–C bonding lengths in cubic ZrC are 3.17 and 2.36 Å, respectively 23 ; and it seems that by the presence of Al, the structure was contracted (Zr–Al bonding length is 3.06 Å 24 ). This trend is also dominant for the other samples. Since the standard lattice parameter of Zr2AlC (4.60 Å) is lower than that of ZrC, 24 it suggests that the presence of Al atoms leads to the gradual contraction of ZrC structure until the formation of Zr2AlC MAX phase. Al atoms encouraged the transformation of larger ZrC lattice structure to smaller Zr2AlC. This can be the reason for the gradual decrease of lattice parameters in S4 and S5 samples.
Microstructure of the sintered Zr2AlC samples
Figure 5 shows the SEM micrographs of the sintered samples. As can be seen in Fig. 5, there are two main contrasts, light and dark grains in the microstructure of the samples, which were detected by EDS analysis. Based on the EDS results, it can be said that (B) area is Zr2AlC phase (Fig. 5(e)). On the other hand, point (C) or dark areas correspond to ZrC phase (Fig. 5(f)). EDS analysis also confirmed that some of these dark spots are rich in C element (Fig. 5(g)). It should be noted that S4 sample contains higher fractions of these dark areas (for example:Point G, Fig. 5(c)). In other research, 10 Zr2AlC MAX phase has been synthesized along with some secondary phases such as intermetallic compounds (Zr2Al3) and ZrC phase. However, the intermetallic compounds were not observed in this study. It should be noted that in the EDS result of point C (ZrC phase), small amounts of Al element are also present, in addition to Zr and C elements. This may be due to the diffusive nature of the formation process of this MAX phase. In fact, ZrC grains would not be pure and usually contain some amounts of Al. Table 2 shows the atomic percentage of elements of ZrC, and also the Zr/Al ratio in the synthesized MAX phases. The presence of Al can be seen in ZrC phase; also, Zr/Al ratio of the samples was observed close to the ideal theoretical ratio (2). However, this ratio was higher in S5 sample which possesses more Zr2AlC MAX phase.

SEM micrographs of the sintered samples (a) S2, (b) S3, (c) S4, and (d) S5; and the related EDS analysis of (e) point B, (f) point C, and (g) point G.
Elements in ZrC phase (at.%), and Zr/Al ratio of Zr2AlC* related to Fig. 6.
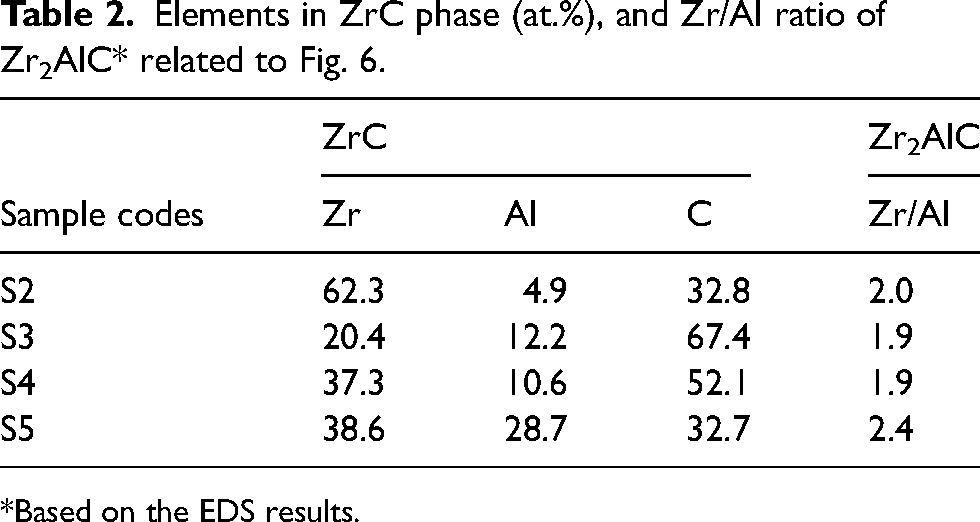
*Based on the EDS results.
EDS data of different points have been analysed in different samples and revealed that about 10–20 at. % of oxygen element was detected in the samples; the origin of the oxygen can be attributed to several factors. MAX phases are susceptible to oxygen incorporation. Oxygen can be incorporated into MAX phases during their synthesis (from the starting materials or the atmosphere) or through exposure to the environment.
This fact was more detailed by the investigation of microstructure of samples in higher magnification (Fig. 6). Figure 6(a) shows two gray grains of S3 sample which are somehow formed in concentric circles or flower-like structures. This feature indicates the diffusive nature of the formation of this MAX phase. These regions are Zr2AlC MAX phases with different ratios of Zr/Al/C.

Higher magnification FESEM micrographs taken from (a) S3, (b) S4, (c) S5, (d) fracture surface of S4 sample.
It can be seen in Fig. 6(b) that the matrix of the S4 sample consists of two kinds of dark and light gray regions (labeled as Z1 and Z2, respectively), as well as black spots (rich in graphite, point G). EDS analysis of these two areas showed the combination of Zr, Al, and a high amount of C elements (more than 50 at.%). It can be seen that the size of the light regions (Z2) in S4 sample is much larger than S3 and they surrounded the dark phases (Z1). EDS analysis of Z1 region (Point 2 of Table 3) is similar to ZrC which is not yet reacted by Al to form a MAX phase, and Z2 region indicates the Zr2AlC phase (points 1 and 3). It supposes that Al diffused to the ZrC grains and formed the MAX phase, however, the amount of Al was insufficient and the core (Z1) of the MAX phase (Z2) remained less reacted.
Atomic % of elements in different areas of S3, S4, and S5 samples.
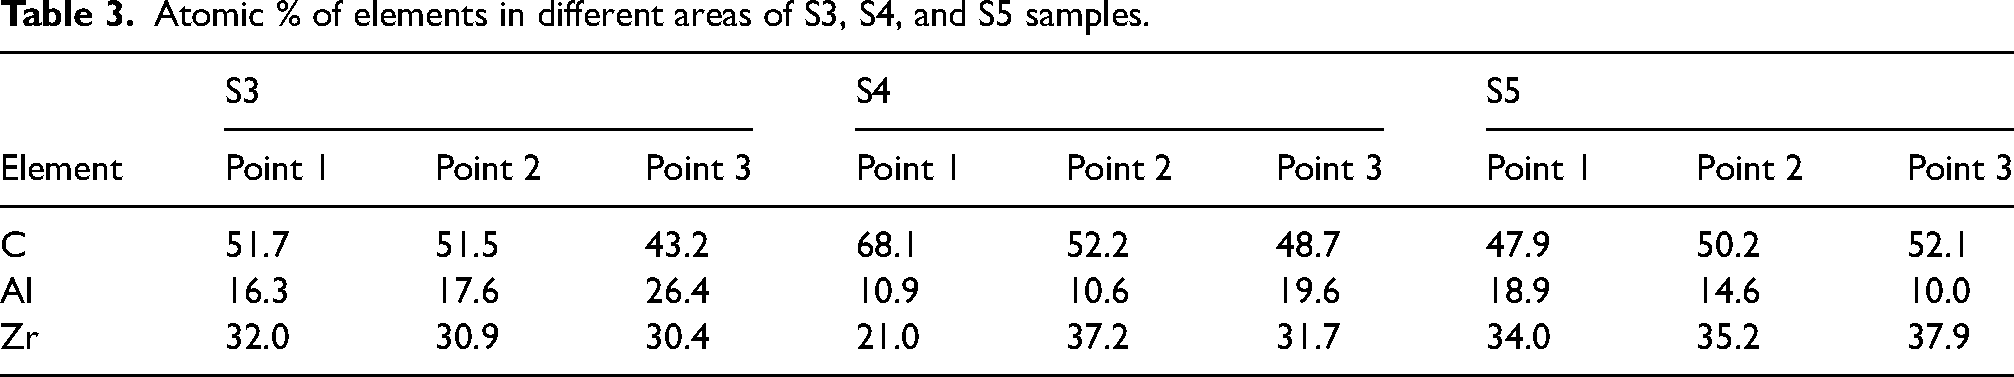
Figure 6(c) shows a completely different feature of S5 sample; dark graphite-rich areas are rarely observed and the size of the Z2 phase is much smaller than the other samples. EDS analysis indicated that the dark phase has the same EDS analysis as Z1 (Point 3 of S5); they are ZrC, but with a higher amount of Al element (Al-doped ZrC). On the other hand, gray phases are the MAX phase and the white areas which surround the gray grains, are rich in Al element. Sufficient Al content is clear in Fig. 6(c) (white areas). Also, Fig. S1 (Appendix) is presented to clarify the distribution of different phases of S3, S4, and S5 samples. This micrographs were analysed through Anix Image analyser software. The presence of MAX phase with various Zr/Al ratio is clarified through different colours. Figure 6(d) shows the fracture surfaces and laminar structure of the synthesized MAX phase. This micrograph was taken from the rough surface of S4 sample. Laminar structure (HCP structure) is the characteristic nature of MAX phases as also detected for Ti2AlC and Cr2AlC. 15
Figure 7 shows the MAP analysis of the SEM micrograph of S5 sample. Distributions of zirconium (Zr) and aluminium (Al) elements are relatively uniform in the microstructure of this samples. The lack of ZrC phase is visible which confirms the EDS results.

MAP analysis of S5 sample; distribution of Zr, Al, and C elements.
Densification of the sintered samples
Figure 8 shows the relative displacement of piston and temperature during SPS process of the samples. A positive displacement of the upper piston indicates shrinkage of the system which can be due to the densification of the sample. Based on Fig. 8, three stages can be distinguished in the displacement curves of the samples:
(I) Stage one:First stage indicates very low sintering rate and little shrinkage which are due to the removal of gases and displacement of powders. This shrinkage of S5 sample happened faster than the others which can be attributed to the higher content of Al and its improved activation. (II) Stage two:The main shrinkage of the sintering process happens in this stage; therefore, the displacement was increased at higher temperatures. Initial intermetallic phases of ZrAl2 and ZrC would be formed during this stage
10
; nearly the same reaction sintering is dominant in stage II for S4 and S5 samples. However, lower shrinkage is observed for the other samples. Lower sintering temperature of S1 and S2 samples is responsible for their low shrinkage and incomplete sintering. (III) Stage three:A retarded shrinkage is observed in this stage due to the direct contact between grains; this final stage is considered for the completion of the sintering process and further diffusion.
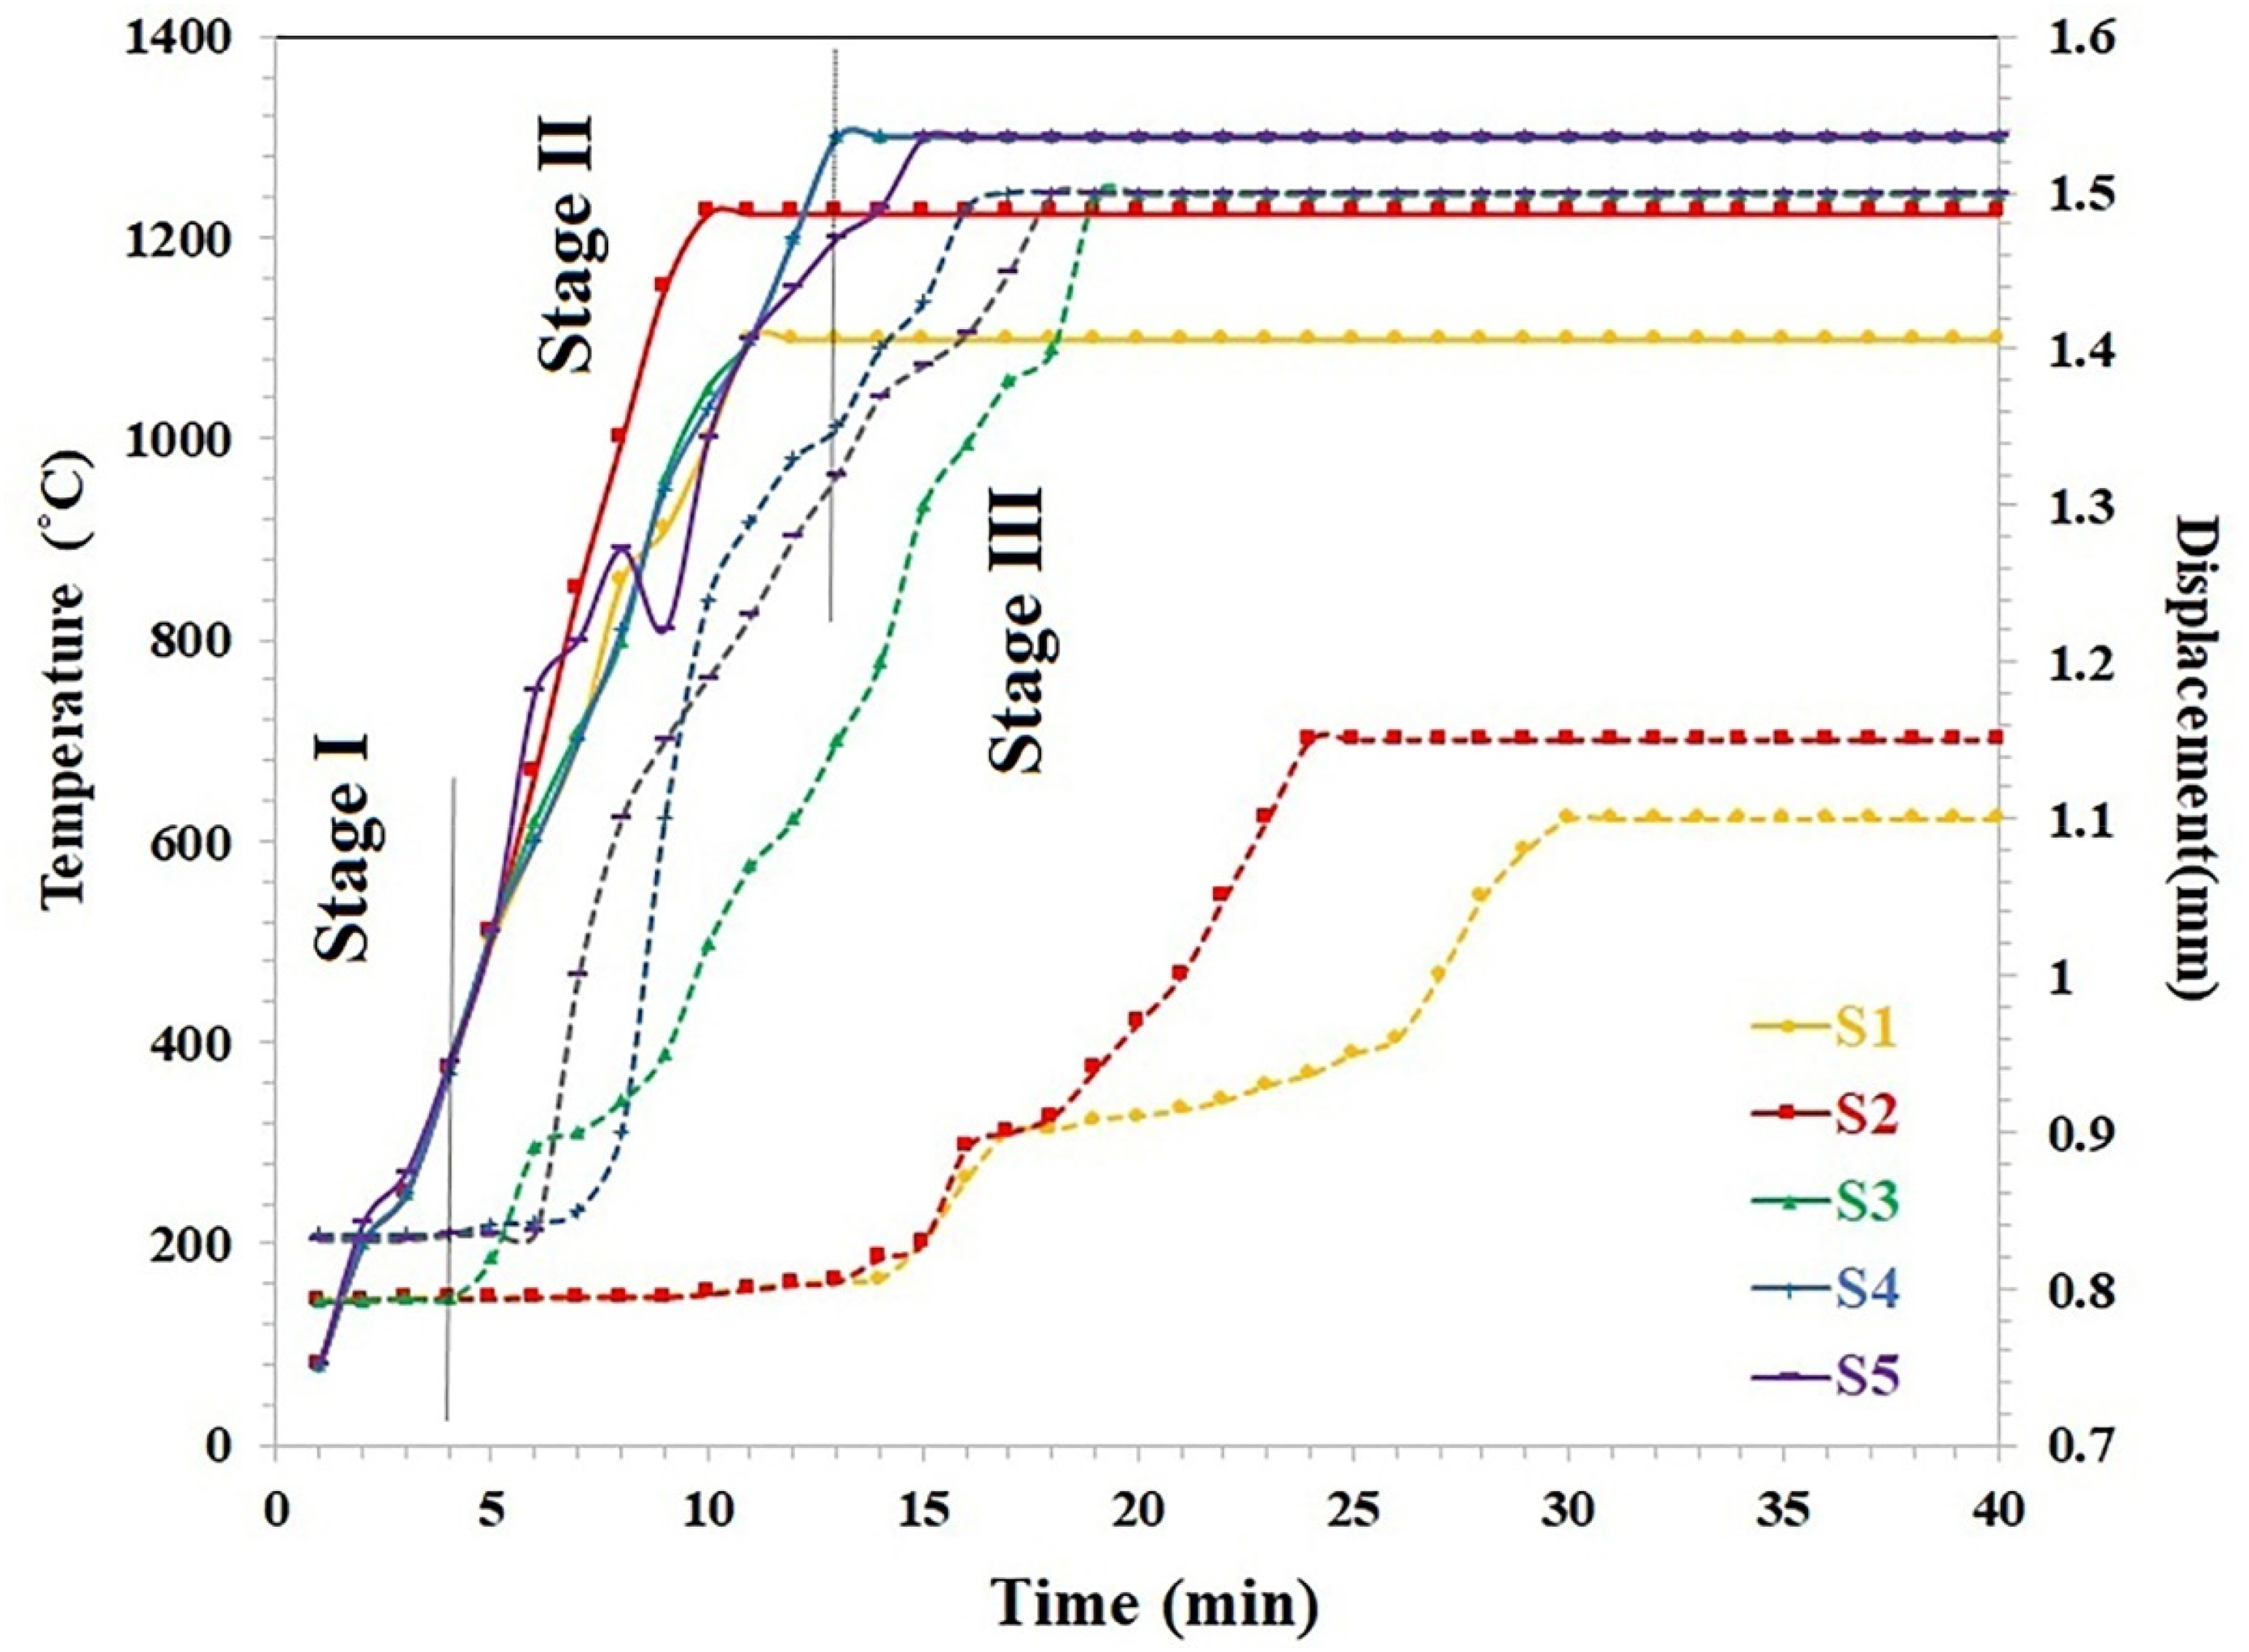
Temperature (solid lines) and piston displacement (dashed lines) recorded during SPS process.
Table 4 displays the physical characteristics of the sintered samples. It can be seen that S2 sample has the lowest density (5.14 g/cm3) in comparison to the other samples. The density of S3 sample is 5.60 g/cm3, and it has lower porosity than S2, therefore, as a result of temperature increment, the densification of S3 sample was improved. Also, increasing of the sintering temperature improved the formation of Zr2AlC MAX phase and lowered the amount of ZrC phase. This was also observed by other researchers. 6
Physical characteristics of the sintered samples.
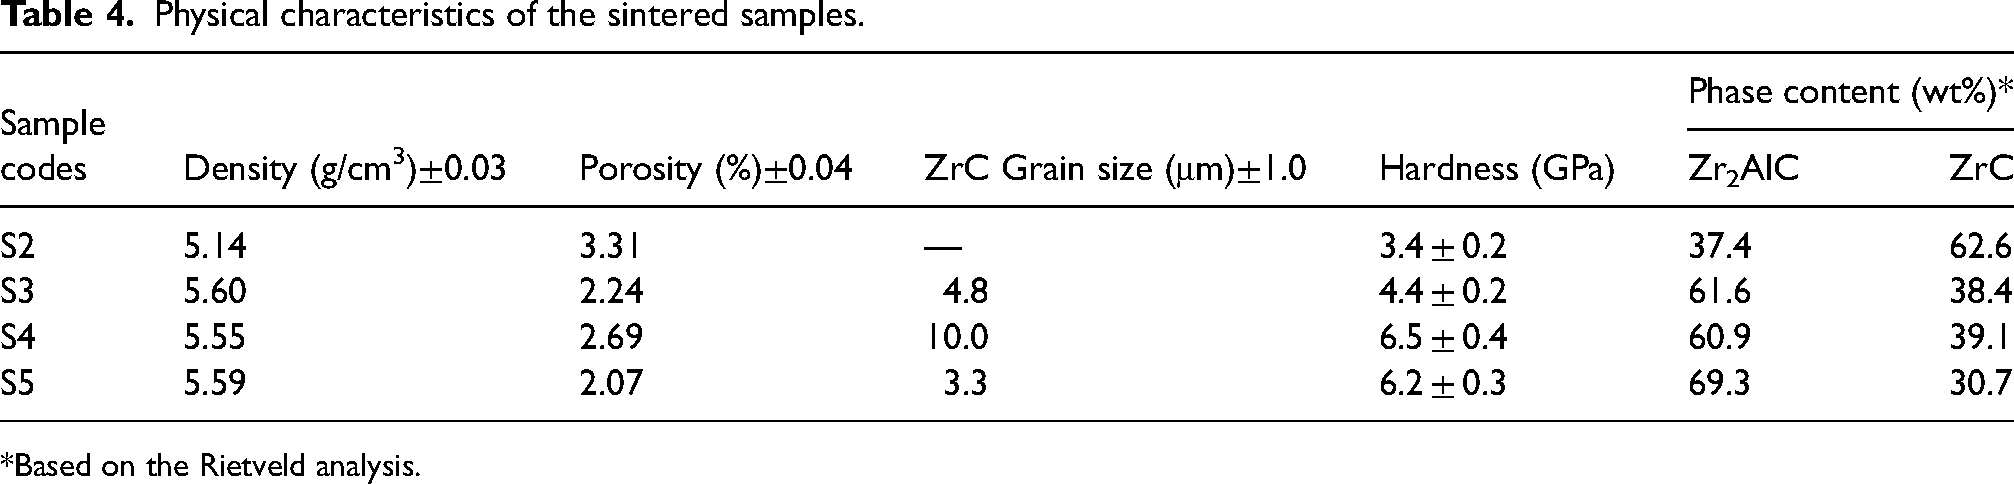
*Based on the Rietveld analysis.
The extra amount of graphite (S4 sample) led to a negligible reduction of Zr2AlC (60.9 wt.%), however, it can be seen that the ZrC grain size was increased and the densification of the S4 sample deteriorated. This may be due to the high melting point of ZrC (3532°C), which can negatively affect the sinterability of the sample. Extra Al in the stoichiometry of raw materials (S5 sample) results in an appropriate densification (lowest porosity), minimum grain size, and highest amount of the Zr2AlC phase.
Table 4 displays that the hardness values of the S2 and S3 samples have also the same trend as their densifications. This means that the hardness of the MAX phase was increased with the enhancement of the sintering temperature. However, S4 sample (6.5 GPa) shows higher hardness than S5 (6.2 GPa). Hardness depends on several factors such as the hardness of each phase and its amount in the composition, densification, porosity, and grain size. 25 The hardness values of S2 (3.4 GPa) and S3 (4.4 GPa) samples are close to other studies. 11 S2 sample contains a higher amount of ZrC phase (62.6 wt.%), however, it shows less hardness value than that of the other samples. This may be due to its lower sintering temperature (1225°C), highest porosity, and less densification.
S4 sample with extra C has the highest hardness value compared to other samples. According to Table 4, the density of S4 sample is almost similar to the other studies.6,10 However, it contains a higher amount of ZrC phase than the other two samples (S3 and S5). In fact, the presence of hard ZrC phase (with a hardness of 27 GPa 26 ) and satisfactory densification of S4 sample can result in a high hardness value. On the other hand, S5 sample also shows a desired hardness value. It possesses a fine and homogeneous microstructure with a small ZrC size. This can be also attributed to its good densification. It is worth noting that the hardness values of S4 and S5 samples are comparable with other MAX phases.5,10 The hardness values of about 4.5–6.7, 6.4, 6.1, and 4.9–5.3 GPa were reported for Ti2AlC, V2AlC, Nb2AlC, and Cr2AlC MAX phases, respectively.5,27,28
Wear behaviour of the sintered samples
The tribological behaviour of the sintered samples was assessed by wear tests under the load of 30 N and a sliding distance of 100 m. Samples were greatly damaged under higher forces and at lower applied forces, the width of the wear track was so thin that could not be detected. Figure 9 presents the low magnification SEM micrographs of the sintered samples after the wear test. Figure 10 also shows the wear width and the wear rate of the samples. S2 sample shows insufficient wear resistance originating from its low density and high porosity. The surface of S2 sample showed significant damage, large cracks, as well as a visible removal of the particles and ploughing after the wear test. The Zr2AlC phase content of this sample was only 37.4 wt.%. Therefore, the MAX phase is not the main component in this sample. In fact, it can be considered as a ZrC-Zr2AlC composite. As long as we decided to focus on the wear behaviour of a MAX phase, we did not consider or discuss more about this sample. The wear resistance of S3 sample is lower than that of S4 and S5 samples. According to the previous sections, especially physical properties provided in Table 4, the inferior wear resistance of this sample can be somehow predictable.

SEM micrographs of the width of the wear track; (a) S3, (b) S4, and (c) S5 samples.
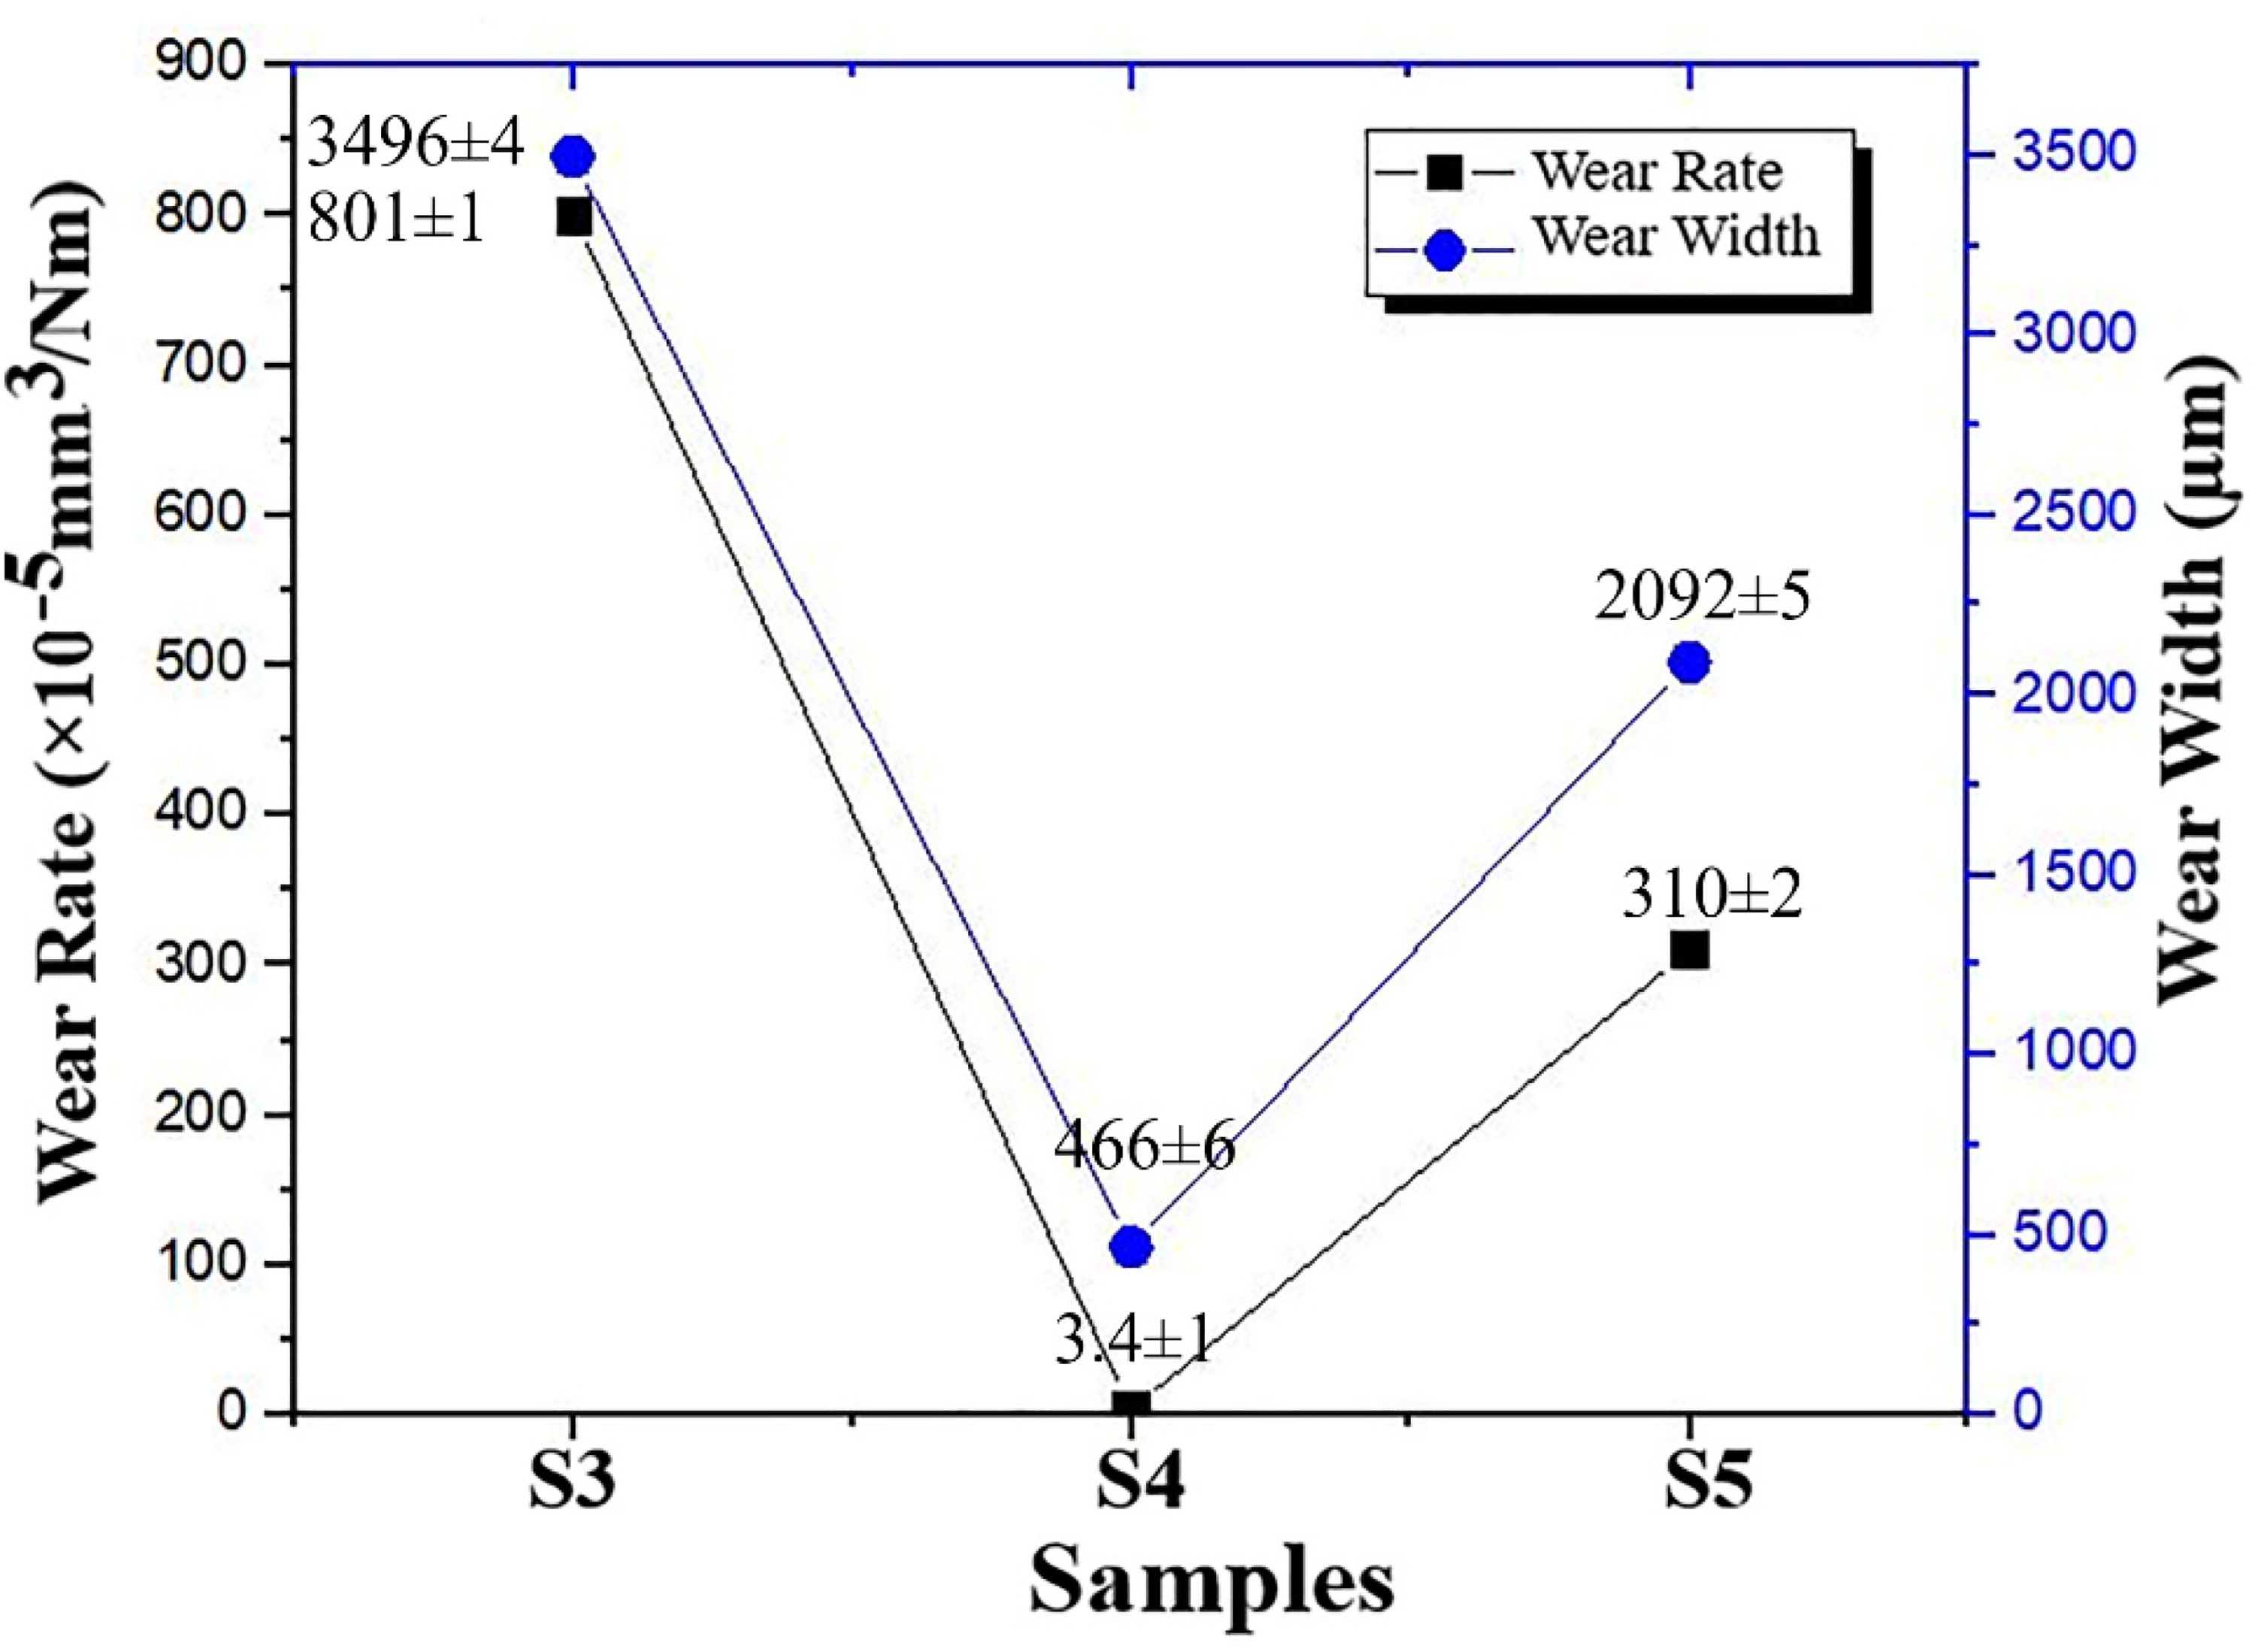
Wear rate and wear width of the sintered samples after the wear test.
S4 sample has the narrowest width of the wear track (466 µm) and the lowest wear rate (3.4 × 10⁻⁵ mm3/Nm). Most of the MAX phases can act as a solid lubricant and show a relatively low wear resistance in comparison to usual ceramics.5,29 The values of the wear rate and wear track width of Cr2AlC MAX phase were reported as 4.2 × 10⁻⁴ 6 or 3.1 × 10⁻⁵ mm3/Nm at the load of 20 N, 30 and 1042 µm, respectively. 6 This shows that the synthesized Zr2AlC MAX phase shows acceptable wear resistance in comparison to some other phases. Incorporating hard particles such as ZrC or SiC is an interesting way that develops the wear resistance of the MAX matrix.31,32 This second hard phase can enhance the material's ability to resist deformation and achieve strengthening effect. 7 Interestingly, S4 sample with a high amount of hard ZrC phase presents more desired wear behaviour than that of the other samples. It has been reported 5 that the Ti3SiC2 with a higher TiC content showed a lower wear rate.
S5 sample with fine grain size and the highest amount of Zr2AlC phase also shows considerable wear resistance. The little wider but shallow grooves in the worn surface of S5 indicate that less adhesive wear has happened. It presents a smoother worn surface with undetectable pilling up or microcracks. The wear rates of the MAX phases are usually in the order of 10−5 mm3/Nm. 31 It has been reported 29 that by adding a MAX phase the amount of plastic deformation is reduced, thus lowering the wear rate. Zr–Al bonding length is greater than that of Zr–C; which means that the bonding strength of Zr–C is higher than Zr–Al; resulting in a lower elastic modulus of Zr2AlC. The lower elastic modulus is ascribed to the stronger lubricating properties. 5 The intrinsic self-lubricating behaviour of the carbide MAX phases is due to the evolution of easy shearing graphitic carbon at the sliding surface. Precipitation of graphite carbon on the sliding surface was mentioned to prevent the contact of the ball and the surface, thereby results in lower friction. 7 Also, the presence of carbide phase (such as ZrC) in the matrix of system can delay the oxidation of MAX phase. 33
There is strong evidence indicating that elastic modulus and hardness play important roles in wear behaviour. 29 Therefore, it can be said that the high elastic modulus of ZrC is responsible for the high wear resistance. In particular, the elastic strain to failure, which is related to the ratio of hardness (H) to the elastic modulus (E), is a more accurate parameter for determining the wear resistance of materials. In fact, the H/E ratio can be a suitable criterion for classifying the wear behaviour of materials. Accordingly, in a material with a higher H/E ratio, the deformation caused by external stress can be recovered easily which can positively influence the wear resistance.28,34 The theoretical value of the H/E ratio was calculated according to the role of mixture. For this purpose, HZrC = 27 GPa, EZrC = 480 GPa, 26 HZr2AlC = 6.4 GPa, and EZr2AlC = 217 GPa 35 were considered. H/E ratios of S3, S4, and S5 samples were calculated as 0.0379, 0.0399, and 0.0370, respectively. According to the calculations, S4 sample has the highest H/E ratio, which confirms the previous data. It should be noted that we cannot judge the wear behaviour just based on one parameter, and there are some factors that should be considered together. In fact, high H/E ratio of S3 sample was affected by its low densification and it cannot fully address the phenomenon that it possesses high wear resistance. 5
Figure 11 shows the SEM micrographs of the worn samples in high magnification and the related EDS results. It should be noted that oxygen can be detected in the EDS results of all samples after the wear test. Therefore, the oxidation mechanism is active in the samples. EDS analysis of S3 sample presented a low oxidation (Fig. 11(a)), however, S4 sample suffers from higher oxidation (Fig. 11(b)). Fig. 11(d) shows the EDS analysis of Point A of S4 sample. By comparison to Fig. 11(e) (point B of S4), it can be seen that during the wear process, oxidation has occurred more frequently in ZrC phase; This means that the oxygen affinity of ZrC is higher than that of the MAX phase. The reported content of oxygen in S3 and S5 samples after the wear test is almost similar to that before the wear test and is logical. The main issue is the high content of oxygen of S4 sample. The formed layer on the worn surface of the S4 sample can be an oxide layer. After a wear test, several oxide layers can form on the surface of Zr2AlC. The specific oxides that can form include ZrO2, Al2O3, and the mixture of them. Mixed oxides of zirconium and aluminium can form, which can enhance the protective properties of the oxide layer. These oxide layers play a crucial role in improving the wear resistance and overall performance of Zr2AlC in various applications. 29 In addition, the evolution of residual stresses is another important factor as the oxides grow on parent surfaces. 33 The highly oxidized ZrC film (dark regions) is the origin of the cracks which facilitates the delamination process. In fact, the oxide layer was observed to be damaged during the wear test. The repeated mechanical loading and sliding during the wear test and the frictional heat generated during the wear test can cause the oxide layer to crack and spall off. The oxide layers in Ti2AlC and V2AlC MAX phases were reported as Al2O3, TiO2, or V2O5 or a mixture of them.36,37 It was demonstrated that Zr2AlC shows superior resistance to oxidation, however, it enables the formation of an Al2O3 protective layer, 8 or the mixture of Al-Zr oxides, perhaps due to the lower standard Gibbs free energy of Al- rather than Zr- oxide. 1 These hard oxides can form the oxidation barrier, which reduces oxidative wear. 5 It should be noted that due to the ceramic nature of MAX phases and also the lack of chemical/electrochemical attack conditions of the surrounding environment during wear tests the occurrence of tribo-corrosion mechanism is less likely.38,39

FESEM micrographs of the worn samples in high magnification and the related overall EDS results; (a) S3, (b) S4, (c) S5, (d) and (e) EDS analysis of points A and B of S4 sample.
Figure 11(a) shows the ploughing, pits, and deep grooves which are visible on the surface of S3. The roughly damaged surface suggested abrasive wear mechanism as the predominant mechanism. It seems that a harder WC pin scratched over a softer surface of the sample; and somehow, material removal and plastic deformation has been occurred. This kind of delamination and cracks were also reported in other MAX phases such as Ti2AlC. 28 At normal load, the contact area and also the local stress is well-remarkable which leads to high friction and severe surface deformation. 5 Also, in Cr2AlC MAX phase, ploughing is the dominant wear mechanism in accordance with grain boundary cracks.30,40 The mixed mechanisms of abrasive wear and oxidation wear are also common in Ti2AlC and V2AlC MAX phases.
In S5 sample the scar depth of wear is shallow, confirming the good wear performance of the prepared Zr2AlC MAX phases with a lamellar structure exhibiting lubrication characteristics. EDS analysis of the matrix (MAX phase) and also the Al-rich ZrC phase of S5 sample after the wear test showed a negligible change in the composition. It seems that Zr2AlC grains show more resistance to wear rather than ZrC phase. Also, the diffusion of Al into the ZrC grains improved the wear resistance of the samples. It has been reported that the solid solution formation of some elements with Al in Ti2AlC resulted in increment of the hardness. 5 Therefore, it can be said that diffusion of Al into ZrC can increase the hardness and so the wear resistance through solid solution hardening effect.
Figure 12 shows the variations in the coefficient of friction (COF) of the samples. The prominent features of the COF curves are common stick-slip, which is somehow related to the possible formation and spalling of the friction film and the transfer of wear debris and peeling friction film to the ball. 7 The initial COF of all samples was low (∼ 0.1) and further reached a steady state around 1.4, 0.6, and 0.9 (S3, S4, and S5, respectively). The COF in MAX phases can vary (from 0.2 to 0.5) depending on the specific material and testing conditions. The COF for Zr2AlC can also vary depending on the specific conditions of the wear test, such as the environment, load, and sliding speed. However, in general, the COF for Zr2AlC is typically in the range of 0.3 to 0.5 under dry conditions. The reason for this transition in friction might be attributed to the breakage of oxide films, that have grown over time. The rapid transition to steady-state friction was attained after the first slide distances in S5.
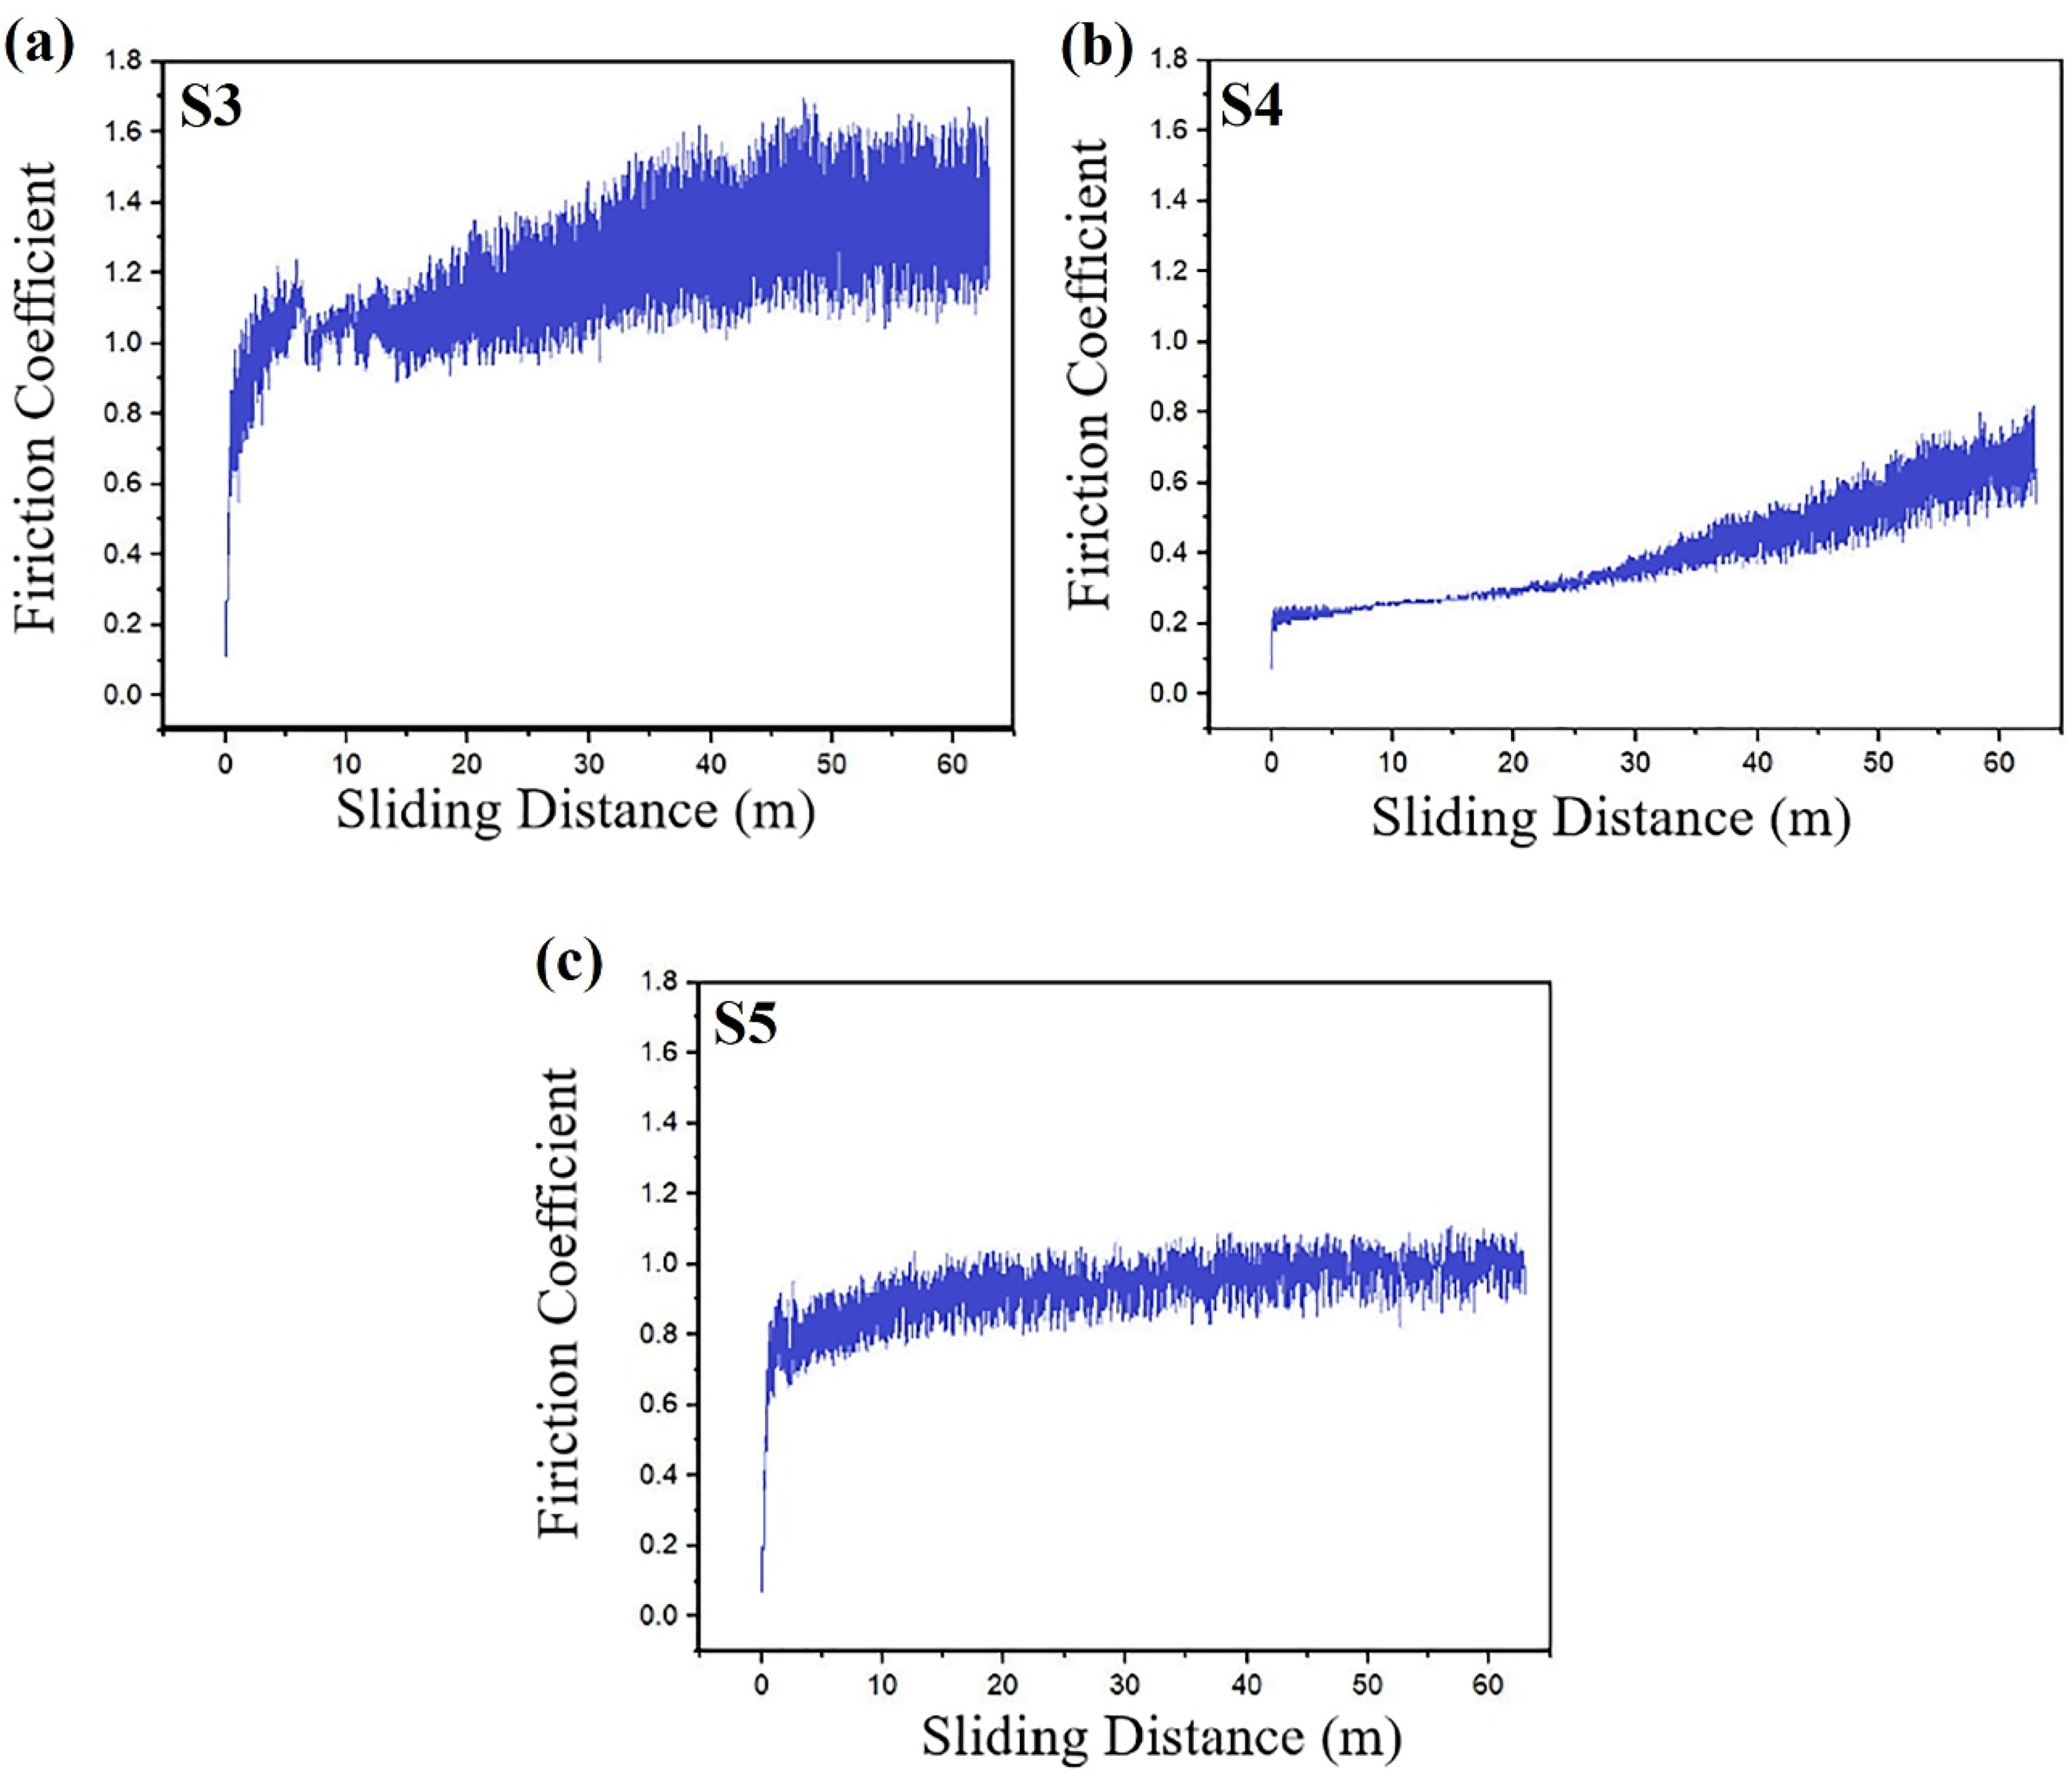
Friction coefficient of the (a) S3, (b) S4, (c) S5 samples.
S3 sample (Fig. 12(a)) has a high COF with large fluctuations, the large fluctuations of the COF may be attributed to the periodical accumulation and elimination of wear debris on the surface. On the other hand, the fluctuations in the COF can be attributed to several factors such as surface roughness, oxide layer formation and its removal, wear debris, and temperature changes.41,42 These factors, individually or in combination, can contribute to the observed fluctuations in the coefficient of friction in Zr2AlC. This high COF is not common for this kind of material; therefore, it may be attributed to the influence of vibrations, noise, and thermal effects. One of the main parameters that can govern the COF is the interaction of the pin with the evolved oxide layer. In the S4 sample, despite the other two samples, the oxide layer seems more stable during the wear test, which reduces the pin's interaction with the surface of the sample. However, after the wear test for 30 m, the COF starts to increase in this sample. This can be correlated to temperature increment and stress concentration in the worn area that deteriorates the oxide films and leads to its higher interaction with the worn sample.
At the beginning of the test, the COF rises rapidly, and after about 5 m running, the COF tends to increase gradually by a milder slope. The evolution trend of COF is similar to the previous research. 7 This behaviour of S3 sample may be due to the adhesion between its surface and the pin and the oxide growth followed by subsequent pull-out of the grains. 33 The higher COF could be referred to as localized welding and sticking of the worn debris to the sample surface. 29 The COF of S3 and S4 samples are continuously rising, while the COF curve of S5 sample (Fig. 12(c)) exhibits a more stable behaviour than the other samples, maybe due to its smaller grain size (Table 4), homogeneous microstructure, good densification, higher amount of Zr2AlC phase and H/E ratio. COF of S4 sample was the lowest and can be concluded that this sample shows excellent wear behaviour compared to the other samples due to the presence of ZrC phase in accordance with Zr2AlC matrix (Fig. 12(b)). COF of S4 sample is comparable to Ti2AlC MAX phase (0.3–0.45). 28 S4 sample presents oxidation wear mechanism; it has been confirmed that a good oxide film with a higher percentage of coverage results in a smaller COF. 28 Also, it has been reported that tribological properties of MAX phases are strongly affected by crystallographic texturing. 32 Preferential orientation of the planes was not observed in the synthesized Zr2AlC samples, a complex growth orientation existed, which helped to lower the COF. 5
Conclusions
In this study, the simultaneous synthesis and sintering of Zr2AlC MAX phase through the SPS method was investigated. Two important factors (stoichiometric ratio of raw materials, and SPS temperature) were chosen as the main effective parameters on the MAX phase yielding. In this regard, phase composition, microstructure, densification, hardness, and wear properties of the sintered samples were evaluated. The main results of this research are as follows:
Zr2AlC MAX phase was obtained with a purity of 69.3 wt% after the SPS process at 1300°C for 30 min under pressure of 30 MPa. The mentioned sample was prepared based on ZrH2:Al:C stoichiometry of 2:1.3:0.95, and included ZrC and Zr2AlC phases. The ZrxAlyCz phase was also formed due to the presence of sufficient aluminium and its penetration into the ZrC structure. Use of extra Al in the batch of raw materials was developed yielding of Zr2AlC MAX phase with a high purity, however, using extra graphite (high C in raw materials) results in a Zr2AlC/ZrC mixture with a highest H/E ratio, good hardness, and excellent wear properties. All of the sintered samples exhibited oxidation and delamination mechanisms after the wear test, however, the sample with excess amount of graphite (which contains a higher amount of ZrC) suffered from higher oxidation.
Supplemental Material
sj-docx-1-trb-10.1177_17515831251332219 - Supplemental material for Synthesis of Zr2AlC MAX phase via spark plasma sintering (SPS): Influence of starting powders stoichiometry and sintering temperature on mechanical and wear properties
Supplemental material, sj-docx-1-trb-10.1177_17515831251332219 for Synthesis of Zr2AlC MAX phase via spark plasma sintering (SPS): Influence of starting powders stoichiometry and sintering temperature on mechanical and wear properties by Bahareh Behzadi, Mohammad Farvizi, Hudsa Majidian and Leila Nikzad in Tribology - Materials, Surfaces & Interfaces
Footnotes
Acknowledgements
Financial support for this study was provided by a Grant No. 371400056 from the Materials and Energy Research Center (MERC).
Authors' contributions
Data availability statement
Data will be available on request (bhrbehzadi@gmail.com).
Declaration of conflicting interests
The authors declared no potential conflicts of interest with respect to the research, authorship, and/or publication of this article.
Funding
The authors disclosed receipt of the following financial support for the research, authorship, and/or publication of this article: Materials and Energy Research Centre was supported this project.
Supplemental material
Supplemental material for this article is available online.
References
Supplementary Material
Please find the following supplemental material available below.
For Open Access articles published under a Creative Commons License, all supplemental material carries the same license as the article it is associated with.
For non-Open Access articles published, all supplemental material carries a non-exclusive license, and permission requests for re-use of supplemental material or any part of supplemental material shall be sent directly to the copyright owner as specified in the copyright notice associated with the article.