
Abstract
This study investigates the tribological performance of 65 Mn steel plow surfaces modified by combined ultrasonic shot peening and snake-inspired microtexturing under water lubrication. Ultrasonic shot peening was first applied to enhance surface hardness, followed by laser texturing to fabricate microstructures with different texture densities (18%, 27%, and 36%). Surface characteristics, including hardness, roughness, and morphology, were systematically characterized. Reciprocating friction and wear tests were conducted, and the lubrication mechanism was analyzed using numerical simulations in Ansys Fluent. Results show that shot peening significantly improves wear resistance despite increasing surface roughness, while microtexturing alone provides limited improvement. The combined treatment exhibits the best tribological performance at 27% texture density, reducing friction coefficient and wear rate by 25.58% and 69.14%, respectively. This improvement is attributed to enhanced hydrodynamic lubrication and load-carrying capacity induced by the microtextures, providing guidance for biomimetic wear-resistant surface design of agricultural tools under water lubrication.
Keywords
In plowing operations, the plow surface directly contacts soil and sand particles, bearing impact loads that cause erosion and abrasive wear.1,2 These wear processes generally begin at the surface, so preparing a wear-resistant layer of sufficient thickness on the plow surface is an effective method for improving the overall performance of the plow and extending its service life. The low yield strength of 65 Mn steel plow surfaces leads to significant wear during the initial use, as the impact loads from soil and sand particles in the plowing process are relatively small and the surface remains in a low-stress state, preventing it from undergoing strain hardening or work hardening. 3 Fortunately, the strong impact from mechanical shot peening causes significant plastic deformation and work hardening in the metal surface, which greatly improves surface properties. For example, medium manganese steel, after mechanical impact, achieves a microhardness of 700 HV, with tensile strength increasing from 950 MPa to 1158 MPa, while the elongation remains around 20%. 4 High manganese steel, after 2 min of mechanical shock strengthening, sees nearly a 70% improvement in wear resistance. 5 Therefore, using mechanical shot peening to preform high-strength, hardened wear-resistant layers on manganese steel plow surfaces is an effective method to address the poor wear resistance of 65 Mn steel before it undergoes work hardening during initial use.
In wetland or humid field operations, the interaction between the plow surface and soil or sand is influenced by both water and soil mixtures. While water acts as a lubricant, reducing the high-temperature wear caused by dry friction, it also introduces new erosion and abrasive wear issues due to the combination of water and soil. Moreover, under water-lubricated conditions, severe adhesion between the plow surface and soil results in increased traction resistance and power consumption, which may rise by more than 30%, 6 and can even prevent normal plowing, causing significant economic loss and energy consumption. To address this, researchers have conducted extensive experimental and theoretical studies, suggesting the use of biomimetic non-smooth surfaces to reduce adhesion and friction in plowing operations. These studies are based on the surface morphology of worm head pits, 7 dung beetle head grooves,8,9 and biomimetic plow surfaces. The ventral scales of the red-banded snake can effectively reduce crawling resistance and lower the erosion and abrasive wear of the scales by soil particles. 10 However, there is a lack of research on applying red-banded snake ventral scale-inspired microtextures to plow surfaces to reduce friction and wear, and no studies have been conducted on the tribological properties of shot peening/red-banded snake ventral scale microtextured composite modifications on 65 Mn steel plow surfaces.
In wetland or humid field operations, the working environment for the plow surface is more complex and harsh, with dynamic variations in stress, speed, and lubrication conditions throughout the process. Evaluating the tribological properties of 65 Mn steel plow surfaces with red-banded snake ventral scale-inspired microtextures through experiments alone is not sufficient to reveal the fundamental mechanisms by which biomimetic microtextures affect their tribological performance. Fortunately, with the widespread use of numerical simulations, more and more simulations are being employed to analyze the contact and lubrication conditions of microtextures in frictional zones,11,12 providing insights into the intrinsic mechanisms by which microtextures reduce friction and improve wear resistance.
Based on the above, this study aims to first strengthen the surface of 65 Mn steel plow surfaces with ultrasonic shot peening to create a high-hardness wear-resistant layer, and then laser process red-banded snake ventral scale-inspired microtextures to create a friction-reducing layer. The tribological performance of the composite modification layer under water lubrication will be simulated in plowing operations, and the effect mechanism of the microtextures on the tribological properties of the plow surface will be revealed through Ansys Fluent simulations.
Materials and methods
Materials and sample preparation
The base material used in this study was 65 Mn steel produced by Angang Steel Company Limited, which is commonly used for plow manufacturing. Its chemical composition consisted of Mn 1.0%, C 0.65%, Si 0.3%, P 0.03%, S 0.03%, and Fe as the balance, with heat treatment performed according to the GB/T 1222-2016 standard for Spring Steel. The steel plates were cut into 40 × 40 × 3 mm square blocks using wire electrical discharge machining (EDM), then sequentially polished using 200#, 400#, 800#, 1200#, and 2000# water abrasive paper. The samples were then polished to a mirror finish using diamond paste. Afterward, the samples were ultrasonically cleaned in anhydrous ethanol for 20 min to remove surface dirt, followed by drying.
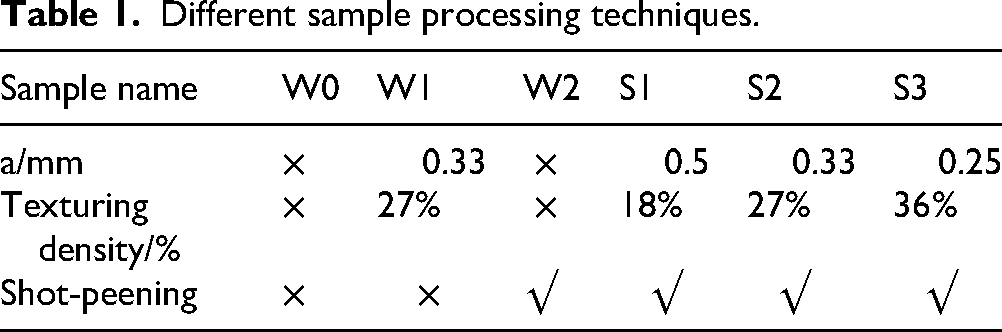
The shot peening was performed using GCr15 steel balls with a diameter of 4 mm, a hardness of HRC 63–65, and dynamic pressure of 0.35 MPa, with 300% coverage for 60 min. The microtexture chosen for this study was inspired by the ventral scales of the red-banded snake, 13 with the irregular hexagonal structure of the scales simplified into a periodic arrangement of hexagonal grooves as shown in Figure 1(b). A J20H-QD fiber laser marking machine manufactured by Han'S Laser Technology Industry Group Co., Ltd was used to fabricate the surface microtextures. The laser marking system had a processing precision of 0.1 µm and operated at an AC voltage of 220 V, with an output power of 20 W, pulse duration of 200 ns, and frequency of 25 kHz. During processing, the samples were scanned four times at a speed of 400 mm/s. By varying the spacing “a,” microtextures with texture densities of 18%, 27%, and 36% were fabricated, and the corresponding samples were labeled S1, S2, and S3, respectively, as shown in Table 1. In addition, the untreated sample was labeled W0, the sample with 27% texture density but without shot peening was labeled W1, and the shot-peened sample without microtexture was labeled W2.
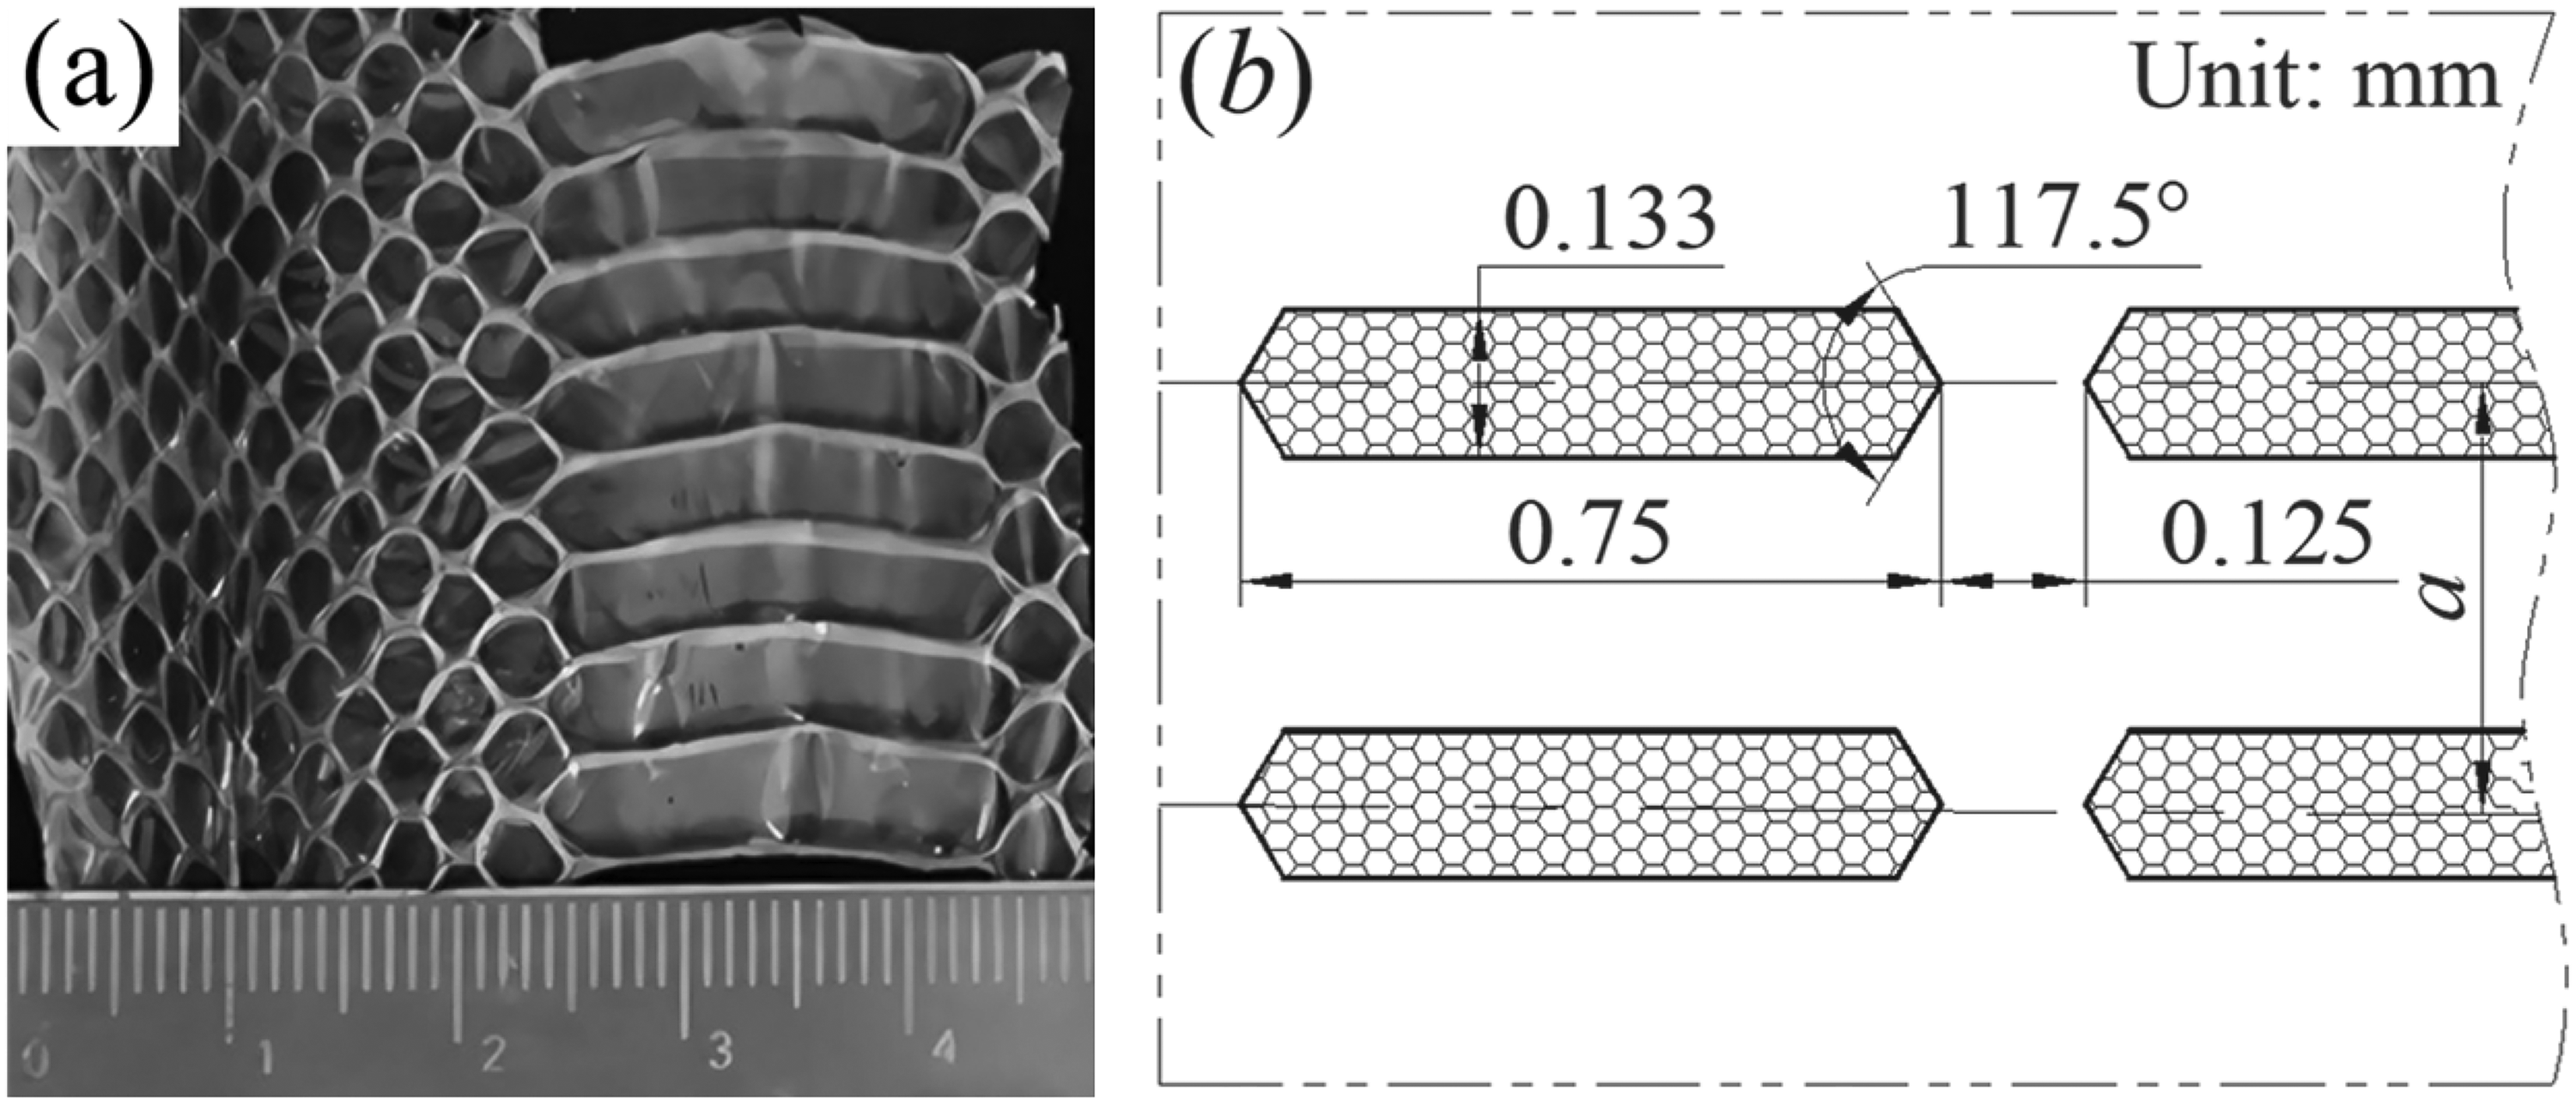
Biomimetic pattern and simplified design:(a) snake ventral scale 13 ; (b) simplified design.
Different sample processing techniques.
Tribological performance tests were conducted at room temperature using the HSR-2 M reciprocating friction and wear testing machine developed by the Lanzhou National Key Laboratory of Solid Lubrication. Pure water was used as the lubricant, with a normal load of 50 N, 14 a reciprocating frequency of 4 Hz, a single stroke of 5 mm, and a total sliding distance of 120 m. The friction pair consisted of 4 mm diameter Si3N4 ceramic balls with hardness ranging from 1400 to 1700 HV.
After installing the samples, the surface was repeatedly wiped with alcohol, dried, and dusted off. During the test, the friction pair was always submerged in water by more than half its volume. After the experiment, the surface was again wiped with alcohol, dried, and cleaned. The wear scar cross-sectional profile was measured using the built-in scanning probe of the HSR-2M testing machine, and the obtained measurement data was exported to Origin software for analysis. The cross-sectional area was calculated using the built-in numerical integration function. For each wear scar, the average wear scar cross-sectional area, A, was calculated by taking three measurements at four equally spaced points along the scar. The relative wear rate, β, was calculated using formula (1).
15
The same sample was tested three times under the same parameters, with a new friction pair used for each test. The final tribological performance was evaluated by averaging the results from the three tests.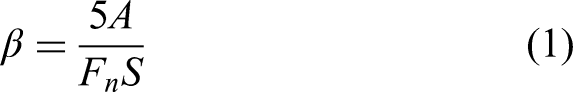
In the formula, β represents the relative volumetric wear rate (mm3/N·m); 5 A is the wear volume (mm3); Fn is the normal load (50 N); and S is the total sliding distance (120 m).
The hardness of the samples was measured at five points spaced at least 3 mm apart using an HV-1000D Vickers hardness tester. The surface roughness (Ra) of the samples was measured using a TR200 roughness tester. The surface structure and biomimetic microtextures of the samples were observed using an M330BD-HK830 metallographic microscope. The wear scar morphologies were examined using a S-4800FE scanning electron microscope (SEM) to analyze the wear mechanisms.
Numerical simulation method
The numerical simulation of the fluid lubrication region was carried out based on the Navier-Stokes equations, which describe the fundamental principles of fluid dynamics. To achieve higher computational accuracy and convergence, the following assumptions were made: (1) The two rough surfaces of the friction pair were assumed to be smooth. (2) The Mach number of pure water was calculated by Equation (2) as Ma = 8.77 × 10⁻⁵, which is much less than 1, indicating that water can be regarded as an incompressible fluid, and its compressibility effect can be neglected. (3) Only the pressure field and velocity field of the fluid were considered; heat generation and thermal conduction within the flow field were neglected. (4) The friction pair was treated as a rigid body, and the coupling effect between the solid and water was ignored. (5) The operating conditions were assumed to be isothermal, with laminar and steady-state flow.
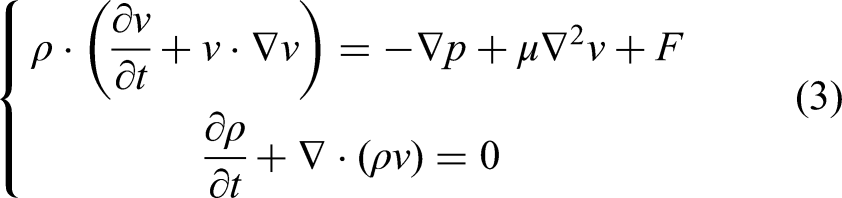
The working parameters were set as follows:gravitational acceleration g = 9.81 m/s2,water density ρ=1000 kg/m3,viscosity μ=0.001 Pa·s,and inlet relative velocity .Based on the above assumptions and parameters, the relationship between fluid velocity and pressure in ANSYS Fluent was described by Equation (3)
15
:
To obtain more accurate simulation results, a three-dimensional fluid domain model was established. Since the microtextures are periodically arranged, the overall model could be simplified into the minimum periodic unit cell of 1 × 1 mm, as shown in Figure 2. In Figure 2, h represents the lubricant film thickness (set as 10 μm), and H represents the texture depth (measured as 90 μm according to the fabricated microtexture). The microtexture dimensions correspond to those shown in Figure 1(b), and the solid domain dimensions are consistent with the actual sample size.
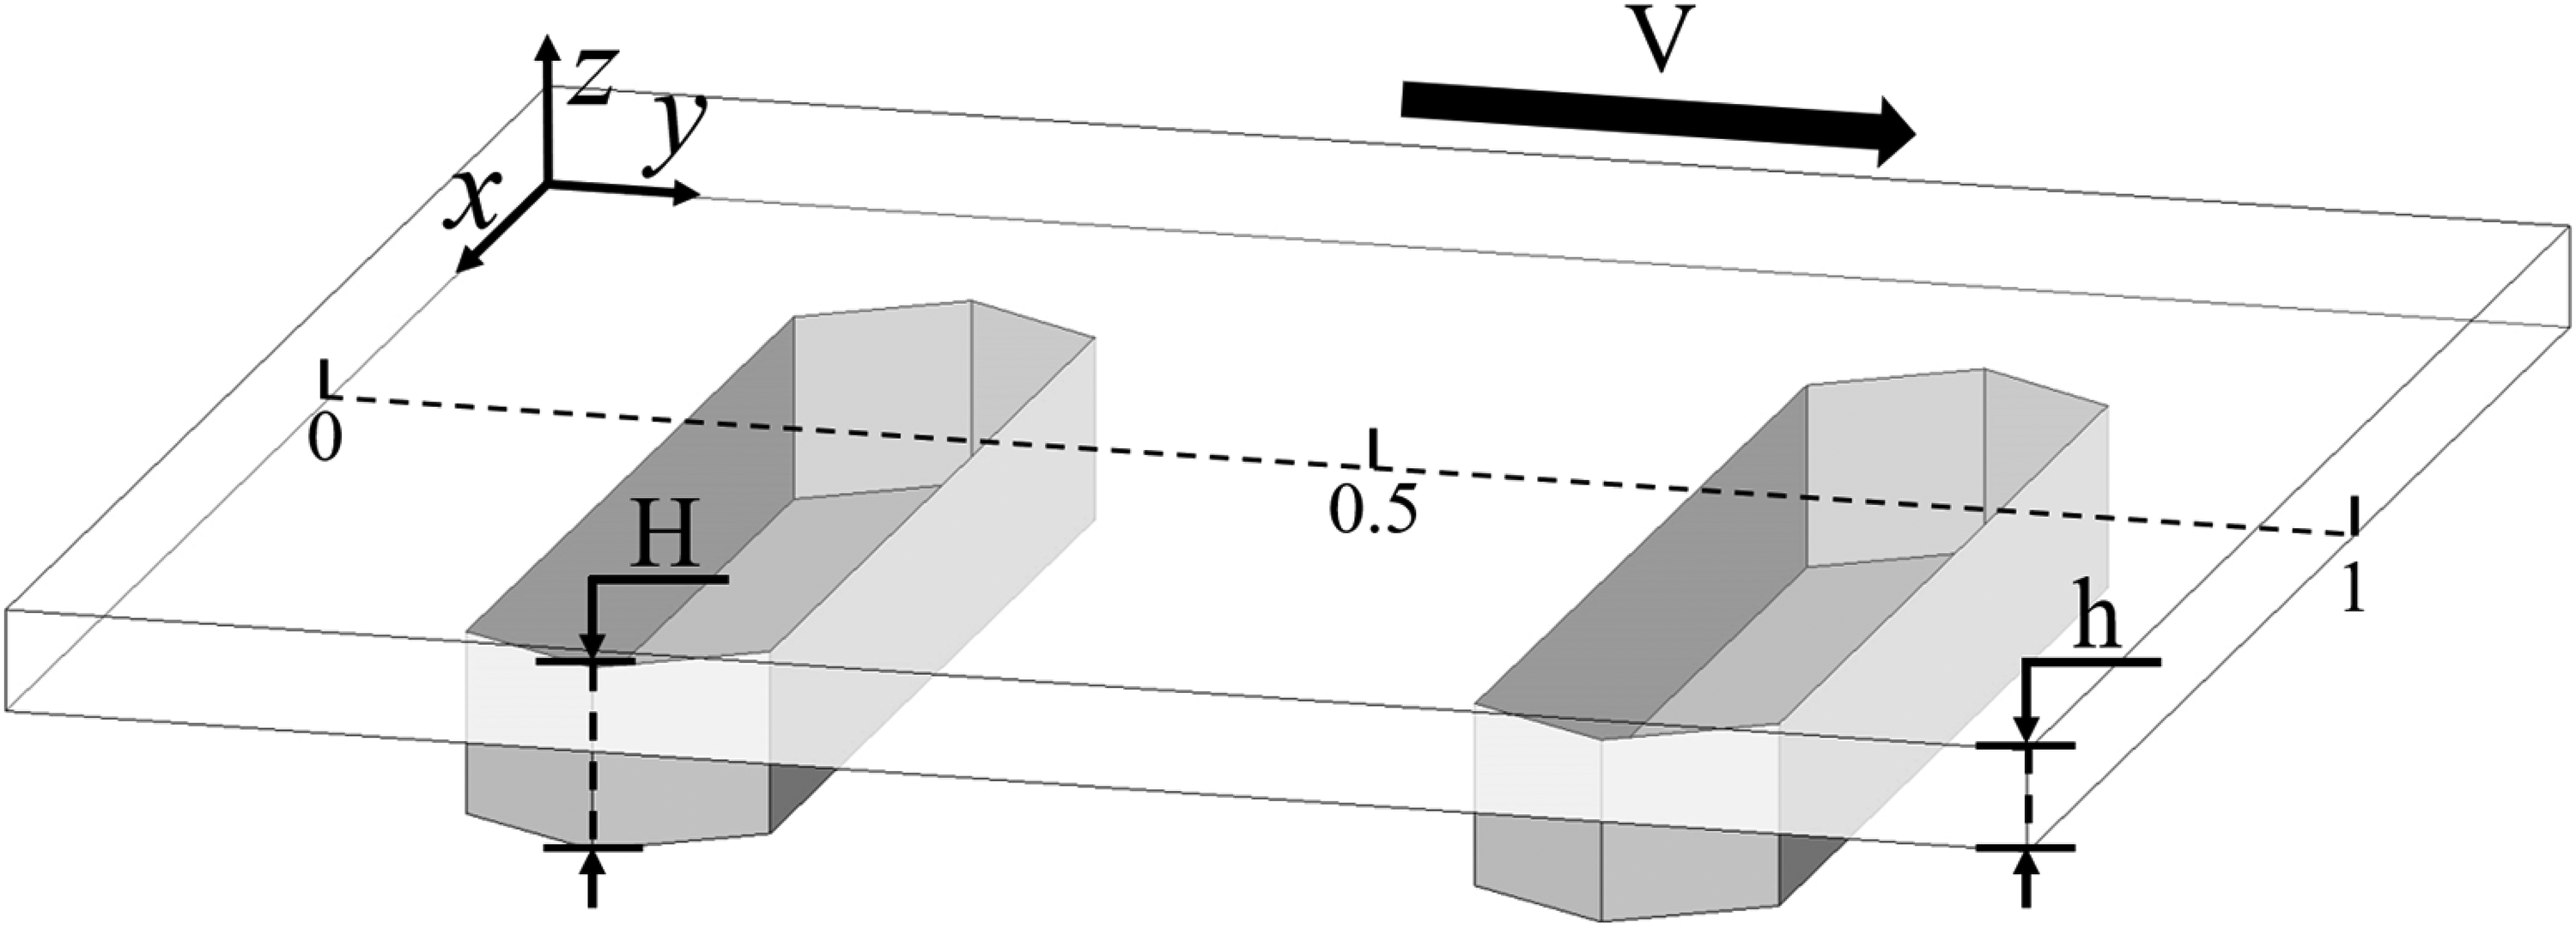
Bionic texture 3D model.
The Reynolds number (Re) was calculated by Equation (4) as 219.1, which is much less than 2000, indicating a laminar flow regime. Therefore, the laminar flow interface was selected. Since the Mach number was only Ma = 8.77 × 10⁻⁵, far less than 0.3, an incompressible flow interface was adopted. The fluid domain was modeled as an incompressible non-Newtonian laminar flow.16,17
The boundary conditions were defined as follows: all wall surfaces were set to no-slip boundaries; the bottom wall was stationary, while the top wall moved with a sliding velocity of V = 0.13 m/s; the front and rear boundaries were set as periodic, and the left and right boundaries were symmetric.
Shot peening strengthening and microtexture
The polished surface of sample W0 exhibited slight scratches along the polishing direction, as shown in Figure 3(a). The measured surface roughness was Ra 0.027 μm, and the average hardness was 414.72 HV ± 5.01HV (standard deviation). In contrast, the polishing scratches on the surface of the shot-peened sample W2 disappeared, replaced by features such as cracks, bumps, and small wrinkles, as shown in Figure 3(b). The measured surface roughness was Ra 0.172 μm, and the average hardness was 529.28 HV ± 5.43HV (standard deviation). It can be seen that high-speed, high-energy shot impacts continuously strike the sample surface, forming irregular pits and protrusions that increase surface roughness, 18 raising the roughness of the 65 Mn steel plow surface from Ra 0.027 μm to Ra 0.172 μm. Meanwhile, part of the kinetic energy from the shot impacts was absorbed by the surface and transformed into deformation potential energy, causing varying degrees of plastic deformation, grain refinement, and a significant increase in dislocation density. As a result, the surface structure became denser and stronger 19 , leading to deformation strengthening and work hardening, which increased the surface hardness from 414.72 HV to 529.28 HV, an increase of 27.6%.
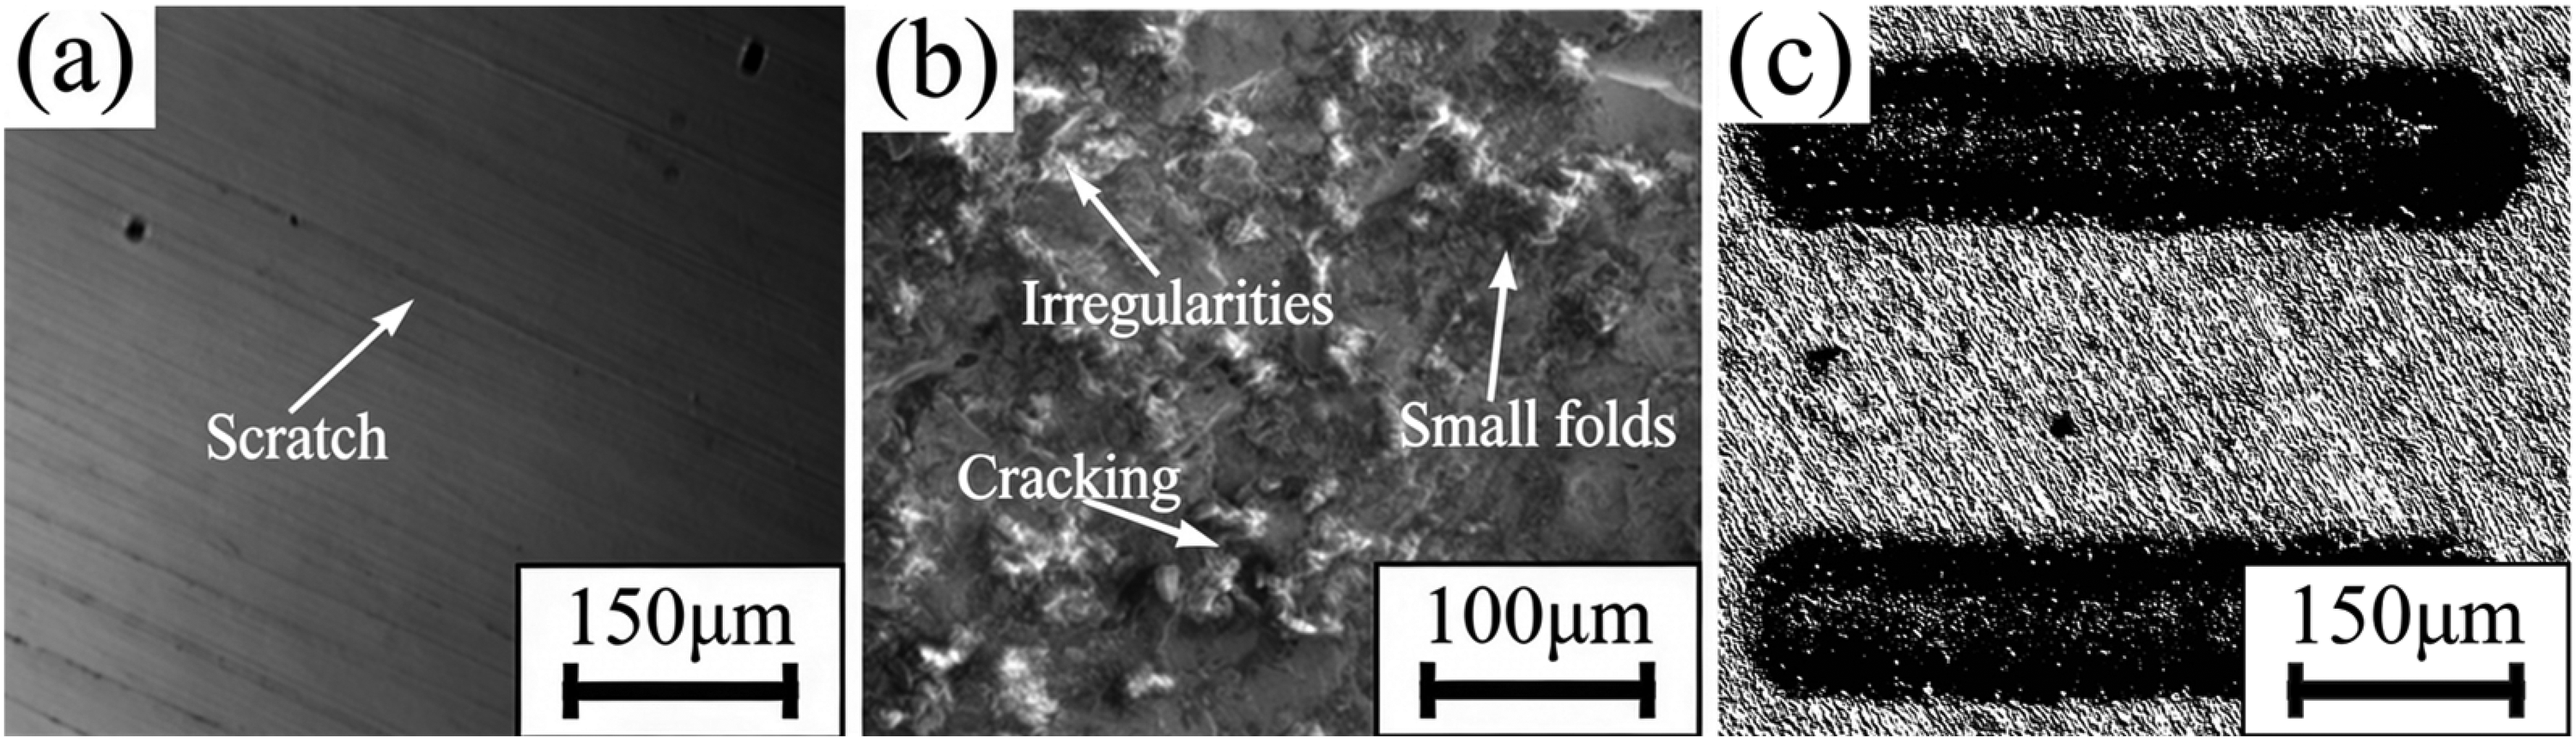
Micro morphology of different samples: (a) W0; (b) W2; (c) S2.
After laser processing of the microtexture, slight polishing was performed to remove machining residues, followed by ultrasonic cleaning in anhydrous ethanol for 20 min. The resulting microtexture exhibited a regular and clear contour, as shown in Figure 3(c), with a measured texture depth of 90 ± 3 μm.
The variation of friction coefficient with sliding distance and the cross-sectional profiles of wear scars for each sample are shown in Figure 4. The calculated average friction coefficients and relative volumetric wear rates are listed in Table 1. As shown in Figure 4(a), the friction coefficient curves fluctuated significantly during the initial 30 m of sliding, due to the unstable contact between surface asperities and the counterface. 20 After 30 m of sliding, the fluctuation amplitude decreased markedly because the surface asperities were mostly worn flat, resulting in a stable wear stage and the formation of a stable hydrodynamic lubrication effect on the smooth contact surface.21,22
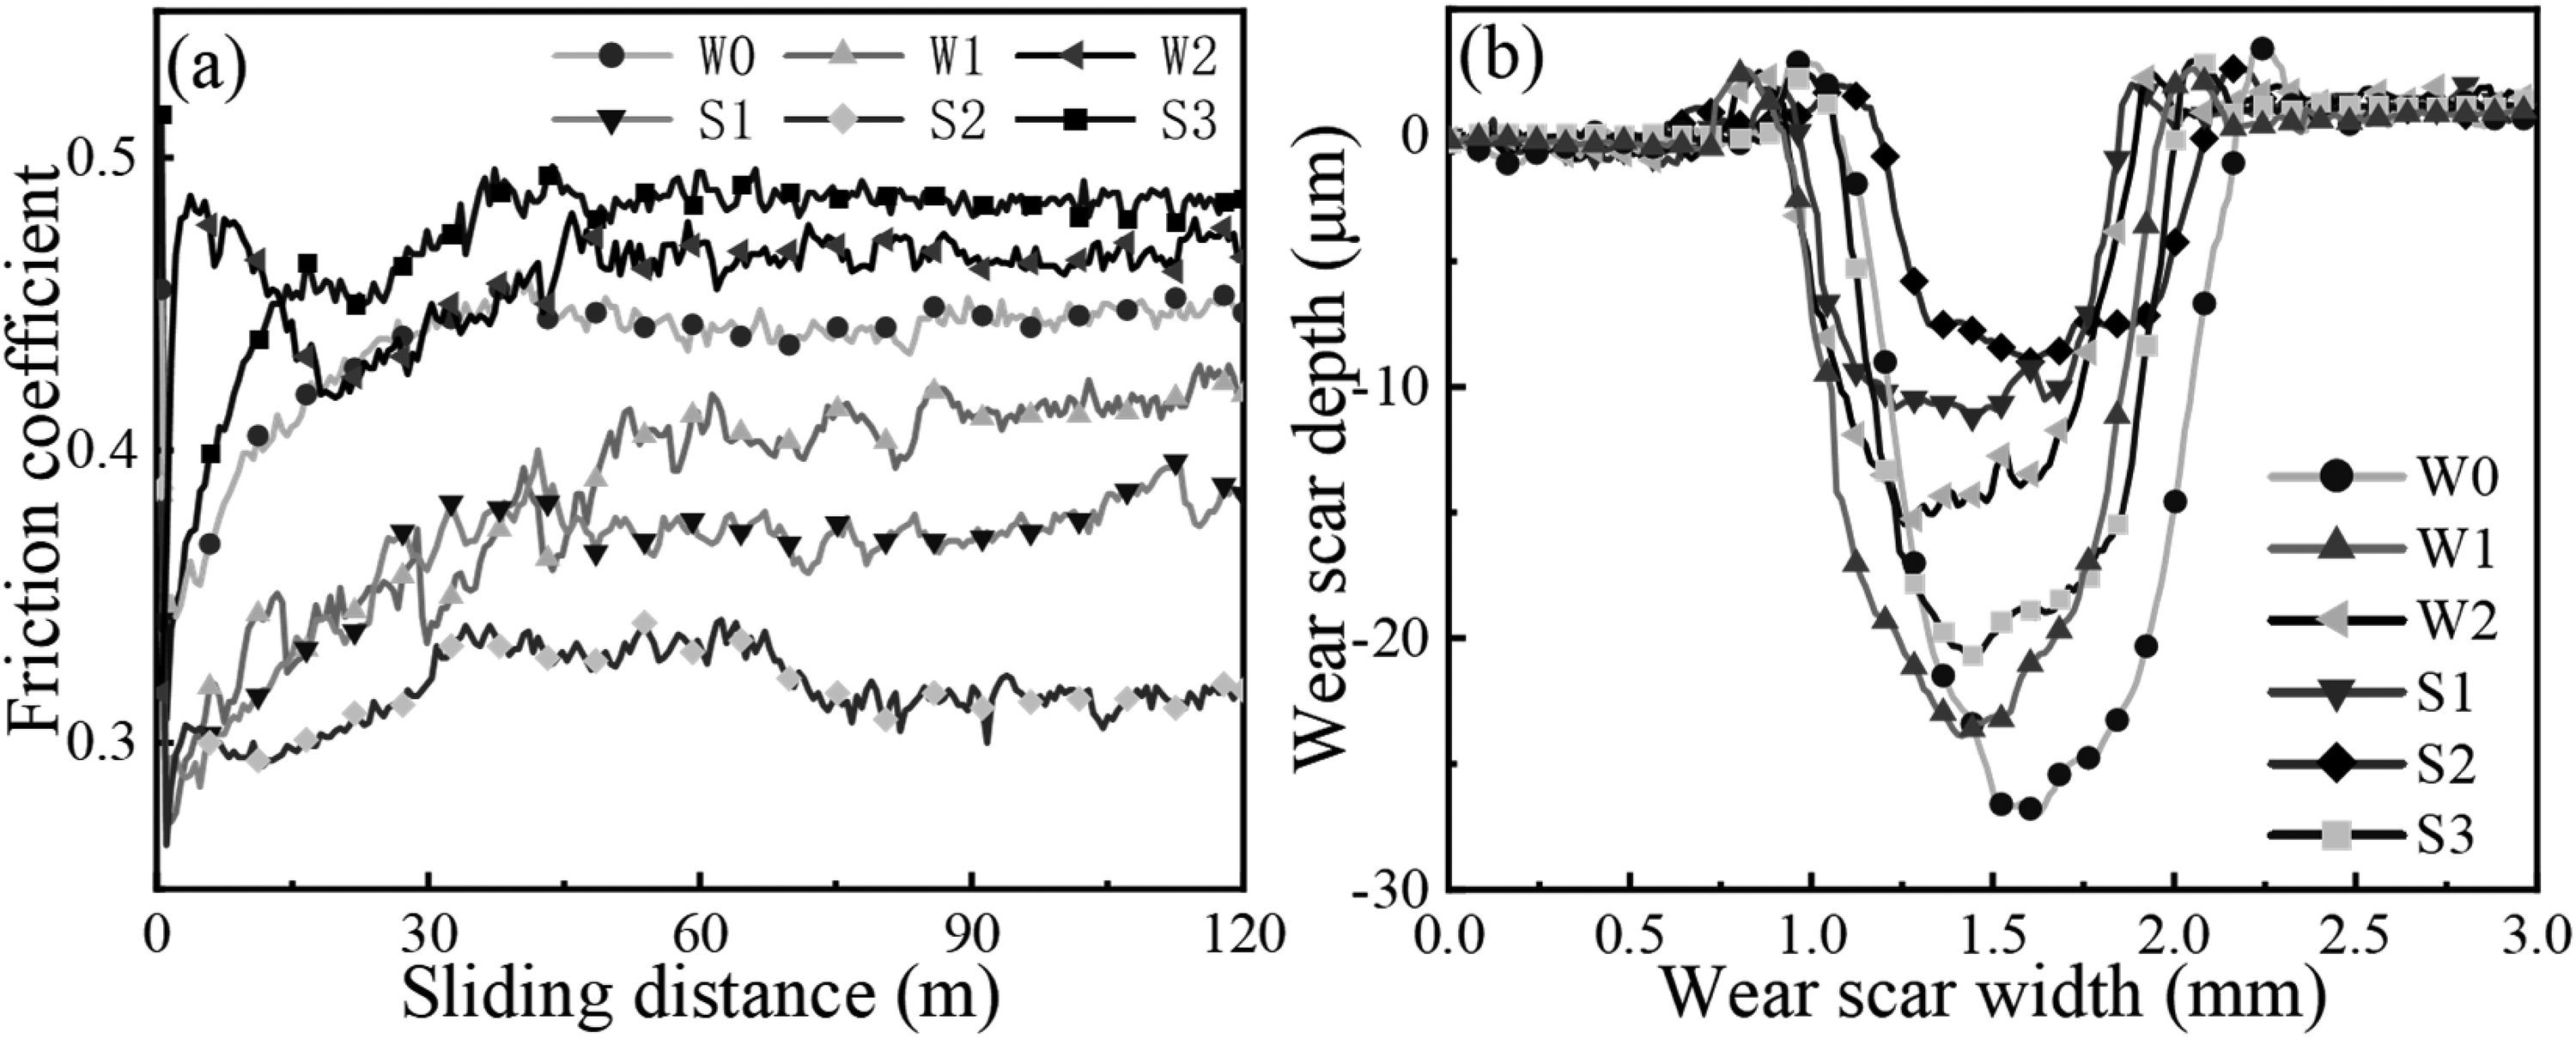
Friction coefficient and wear scar profile curves of different samples: (a) friction coefficient; (b) wear scar profile curves.
Further observation of Figure 4(a) shows that the friction coefficients, from high to low, follow the order S3 > W2 > W0 > W1 > S1 > S2, with corresponding average steady-state friction coefficients of 0.47, 0.46, 0.43, 0.38, 0.36, and 0.32, respectively. It can be seen that shot peening increased the friction coefficient from 0.43 (W0) to 0.46 (W2, an increase of 6.52%). On the shot-peened rough surface, the microtexture with a texture density of 36% further increased the friction coefficient to 0.47 (S3, an increase of 8.51%). However, microtextures with texture densities of 27% and 18% on shot-peened surfaces reduced the friction coefficients to 0.32 (S2, a decrease of 25.58%) and 0.36 (S1, a decrease of 16.28%), respectively. On the un-peened surface, the microtexture with a texture density of 27% reduced the friction coefficient from 0.43 (W0) to 0.38 (W1, a decrease of 11.63%), which is still higher than that of S1 (0.36). Moreover, W1 exhibited the largest fluctuation amplitude in its friction coefficient curve, indicating that microtextures on a softer substrate could not effectively stabilize friction or achieve friction reduction. This may be because the microtexture edges are prone to collapse under load during friction, causing an unstable contact interface. The improved mechanical properties of the shot-peened surface can effectively protect the microtexture integrity during friction, thereby maintaining stable friction and achieving friction reduction.
As shown in Figures 4(b) and 5, the wear scar depth, from shallow to deep, follows the order S2 < S1 < W2 < S3 < W1 < W0. The calculated relative volumetric wear rates of the samples were 0.50, 0.64, 0.88, 1.18, 1.43, and 1.62 × 10⁻⁵ mm3/N·m, respectively. The results show that single microtexturing reduced the wear rate of W0 by 11.73%; single shot peening reduced it by 45.68%; and shot peening combined with 18%, 27%, and 36% microtextures reduced it by 60.49%, 69.14%, and 27.16%, respectively. Therefore, the wear resistance improvement achieved by the combined modification was much better than that of microtexturing alone. However, the combination with a 36% texture density even worsened the antifriction and wear-resistance performance compared with single shot peening. Thus, only an appropriate texture density combined with shot peening can effectively enhance the antifriction and wear resistance of 65 Mn steel plow surfaces and extend their service life.
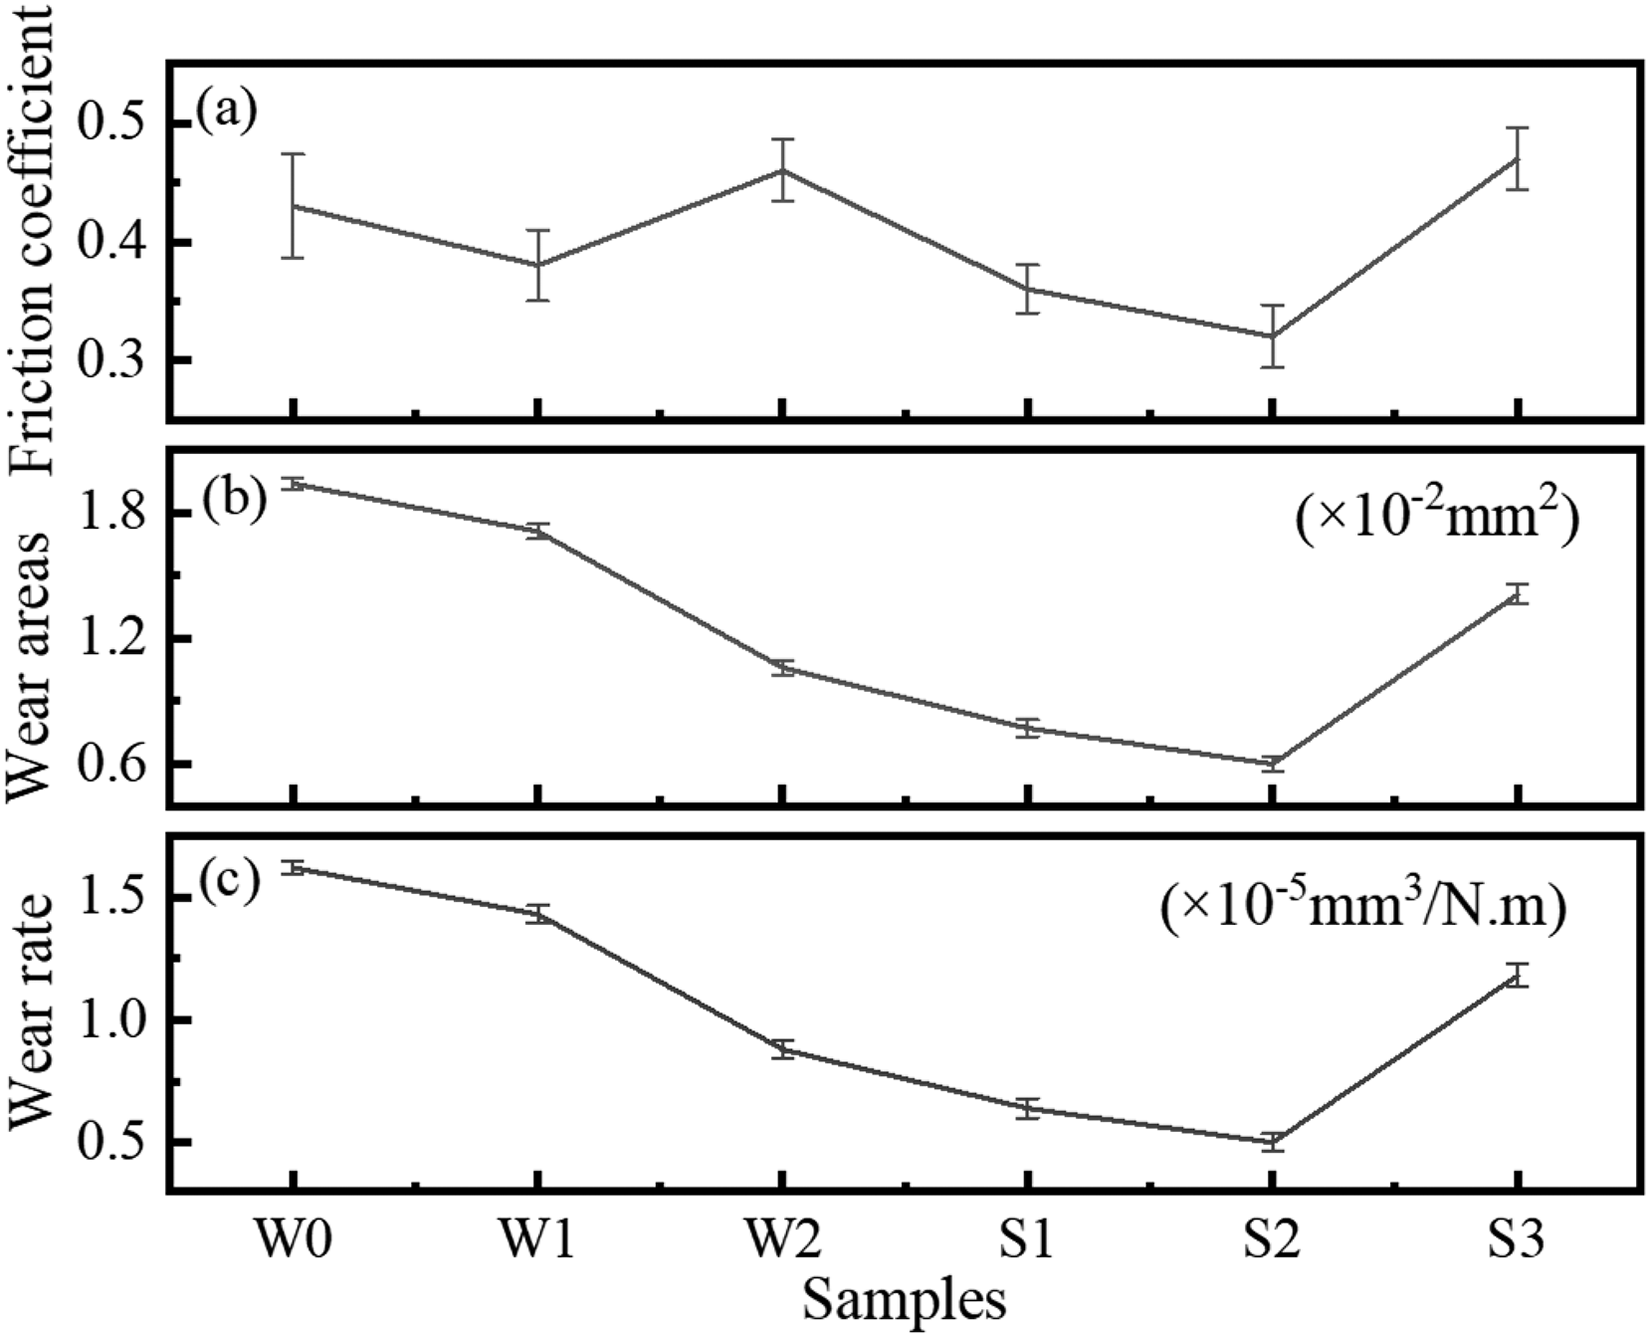
Tribological performance of different samples: (a) wear areas; (b) friction coefficient; (c)wear rate.
As shown in the static pressure cloud maps and velocity streamline diagrams of the lubricant on the surfaces of each sample in Figure 6, after the fluid enters the microtextures from the left side of the sample, its velocity rapidly increases under the influence of the microtexture geometry, forming multiple divergence and convergence regions along the flow direction. Negative pressure is generated in the divergence regions, whereas positive pressure is formed in the convergence regions. When the negative pressure exceeds a critical value, cavitation occurs. 23 As the fluid continues to flow forward inside the microtextures, its velocity gradually decreases while the local pressure continuously increases, resulting in local high-pressure zones that enhance the load-carrying capacity of the lubricating film.
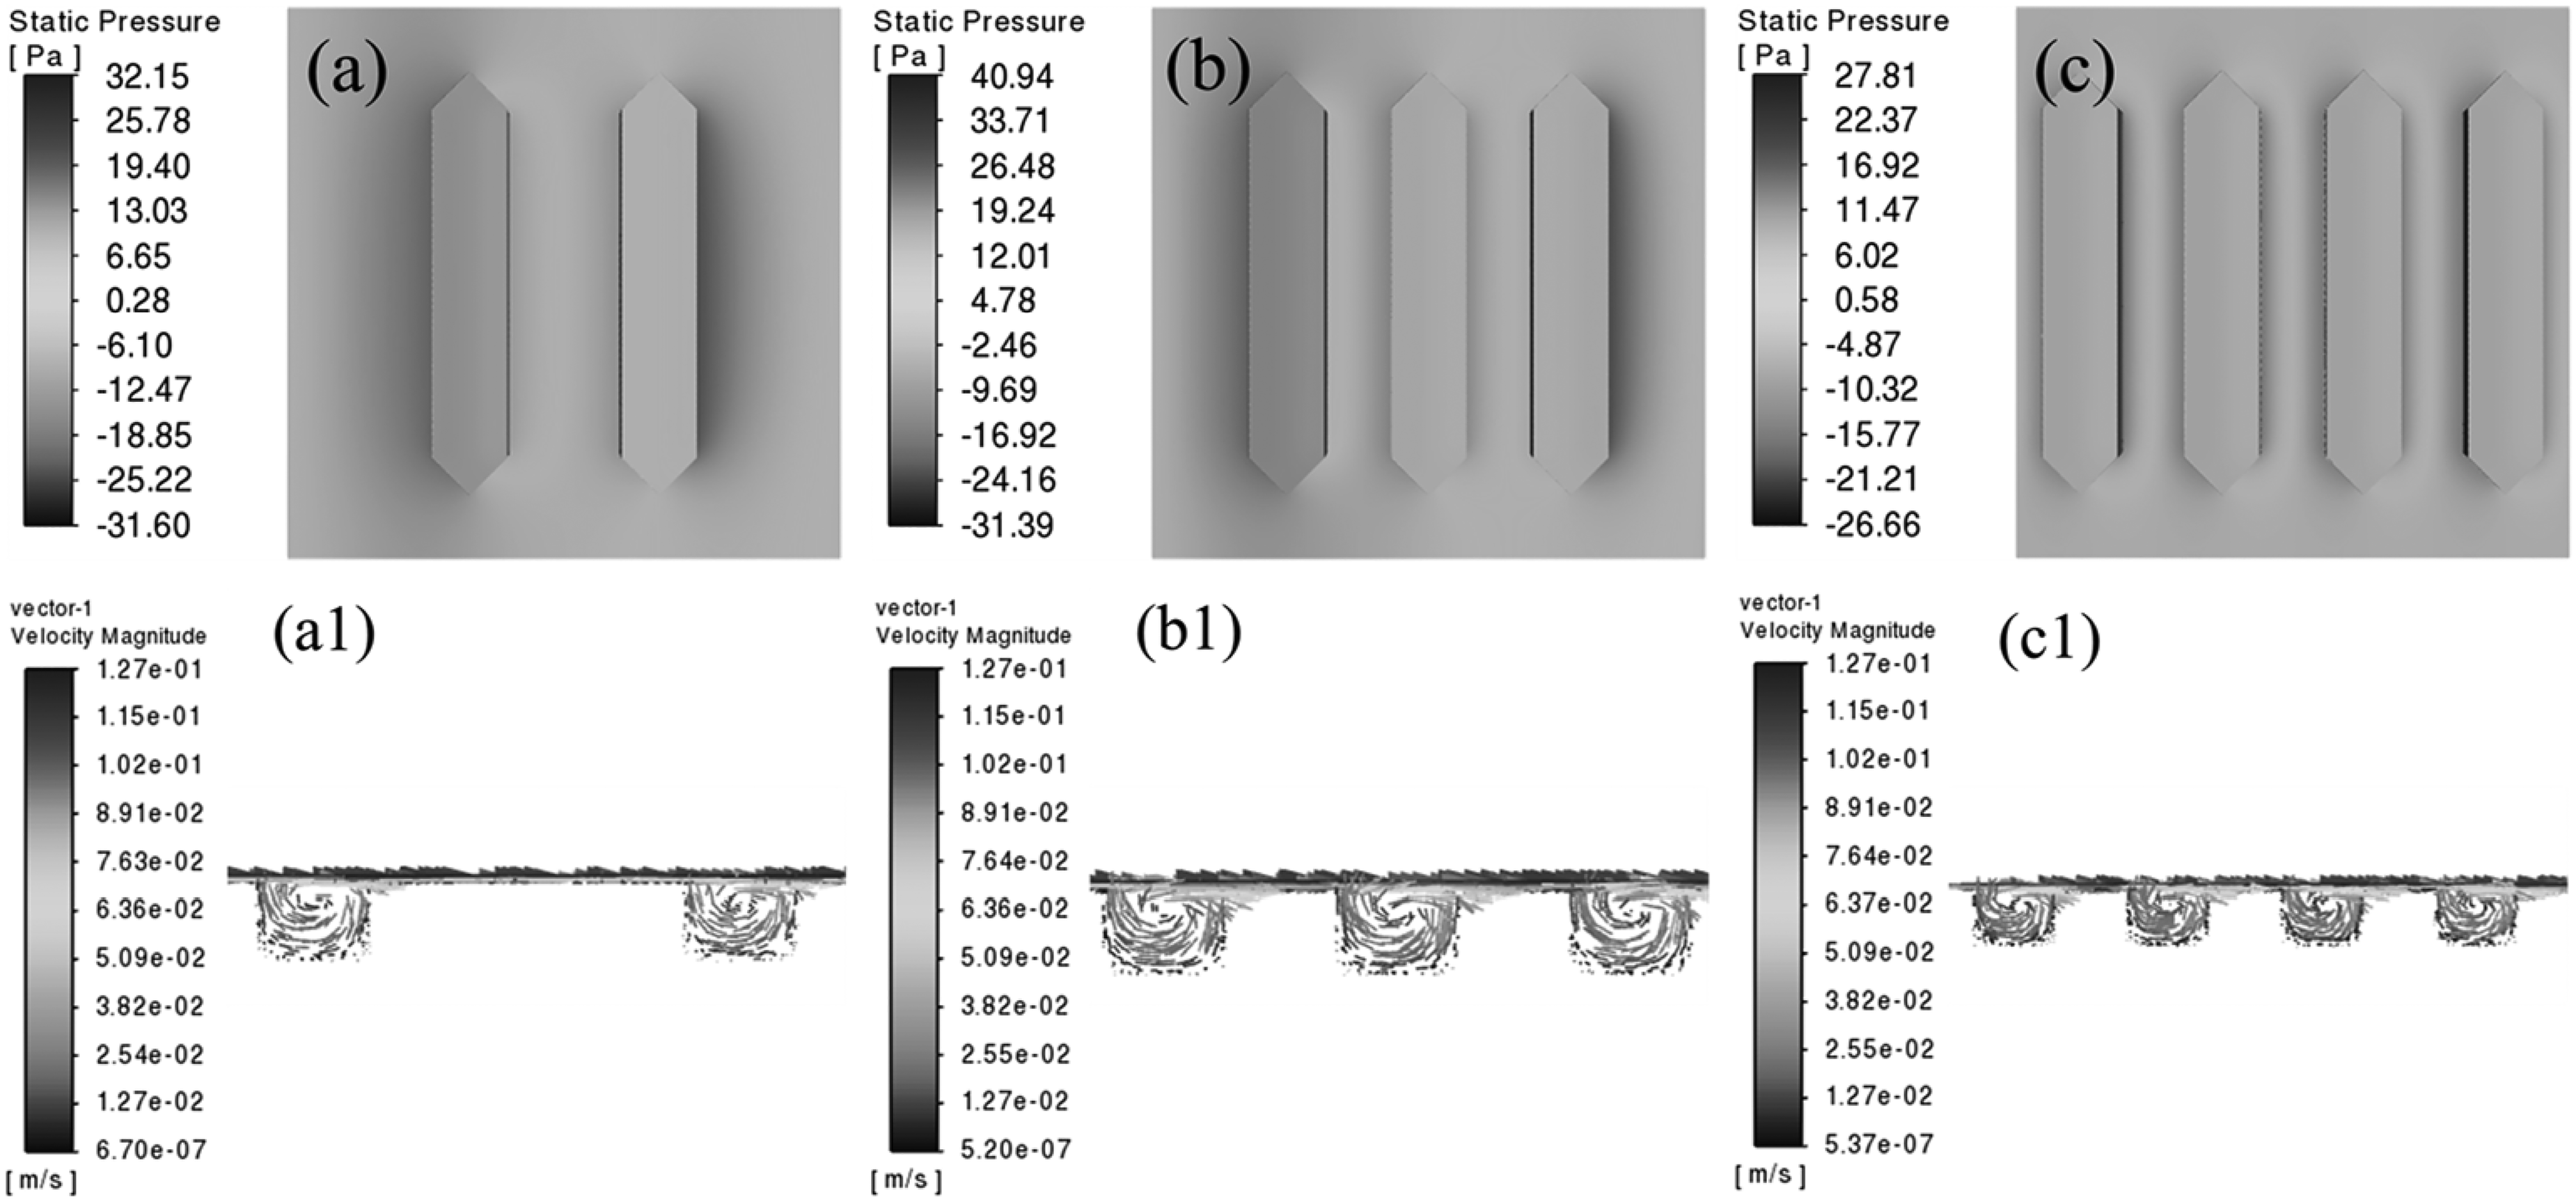
Surface static pressure cloud maps and velocity streamline distributions of each sample texture: (a) S1; (b) S2; (c) S3.
Further analysis based on the velocity streamline diagrams in Figures 6(a1), (b1), and (c1) reveals that obvious vortex flow structures are formed inside the microtextures, indicating the occurrence of local backflow and recirculating flow within the textures. This vortex flow not only enhances the hydrodynamic effect of the lubricant, but also enables the microtextures to store lubricant and trap wear debris, thereby reducing direct contact and scratching between the friction pairs. On the surfaces of S1 and S2, obvious fluid pressure asymmetry and flow disturbance phenomena can be observed between adjacent textures. The vortex flow generated inside the upstream textures continuously affects the downstream flow field, causing the fluid disturbances to accumulate and propagate downstream. Consequently, the pressure field of the downstream textures cannot maintain symmetry with that of the upstream textures, thereby increasing both the positive and negative static pressures and enlarging the static pressure difference. Moreover, as the texture density increases from 18% to 27%, the coupling effect between adjacent texture flow fields becomes stronger, and the streamline bending and vortex disturbances become more pronounced, as shown in Figures 6(a) and (b).
For S3 with a texture density of 36%, as shown in Figure 6(c), the spacing between adjacent microtextures becomes smaller, causing the neighboring flow fields to overlap with each other. As a result, the gradually accumulated flow disturbances are weakened or even mutually offset. Under this condition, the flow states between adjacent microtextures tend to become completely overlapped, and the velocity streamlines gradually exhibit a periodic and stable distribution, restoring the symmetry of the pressure field. However, the excessively overlapped flow fields weaken the ability of individual textures to generate local high-pressure zones, thereby reducing the positive static pressure and weakening the load-carrying capacity of the lubricating film.
Further quantitative analysis of the static pressure in Figure 6 shows that when the texture density increased from 18% to 36%, the positive static pressure on the friction surface first increased from 32.15 Pa to 40.94 Pa and then decreased to 27.81 Pa, while the static pressure difference first increased from 63.75 Pa to 72.33 Pa and then decreased to 54.47 Pa. A larger positive static pressure indicates a stronger load-carrying capacity of the lubricating film, whereas a larger static pressure difference reflects a stronger hydrodynamic effect of the lubricant between the friction pairs. Among all samples, S2 not only exhibits the highest positive static pressure and static pressure difference, but also shows the most pronounced vortex flow and fluid disturbance in the streamline diagrams, indicating that the lubricant can generate stronger local recirculating flow and hydrodynamic lubrication effects at this texture density, thereby achieving the best friction-reduction performance. The stronger load-carrying capacity and enhanced hydrodynamic lubrication effect of the lubricating film effectively reduce the direct contact and frictional resistance between the friction pairs. Therefore, lower friction coefficients correspond to weaker scratching and plowing effects, which also explains the variation trends in the friction coefficients and wear rates of S1, S2, and S3 with changes in texture density.
Further analysis of the oil film pressure variation curves along the YZ central plane in Figure 7, extracted from the static pressure contours, shows that S1 and S2 exhibit significant pressure accumulation, with both positive and negative pressures continuously increasing along the flow direction, while S3 shows relatively stable pressure variations. Among them, S2 exhibits the most pronounced pressure accumulation, with a maximum positive pressure of 46.11 Pa and a maximum negative pressure of 0.45 Pa, resulting in a maximum pressure difference of 46.56 Pa. In contrast, the maximum pressure differences of S1 and S3 are only 17.73 Pa and 1.31 Pa, respectively. The larger positive and negative pressures enhance the hydrodynamic effect of the fluid and strengthen the load-carrying capacity of the oil film 24 , which helps separate the friction pair interface and improve the antifriction performance. This is also one of the main reasons why the friction coefficient curve of S2 in Figure 4(a) is at the lowest position.
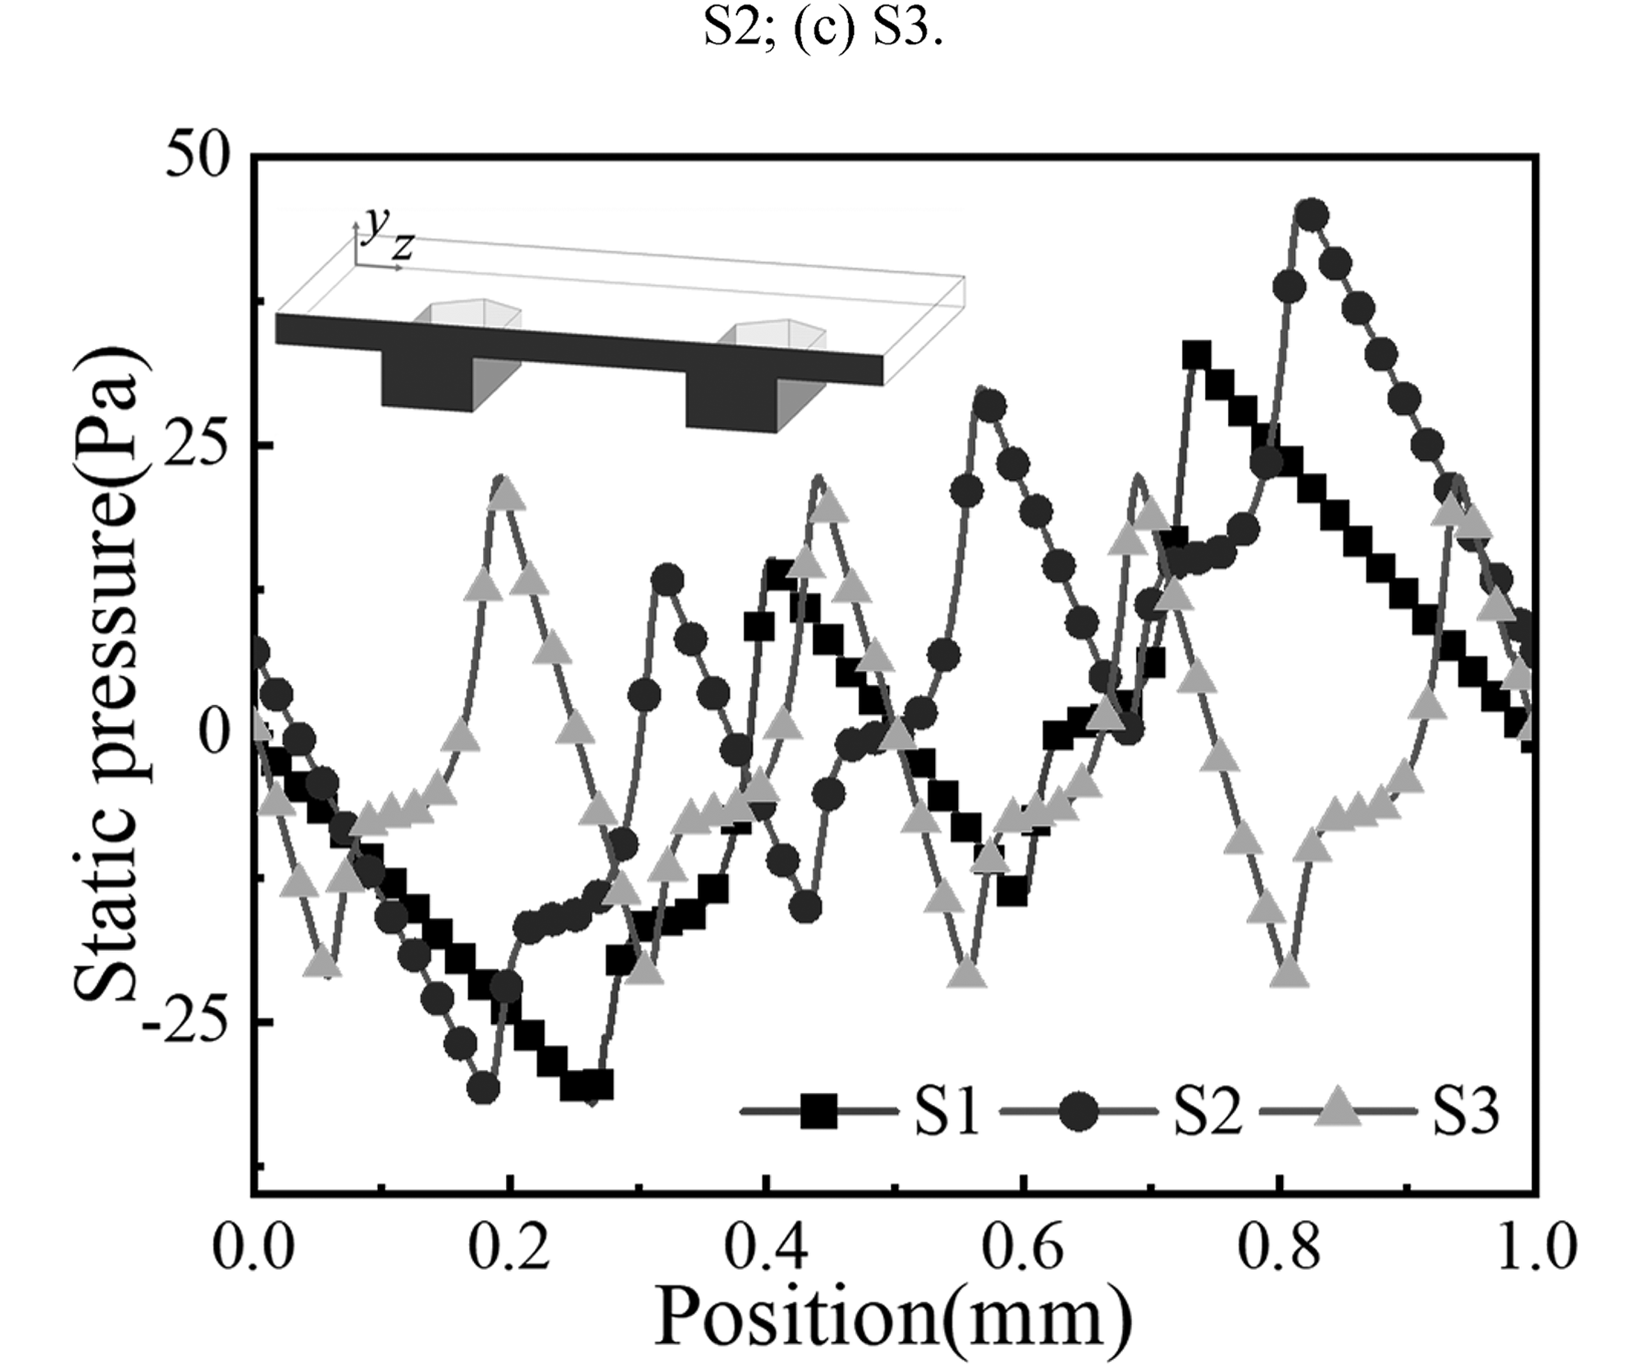
Curves of oil film pressure variation at the YZ central plane for different texture area ratios.
As shown in the SEM morphologies of the wear scars for each sample in Figure 8, wear grooves of varying degrees appear along the sliding direction, and microcracks are observed at the groove edges. This indicates that all samples experienced different degrees of adhesive wear and fatigue wear during friction. Once microcracks formed at the groove edges, they propagated further under extrusion and friction, resulting in material peeling and debris generation. These debris particles became embedded in the grooves and acted as abrasive particles, meaning that mild abrasive wear also occurred during the friction process.
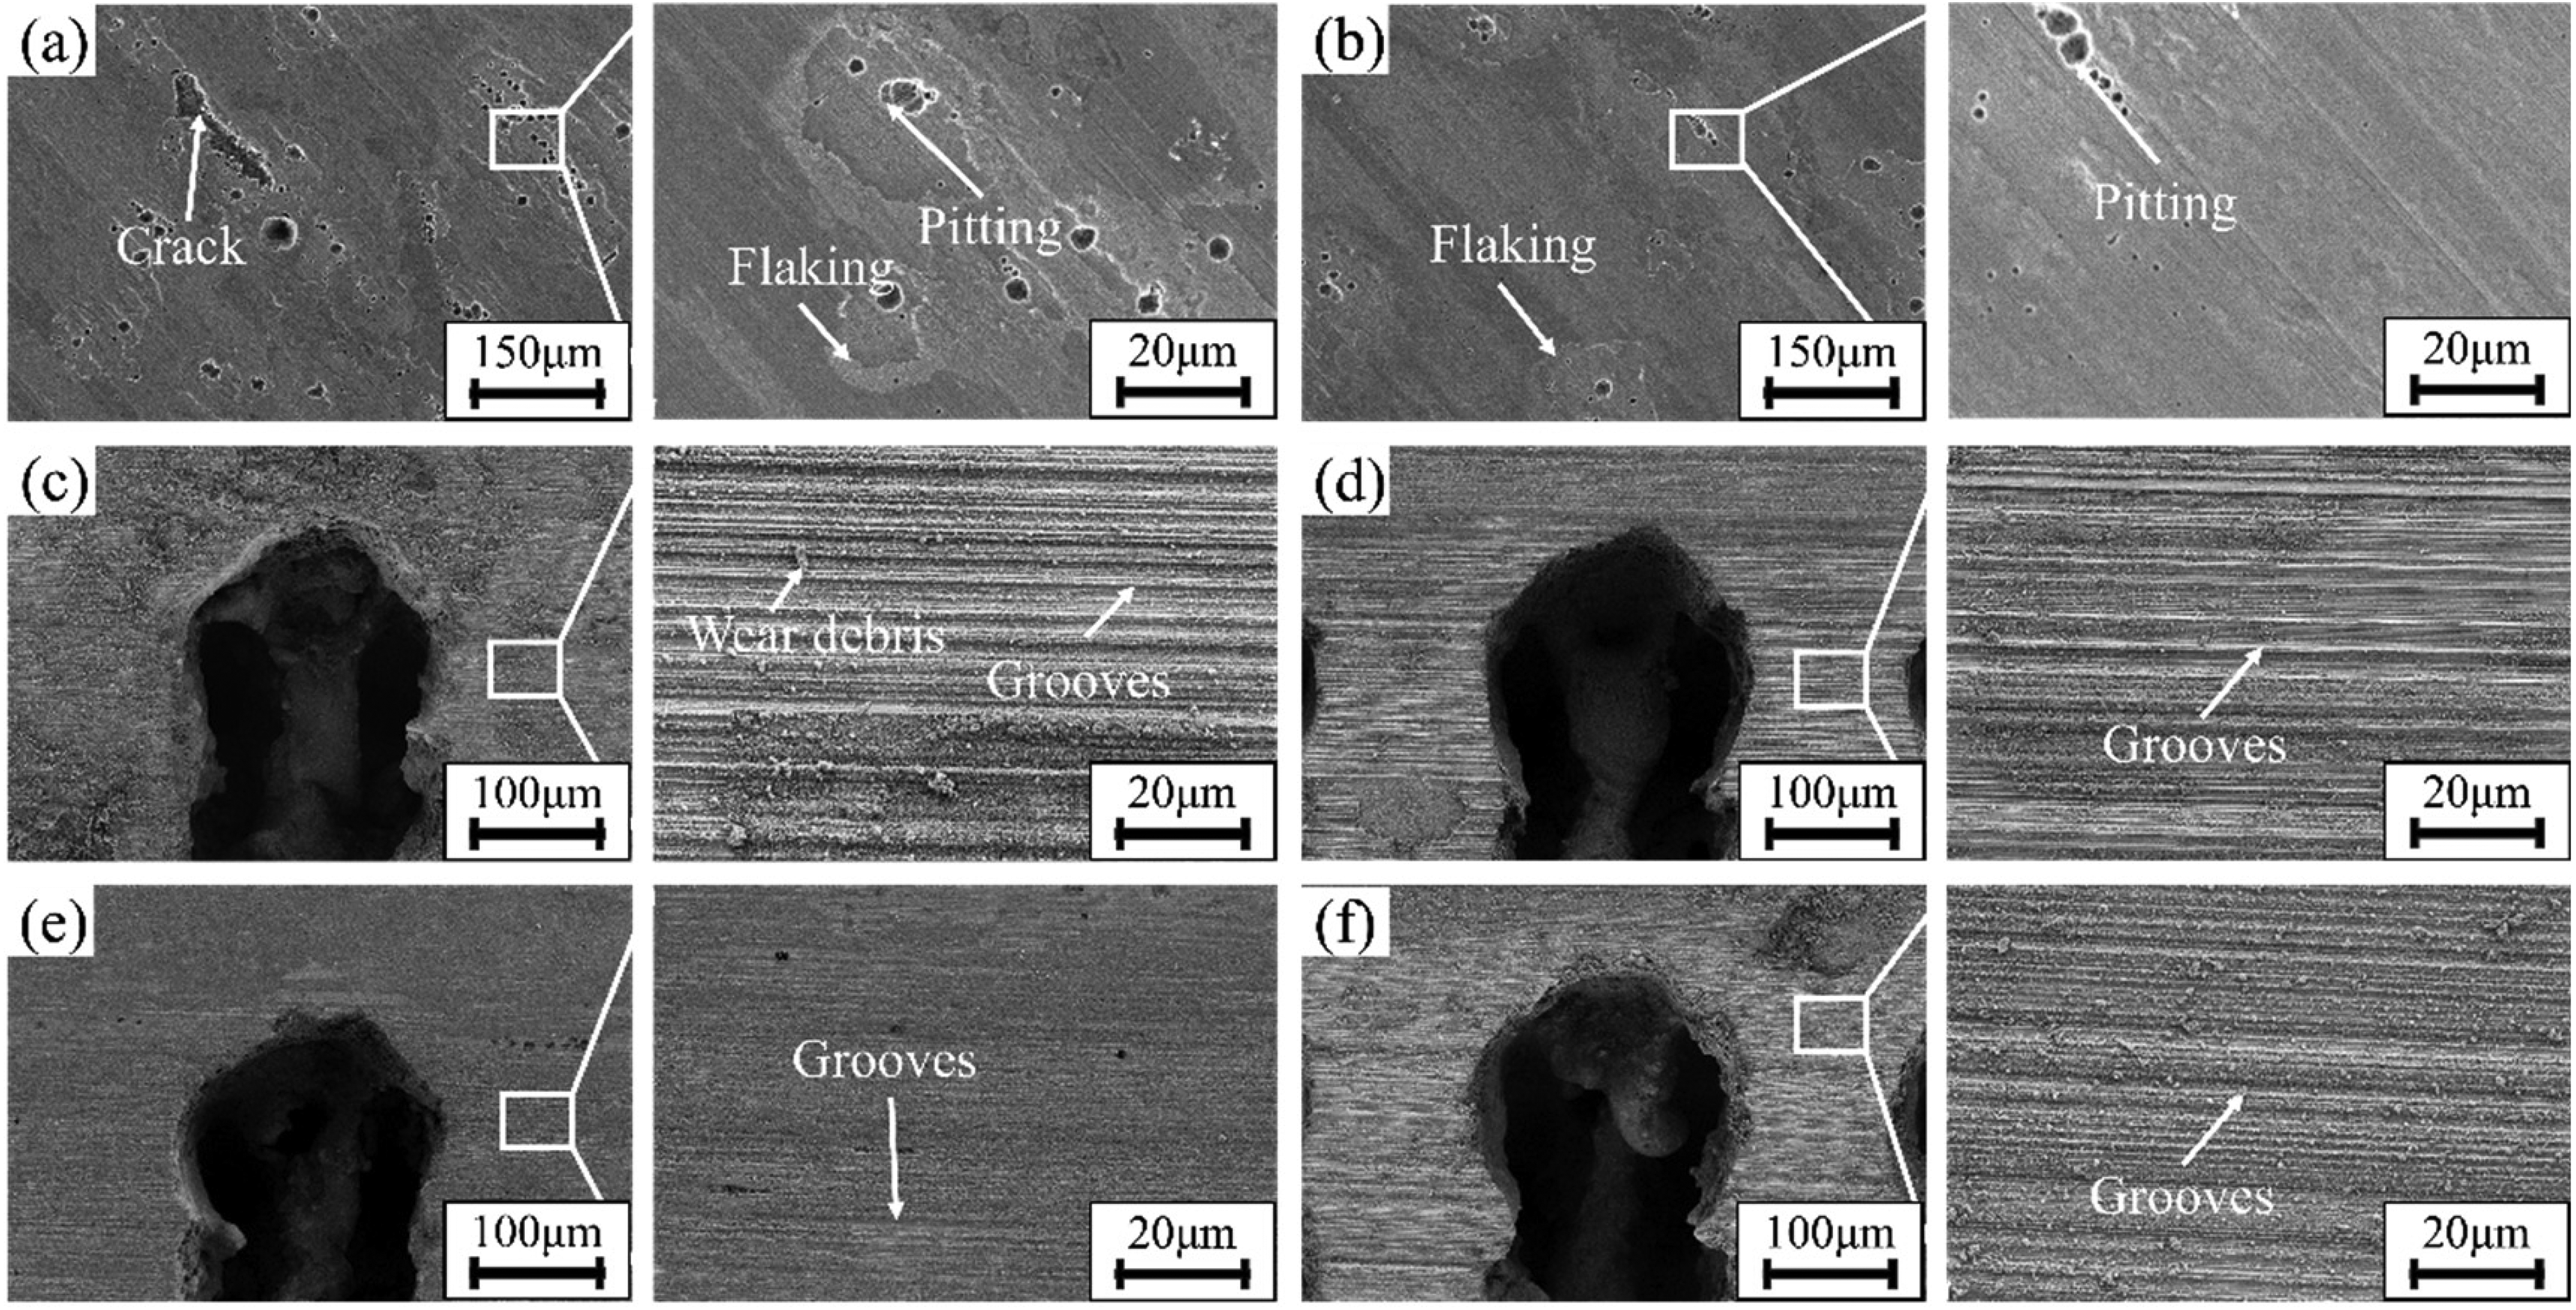
SEM morphology of wear scar of different samples: (a) W0; (b) W2; (c) W1; (d) S1; (e) S2; (f) S3.
Severe wear was observed in Figure 8(a), where the wear scar of W0 exhibited numerous tears, pits, and flake-like delamination, indicating that adhesive wear, fatigue wear, and abrasive wear dominated the friction process. In Figure 8(b), the worn surface of W2 shows a few pits and flake-like delamination, mainly due to its high surface roughness and high friction coefficient. However, the hard surface layer produced by shot peening effectively suppressed abrasive and fatigue wear.
In contrast, the wear scars in Figures 8(c)–(f) show much lighter damage than those in Figures 8(a) and (b). The microtextures remain clearly visible after a sliding distance of 120 m, showing no signs of wear failure. This indicates that the hydrodynamic effect induced by the microtexture effectively reduced wear during friction. In Figure 8(c), a large amount of fine wear debris fills the microtexture grooves, and the wear grooves along the sliding direction are more pronounced than those in Figures 8(d)–(f), indicating that W1 experienced more severe wear than S1, S2, and S3. This shows that single microtexturing on unpeened 65 Mn steel plow surfaces cannot effectively improve wear resistance.
The wear scars of S1, S2, and S3 (Figures 8(d)–(f)) are smoother and more uniform. In Figure 8(d), the wear grooves and debris in the textured region are lighter than in Figure 8(c). In Figure 8(e), the wear grooves are smooth and nearly disappear, showing that S2 experiences significantly less wear than S1 and exhibits greatly improved wear resistance. According to the ANSYS Fluent simulation, the microtexture with a 27% texture density produces a stronger hydrodynamic effect and higher load-carrying capacity of the fluid film, effectively reducing friction and wear.
In Figure 8(f), however, the grooves deepen again and the debris becomes denser, indicating more severe wear. This is because the excessive texture density greatly reduces the untextured area, causing stress concentration on the counterface, breaking the continuity of the fluid film, worsening the lubrication condition, and leading to adhesive and abrasive wear.
The surface roughness increase caused by single shot peening on 65 Mn steel plow surfaces leads to a higher friction coefficient, but the resulting hard surface layer enhances wear resistance. Single microtexturing can also improve friction reduction and wear resistance, though the effect is limited.
The combined shot peening/microtexture modification significantly improves the friction-reducing and wear-resistant properties of 65 Mn steel plow surfaces to varying degrees. When the texture density is 27%, the friction coefficient and wear rate are reduced by up to 25.58% and 69.14%, respectively, compared with the unmodified sample.
ANSYS Fluent simulations show that appropriate texture density increases the pressure difference and enhances the load-carrying capacity of the lubricating film, forming a pronounced hydrodynamic effect. This is the main reason for the improved tribological performance. The microtexture inspired by the red-banded snake ventral scales with a 27% texture density (S2) achieves the maximum pressure difference and optimal hydrodynamic effect, resulting in the best friction-reducing and anti-wear performance.
Footnotes
Acknowledgements
The authors gratefully acknowledge financial support from the Yunnan Province Agricultural Basic Research Joint Special Key Project of China (grant This research was funded by the Yunnan Province Agricultural Basic Research Joint Special Key Project of China (Grant No. 202301BD070001-012), the authors gratefully acknowledge their financial support. The authors also wish to thank the Key Laboratory of Forest Disaster Warning and Control of Yunnan Province for their valuable support.
Author contributions
Funding
The authors disclosed receipt of the following financial support for the research, authorship, and/or publication of this article: This work was supported by the Yunnan Province Agricultural Basic Research Joint Special Key Project of China, (grant number 202301BD070001-012).
Declaration of conflicting interests
The authors declared no potential conflicts of interest with respect to the research, authorship, and/or publication of this article.
Data availability
Data will be made available on request.