
Abstract
The extensor carpi ulnaris musculotendinous unit has important agonist and antagonist action in wrist motion, including the dart-throwing action, and is a dynamic stabilizer of the distal radioulnar joint during forearm rotation. Despite its functional and clinical importance, little is known about its internal structure. Investigation of the ultrastructure of the human extensor carpi ulnaris (ECU) tendon was undertaken using plane polarized light microscopy and microcomputer tomography with 3D reconstruction. The study demonstrates that the tendon comprises fibre bundles (fascicles) approximately 0.1 mm in diameter that are arranged in a gradual spiral. The spiralling fibres make an angle of 8º to the longitudinal axis of the tendon. The spiral structure of the human ECU tendon has important biomechanical implications, allowing fascicular sliding during forearm rotation. The observed features may prevent injury.
Introduction
Tendons comprise highly organized fascicles of parallel collagen fibrils (Wang, 2006). These fascicles are arranged along the longitudinal axis of the tendon. A spiral structure in mature human tendon has been reported in flexor digitorum superficialis and flexor digitorum profundus tendons (Walbeehm and McGrouther, 1995). The extensor carpi ulnaris (ECU) tendon passes through the sixth dorsal extensor compartment and lies on an osseous groove between the head of the ulna and its articular surface before inserting into the base of the fifth metacarpal.
X-ray tomography has been used to investigate 3D structures and widely applied to the study of bone (Bouxsein et al., 2010; Muller, 2009; Poukalova et al., 2010), where the absorption of X-rays by bone is used to obtain contrast. Recent technical advances have enabled additional image contrast to be derived from the shift in the phase of X-rays as they pass through an object. Phase contrast has allowed soft-tissue structures, such as lung and breast tissue, to be successfully imaged (Keyrilainen et al., 2010; Lewis et al., 2005). This study aimed to determine the orientation of collagen fascicles in the human ECU tendon using light microscopy and high-resolution phase-contrast X-ray microscale computer tomography (micro CT).
Methods
Fresh-frozen cadaveric human specimens were obtained from the human donations program (Anatomy Gifts Registry, Hanover, Maryland) and were handled according to local ethical guidelines (07-Q1406-7; North Manchester Research Ethics Committee, UK). Three separate ECU tendon specimens were used (two right arms from donors aged 53, 58 years; one left arm from a donor aged 61 years). Arms had no previous surgery and, on inspection, were free from disease or degenerative changes. ECU tendons were harvested with the forearm held in the neutral position of rotation. The imaging techniques used required removal of the tendon from the donor arm; therefore, it was essential to preserve the in situ anatomical position of the tendon. This was achieved by attaching a plastic rod to the dorsal aspect of the ECU tendon at three points along its length using an interrupted suture. By placing the sutures with the tendon in situ, the normal tension of the tendon was maintained. Three sutures were sufficient to completely prevent rotation of the tendon once removed. Placing extra sutures would have interfered with the imaging techniques by obstructing the view of the tendon. Attachments of the ECU tendon to the ECU muscle and fifth metacarpal base were then dissected and the tendon removed with the rod attached. This procedure was carried out to prevent untwisting of the tendon during harvest. The tendon was stored in a sealed plastic tube with 5 ml of phosphate buffered saline solution to prevent specimen dehydration.
Plane polarized light retards birefringence and allows visualization of internal structures of collagenous tissues (de Campos Vidal, 2003; Franchi et al., 2010). The ECU tendon was examined still attached to the positioning rod with plane polarized light using an SMZ1000 microscope fitted with crossed polarizing light filters (Nikon, Richmond, UK). Three separate ECU tendons were imaged using this technique. Images were taken with a digital camera (Nikon Coolpix 5000, Richmond, UK) attached using a C mount.
Having investigated the ECU tendon using plane polarized light microscopy, ECU tendon specimens were examined using an Xradia MicroXCT system (Xradia, Pleasanton, California, USA). The system is based on a cone-beam geometry and comprises a high-resolution detector system, rotation stage, and polychromatic X-ray source with a tungsten target and 7 µm spot size. With this system, in-line phase contrast can be used at high resolutions to add contrast to the internal boundaries of weakly absorbing objects (Bradley et al., 2010). Interference between X-rays, which have passed either side of a boundary, leads to the formation of interference fringes at the detector. Typically, one bright fringe and one dark fringe are formed either side of the boundary in the radiographs. The intensity and width of these fringes can be optimized through choice of source voltage, together with the distances between sample and source (R1), and sample and detector (R2). Prior research has determined that for this system, phase contrast increases with both R1 and R2, with the rate of increase reducing at large distances (Bradley et al., 2010).
The harvested ECU tendons were 15–18 cm long. The entire ECU tendon was placed in the scanner attached to the positioning rod. The scan was focused on a 4.5 mm long section of the tendon that was 2 cm proximal to the tendon attachment to the fifth metacarpal. The tendon was scanned without disturbing the tendon, which remained anchored to the stabilizing rod throughout the imaging sequence. A source voltage of 40 kV, source–sample distance of 75 mm, sample–detector distance of 150 mm, and detector pixel size of 4.4 µm were used. The distances were chosen as a compromise between maximizing phase contrast and limiting the total scan time, because the X-ray flux at the detector decreases as the second power of the distance between source and detector. The scan was performed with the ECU tendon placed on the rotation stage in a sealed tube with 5 ml of phosphate buffered saline to prevent dehydration. No contrast agent was added to the tendon. In total, 721 radiographs were taken over 184°, and the 3D tomographic data was reconstructed to give a final voxel size of 8.8 µm. The optimum number of radiographs in a CT scan is related to the spatial frequencies in the object (Kak and Slaney, 2001). We found that 721 radiographs were sufficient to allow the boundaries of the fascicles to be reconstructed and corresponded to a total scan duration of 12 hours, over which no changes in the shape of the tendon were observed. Calculations of the organization of tendon fascicles were made using MATLAB 2010a (MathWorks, Inc., Natick, Massachusetts, USA). Dorsal and palmar fascicles were separated for analysis according to whether they were situated in the dorsal or palmar half of the tendon. Comparison of the orientation direction of dorsal and palmar fascicles was performed using paired t-tests. Significance was set at p < 0.05.
Results
Imaging by plane polarized light microscopy showed fascicles (bundles of collagen fibrils) arranged longitudinally in parallel with the long axis of the tendon (Figure 1A). Fascicles were oriented at an approximate 10° angle with respect to the long-axis of the tendon (Figure 1B). This feature was observed in all three specimens. In the two right arm specimens, a clockwise spiral was observed; in the left arm specimen, a counter-clockwise spiral was seen.
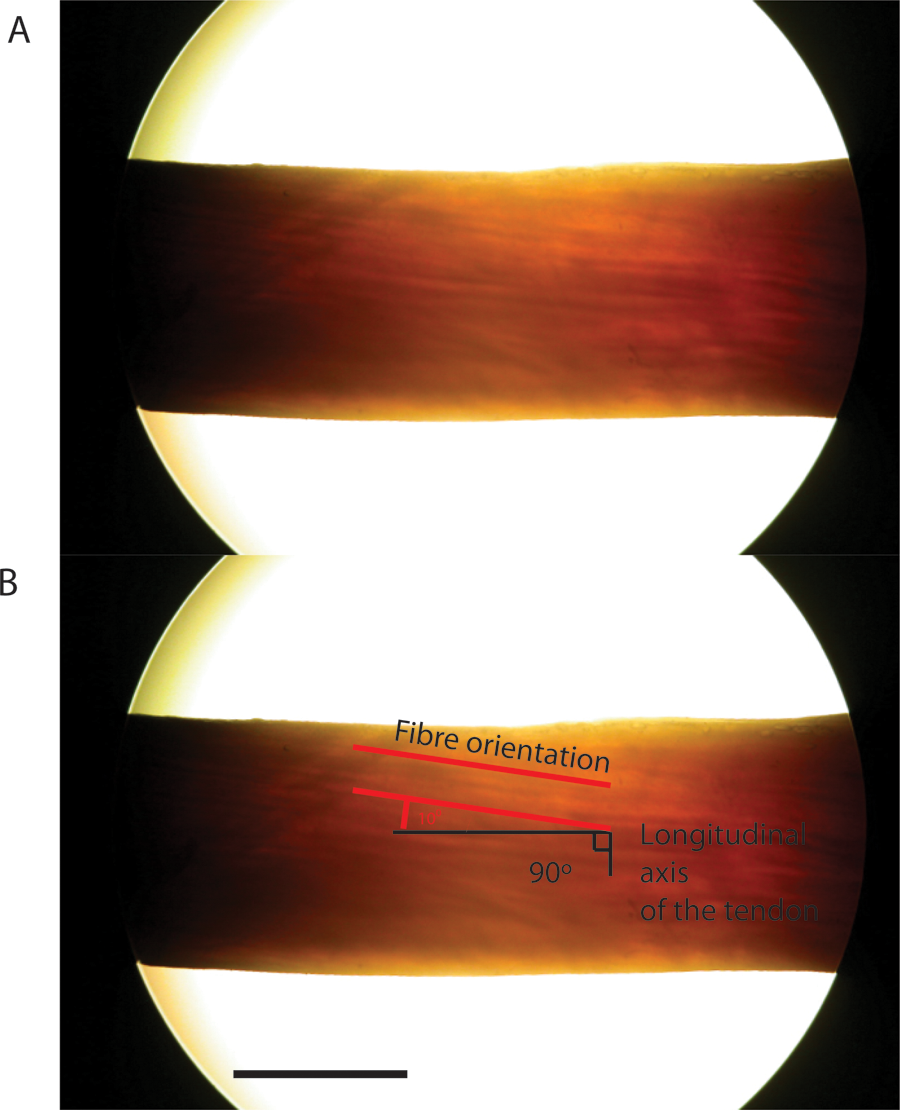
Plane polarized light microscopy of the ECU tendon. A. Plane polarized light image taken of the dorsal surface of the human ECU tendon. B. Fascicle orientation determined relative to the longitudinal axis of the tendon. Scale bar = 5 mm.
As light microscopy only provided 2D images of the surface of the tendon, and no information on the internal structure, specimens were imaged in the micro CT scanner. Micro CT allowed visualization of individual fascicles deep inside the tendon (Figure 2A). These fascicles were assigned a different colour (Figure 2B). Tracking fascicles through the tendon (for 4.5 mm) and 3D modelling reconstructed fascicle position within the ECU tendon. To improve the contrast–noise ratio of the fascicles, the volume was partitioned along the tendon long-axis into 24 sections, each 174 µm thick; slices within each section were then averaged. The fascicles were manually segmented through the volume using Avizo 6.3 software (VSG, Burlington, Massachusetts, USA). Representative images from these reconstructions are shown in Figure 2C–F. The 3D model generated showed that fascicles within the ECU tendon have a clockwise spiral in the right-sided specimen.
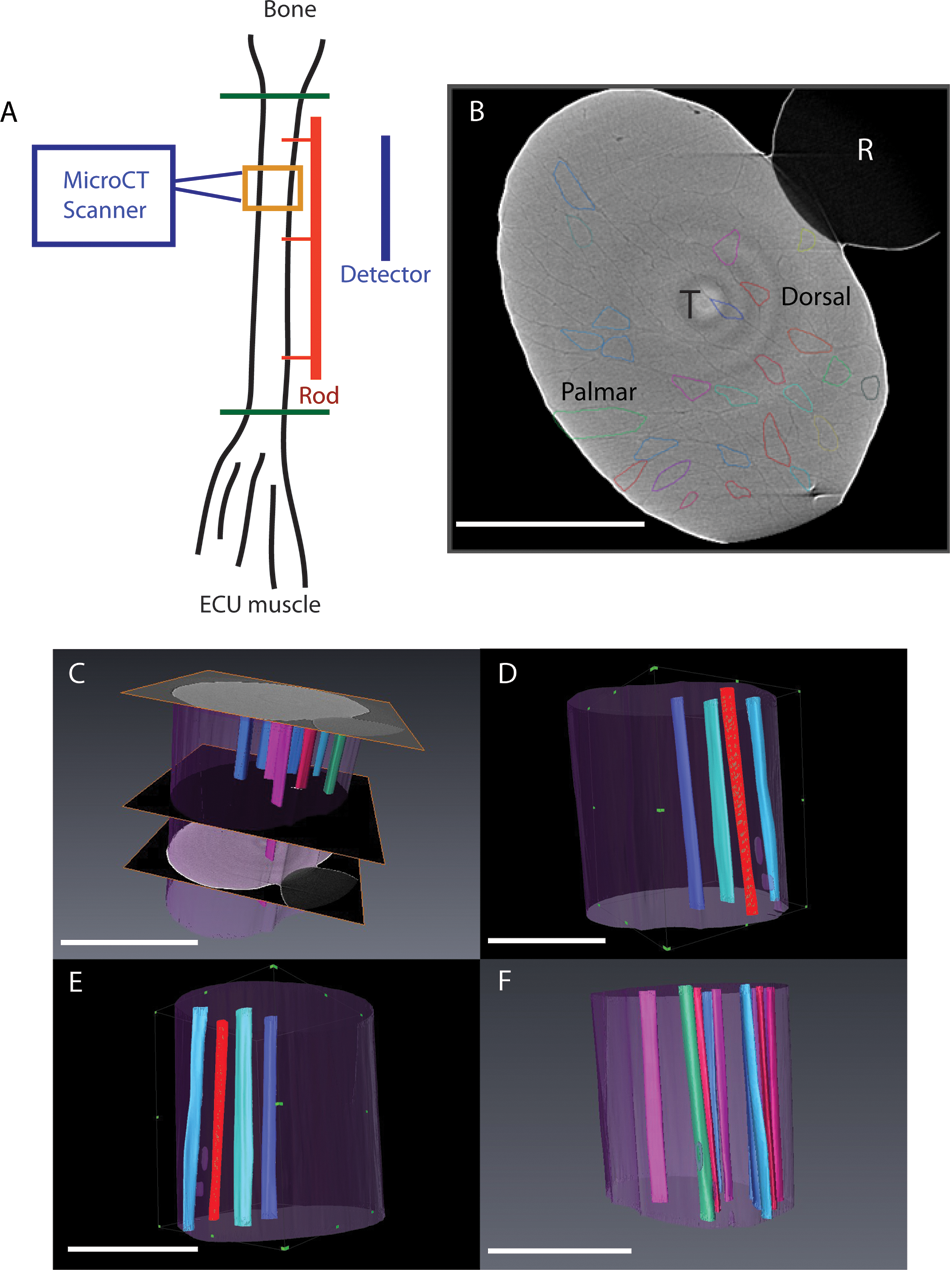
CT scanning and 3D reconstruction of fibre bundles in the human ECU tendon. A. Schematic representation of the ECU tendon positioned in the micro CT scanner. The ECU tendon was dissected away from the ECU muscle and fifth metacarpal (green lines represent points of dissection). The entire ECU tendon was placed in the scanner attached to the positioning rod (red line). The scan was focused on a 4.5 mm long section of the tendon (orange box). The region examined was 3 cm proximal to the point of attachment to the metacarpal. Total tendon length was 15 cm. B. A single slice from the reconstructed volume of the ECU tendon obtained by high-resolution X-ray tomography. The tendon is marked (T). Individual fascicles are highlighted in different colours. (R) marks the guiding rod the tendon was attached to in order to maintain its in vivo configuration (also shown in Figure 1). The dorsal and palmar aspects of the tendon are identified. C. Bundles were traced between sections (n = 400, image shown in Figure 2) over 4.5 mm longitudinal (z) distance. D–F. Different 3D renderings of the segmented fibre bundles demonstrate a gradual spiral. Scale bar = 5 mm.
To demonstrate the change in position of the fascicles, the centroid (geometric centre) of each fascicle was calculated for each of the sections moving along the tendon long-axis. Tracking centroids through the reconstructed volume along the length of the tendon showed the clockwise spiral organization of each fascicle (Figure 3A).
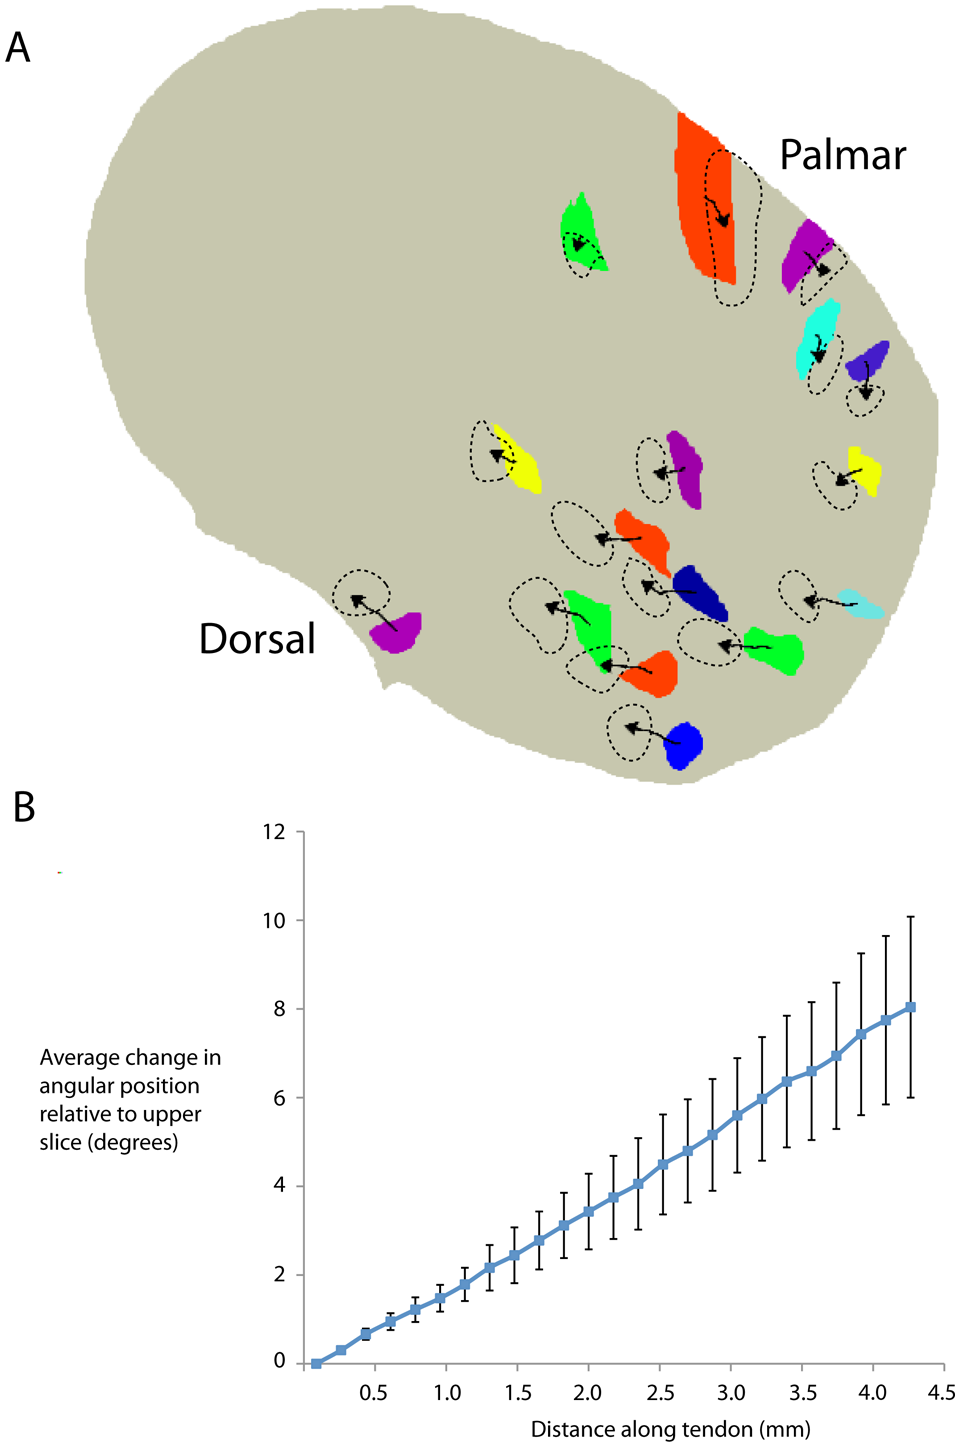
Tracking of fascicle centroids. A. The internal change in position of fascicles was investigated by tracking the position of each fascicle along the tendon. To achieve this, the geometric centre point (centroid) of individual fascicles was assigned using MATLAB. Coloured blocks represent the position of fascicles in the most proximal part of the tendon. Arrowed lines plot the position of the centroid of each fascicle moving proximal to distal along the tendon. The arrowhead marks the final position of centroids and dashed lines outline the final position of fascicles. Tracking of fascicles demonstrated a clockwise internal spiral. For clarity, only 16/25 tracked fascicles are shown. B. Scatter plot demonstrating change in position of the fascicle centroid along the tendon from proximal to distal. Mean fascicle change in position (relative to the starting position) increased along the length of the tendon, demonstrating internal movement (spiralling) of fascicles was consistent along the length of the tendon, demonstrated by linear gradient of the plot. Error bars represent SEM.
The average angle (relative to the tendon centre of mass) rotated through by the fascicles was 8° (SD 5°) (range 5–22°, 25 individual fascicles tracked). Over the 4.5 mm scan length, the change in angle per mm was 1.7° (SD 1.2°). The average total (internal) distance of translation of the fascicles perpendicular to the tendon long-axis over the 4.5 mm length was 227 µm (SD 55). This equates to a complete turn over ~20 cm. There was no difference in spiralling of fascicles in the dorsal (n = 12) part of the tendon compared with fascicles on the palmar part (n = 13, 8.7° [SD 4.4°] vs. 7.4° [SD 5.1°], p > 0.2). Plotting the average change in angular position against longitudinal distance along the tendon revealed a consistent change in position of tendon fascicles, demonstrating a slow, consistent change of fascicle position (Figure 3B).
Discussion
This study describes the internal fascicular structure of the human ECU tendon using plane-polarized light microscopy and high-resolution computer tomography scanning with 3D modelling. The results show that this tendon is composed of fascicles of ~0.1 mm diameter that spiral along the length of the tendon at an angle subtended to the axis of the tendon of ~8°.
We do not know why this might be clinically important, yet. Longitudinal tears may affect the ECU tendon; as these would typically occur during forearm rotation, the spiral pattern may protect the ECU tendon from shear forces between fascicles. Material testing of tendon fascicles has shown negligible lateral transmission of force between adjacent fascicles (Haraldsson et al., 2008). The structure described could be used in future in mathematical modelling (such as by finite element analysis) of the internal forces generated in the ECU tendon.
The spiral arrangement of the human ECU tendon could confer strength and protect against splitting between fascicles during loaded rotation of the forearm. Almost all power grip tasks involve some rotation of the forearm, and spiralling of the fascicles in the tendon could represent an adaptive response to these stresses.
Footnotes
Acknowledgements
The authors would like to thank A. S. Flemming and H. E. Kleinert for discussions on unpublished FCR analysis.
Conflict of interests
None declared.
Funding
This work was supported by grants from the Stanley Thomas Johnson Foundation and from the Royal College of Surgeons of England (to PSCM and VCL).
Ethical approval for this study was obtained from North Manchester Research Ethics Committee (07-Q1406-7).