
Abstract
Introduction:
Health state utility values describe the desirability of health states and are needed to calculate quality-adjusted life years. Traditionally, they are derived using generic measures such as the EuroQol 5-Dimension scale. No hand-specific measures can be used to derive them. This study aimed to develop and evaluate mapping algorithms to estimate the EuroQol 5-Dimension utility index from the Patient Evaluation Measure.
Methods:
Matched Patient Evaluation Measures and EuroQol 5-Dimension 5-Level data from 2043 patients were used to develop mapping algorithms. Transfer-to-utility models were developed and assessed through a 1000-fold bootstrap validation.
Results:
We present a range of mapping algorithms to derive health state utility values from the Patient Evaluation Measure, a commonly used hand-specific Patient Reported Outcome Measure (PROM). The population-level prediction error of our best performing models was clinically relevant.
Conclusions:
This suggests that mapping hand-specific PROMs on to generic preference-based measures may not be appropriate.
Level of evidence:
II
Keywords
Introduction
The current tax-funded, free at the point of use healthcare model adopted by the UK National Health Service (NHS) requires complex resource allocation decisions to be made to ensure financial stability (Barr et al., 2014). Policymakers must ensure that appropriate techniques are used to measure the cost of interventions.
Quality-adjusted life years (QALYs) enable life years to be adjusted to reflect health experienced during those life years (Lizan Tudela et al., 2009). The quality component of QALYs is known as the ‘utility value’ associated with a given health state. Utilities are typically scaled from 0 (equivalent to instant death) to 1 (equivalent to full health) (Raisch, 2000). The number of QALYs relating to a specific health state is expressed as the utility value of a given health state multiplied by the length of time in that health state. Multi-attribute utility scales, such as the EuroQol 5-Dimension (EQ-5D), are commonly used to estimate utilities. The EQ-5D has a generic health classification system and a set of utility values assigned to each described health state (Herdman et al., 2011). It is widely accepted by policy makers and is the preferred instrument for technology appraisal in the UK (NICE, 2013).
Where EQ-5D utilities for a health state are not available, the National Institute for Health and Care Excellence (NICE) recommends that utilities are derived by mapping available outcome measures onto preference-based Patient Reported Outcome Measures (PROMs) such as the EQ-5D (NICE, 2013). The use of mapping algorithms in technology appraisal has grown substantially. A recent systematic review identified 144 mapping studies reporting 190 models from 110 distinct patient reported outcome measures (Dakin et al., 2018). Mapping to predict EQ-5D utilities is of relevance in hand surgery, where hand-specific outcome measures predominate. Less than 5% of published studies reported the use of preference-based measures (such as the EQ-5D), meaning cost–utility analyses cannot be done using existing data (Lloyd-Hughes et al., 2019).
The paucity of primary utility data for hand conditions may mean that interventions are undervalued by cost–utility analyses. This study aimed to develop and evaluate mapping models in the prediction of EuroQol 5-Dimension 5-Level (EQ-5D-5L) utility scores from a commonly used hand-specific PROM, the patient evaluation measure (PEM). The use of mapping algorithms may increase the availability of EQ-5D data for cost utility analysis, meaning that current and new interventions for hand conditions can be accurately appraised.
Methods
This study was conducted and is reported in line with the Mapping onto Preference-based Measures Reporting Standards (MAPS) statement (Petrou et al., 2015). This study used data from the UK Hand Registry (UKHR). The UKHR is a national voluntary registry of all patients undergoing elective intervention for hand and wrist conditions. Patients included in the UKHR are asked to complete both the EQ-5D-5L and the Patient Evaluation Measure at baseline and 3, 6, 9 and 12 months after the intervention. All patients gave informed consent for the collected anonymized data to be used for research before inclusion in the UKHR.
Estimation sample
All consecutive adult patients who were entered in the registry between 2012 and 2020 were assessed for eligibility. Patients with complete, paired EQ-5D-5L and PEM response scores were eligible for inclusion. As this study aimed to develop cross-sectional mapping models, all paired EQ-5D-5L and PEM response scores were pooled, giving a total of 4052 paired responses. We accounted for data clustering associated with repeated observations by calculating robust standard error estimates for reported model coefficients.
Source and target measures
The PEM is a widely used hand-specific PROM (Lloyd-Hughes et al., 2019). It was originally developed as a 10-item PROM with each item scored on a seven-point Likert scale (Macey et al., 1995). A further item examining the duration of pain was added in 2001 (Dias et al., 2001). The UKHR used the original 10-item PEM until 2017, after which the updated 11-item PEM was used. The 10- and 11-item PEMs are scored from 10 to 70 and from 10 to 77 respectively, with higher scores indicating greater disability. To maximize the use of available data, we included response sets from both the 10- and 11-item PEMs in the UKHR. We reverse-scaled PEM responses to improve interpretability, meaning that responses to the 10- and 11-item PEMs were rescaled from 0 to 100 with higher scores indicating better function.
The EQ-5D is a generic, preference-based measure of health with five domains: mobility, self-care, usual activities, pain and discomfort, and anxiety and depression. It was originally developed with a three-point Likert scale (EQ-5D-3L) (Dolan, 1997). Subsequently, a five-level response PROM (the EQ-5D-5L) was developed (Herdman et al., 2011). This comprises the same health domains assessed on a five-point Likert scale. The health states described by the EQ-5D-5L have been examined in members of the UK general population and associated health state utility values have been determined using time trade off (Devlin et al., 2018). The UKHR records the EQ-5D-5L raw score. Raw scores were transformed to utility values using the UK value set and the R package ‘eq5d.’
Models
Transfer to utility models were studied. These models, also known as direct utility mapping models, aim to predict EQ-5D utilities from total PEM response scores. The distribution of EQ-5D utilities was examined and regression techniques were selected accordingly. Table 1 gives an overview of regression techniques. A comprehensive overview of models used has been published elsewhere (Hernandez and Wailoo, 2015). The distribution of EQ-5D scores observed in the present study is in line with previously reported data across a range of health states (including those experienced by patients with conditions affecting the upper limb) and has several key characteristics, including a mass of observations at full health (utility score of 1), a gap between full and intermediate health states and a non-normal distribution (Hernandez Alava et al., 2018; Valsamis et al., 2023).
Model specifications.
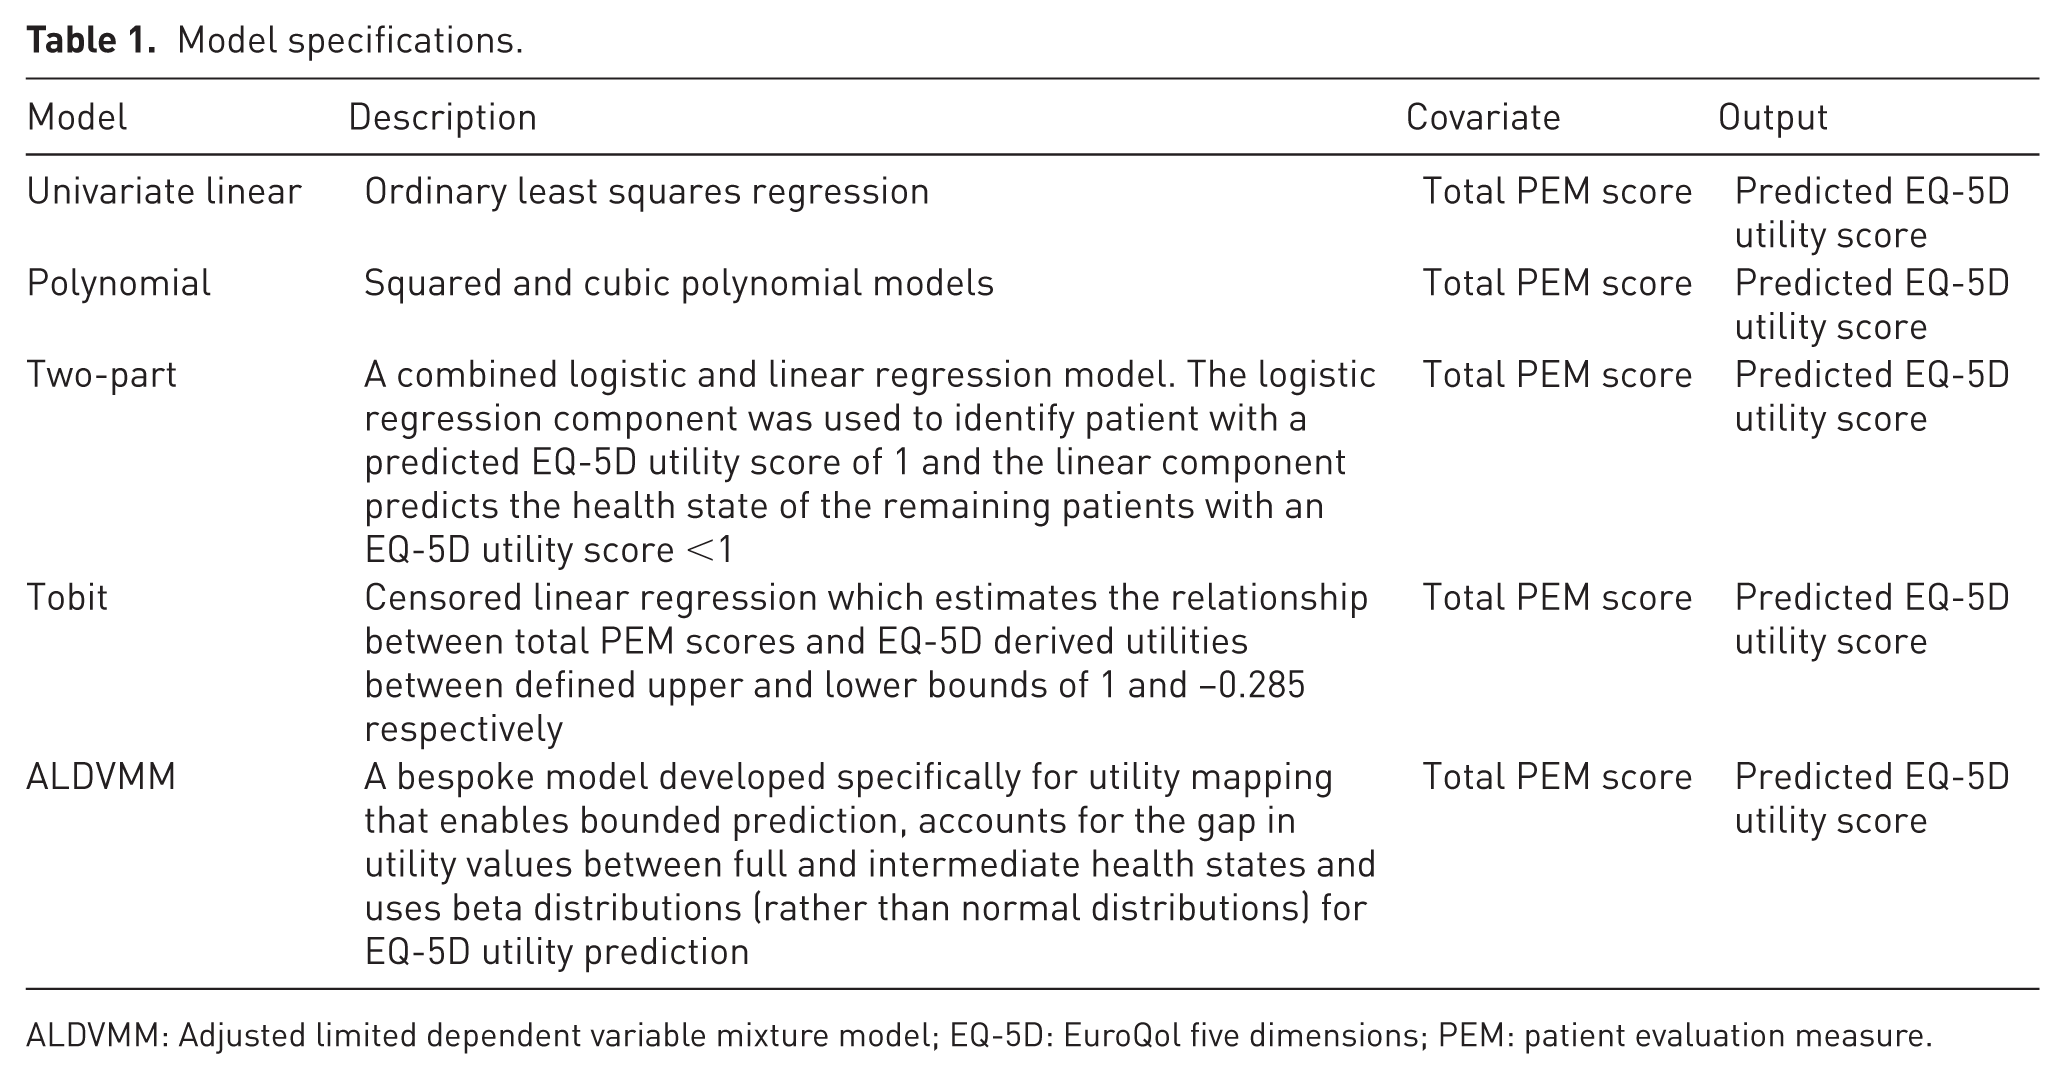
ALDVMM: Adjusted limited dependent variable mixture model; EQ-5D: EuroQol five dimensions; PEM: patient evaluation measure.
Given these properties of distribution, we considered multiple modelling approaches. Tobit (censored) regression was used to address the upper bound of EQ-5D utilities at 1, ensuring that predicted values remained within a plausible range. However, given the clear gap between full and intermediate health states, a two-part model was also used. This approach incorporated an initial logistic regression step to classify patients with a utility score of 1 separately from those with lower scores, followed by a linear regression for patients with utilities below 1. This strategy accounted for the clustering of data at full health while improving the accuracy of prediction for those with intermediate health states. An adjusted limited dependent variable mixture model was also applied to account for the non-normal EQ-5D distribution, the mass of obervations at 1 and the gap between full and intermediate health states. The observed distribution of EQ-5D response data and subsequent model selection is in keeping with contemporary EQ-5D mapping studies (Dakin et al., 2018). Table 1 gives the full descriptions of the models. We did not evaluate the effect of covariates such as age, gender, condition and intervention, to improve the generalizability of our model.
Validation
An external validation dataset was not used in the present study owing to lack of available data. Instead, we randomly split our dataset into training (80% of the total data) and testing (20% of the total data) samples. Models were developed using the training dataset, and model fit was then assessed using the testing dataset. We used bootstrap resampling to measure model stability through a 1000-fold repeated random split (Henderson, 2005). This means that our dataset was randomly split 1000 times into training and testing sets; each time our models were developed and assessed on different datasets. We then calculated overall model performance in the 1000 datasets.
We assessed mean absolute error (MAE), mean square error (MSE) and root mean square error (RMSE) between observed and predicted EQ-5D utility scores as primary measures of model performance. We averaged measures of model performance across the 1000 testing datasets. All statistical analyses were undertaken using R (R Core Team, 2013).
Results
The final dataset included 4503 paired EQ-5D-5L and PEM responses from 2043 patients. There were missing data (defined as incomplete matched EQ-5D-5L and PEM responses) for 2611 patients. Of the included patients, 72% were diagnosed with base of thumb osteoarthritis (n = 1472), 2% were diagnosed with cubital tunnel syndrome (n = 35) and 26% were diagnosed with Dupuytren’s disease (n = 536). The median age of the included patients was 65 years (range, 52–78), 36% of patients were male (n = 744) and 64% were female (n = 1299).
The distributions of EQ-5D-5L index and reverse scaled PEM scores are shown in Figures 1 and 2, respectively. The distribution of EQ-5D-5L index values has a mass of observations at 1 (equivalent to perfect health) with a gap in utility values between full (utility score 1) and intermediate (utility score 0.95) health states, in line with the UK EQ-5D-5L valuation tariff (Devlin et al., 2018). The distribution of reverse-scaled PEM scores is approximately symmetrical with a slight left skew (absolute value of skewness −0.275). Both EQ-5D-5L utility and reverse-scaled PEM scores showed clustering by condition (Figures 3 and 4).
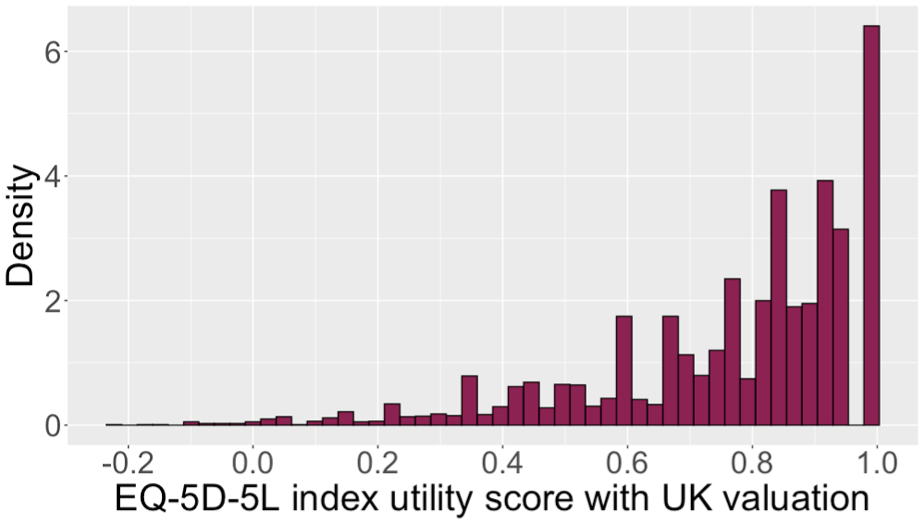
EuroQol 5-Dimension 5-Level (EQ-5D-5L) utility distribution.
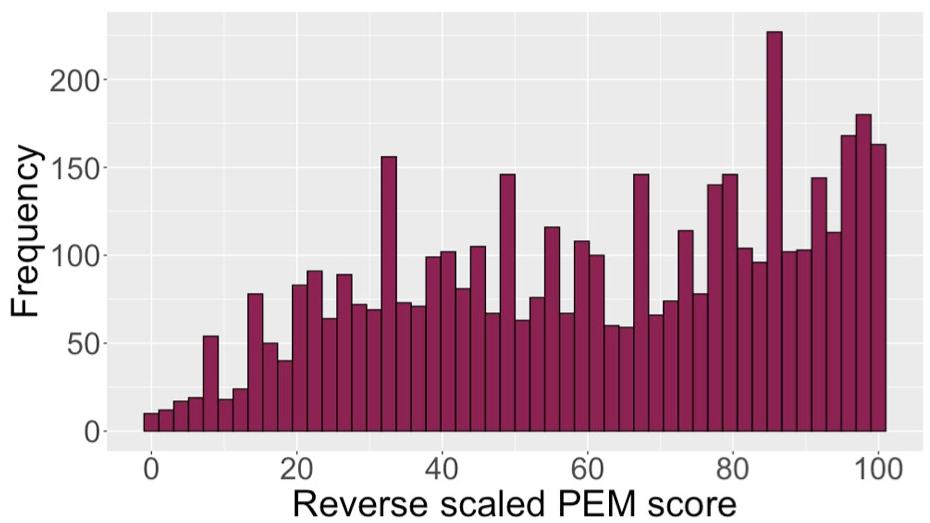
Reverse scaled patient evaluation measure distribution.
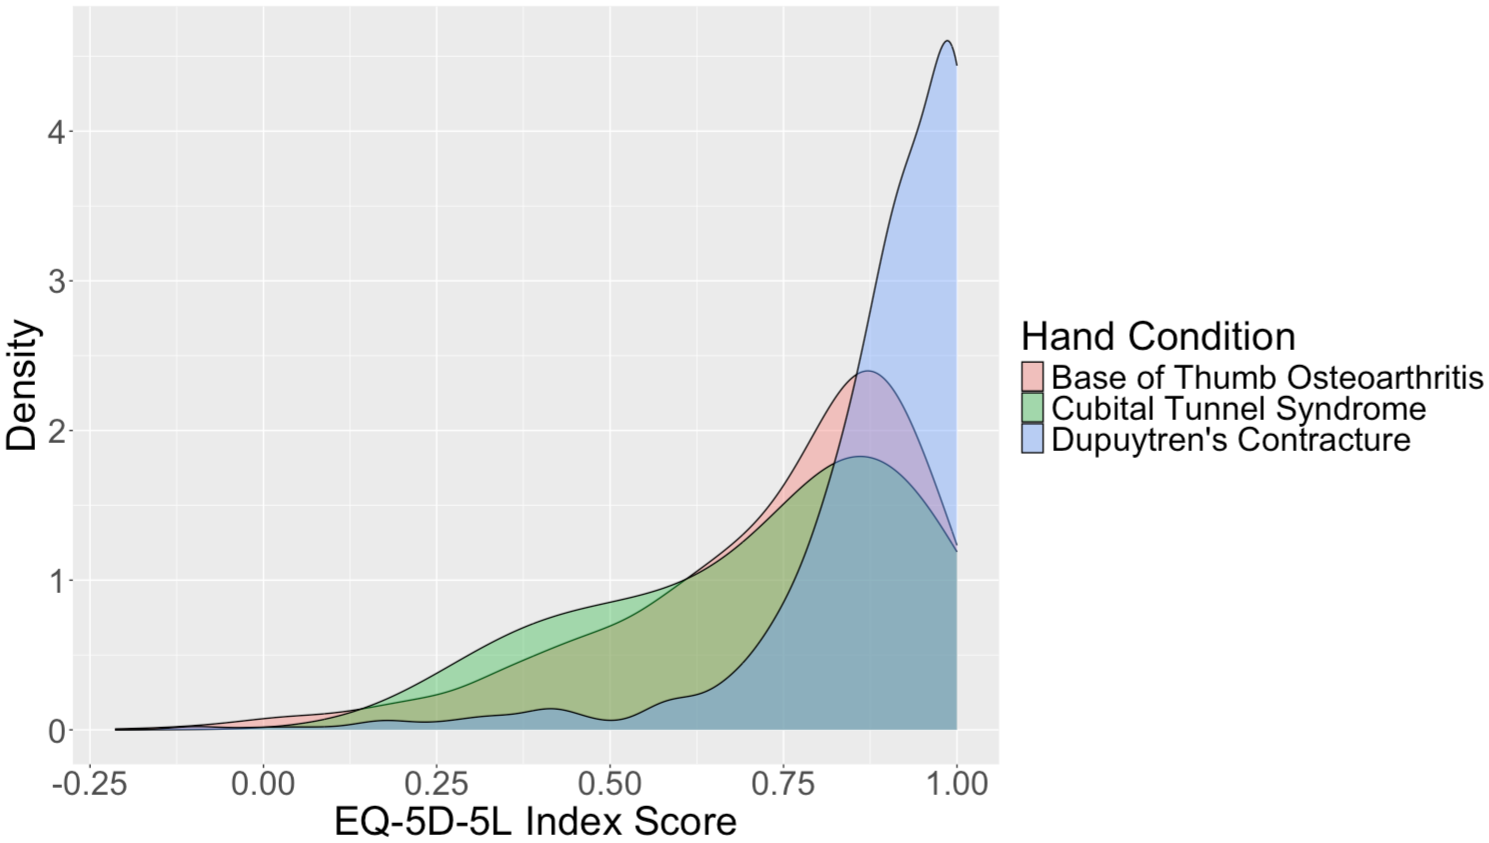
Density plot of EuroQol 5-Dimension 5-Level (EQ-5D-5L) utilities stratified by condition.
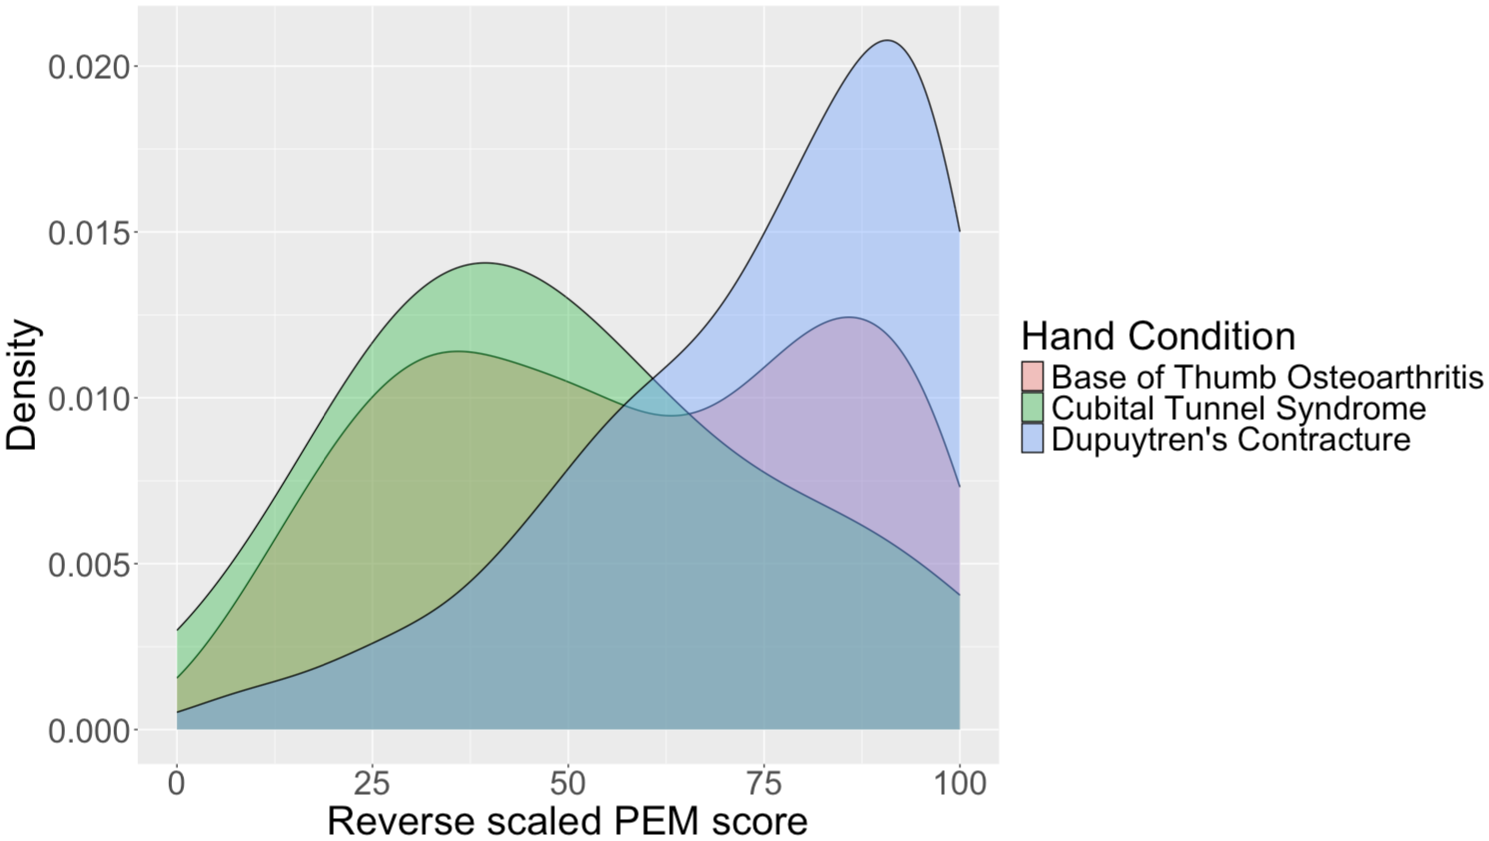
Density plot of reverse scaled patient evaluation measure scores stratified by condition.
The mean and standard deviation for each performance measure across the testing data subsets are presented in Table 2. The Tobit (censored regression) model had the lowest MAE (0.127) followed by the two-part model (0.128). The Adjusted Limited Dependent Variable Mixture Model (ALDVMM) had the highest MAE (0.132), whereas the Tobit had the highest RMSE (0.184).
Summary model performance values. The mean and standard deviation for each performance measure after 1000-fold split into training and testing subsets are presented.
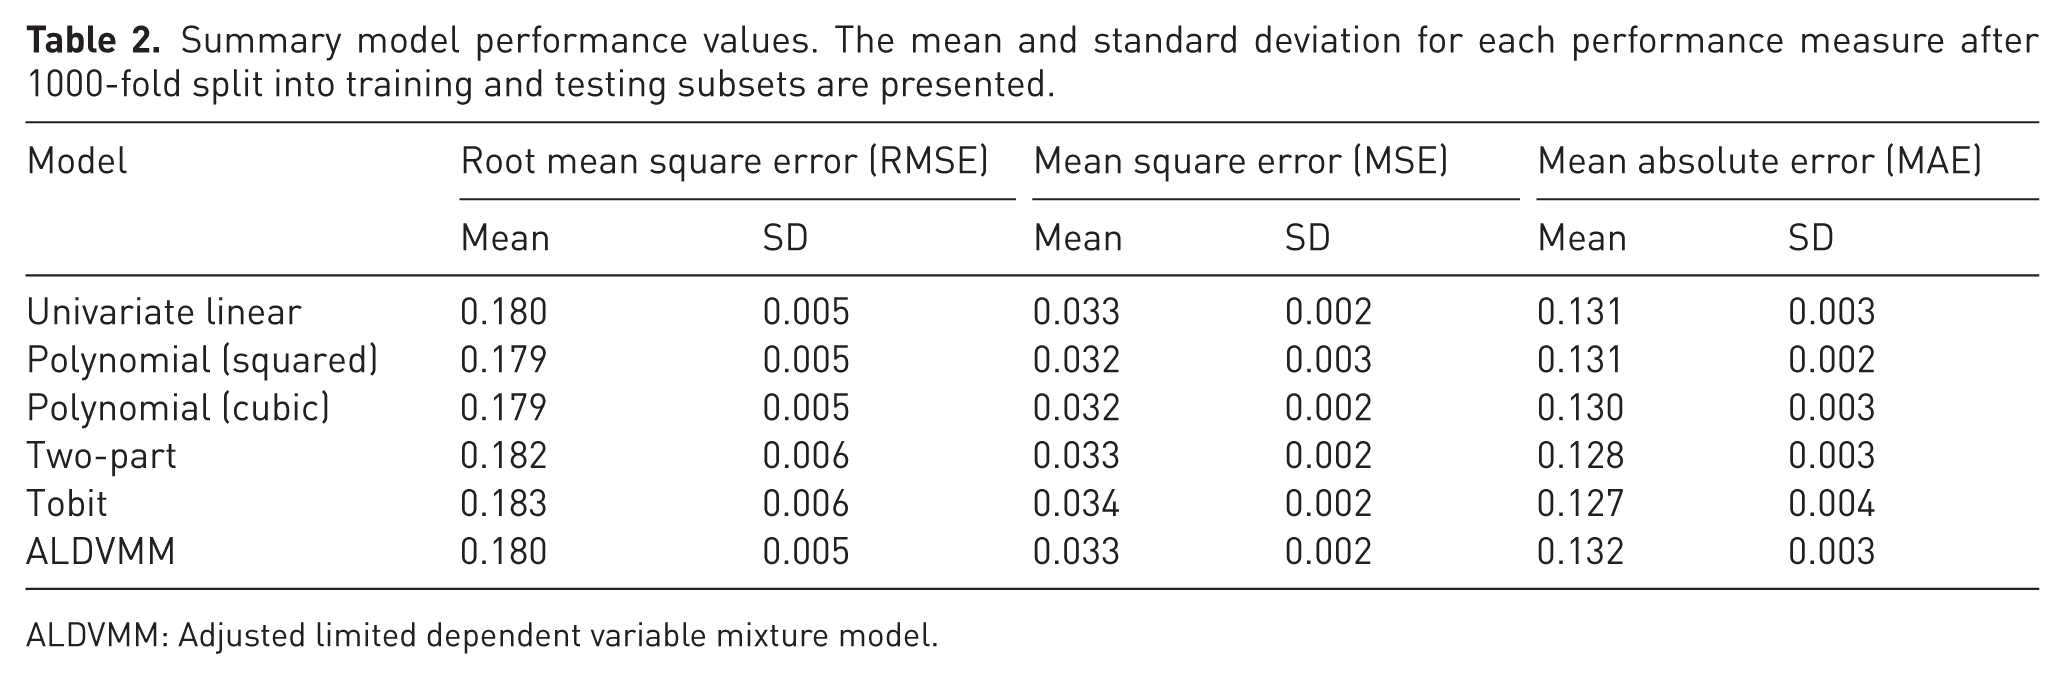
ALDVMM: Adjusted limited dependent variable mixture model.
Discussion
This study presents a range of transfer-to-utility mapping algorithms to derive health state utility values from the PEM, a commonly used hand-specific PROM. Mapping algorithms were derived using routinely collected data from patients undergoing intervention for elective hand conditions as part of the UKHR.
Despite the use of a large national database in conjunction with sophisticated regression techniques, the population-level prediction error of our best performing models is clinically relevant. Our best performing model, the Tobit censored regression model, had a mean absolute error of 0.127. If we consider a patient with an EQ-5D utility score of 0.5, an error of 0.127 could produce a Health State Utility Value (HSUV) prediction of 0.373 or 0.627. This represents the difference between an individual with severe pain and severe depression and an individual with moderate pain and moderate mobility problems (Devlin et al., 2018). Comparative model performance was not consistent across different performance metrics (MAE and RMSE), with the Tobit model having the lowest MAE while the cubic polynomial model had the lowest RMSE. This is probably due to differences in residual size and differences in error penalization between RMSE and MAE. The overall model prediction accuracy is in keeping with similar mapping studies. Valsamis et al. (2023) reported comparable mapping algorithm prediction accuracy (MAE range 0.136–0.156) using the Oxford Shoulder Score as their source measure. They reported a higher MAE for complex, bespoke EQ-5D mapping models (namely the ALDVMM) compared with simple linear regression models. This mirrors the results of our study in which bespoke EQ-5D mapping algorithms had a higher degree of error than simple linear regression models. This may be because mapping does not account for variables which affect overall quality of life that are not captured by the clinical measure of interest. Furthermore, the EQ-5D may not be appropriate for all conditions and patient groups. In such circumstances, the development of condition-specific preference-based measures should be considered.
In contrast to Valsamis et al. (2023), the present study solely focused on EQ-5D-5L-derived utility values. This is because the UK Hand Registry only collects EQ-5D-5L data from respondents. In their 2019 position statement, NICE recommended that the EQ-5D-3L be used for reference case analyses owing to concerns about the quality and reliability of the data used in the valuation study ((NICE) NIfHaCE, 2019). Where primary data are collected using the EQ-5D-5L, NICE advocates the use of a mapping algorithm to derive EQ-5D-3L utility values. We opted to develop mapping algorithms using the 5L value set available in the UKHR as previous work has shown comparable model performance using a primary EQ-5D-5L value set and EQ-5D-3L crosswalk values (Valsamis et al., 2023).
The present study has shown that the PEM can be mapped to the EQ-5D-5L using transfer-to-utility mapping. Response mapping aims to predict the responses to individual EQ-5D questions rather than the resultant HSUV. Using country specific value sets, HSUVs can then be determined from the mapped EQ-5D health state. Response mapping aims to address the inherent limitations of transfer-to-utility mapping; however estimating response mapping models is computationally intensive and requires access to complete EQ-5D response data (Hernández Alava et al., 2020). Future mapping studies should investigate whether the PEM can be accurately mapped to EQ-5D-3L index values using response mapping. Several hand-specific PROMs have been developed. Future work should study the accuracy of mapping algorithms developed using a range of hand-specific PROMs.
The error margin found in the present study may suggest that mapping the PEM onto generic preference-based measures may not be appropriate. The assumption that the EQ-5D is an appropriate measure for use in patients with hand conditions is questionable. Previous work has shown that the EQ-5D is not responsive to clinical deterioration in patients with rheumatoid arthritis (Payakachat et al., 2015). The poor responsiveness of generic preference-based measures such as the EQ-5D may mean that interventions for hand conditions are undervalued in cost-effectiveness analyses. This carries the risk that interventions may be labelled ‘of limited clinical value’ when compared with treatments for conditions such as knee arthritis. One solution to the poor responsiveness of generic preference-based measures is the use of condition-specific preference-based measures. Brazier et al. (2012) have published guidelines on the development of a preference-based measure from an existing condition-specific PROM. Future work should aim to develop a value set for an established hand-specific PROM. This would enable utility values to be determined for health states described by the hand-specific PROM and overcome the limitations of generic preference-based measures in hand surgery.
The present study has some limitations. We did not have a separate external validation dataset and instead chose to perform bootstrap validation with 1000-fold test-training samples. During bootstrap validation, repeated training-test partitions are created from a single dataset and model performance is estimated across all iterations. Given that error is likely to increase in an external validation sample, this limitation does not detract from the principal study findings. We did not examine the effect of additional variables such as age and gender to improve the generalizability of models to datasets where such data are not available.
Our findings are applicable across surgical sub-specialties. We have shown that responses to domain-specific PROMs can be mapped to EQ-5D utilities, albeit with a clinically relevant margin of error. The principal advantage of mapping is increased availability of data for cost–utility analyses in the absence of primary EQ-5D data. However, analysts must interpret the results of mapped utility values with caution given the additional uncertainty associated with having to derive utility scores using responses to distinct outcome assessment tools. Analysts must consider whether the EQ-5D is an appropriate measure in the studied group. This is of relevance in hand surgery where conditions may not impair health domains measured by the EQ-5D, such as mobility. However, general surgical conditions (such as colorectal cancer) may be associated with greater general disability and impairments in quality of life may be better represented by EQ-5D scores, meaning that mapping may be appropriate. Where this is not the case, NICE (2013) advocates the use of condition-specific preference-based measures in the appraisal of new treatments. Efforts should therefore be concentrated on the development of condition-specific preference-based measures in relevant cohorts, rather than the development of mapping algorithms.
In conclusion, the mapping models developed and evaluated in this study enable decision analysts to obtain EQ-5D-5L HSUVs from the PEM where primary EQ-5D-5L data are not available. The error margin of our best performing model is clinically significant. Future work should aim to develop a value set for hand-specific PROMs.
Footnotes
Declaration of conflicting interests
The authors declared no potential conflicts of interest with respect to the research, authorship, and/or publication of this article.
Funding
The authors disclosed receipt of the following financial support for the research, authorship, and/or publication of this article: Conrad J. Harrison is funded by a National Institute for Health Research (NIHR) Doctoral Research Fellowship (NIHR300684). Jeremy N. Rodrigues is funded by a NIHR postdoctoral fellowship (PDF-2017-10-075). This document presents independent research funded by the NIHR. The views expressed are those of the authors and not necessarily those of the NHS, the NIHR or the Department of Health and Social Care.
Level of evidence
III