






Abstract
Background:
Gastric cancer (GC) has high incidence and mortality rates worldwide, and lymph node metastasis (LNM) is a key determinant of prognosis and treatment strategy.
Objectives:
In this study, we aimed to investigate the association between eight inflammatory markers and LNM in GC and develop a prognostic model for LNM using inflammatory indicators.
Design:
This was a retrospective multicenter study.
Methods:
Clinical, pathological, and laboratory data from 868 GC patients were analyzed. Independent risk factors for LNM were identified through univariate logistic regression (LR), least absolute shrinkage and selection operator regression, and multivariable LR. Fourteen machine learning models were constructed using 10-fold cross-validation, and model performance was evaluated by calculation of the area under the receiver operating curve (AUC).
Results:
Five clinical and pathological characteristics were identified as independent risk factors for LNM in GC: Glasgow prognostic score (GPS), T stage, histological differentiation, vascular invasion, and total lymph node count. The categorical boosting (CatBoost) model demonstrated the best performance (AUC: 0.808) of all machine learning models tested, followed by the random forest model (0.806). Conversely, the AdaBoost model had the lowest AUC score (0.727). Further analysis of the CatBoost model showed that at the optimal threshold (0.56), it correctly identified approximately 82.7% of patients with LNM and approximately 69.4% of LNM-negative patients.
Conclusion:
These findings demonstrate the value of inflammatory markers, including the GPS, in prediction of LNM in patients with GC, as well as the ability of machine learning models to enhance prognostic accuracy, support informed treatment decisions, and improve patient outcomes.
Plain language summary
This study investigated whether certain markers of inflammation found in a routine blood test could help predict if stomach (gastric) cancer has spread to nearby lymph nodes. Knowing if the cancer has reached the lymph nodes is crucial for choosing the right treatment and understanding a patient’s outlook. We reviewed the medical records of 868 stomach cancer patients from two hospitals. We focused on eight inflammation-related markers that can be calculated from standard blood tests. Our analysis found that an inflammation-based score called the Glasgow Prognostic Score (GPS), along with other clinical features like how deep the tumor is and its grade, were key factors linked to lymph node spread. We used computer algorithms (machine learning) to build several prediction models. The best-performing model could identify lymph node metastasis with good accuracy. At its optimal threshold, this model correctly identified about 82.7% of patients who had metastasis and about 69.4% of those who did not. In conclusion, this research shows that inflammation markers, particularly the GPS, are valuable for predicting lymph node metastasis in stomach cancer. Combining these markers using computer models can improve prediction accuracy. This tool can assist doctors and patients in making more informed treatment decisions, potentially leading to better patient outcomes.
Keywords
Introduction
Gastric cancer (GC) is a major malignancy with high incidence and mortality rates worldwide, 1 particularly in parts of Eastern Asia. 2 Despite advances in diagnosis and treatment, the overall prognosis of patients with GC remains poor, 3 with particularly low survival rates in cases involving lymph node metastasis (LNM). 4 LNM is a critical prognostic indicator in GC that can be used to guide treatment decisions. 5 Therefore, it is essential to develop an accurate and efficient predictive model for early identification of patients at high risk of LNM to optimize outcomes and enhance clinical decision-making.
Recently, the role of inflammation in cancer progression has become an important focus of attention, 6 given reported associations of tumor-associated inflammatory responses with cancer development and metastasis. 7 Various peripheral blood inflammatory markers, including the neutrophil-to-lymphocyte ratio (NLR), 8 platelet-to-lymphocyte ratio (PLR), 9 and monocyte-to-lymphocyte ratio (MLR), 10 have been used to assess cancer prognosis and metastasis risk, 11 and several studies have explored the use of radiomics and machine learning approaches to improve prediction of LNM in GC patients through integration of imaging and clinical features.12,14 However, the specific predictive value of these markers has not yet been determined, and the integration of inflammatory markers with clinicopathologic features presents an ongoing challenge. As traditional statistical methods may be insufficient to handle the complexity of multidimensional, multifactorial medical data, advanced machine learning techniques are required to enhance the performance of predictive models. 15 Therefore, in the present study, we systematically evaluated the associations between peripheral blood inflammatory markers and LNM in GC to develop a robust predictive model integrating inflammatory and clinicopathological factors. Specifically, in the present study, we investigated the relationships of LNM with NLR; PLR; MLR; systemic immune inflammation index (SII); hemoglobin, albumin, lymphocyte, and platelet score (HALP); C-reactive protein albumin lymphocyte score (CALLY); prognostic nutritional index (PNI); and Glasgow prognostic score (GPS). Using univariate logistic regression (LR), least absolute shrinkage and selection operator (LASSO) regression, and multivariate LR, we identified five independent predictors strongly associated with LNM in GC, namely, GPS, American Joint Committee on Cancer (AJCC; 8th edition) T stage, histologic differentiation, vascular invasion, and total lymph node count. These factors formed the basis for further development of a predictive model for LNM in GC.
To select the optimal machine learning model, we employed a 10-fold cross-validation strategy. The data were randomly divided into 10 equally sized subsamples, and each subsample in turn was used as a validation set while the remaining nine were used for training. This iterative process was intended to reduce overfitting and ensure the robustness of the model across different datasets. 16 We thus enhanced the reliability of our model evaluation by maximizing the use of available data for training and validation. We trained the following predictive models for LNM in GC using 14 machine learning algorithms: naïve Bayes classifier, LR, random forest (RF), decision tree (DT), gradient boosting machine (GBM), extreme gradient boosting (XGB), support vector machine, K-nearest neighbors (KNN), neural networks, adaptive boosting (AdaBoost), deep learning, gradient-boosting DTs, LightGBM, and categorical boosting (CatBoost). These models represented diverse algorithmic approaches with distinct learning mechanisms, enabling us to identify the most effective predictor across various data scenarios. 17
This study makes three main contributions to the literature. First, we comprehensively assessed eight commonly used inflammatory markers and identified key indicators associated with LNM in GC. Second, we integrated these markers with clinicopathological variables to construct predictive models for LNM. Third, we compared the performance of 14 different machine learning algorithms using a 10-fold cross-validation framework to identify the optimal model for LNM prediction. The resulting inflammation-based machine learning framework for risk stratification could facilitate more accurate preoperative assessment of LNM and support individualized treatment strategies for patients with GC.
Patients and methods
Study participants and inclusion and exclusion criteria
This retrospective study was carried out at two tertiary medical centers in Chongqing, China: The First Affiliated Hospital of Chongqing Medical University and Chongqing University Fuling Hospital. Clinical, pathological, and laboratory data of patients with GC consecutively enrolled between July 1, 2016, and April 30, 2023, were systematically collected and analyzed. The inclusion criteria were (1) postoperative pathological diagnosis of GC; (2) patients who had undergone partial or total gastrectomy; and (3) age ⩾18 years. The exclusion criteria were as follows: (1) history of or concurrent presence of multiple primary tumors; (2) prior neoadjuvant therapy; (3) underlying systemic autoimmune diseases or hematological disorders; (4) acute infections, recent blood transfusions, or gastrointestinal hemorrhage; (5) recent use of hormones, anti-inflammatory drugs, or antiplatelet medications; (6) Tis stage; or (7) incomplete clinical, pathological, or laboratory data.
Clinical and pathological parameters
The following information was collected: gender, age, comorbidities, smoking status, alcohol use, body mass index, tumor size, histological differentiation, pathological classification, AJCC T stage, presence of LNM, total lymph node count, vascular invasion, perineural invasion, HER2 status, and tumor primary site. Body mass index was calculated as weight (kg) divided by the square of height (m2). In light of ongoing discussions regarding the impact of chronic diseases on peripheral blood inflammatory markers, 18 patients with stable chronic conditions were not excluded from the study. The number of comorbidities, such as hypertension, diabetes, coronary artery disease, chronic obstructive pulmonary disease (stable phase), and a history of cerebral infarction, was recorded for each patient (0, 1, etc.). AJCC TNM staging followed the guidelines of the AJCC and the Union for International Cancer Control. 19
Inflammatory parameters
For newly admitted GC patients scheduled for surgery, blood samples were collected within the first 24 h of admission for inflammatory marker analysis. 18 The following inflammatory markers were assessed:
NLR, 8 calculated by dividing the neutrophil count (×109/L) by the lymphocyte count (×109/L);
PLR, 9 calculated by dividing the platelet count (×109/L) by the lymphocyte count (×109/L);
MLR, 10 calculated by dividing the monocyte count (×109/L) by the lymphocyte count (×109/L);
SII, 11 calculated using the following formula: (platelet count (×109/L) × neutrophil count (×109/L)) divided by the lymphocyte count (×109/L);
HALP, 20 defined as (hemoglobin (g/L) × albumin (g/L) × lymphocyte count (×109/L))/platelet count (× 109/L);
CALLY, 21 calculated as: (albumin (g/L) × lymphocyte count (×109/L))/C-reactive protein (CRP; mg/L);
PNI, 22 calculated using the following formula: albumin (g/L) + 5 × total peripheral blood lymphocyte count (×109/L);
GPS, 23 defined as follows: CRP (>10 mg/L) and hypoalbuminemia (<35 g/L) score of 2, CRP (>10 mg/L) or hypoalbuminemia (<35 g/L) score of 1, with neither elevated CRP nor hypoalbuminemia score of 0.
Handling of missing data
For variables with missing values, the pattern of missingness was analyzed, and the following strategies were applied according to the proportion of missing data: (1) variables with a missingness rate greater than 20% were excluded from the study sample; (2) variables with a missingness rate between 10% and 20% were imputed using multiple imputation; and (3) variables with a missingness rate less than 10% were filled using the mode (for categorical variables) or the median (for continuous variables).
Regression analysis
To assess the independent effects of inflammatory markers and clinicopathological parameters on LNM in GC patients, we performed univariate and multivariate LR analyses using the stats package (version 4.3.1; R Core Team, R Foundation for Statistical Computing, Vienna, Austria), as well as LASSO regression using the glmnet package (version 4.1-8; Friedman, Hastie, Tibshirani, Narasimhan, Tay, Simon, and Yang, Stanford University, Stanford, CA, USA) to optimize variable selection and identify key predictive factors. The univariate LR examined the associations of peripheral blood inflammatory markers and clinicopathological features with LNM in GC. In the LASSO regression, the most suitable variables were selected on the basis of the λ value reaching its minimum. The selected variables were finally subjected to multivariate LR, and odds ratios and 95% confidence intervals (CIs) were calculated to evaluate the potential of these variables to serve as independent predictors of LNM in GC patients.
Model construction and validation
The reporting of this study conforms to the Transparent Reporting of a multivariable prediction model for Individual Prognosis or Diagnosis using Artificial Intelligence statement. 24 A 10-fold cross-validation approach was utilized to ensure the robustness of our models. 25 The training data were randomly divided into 10 equally sized subsets. In each fold, nine subsets were used for model training, with the remaining subset serving as the validation set. This process was repeated 10 times to ensure that every subset was used for validation. We evaluated the following machine learning models: (1) naïve Bayes classifier, (2) LR, (3) RF, (4) DT, (5) GBM, (6) XGB, (7) support vector machine, (8) KNN, (9) neural networks, (10) AdaBoost, (11) deep learning, (12) gradient-boosting DTs, (13) LightGBM, and (14) CatBoost.
Receiver operating characteristic (ROC) curves were constructed, and the area under the curve (AUC) was calculated for the evaluation of model performance with respect to prediction of LNM. We then ranked the importance of variables and visualized their significance and correlations using heatmaps. The model with the highest average AUC was selected for further analysis. 25 A probability density function (PDF) 26 and clinical utility curve (CUC) 27 were used to determine the optimal threshold for the predictive model. The consistency between predicted and observed outcomes was assessed using calibration curves, and decision curve analysis was employed to evaluate the net clinical benefit of the model. Finally, a web-based dynamic prediction model was developed using the Shiny package (version 1.8.0; Chang et al., Posit Software, PBC, Boston, MA, USA; https://CRAN.R-project.org/package=shiny).
Statistical analysis
Statistical analyses were performed using R software (version 4.3.1; https://www.r-project.org/). Categorical variables are presented as frequencies and percentages, and differences between groups were evaluated using χ2 test or Fisher’s exact test. Continuous variables are described using means and standard deviations, and group differences were assessed using independent-samples t-test (Student’s t-test) or Mann–Whitney U-test. A p-value <0.05 (two-tailed) was considered to indicate statistical significance.
Results
Patient enrollment and clinical–pathological characteristics
We conducted a retrospective analysis of clinical, pathological, and laboratory data from GC patients who underwent gastrectomy at the Gastrointestinal Surgery Department of the First Affiliated Hospital of Chongqing Medical University and Chongqing University Fuling Hospital between July 1, 2016, and April 30, 2023. After applying inclusion and exclusion criteria, we analyzed data from 868 patients (Supplemental Figure 1), comprising 413 patients without LNM and 455 patients with LNM. Data from 81 patients classified as AJCC T stage Tis, all of whom showed no LNM, were excluded from further analysis.
Compared to patients without LNM, those with LNM had larger tumor volumes, poorer histological differentiation, and later T stages. They also exhibited higher incidence rates of vascular and nerve invasion, had more lymph nodes retrieved, and showed elevated NLR, PLR, MLR, and SII values. In addition, the LNM group had a higher percentage of patients with GPS scores exceeding zero, and lower proportions of patients with HALP, CALLY, and PNI values exceeding this value. All of these differences were statistically significant (Table 1 and Figure 1(a)–(h)).
Clinicopathological and laboratory characteristics of gastric cancer patients stratified by lymph node metastasis.
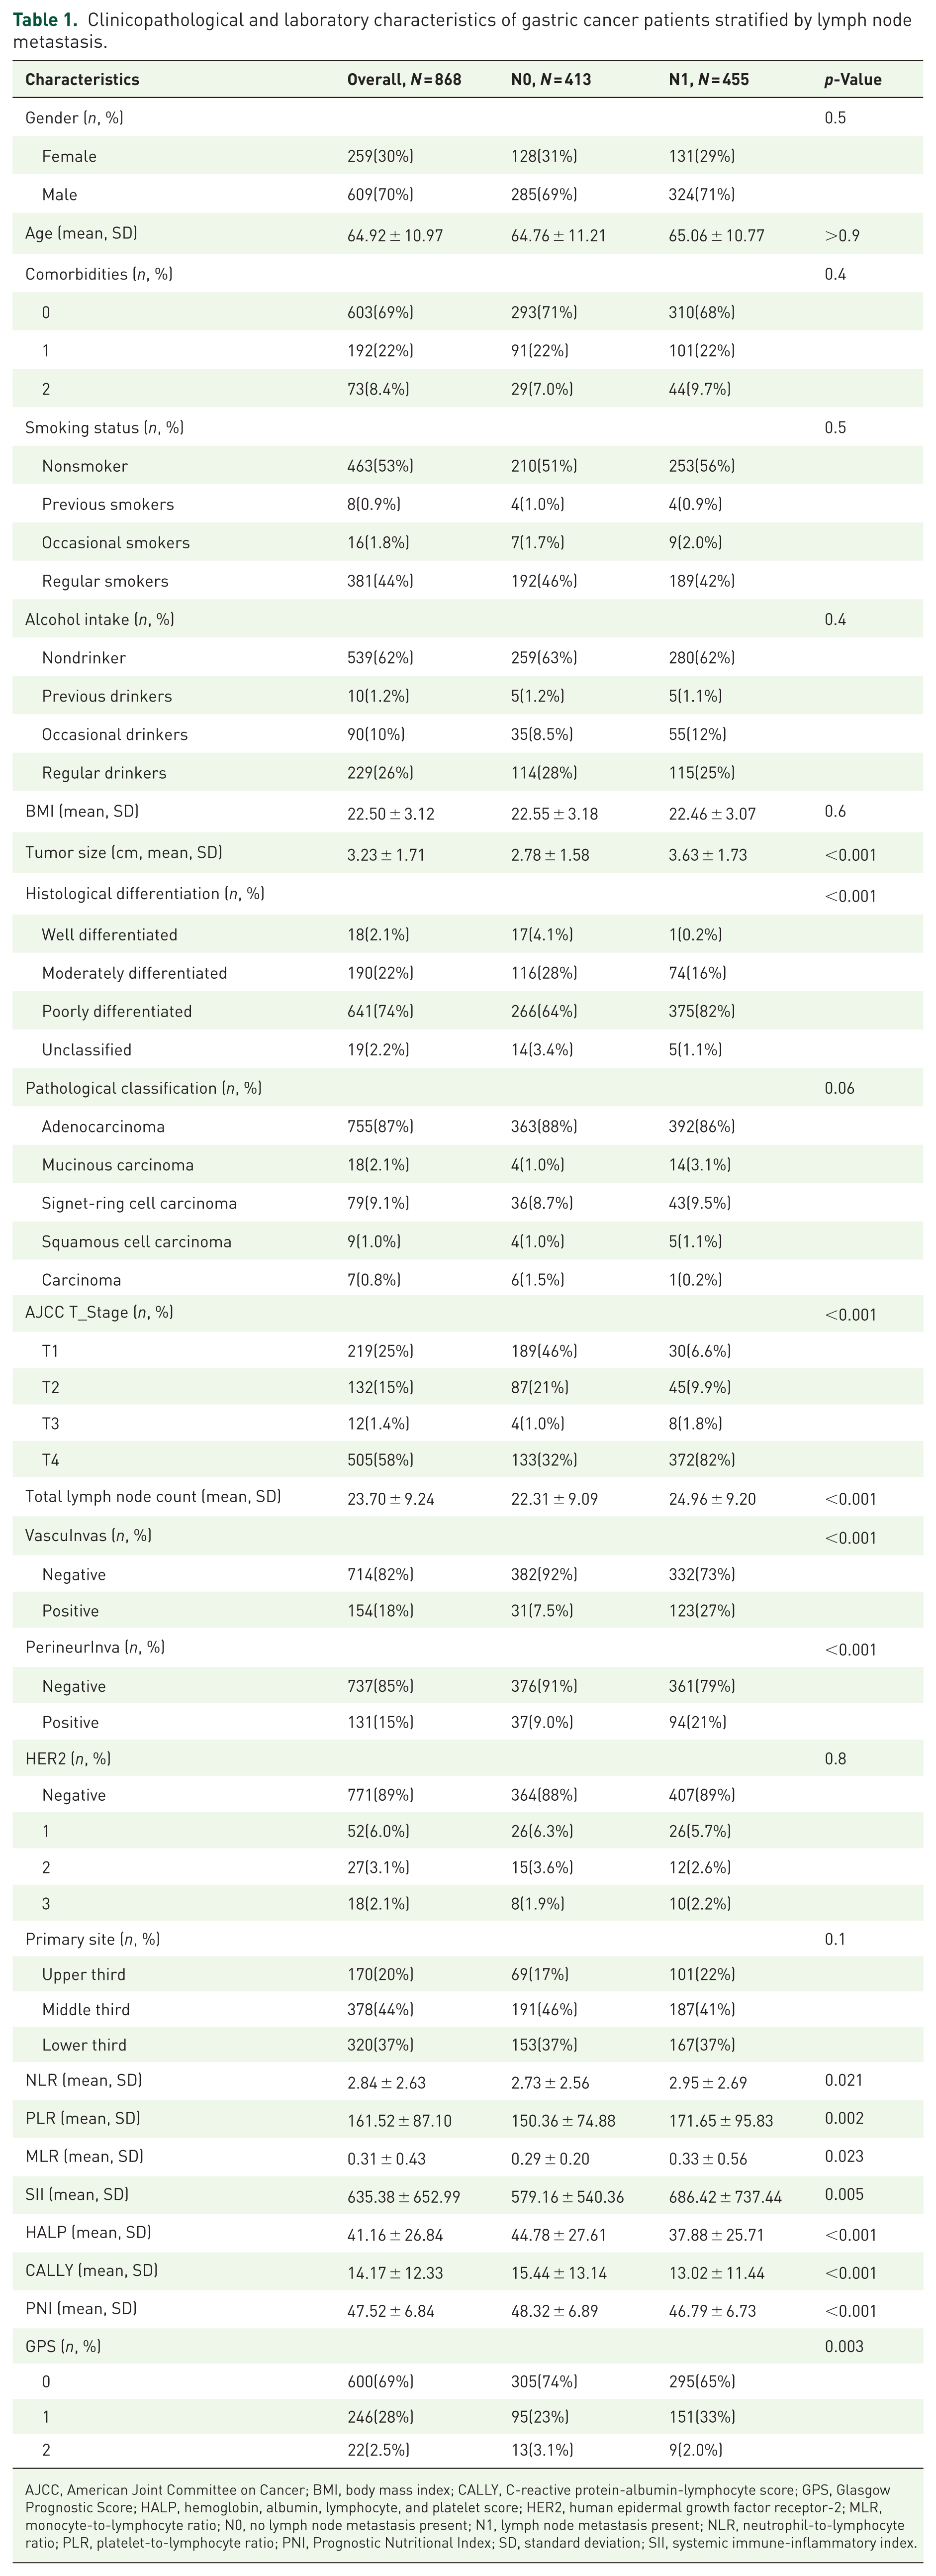
AJCC, American Joint Committee on Cancer; BMI, body mass index; CALLY, C-reactive protein-albumin-lymphocyte score; GPS, Glasgow Prognostic Score; HALP, hemoglobin, albumin, lymphocyte, and platelet score; HER2, human epidermal growth factor receptor-2; MLR, monocyte-to-lymphocyte ratio; N0, no lymph node metastasis present; N1, lymph node metastasis present; NLR, neutrophil-to-lymphocyte ratio; PLR, platelet-to-lymphocyte ratio; PNI, Prognostic Nutritional Index; SD, standard deviation; SII, systemic immune-inflammatory index.
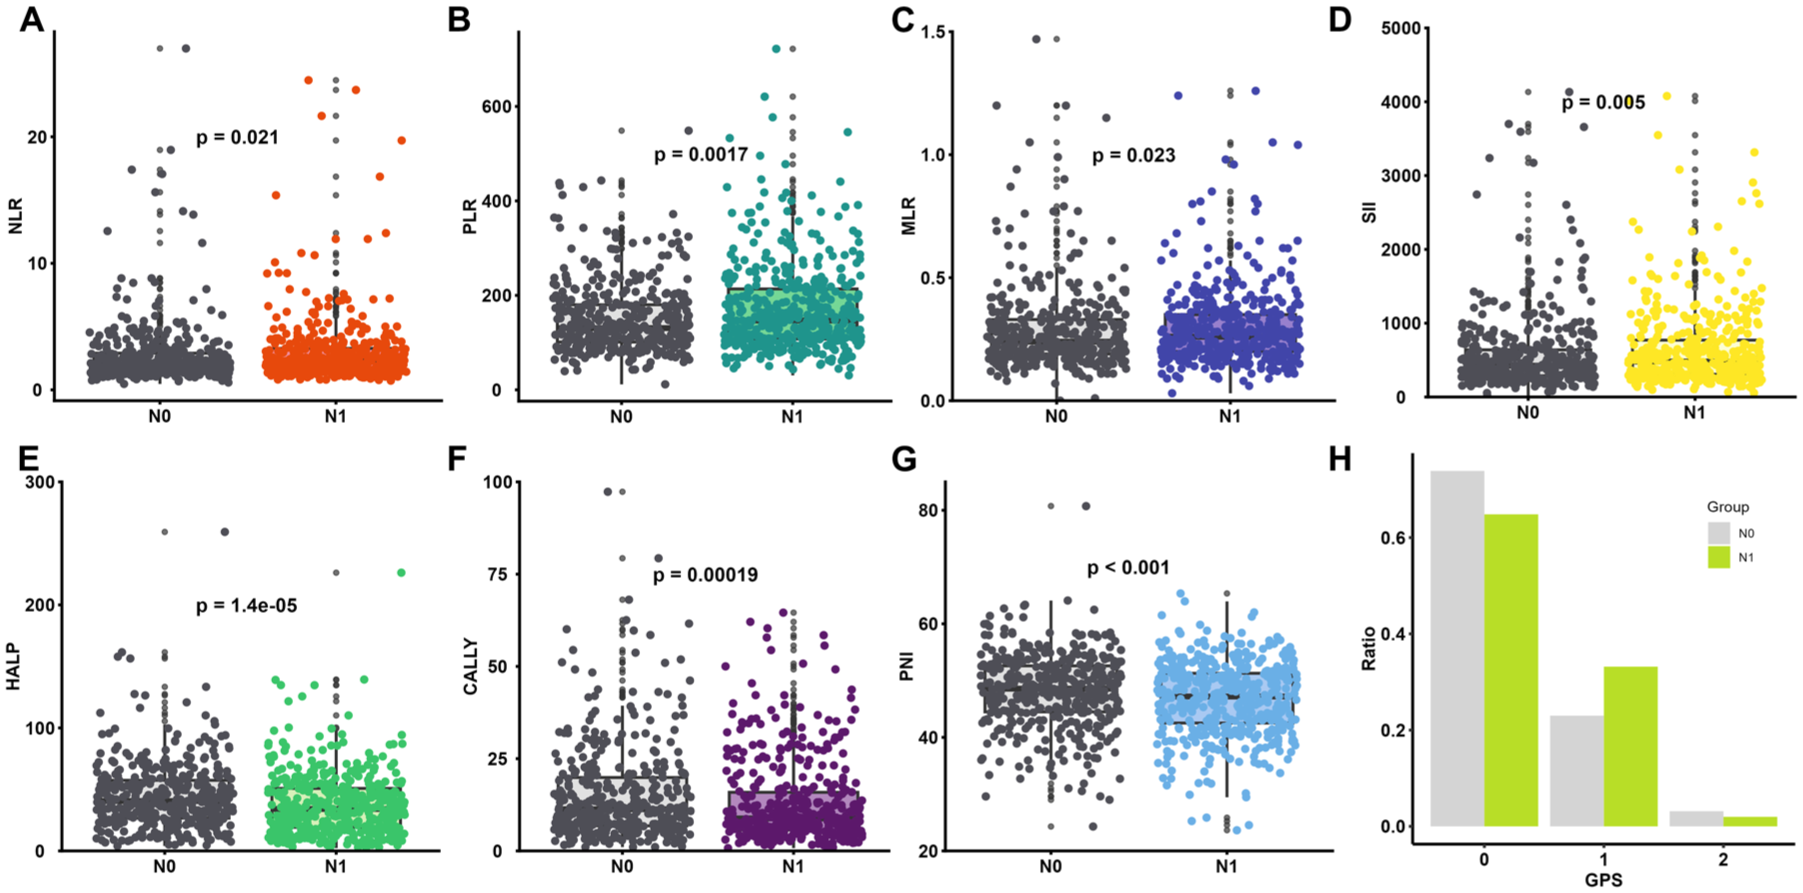
Distribution of peripheral blood inflammatory markers in gastric cancer patients with or without lymph node metastasis. (a) NLR. (b) PLR. (c) MLR. (d) SII. (e) HALP. (f) CALLY. (g) PNI. (h) GPS.
Identification of independent risk factors for LNM in GC
To identify independent risk factors for LNM in GC, we performed univariate LR, LASSO regression, and multivariate LR analyses. In the initial univariate analysis, we identified 15 variables significantly associated with LNM, including tumor size, histological differentiation, AJCC T stage, total lymph node count, vascular and nerve invasion, and various inflammation-related indices (PLR, SII, HALP, CALLY, PNI, and GPS). To reduce the risk of overfitting, we applied LASSO regression; this resulted in the retention of 9 of the 15 parameters for further multivariate LR analysis (Figure 2). According to this analysis, GPS, AJCC T stage, histological differentiation, vascular invasion, and total lymph node count all constituted independent risk factors for LNM in GC (Table 2).
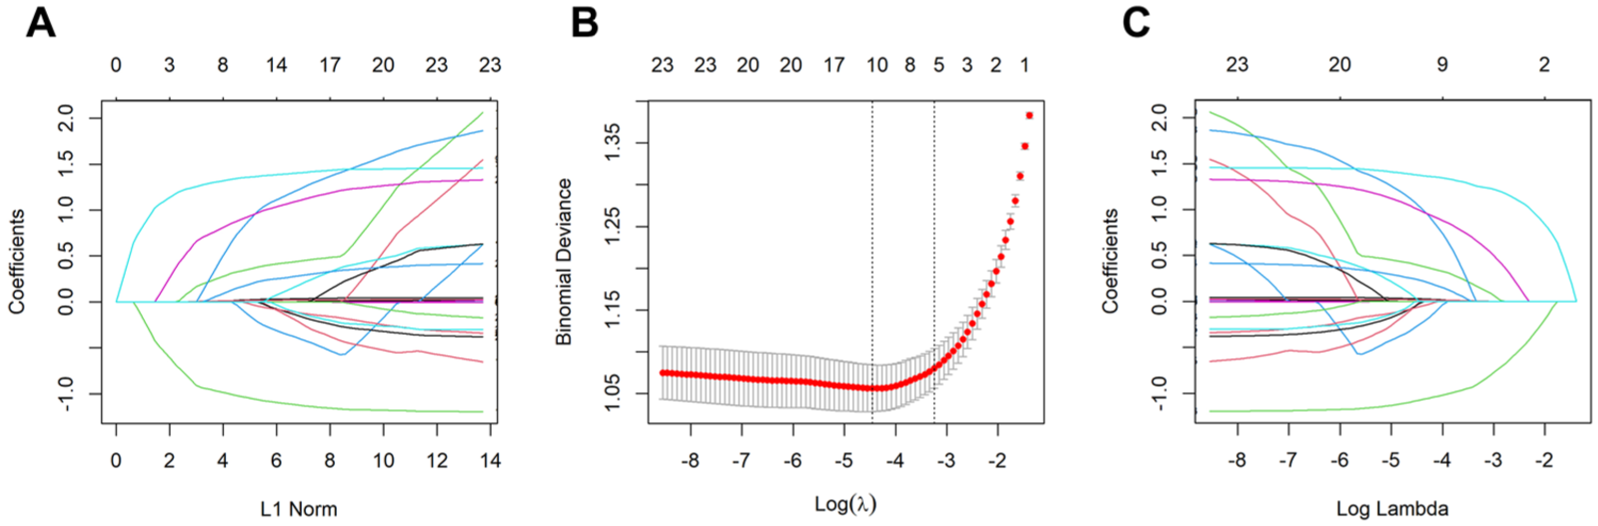
LASSO regression analysis identifying nine clinical, pathological, and laboratory parameters linked to lymph node metastasis in gastric cancer. (a) LASSO coefficient path plot. (b) LASSO cross-validation curve. (c) LASSO feature selection path plot.
Univariate and multivariable logistic regression analysis.
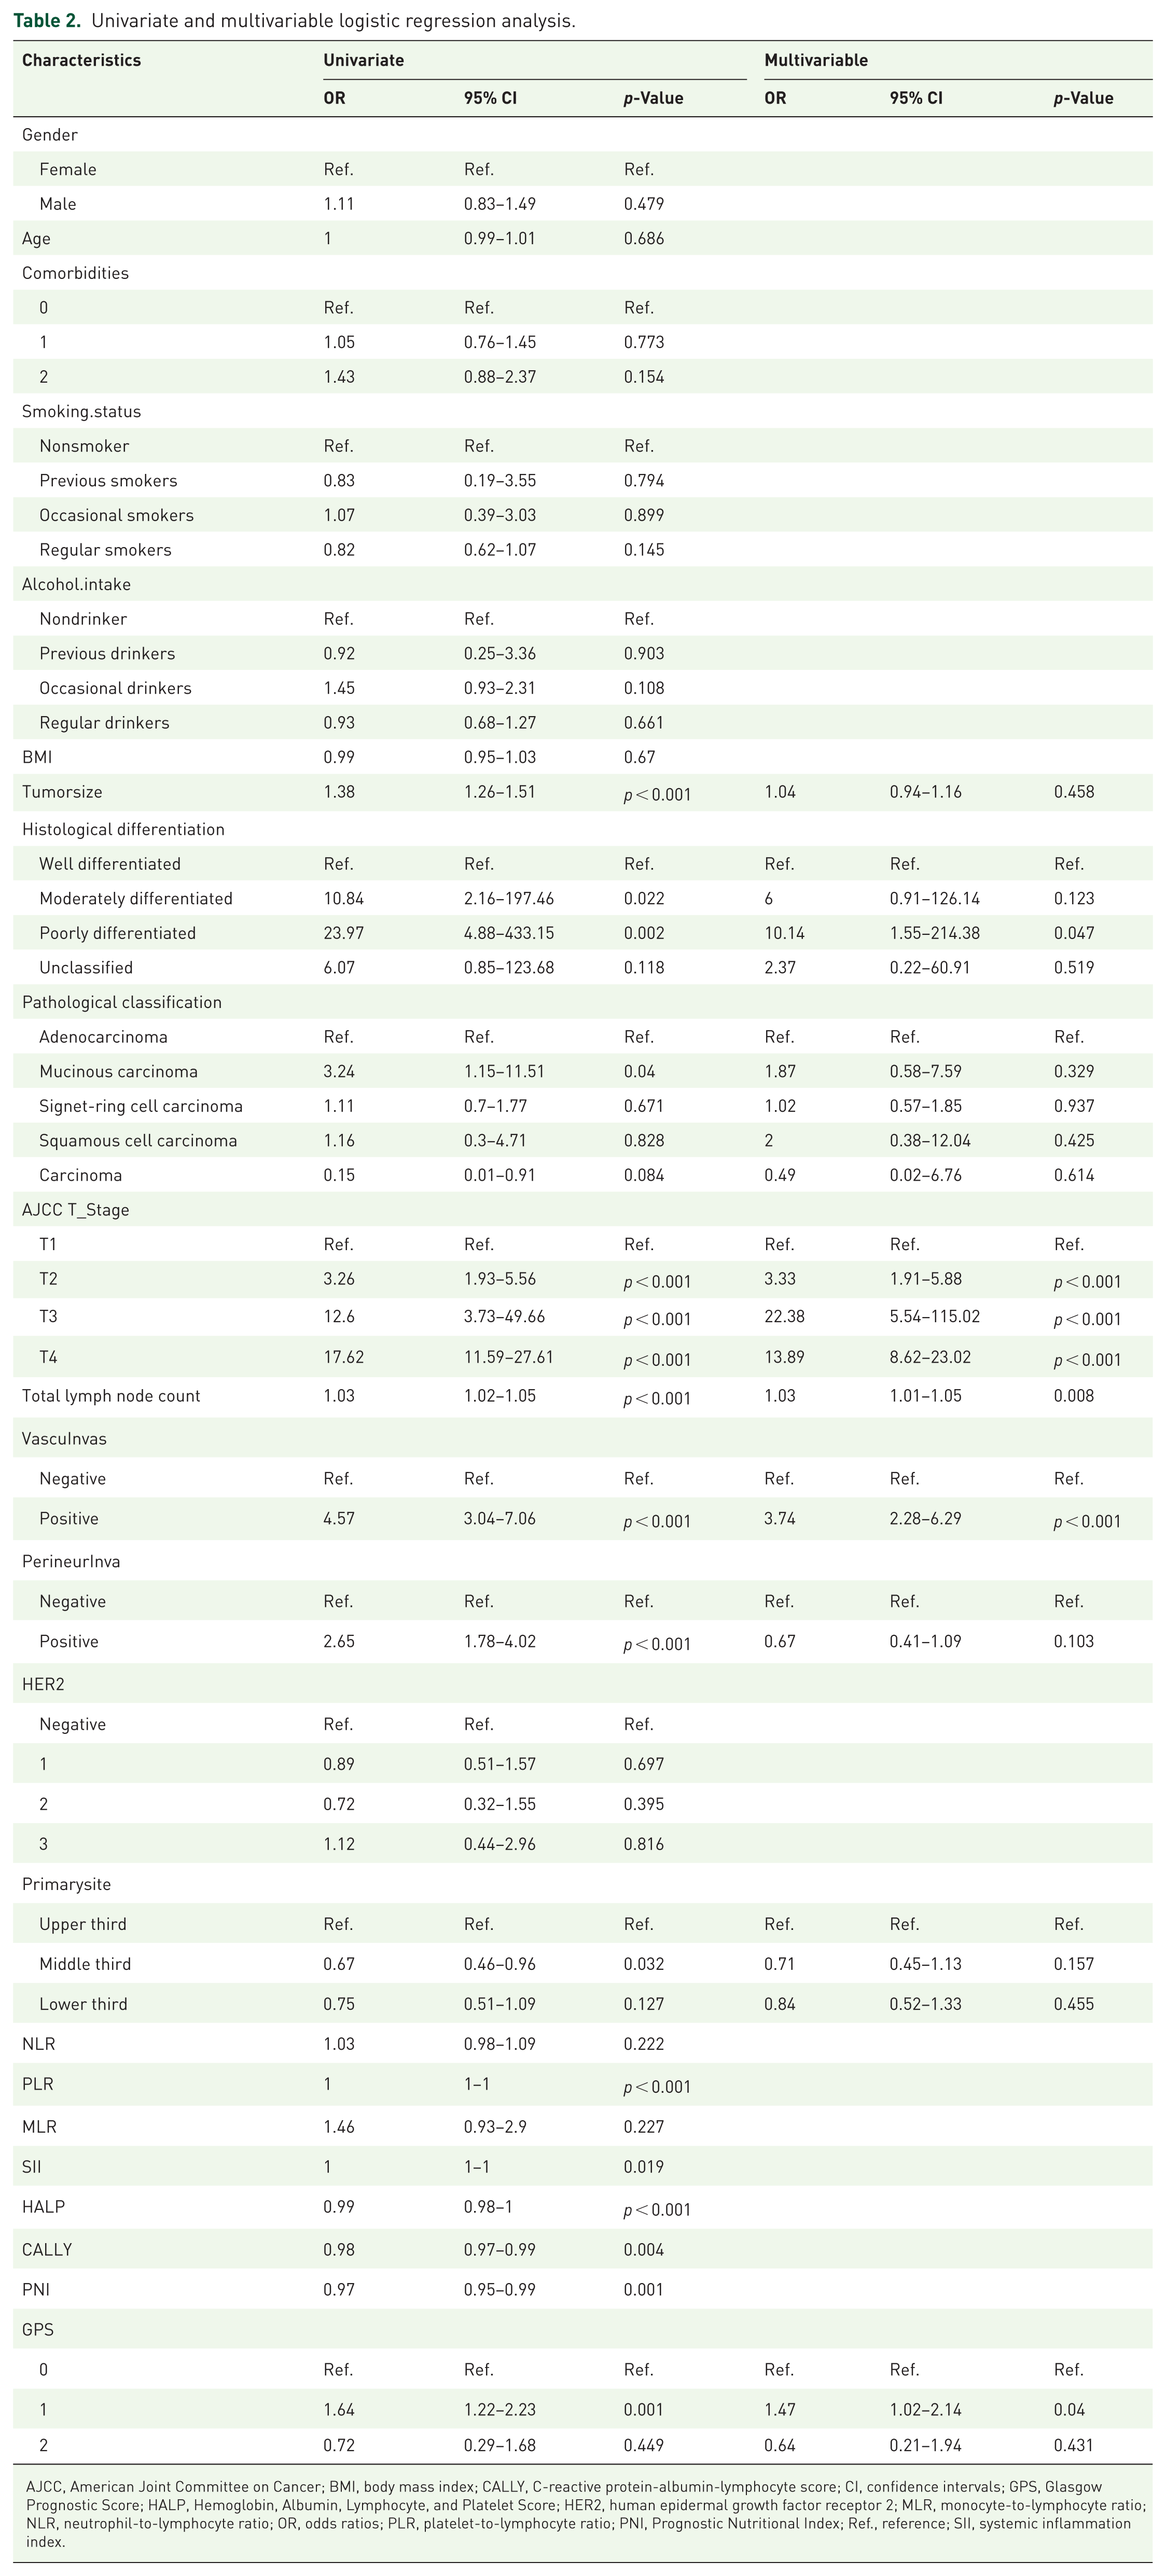
AJCC, American Joint Committee on Cancer; BMI, body mass index; CALLY, C-reactive protein-albumin-lymphocyte score; CI, confidence intervals; GPS, Glasgow Prognostic Score; HALP, Hemoglobin, Albumin, Lymphocyte, and Platelet Score; HER2, human epidermal growth factor receptor 2; MLR, monocyte-to-lymphocyte ratio; NLR, neutrophil-to-lymphocyte ratio; OR, odds ratios; PLR, platelet-to-lymphocyte ratio; PNI, Prognostic Nutritional Index; Ref., reference; SII, systemic inflammation index.
Establishment of LNM prediction model for GC and selection of the best predictive model
We first divided the patient data into two groups: a training group and a validation group, with an 80:20 distribution. Predictive models were developed using the training group, and their performance was assessed in the validation group. After stratification, statistical tests were conducted to assess whether there were significant differences between the groups. If such differences were detected, data were re-assigned to ensure comparability (Supplemental Table 1).
Although advanced imaging modalities including spectral computed tomography (CT), high-resolution magnetic resonance imaging, and radiomics have shown promise as tools for preoperative evaluation of vascular invasion, reports of their accuracy have been inconsistent, such that they are insufficient for reliable clinical application. Owing to these limitations, vascular invasion features (which were obtained using these imaging modalities) were not included in our final predictive model. Instead, using the training group data, we trained 14 predictive models for LNM in GC based on the 4 remaining independent risk factors identified through regression analysis: total lymph node count, histological differentiation, AJCC T stage, and GPS. Tuned hyperparameters, search strategies, parameter ranges, and final optimal parameter combinations for each model are summarized in Supplemental Table 2. We employed 10-fold cross-validation, calculating the AUC for each fold to assess model accuracy, and compared mean AUC scores across the models. The CatBoost model achieved the highest AUC of 0.808, closely followed by the RF model at 0.806, whereas the AdaBoost, KNN, and DT models had the lowest AUC values, at 0.727, 0.747, and 0.774, respectively (Figure 3(a)). The CatBoost model was therefore selected for further analysis.
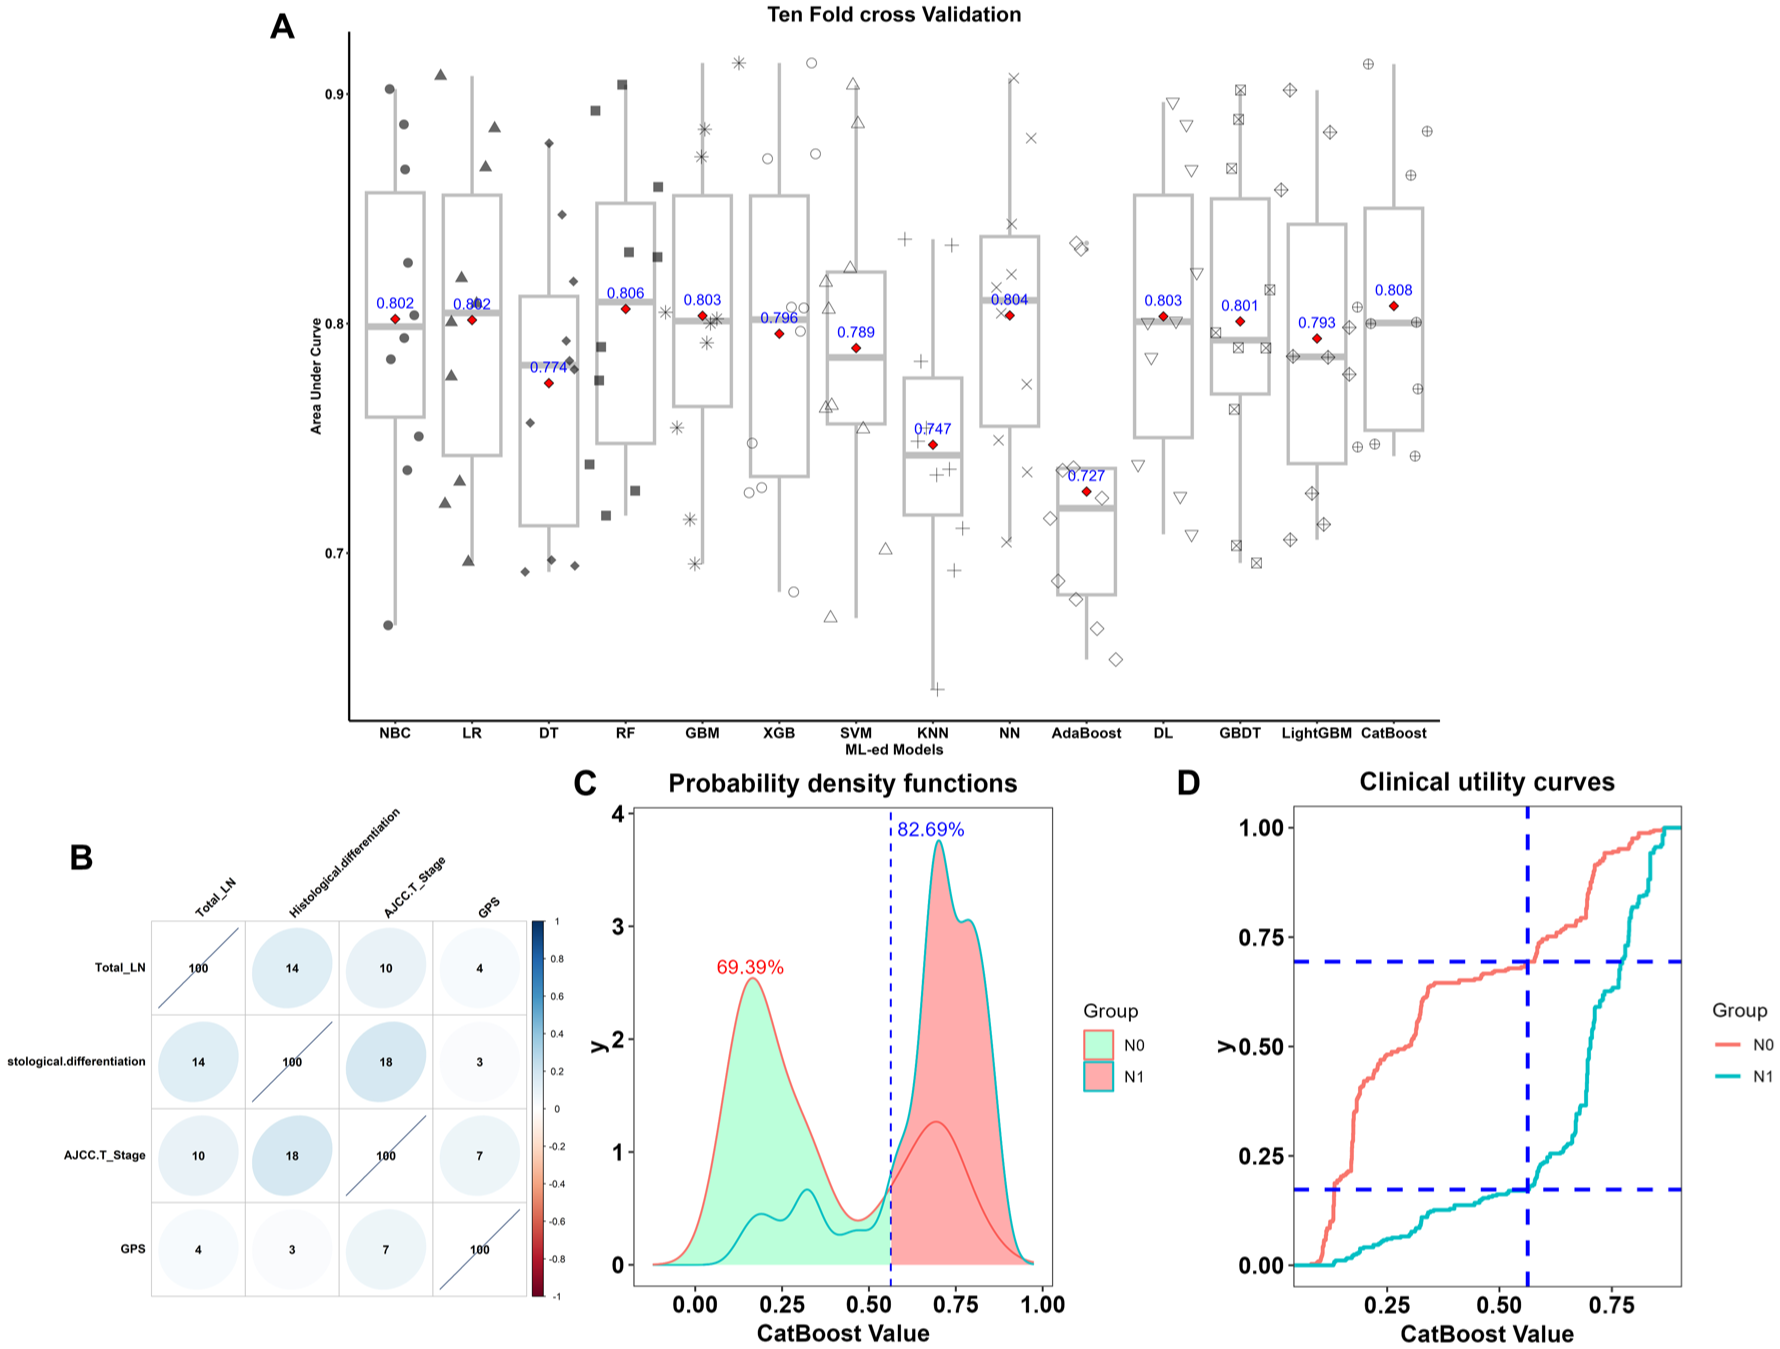
Comparison of the predictive abilities of 14 machine learning models and identification of optimal probability thresholds. (a) Average AUC comparison across 14 machine learning models. (b) Correlation matrix of the variables. (c) Probability density functions: Approximately 69.4% of GC patients without LNM fall within the predictive probability range of 0–0.56, while approximately 82.7% of patients with LNM fall within the range of 0.56–1. (d) Clinical utility curves showing the true percentage of GC patients with and without LNM across probability thresholds (0–1).
AJCC T stage was identified as the most significant predictor of LNM in GC, as it consistently showed the highest variable weight across the 14 models (Supplemental Figure 2). However, although the influence of the remaining variables varied across models, they all contributed to model performance. Combining inflammation-related factors with clinicopathological features could thus further improve prediction accuracy. Correlation analysis revealed no significant associations between inflammation parameters and other clinicopathological characteristics, suggesting that these variables are independent (Figure 3(b)).
In clinical settings, the ability to distinguish between GC patients with and without LNM is crucial. We therefore applied PDF- and CUC-based methods to identify the optimal threshold for the CatBoost model to maximize its clinical applicability. In the PDF analysis, patients with LNM mostly fell within a risk range of 0.56–1.00, whereas those without metastasis were primarily within the 0–0.56 range, although some overlap was observed (Figure 3(c)). CUC analysis resulted in a distribution of N0 (red) and N1 (green) categories across different predictive probabilities. We selected 0.56 as the optimal threshold; at this value, approximately 82.7% of patients with LNM and approximately 69.4% of patients without LNM were correctly classified (Figure 3(d)).
Model validation
To assess the performance and consistency of the predictive model, we generated ROC curves for both the training and validation groups and calculated AUC values. The model demonstrated strong performance in the training group, with an AUC of 0.82 (95% CI: 0.79–0.85). The AUC in the validation group was slightly lower (0.79, 95% CI: 0.71–0.86), the performance was comparable, indicating good consistency across different datasets (Figure 4(a)). This suggests that the predictive model could serve as a reliable predictive tool in clinical practice.
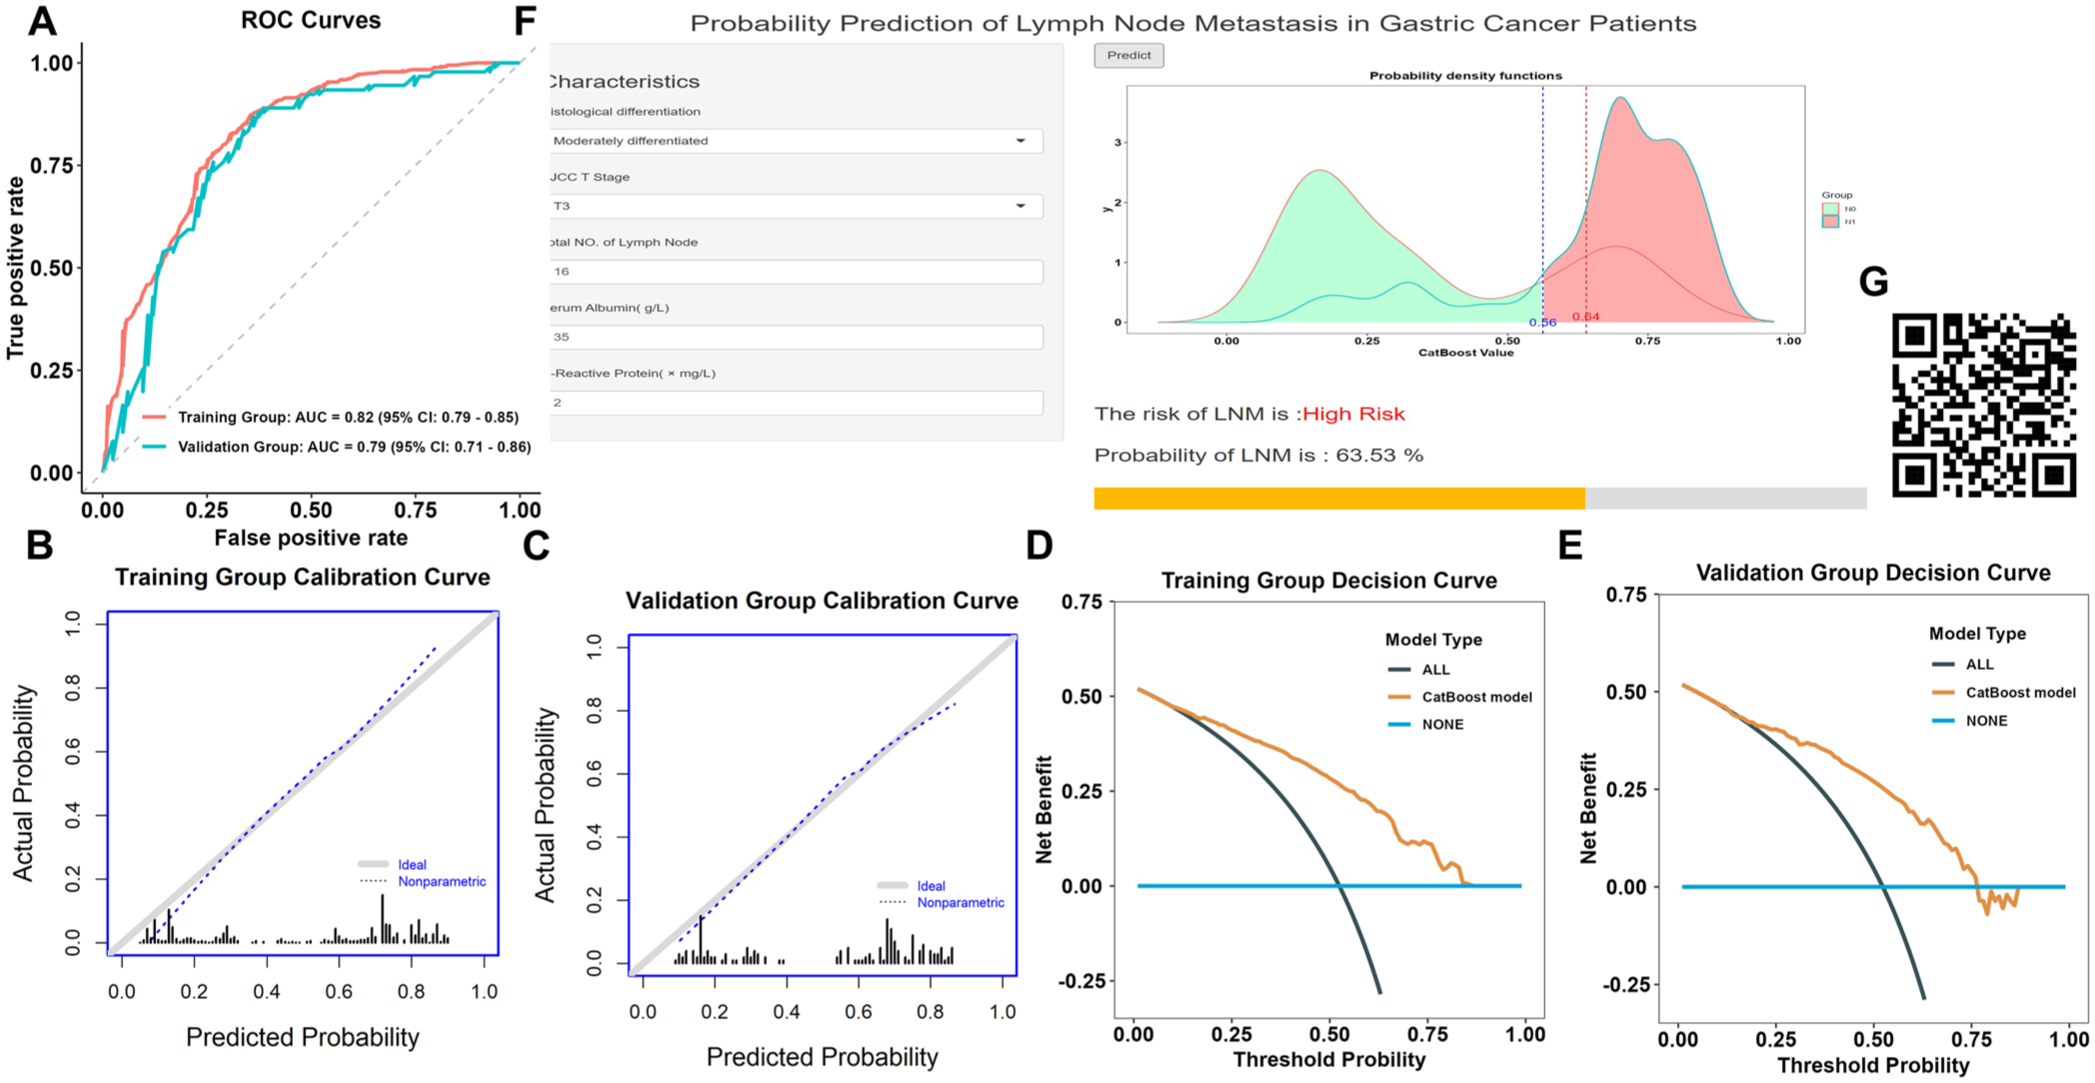
Validation and application of the predictive model. (a) Receiver operating characteristic curve analysis of the logistic regression model in both the training and validation sets. (b) Calibration curve for the training set. (c) Calibration curve for the validation set. (d) Decision curve analysis for the training set. (e) Decision curve analysis for the validation set. (f) Dynamic web calculator for the predictive model, accessible through desktop or mobile browsers. (g) Quick response code for quick access to the web-based tool through mobile devices.
We then constructed calibration curves for both groups. In both the training and validation groups, the predicted probabilities of LNM were closely aligned with the observed probabilities, with the calibration curves approaching the ideal (Figure 4(b) and (c)), further demonstrating the stability and high accuracy of our CatBoost model.
Finally, we plotted decision curves for both groups to assess the clinical value of the predictive model. The model consistently showed a high net benefit across a wide range of probability thresholds, confirming its robust applicability in various clinical scenarios, particularly with respect to accurate prediction of LNM (Figure 4(d) and (e)).
Online model calculator
To assist clinicians to efficiently utilize this predictive model to assess LNM in patients, we developed an online tool based on our LR model (Figure 4(f)). This tool, which is accessible at https://jasonidea.shinyapps.io/gc_lnm/ or by scanning the QR code in Figure 4(g), enables the clinician to input relevant clinical, pathological, and laboratory data and calculate the likelihood of LNM for the patient in question. Thus, it could enhance clinical risk assessment, supporting healthcare professionals in making more informed treatment decisions and ultimately improving individualized patient management and prognostic assessment in GC.
Although total lymph node count is a postoperative variable and may not be available before surgery, in a preoperative setting, clinicians could either use an estimated lymph node count based on preoperative imaging (such as high-resolution CT) or rely primarily on the other markers that are readily available preoperatively (GPS, clinical T-stage, and histological differentiation on biopsy). This flexibility enhances the practical utility of the model in real-time surgical triage.
Discussion
GC remains a significant global health challenge. 1 LNM, a common occurrence owing to the abundance of gastric lymphatic fluid, 28 is a critical indicator of poor prognosis in patients with GC. 29 Accurate prediction of LNM is therefore essential for tailoring treatment strategies and improving outcomes. In this study, we investigated the associations of eight common peripheral blood inflammatory markers (NLR, PLR, MLR, SII, HALP, CALLY, PNI, and GPS) with LNM in GC and identified five independent risk factors (including inflammatory markers) that were associated with LNM in GC: total lymph node count, histological differentiation, AJCC T stage, vascular invasion, and GPS. The CatBoost model demonstrated the highest predictive efficacy, with an AUC of 0.806, indicating potential clinical value. When the cutoff value was set to 0.56, this model correctly identified LNM in approximately 82.7% of patients.
The relationship between inflammation and cancer progression has been well documented, 6 and inflammatory markers are often used as prognostic indicators for various cancers, including GC.8–10,20–23,30 However, the specific predictive role of these markers for LNM has not been sufficiently explored in previous research. Here, we found that peripheral blood inflammatory markers, particularly GPS, were independent risk factors for LNM in GC. This confirms the critical role of inflammation in tumor progression and provides a valuable foundation for clinical assessment and prognosis prediction.
The GPS, which was initially proposed by Forrest et al. 31 in their study of inoperable non-small-cell lung cancer, is a prognostic measure of inflammation, combining serum albumin and CRP levels to assess the inflammatory state of patients with malignant tumors. According to the GPS, elevated CRP levels (above 10 mg/L) and low serum albumin levels (below 35 g/L) may indicate tumor progression. Serum albumin, a key protein synthesized by the liver, reflects both nutritional and inflammatory status. Low albumin levels are associated with systemic inflammation, malnutrition, 32 and increased LNM in patients with malignant tumors. 33 Hypoalbuminemia arises from tumor progression-related catabolism 33 and may signal chronic inflammatory activation 32 ; as such, it can serve as an indicator of more aggressive tumor biology and heightened metastatic potential. 34 Elevation of CRP levels, an acute-phase protein response to inflammation, significantly influences cancer development and progression. 35 High CRP levels are correlated with enhanced systemic inflammatory response, which increases susceptibility to LNM. In GC patients’ post-radical surgery, Hirahara et al. 36 found that the GPS was an independent prognostic factor with respect to overall and cancer-specific survival and could be used to reliably predict long-term survival in this group.
Among the 14 ML models evaluated in the present study, AJCC T stage consistently exhibited the highest variable weights, indicating a crucial role in prediction of LNM in GC. Consistent with this, Yu et al. 37 reported relatively low rates of LNM in patients with T1 stage GC (7.0% for T1a and 19.4% for T1b). However, with progression to the T2 and T3 stages, the probability of LNM increased significantly, with metastasis rates of 48.4% and 77.1%, respectively. In T4 stage, the highest rates were observed (83.8% for T4a and 89.6% for T4b). Our findings also corroborate those of Wang et al., 38 who identified AJCC T stage as an independent risk factor for LNM in GC. These results demonstrate the importance of considering AJCC T stage in the evaluation of the metastatic potential of GC and in decision-making regarding clinical management.
Histological differentiation significantly influences GC behavior and LNM potential. Well-differentiated GC generally exhibits low LNM potential, with rates of approximately 18.8%. 39 Moderately differentiated tumors show a more aggressive pattern, with LNM probabilities of 24.4%. 39 Poorly differentiated and undifferentiated tumors have the highest LNM rates (often exceeding 50%, up to 56.8% 39 ), demonstrate greater invasiveness, and are linked to peritoneal metastasis, earlier recurrence, and worse prognosis. 38
In this study, we adopted a rigorous methodology incorporating 10-fold cross-validation to evaluate 14 distinct machine learning models, including LR, RF, and GBM, and identify the most effective prediction tools. The 10-fold cross-validation approach was crucial to mitigate overfitting and ensure that the models could generalize well to unseen data. 16 Although more advanced machine learning algorithms are now available, in our comparative analyses, that the CatBoost model achieved superior performance in clinical prediction tasks, yielding the highest AUC value of 0.808. This indicates that CatBoost-based machine learning methods have clear advantages in managing complex datasets and nonlinear feature interactions and thus show strong potential for clinical prediction. The comparisons performed here also highlight the importance of evaluating multiple models to comprehensively understand their strengths and weaknesses and select the most stable and accurate prediction tool for real-world clinical applications.
This work has several important implications for clinical practice. Our regression analysis identified five independent risk factors linked to LNM in GC, which highlighted the significant role of inflammation in prognosis, and we developed a prediction model based on these factors that could accurately assess LNM risk in GC patients. Notably, we also developed a dynamic network-based calculator to simplify the application of the model, thus enhancing its clinical utility. The selected optimal threshold of 0.56 serves as an actionable reference point for clinical practice: for patients with a predicted probability below 0.56 (classified as low-risk for LNM), a more conservative therapeutic strategy is reasonable. Thus, if GC patients at low risk of LNM cannot tolerate extensive surgery owing to systemic factors such as poor general health, advanced age, or severe comorbidities (e.g., cardiorespiratory diseases), an appropriate conservative treatment strategy may be considered without compromising long-term outcomes.
In recent years, given advances in artificial intelligence technology, various studies have attempted to utilize machine learning approaches to predict LNM in GC patients. Previous research has predominantly focused on construction of predictive models based on CT radiomics features. For instance, one study developed a prediction model integrating radiomics features from both tumor and peritumoral regions, achieving an AUC of approximately 0.779, 40 whereas another employed deep learning to extract CT imaging features for prediction of LNM in locally advanced GC, attaining an AUC of approximately 0.796 and superior predictive performance compared to conventional imaging assessment. 41 Furthermore, several studies have combined radiomics features with clinical variables to build machine learning models that have exhibited favorable predictive performance in both training and validation cohorts. 42 However, such models typically rely on complex image segmentation and feature extraction processes, which to some extent limits their widespread adoption in clinical practice. By contrast, in the present study, we systematically evaluated the associations of multiple inflammatory markers with LNM in GC, given the pivotal role of the inflammatory response in tumor development, progression, and metastasis, and constructed a machine learning prediction model incorporating clinicopathological characteristics. This model demonstrated predictive performance comparable to that of previous radiomics- or deep-learning-based models, while relying solely on routinely available clinical and laboratory indicators. Thus, it offers superior clinical accessibility and greater potential for broad implementation.
Despite the clinical utility of our online prediction tool, its long-term accessibility and maintenance will require continuous technical and institutional support; moreover, the question of patient data protection must be rigorously addressed if the tool is to be applied in real-world settings.
The study had several limitations. For instance, its retrospective design could have introduced selection bias in the patient data, and, although the sample size was adequate overall, certain subgroups (e.g., T3 staging) had limited patient numbers. Moreover, the absence of an independent external validation cohort was a major limitation that restricts the generalizability of our model; therefore, larger, multicenter studies with external validation are needed to confirm its broader applicability. In addition, many other markers exist in addition to the eight common peripheral blood inflammation markers measured here, such that our evaluation of the inflammation–LNM connection was not fully comprehensive. Furthermore, we did not explore postoperative changes in inflammatory markers. Future studies should therefore validate our findings in larger, diverse cohorts to confirm the broad applicability of the model. In addition, exploration of other biomarkers, fusion imaging histology, or genomic data could improve the predictive power of the model and provide further insights to guide optimization of GC treatment strategies.
Conclusion
In this study, we have demonstrated the role of inflammatory markers, particularly GPS, in predicting LNM in GC, as well as identifying AJCC T stage, histological differentiation, vascular invasion, and total lymph node count as independent risk factors through multivariable analysis. We have further developed a machine learning model based on the CatBoost algorithm using inflammatory markers, together with a user-friendly web-based calculator, to predict LNM in GC with good accuracy. Continued refinement of this prediction tool is warranted. However, the present work could offer a valuable new approach to the use of inflammatory markers for LNM prediction in patients with GC, with clinical implications for risk stratification and treatment decisions.
Supplemental Material
sj-docx-1-tag-10.1177_17562848261451338 – Supplemental material for Predictability of peripheral blood inflammatory markers in prediction of lymph node metastasis in gastric cancer
Supplemental material, sj-docx-1-tag-10.1177_17562848261451338 for Predictability of peripheral blood inflammatory markers in prediction of lymph node metastasis in gastric cancer by Xiang Li, Wei Dai, Xi Li, Xuan Chen, Yajun Chen, Zhongxue Fu and Jun Zhang in Therapeutic Advances in Gastroenterology
Supplemental Material
sj-jpg-1-tag-10.1177_17562848261451338 – Supplemental material for Predictability of peripheral blood inflammatory markers in prediction of lymph node metastasis in gastric cancer
Supplemental material, sj-jpg-1-tag-10.1177_17562848261451338 for Predictability of peripheral blood inflammatory markers in prediction of lymph node metastasis in gastric cancer by Xiang Li, Wei Dai, Xi Li, Xuan Chen, Yajun Chen, Zhongxue Fu and Jun Zhang in Therapeutic Advances in Gastroenterology
Supplemental Material
sj-jpg-2-tag-10.1177_17562848261451338 – Supplemental material for Predictability of peripheral blood inflammatory markers in prediction of lymph node metastasis in gastric cancer
Supplemental material, sj-jpg-2-tag-10.1177_17562848261451338 for Predictability of peripheral blood inflammatory markers in prediction of lymph node metastasis in gastric cancer by Xiang Li, Wei Dai, Xi Li, Xuan Chen, Yajun Chen, Zhongxue Fu and Jun Zhang in Therapeutic Advances in Gastroenterology
Supplemental Material
sj-xlsx-1-tag-10.1177_17562848261451338 – Supplemental material for Predictability of peripheral blood inflammatory markers in prediction of lymph node metastasis in gastric cancer
Supplemental material, sj-xlsx-1-tag-10.1177_17562848261451338 for Predictability of peripheral blood inflammatory markers in prediction of lymph node metastasis in gastric cancer by Xiang Li, Wei Dai, Xi Li, Xuan Chen, Yajun Chen, Zhongxue Fu and Jun Zhang in Therapeutic Advances in Gastroenterology
Supplemental Material
sj-xlsx-2-tag-10.1177_17562848261451338 – Supplemental material for Predictability of peripheral blood inflammatory markers in prediction of lymph node metastasis in gastric cancer
Supplemental material, sj-xlsx-2-tag-10.1177_17562848261451338 for Predictability of peripheral blood inflammatory markers in prediction of lymph node metastasis in gastric cancer by Xiang Li, Wei Dai, Xi Li, Xuan Chen, Yajun Chen, Zhongxue Fu and Jun Zhang in Therapeutic Advances in Gastroenterology
Supplemental Material
sj-xlsx-3-tag-10.1177_17562848261451338 – Supplemental material for Predictability of peripheral blood inflammatory markers in prediction of lymph node metastasis in gastric cancer
Supplemental material, sj-xlsx-3-tag-10.1177_17562848261451338 for Predictability of peripheral blood inflammatory markers in prediction of lymph node metastasis in gastric cancer by Xiang Li, Wei Dai, Xi Li, Xuan Chen, Yajun Chen, Zhongxue Fu and Jun Zhang in Therapeutic Advances in Gastroenterology
Supplemental Material
sj-pdf-1-tag-10.1177_17562848261451338 – Supplemental material for Predictability of peripheral blood inflammatory markers in prediction of lymph node metastasis in gastric cancer
Supplemental material, sj-pdf-1-tag-10.1177_17562848261451338 for Predictability of peripheral blood inflammatory markers in prediction of lymph node metastasis in gastric cancer by Xiang Li, Wei Dai, Xi Li, Xuan Chen, Yajun Chen, Zhongxue Fu and Jun Zhang in Therapeutic Advances in Gastroenterology
Footnotes
Acknowledgements
The authors would like to thank the medical staff of the First Affiliated Hospital of Chongqing Medical University and Chongqing University Fuling Hospital for their assistance in data collection and the conduct of this study. We also thank the editors and peer reviewers for their insightful comments and constructive suggestions, which significantly improved the quality of this manuscript.
Declarations

Supplemental material
Supplemental material for this article is available online.
References
Supplementary Material
Please find the following supplemental material available below.
For Open Access articles published under a Creative Commons License, all supplemental material carries the same license as the article it is associated with.
For non-Open Access articles published, all supplemental material carries a non-exclusive license, and permission requests for re-use of supplemental material or any part of supplemental material shall be sent directly to the copyright owner as specified in the copyright notice associated with the article.


