
Abstract
Background:
Myelin oligodendrocyte glycoprotein antibody-associated disease (MOGAD) is a clinically heterogeneous demyelinating disorder. Current knowledge of its phenotypic spectrum and optimal treatment strategies, especially in Asian populations, remains limited.
Objectives:
This study aimed to characterize the clinical and imaging features of MOGAD in a Northern Chinese cohort and to evaluate the therapeutic effects of the anti-CD20 monoclonal antibody ofatumumab.
Design:
A retrospective study in a single center.
Methods:
We conducted a retrospective analysis of 108 patients who tested positive for MOG antibodies between June 2018 and August 2025, ultimately diagnosing 56 patients with MOGAD comprising 17 pediatric and 39 adult cases. Clinical, imaging, and cerebrospinal fluid (CSF) data were systematically reviewed. Ten patients received ofatumumab treatment for relapse prevention. The study was approved by the Ethics Committee of Shandong Provincial Hospital Affiliated to Shandong First Medical University (SWYX: NO.2025-709) and written consent was obtained from all participants.
Results:
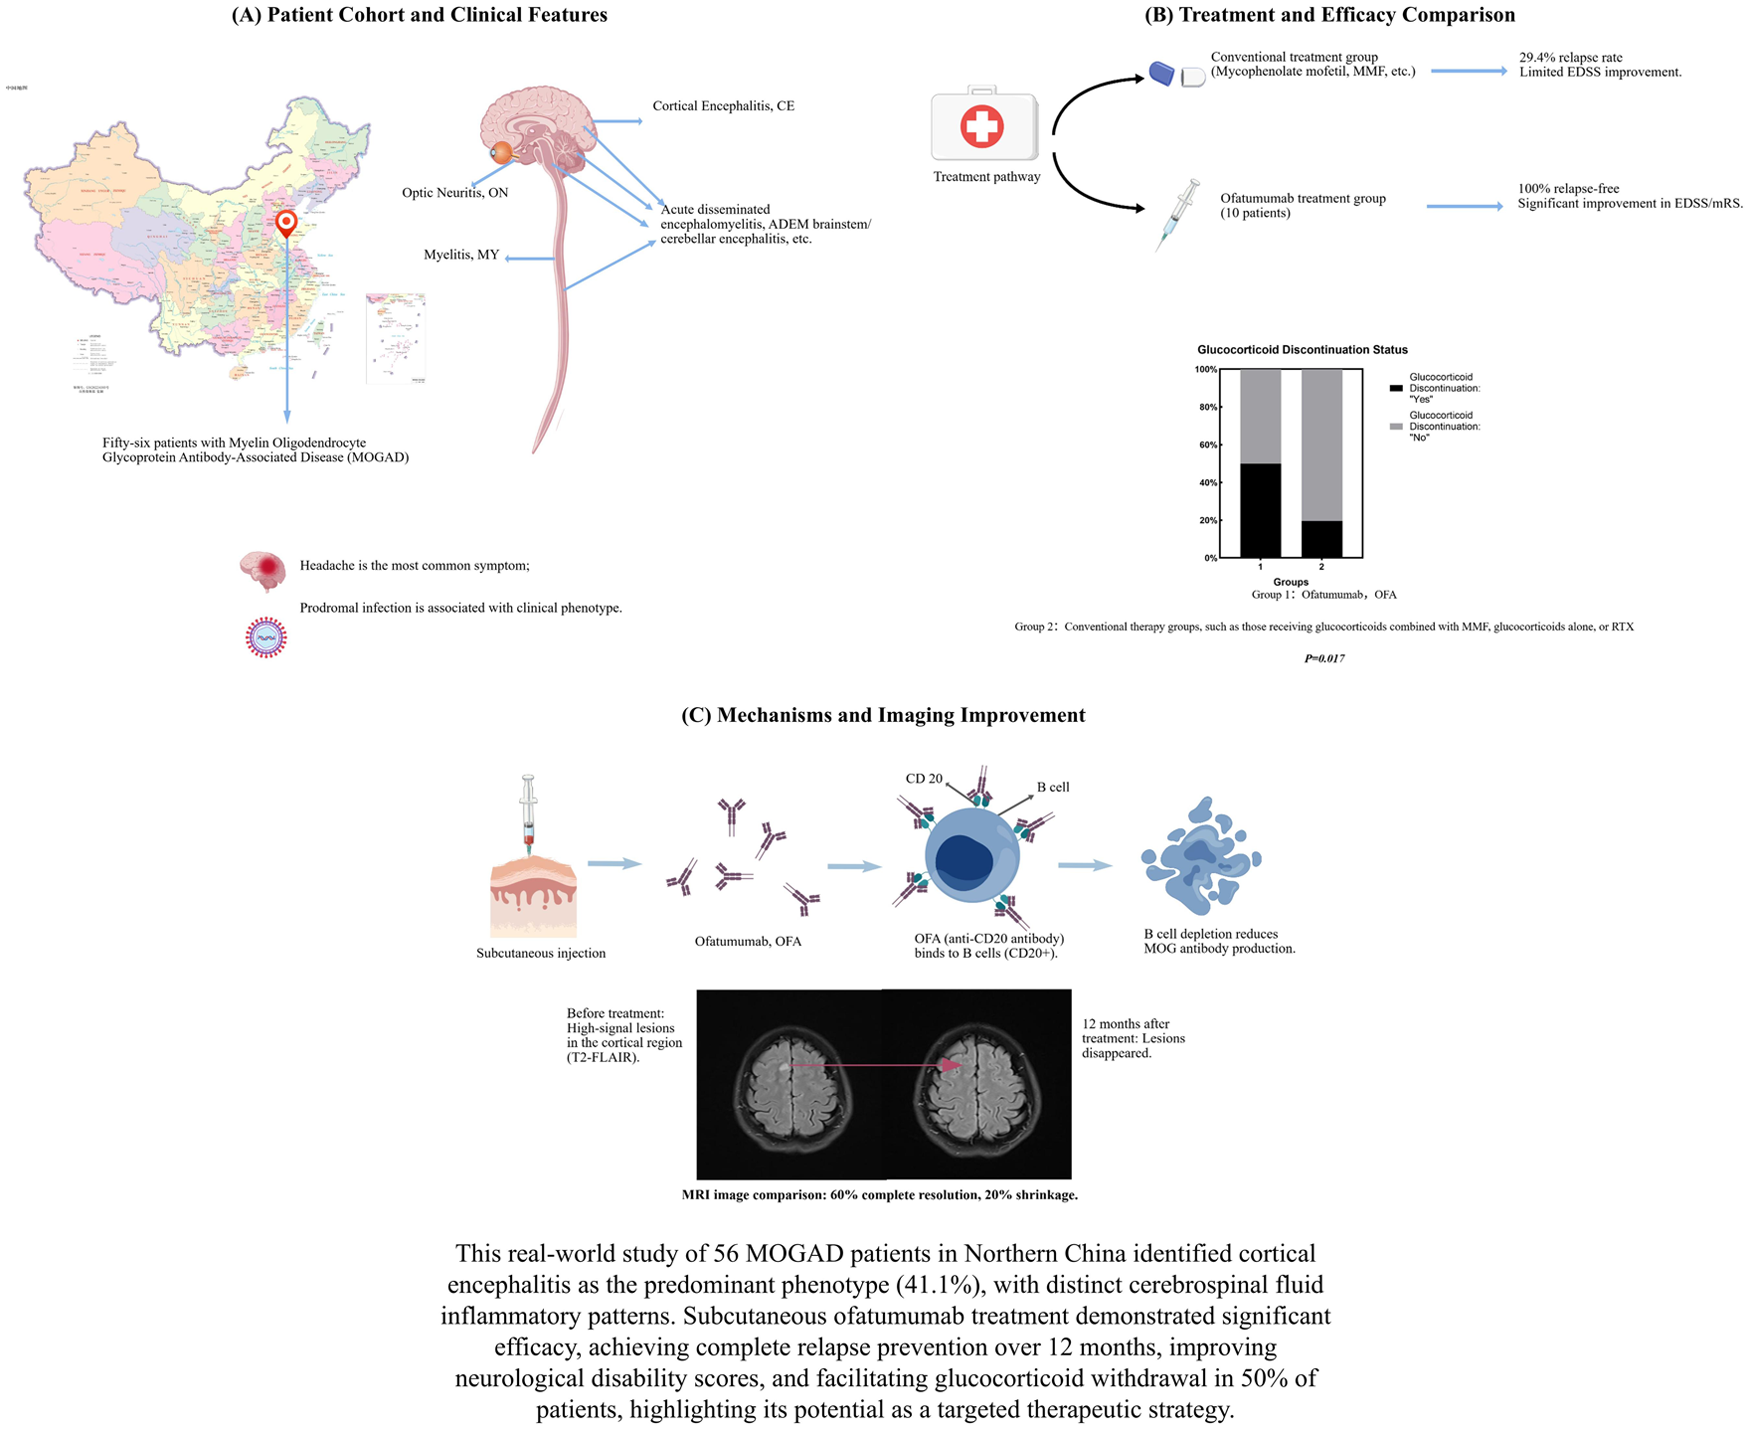
Cortical encephalitis was the most frequent phenotype (41.1%, 23/56), followed by Unifocal Demyelination (39.3%, 22/56). Radiographically, 94.4% of patients exhibited 1–3 lesions, predominantly in cortical regions. CSF analysis revealed elevated cell counts and protein levels, with significant variation across phenotypes (p < 0.05). Adults with relapsing courses experienced greater disability progression (p = 0.006). Ofatumumab treatment resulted in no observed relapses, along with improvements in Expanded Disability Status Scale (EDSS) and modified Rankin Scale (mRS) scores and reduction in MRI lesion burden compared with baseline (all p < 0.05). Notably, 50% (5/10) of ofatumumab-treated patients discontinued glucocorticoids within 12 months, compared with 19.6% (9/46) in the conventional therapy group (p = 0.017).
Conclusion:
This study delineates a distinct clinical-radiological profile of MOGAD in Northern China, characterized by a high frequency of cortical encephalitis. Furthermore, it provides preliminary evidence that ofatumumab may be a potential steroid-sparing therapeutic option for MOGAD.
Introduction
Myelin oligodendrocyte glycoprotein antibody-associated disease (MOGAD) is an immune-mediated demyelinating disorder of the central nervous system, distinct from multiple sclerosis (MS) and aquaporin-4 (AQP4) antibody-positive neuromyelitis optica spectrum disorder (NMOSD).1–3 Since the inclusion of MOG immunoglobulin G (IgG) as a core diagnostic biomarker in the 2023 international consensus criteria, 1 MOGAD has been recognized as a unified disease entity encompassing a broad clinical spectrum, including cortical encephalitis (CE), unifocal demyelination, acute disseminated encephalomyelitis (ADEM), brainstem or cerebellar syndromes, and seronegative NMOSD-like presentations.1,4–11 Unifocal demyelination further includes optic neuritis (ON) and myelitis (MY). Despite diagnostic advances, MOGAD remains a therapeutic challenge. Up to 50% of patients experience a relapsing course, and a significant proportion accumulate disability despite first-line acute treatments (e.g., corticosteroids, intravenous immunoglobulin) and conventional maintenance immunosuppressants like mycophenolate mofetil. 12 Over 40% of patients develop persistent disability following disease onset, underscoring the critical need for early identification and intervention to prevent relapses.8,13,14 There is a critical, unmet need for effective, targeted, and steroid-sparing disease-modifying therapies to prevent relapses and improve long-term outcomes.15,16
Ofatumumab, a fully human anti-CD20 monoclonal antibody administered subcutaneously, has demonstrated high efficacy and a favorable safety profile in relapsing MS and is emerging as a potential therapy in other neuroinflammatory conditions. Its potent and sustained B-cell depletion mechanism may be particularly relevant in MOGAD, where B cells and autoantibodies are central to pathogenesis.17–20 However, most existing phenotypic and prognostic data derive from Western and pediatric cohorts, with a striking underrepresentation of Asian populations, particularly from China. 21 Furthermore, despite the central role of B cells and autoantibodies in MOGAD pathogenesis, clinical evidence for B-cell-depleting therapies remains scarce. Ofatumumab achieves sustained peripheral B-cell depletion and has shown efficacy in other neuroinflammatory disorders, yet its use in MOGAD is supported only by isolated case reports. 22 Therefore, this study aimed to: characterize the clinical, imaging, and CSF profiles of MOGAD in a Northern Chinese cohort, with attention to potential regional variations. Evaluate the real-world effectiveness and safety of ofatumumab in preventing relapses and facilitating glucocorticoid withdrawal and identify factors associated with disease course and treatment response. Our findings are intended to address critical gaps in both epidemiological understanding and therapeutic strategy for MOGAD in underrepresented populations as shown in the Supplemental material.
Materials and methods
Patients and MOGAD diagnostic criteria
From June 2018 to August 2025, a total of 108 patients who tested positive for MOG antibodies were enrolled. Based on clinical manifestations and imaging data, those with other coexisting antibodies were excluded, resulting in 56 patients being diagnosed with MOGAD (29 females and 27 males). Their clinical data were collected. The diagnosis of MOGAD was based on the 2023 International Diagnostic Criteria proposed by the MOGAD Expert Panel. 1 Clinical phenotypes were categorized as unifocal demyelination which including ON (unilateral/bilateral) and MY (longitudinal extensive transverse myelitis [LETM] ⩾3 spinal cord segments or short-segment myelitis <3 segments), ADEM-like, CE, seronegative NMOSD-like (combination of ON and transverse myelitis), brainstem/cerebellar phenotypes. Relapses were defined as new neurological deficits (confirmed by examination/MRI) occurring >30 days after a prior event, lasting >24 h. The study protocol was approved by the Ethics Committee of Shandong Provincial Hospital affiliated with Shandong First Medical University. No patients were lost to follow-up during the study period.
Antibody testing
Testing for MOG-IgG was performed using a live cell-based assay (L-CBA). Briefly, human cells were transfected with a plasmid encoding full-length human MOG and green fluorescent protein (GFP). Live transfected cells were incubated with patient serum (diluted 1:10) or CSF (diluted 1:1), followed by antihuman IgG. Results were interpreted by two independent, blinded assessors using indirect immunofluorescence microscopy. Membrane-bound red fluorescence on GFP-positive live cells indicated a positive result. Assay validation included (1) known positive and negative controls in each run; (2) a diagnostic cut-off titer of ⩾1:10 for serum. Flow cytometry was used for semi-quantitative confirmation in a subset of samples but not for primary diagnosis.
MRI analysis
MRIs were undertaken during treatment for the first attack and relapse. MRI scans were independently reviewed by two neurologists. For each MRI, we evaluated the regions involved on initial diagnosis based on the patient’s MRI T2, T2 fluid-attenuated inversion recovery (FLAIR), or T2-weighted sequences (if T2-FLAIR was unavailable). These regions were categorized as follows: cerebral cortex/sulci and gyri, subcortical white matter, basal ganglia, corpus callosum, optic nerve (bilateral/unilateral), spinal cord (long/short segment), cerebellum, periventricular areas, brainstem, or no lesion. We also assessed the enhancement pattern on MRI to determine whether there was parenchymal enhancement, leptomeningeal enhancement, or no enhancement. At the time of relapse, MRI was repeated to assess for new or enlarging lesions and to note the pattern of contrast enhancement.
Paraclinical investigations
CSF data (cell count, protein, oligoclonal bands) were recorded at first diagnosis, relapse, or follow-up (if available). CSF cell count >5 cells/μL and protein >45 mg/dL were defined as elevated. Expanded disability status scale (EDSS) scores were assessed at the time of initial detection of MOG-Abs positivity and during relapses for all patients. Additionally, the disability worsening and prognosis of patients with MOGAD were evaluated using the EDSS score after treatment with traditional immunosuppressive agents (mycophenolate mofetil, MMF) or ofatumumab during the remission phase. Depending on baseline EDSS score, EDSS worsening was defined as ⩾2-point increase (baseline=0), ⩾1-point increase (baseline = 1–5), or ⩾0.5-point increase (baseline ⩾ 5.5).
Treatment protocol
Ofatumumab was administered subcutaneously according to the following schedule: an initial dose of 20 mg at weeks 0 and 4, followed by a maintenance dose of 20 mg every 4 weeks. Treatment duration was at least 12 months. Glucocorticoid tapering was initiated upon the start of ofatumumab administration, with the goal of discontinuation within 12 months if no relapse occurred and MRI showed no new lesions. Other conventional immunotherapy strategies include mycophenolate mofetil at a dose of 1 g/day combined with stepwise glucocorticoid tapering; azathioprine at a dose of 1 g/day combined with stepwise glucocorticoid tapering; or glucocorticoids monotherapy at an initial dose of 60 mg/day with gradual tapering.
Statistical analysis
Patients were classified as pediatric (0–17 years) or adult (⩾18 years) based on index event age. 23 Continuous variables are presented as mean ± SD for normally distributed data and as median (range) for skewed data. Normality was assessed using the Shapiro–Wilk test, and categorical variables as frequency and percentage (%). We used two-sample t-tests with equal variances (or unequal variances if the ratio of standard deviations was >2) to compare means of continuous variables, and the Pearson’s chi-square or Fisher’s exact test (if expected counts <5) for categorical variables to compare demographics and clinical characteristics between the pediatric and adult groups. For a 2 × 2 contingency table, if the minimum expected frequency is less than 5, Fisher’s exact test is used. We employed the paired sample t-test (paired t-test) to compare the numerical changes in the same group of patients before and after treatment. Nonnormally distributed continuous data were compared using Mann–Whitney tests. Statistical analyses were performed using SPSS version 27.0.
Results
Demographic and clinical spectrum of the MOGAD cohort
Of the 108 initially MOG-IgG-positive patients, 52 were excluded from the final diagnosis of MOGAD after applying the 2023 International Criteria. Reasons for exclusion included low titers without a compatible clinical phenotype (n = 22), alternative final diagnoses (n = 18), or transient seropositivity (n = 12). This confirmation rate (51.9%) is consistent with the positive predictive value of MOG-IgG testing in real-world hospital-based cohorts. 24 Fifty-six patients were definitively diagnosed with MOGAD (29 females and 27 males). The mean age of onset was 31.8 ± 17.8 years (range 5–73). The most frequent clinical phenotype was CE (41.1%, n = 23), followed by unifocal demyelination (39.3%, n = 22), which included optic neuritis (ON) (23.2%, n = 13) and myelitis (MY) (16.1%, n = 9), then acute disseminated encephalomyelitis (ADEM-like) (8.9%, n = 5), brainstem/cerebellar (5.4%, n = 3), and AQP4-IgG- NMOSD-like (5.4%, n = 3) (Figure1(a)). The most common clinical manifestation was headache. It is important to note that the diagnosis of CE was primarily based on characteristic MRI findings, the associated clinical symptoms were often mild (e.g., headache) and did not always include frank encephalopathy or seizures.
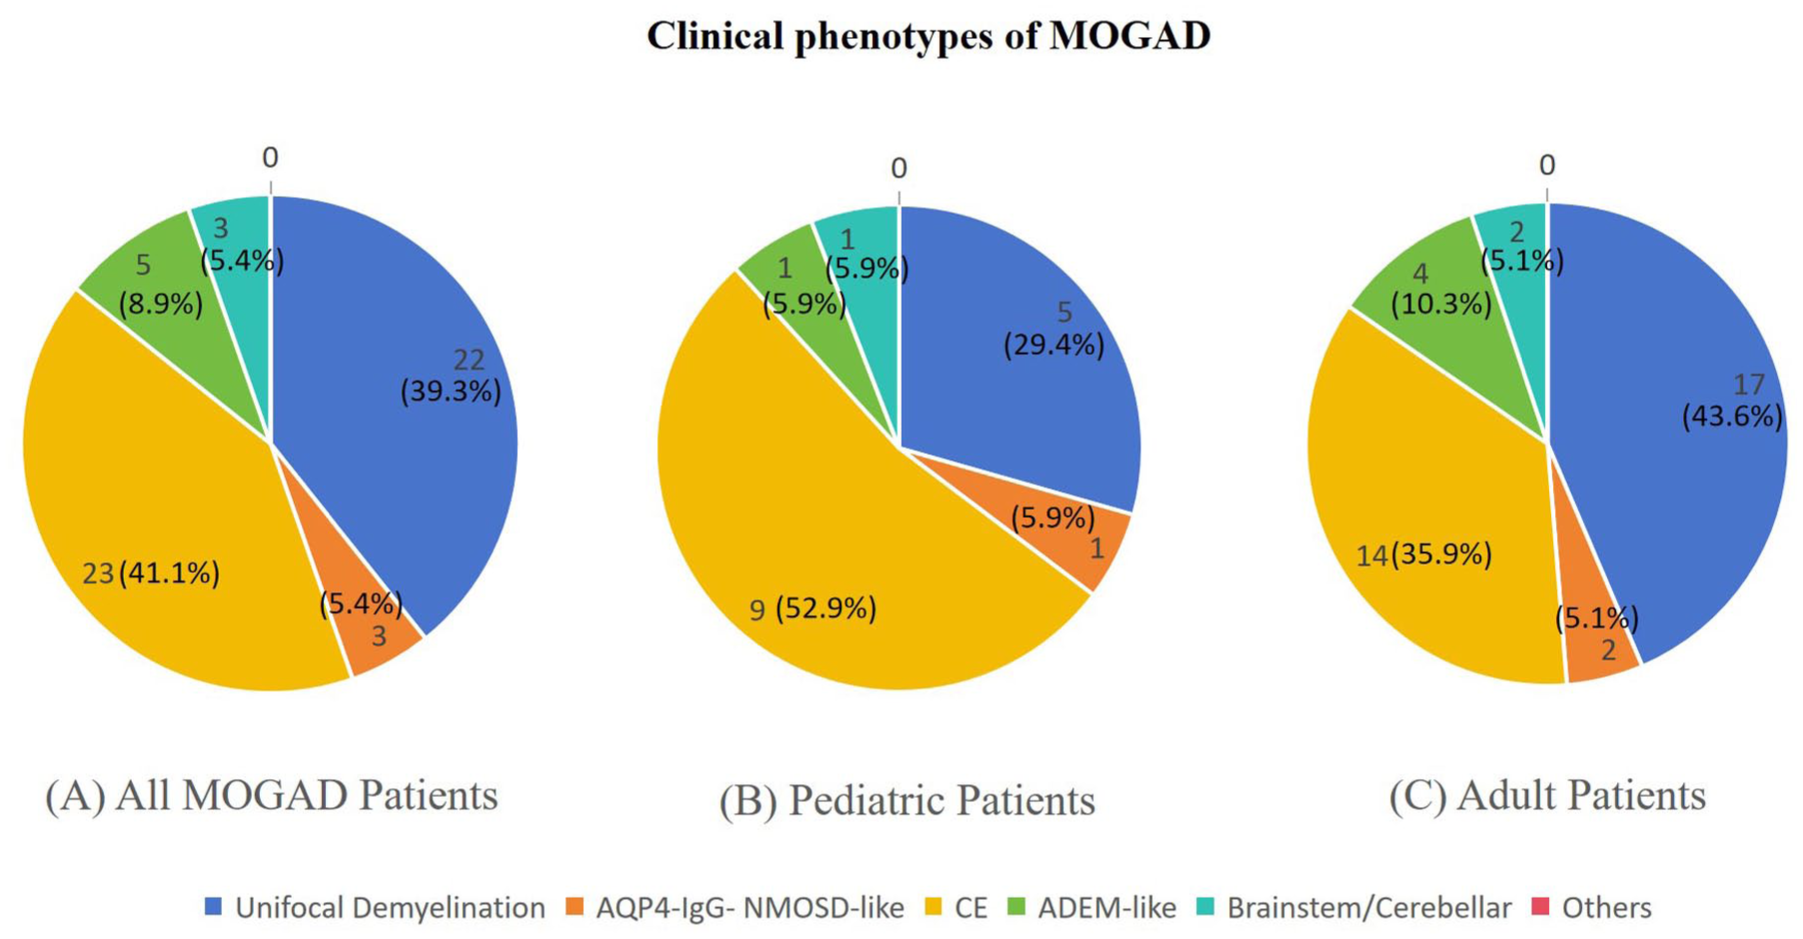
Clinical phenotypes of MOGAD. (a) Clinical phenotypes of all MOGAD patients. (b) Clinical phenotypes of pediatric MOGAD patients. (c) Clinical phenotypes of adult MOGAD patients.
Twenty-two of 56 (39.3%) patients experienced prodromal infections prior to onset, predominantly fever (86.4%). The proportion of prodromal infection varied significantly across phenotypes (p = 0.037), being highest in the MY (55.6%, 5/9) and CE (52.2%, 12/23) phenotypes, and lowest in the ON phenotype (15.4%, 2/13). Pairwise comparison revealed the proportion in the CE phenotype was significantly higher than that in the ON phenotype (p = 0.009).
Eighteen patients (32.1%) had a relapsing disease course. The median time to first relapse was 6.9 months (interquartile range (IQR): 1–16 months). Among relapsing patients, 8 (44.4%) experienced ⩾2 relapses. The mean age of onset did not differ significantly between relapsed and monophasic patients (29.3 ± 15.5 vs 33.0 ± 18.9 years, p = 0.477). In both monophasic and relapsing patients, CE was the most common phenotype (Figure 1(b) and (c)). The median EDSS score at diagnosis for the entire cohort was 2.0 (IQR, 1.0–3.5). Detailed demographic and clinical characteristics are presented in Table 1.
Demographic and clinical characteristics of MOGAD patients.
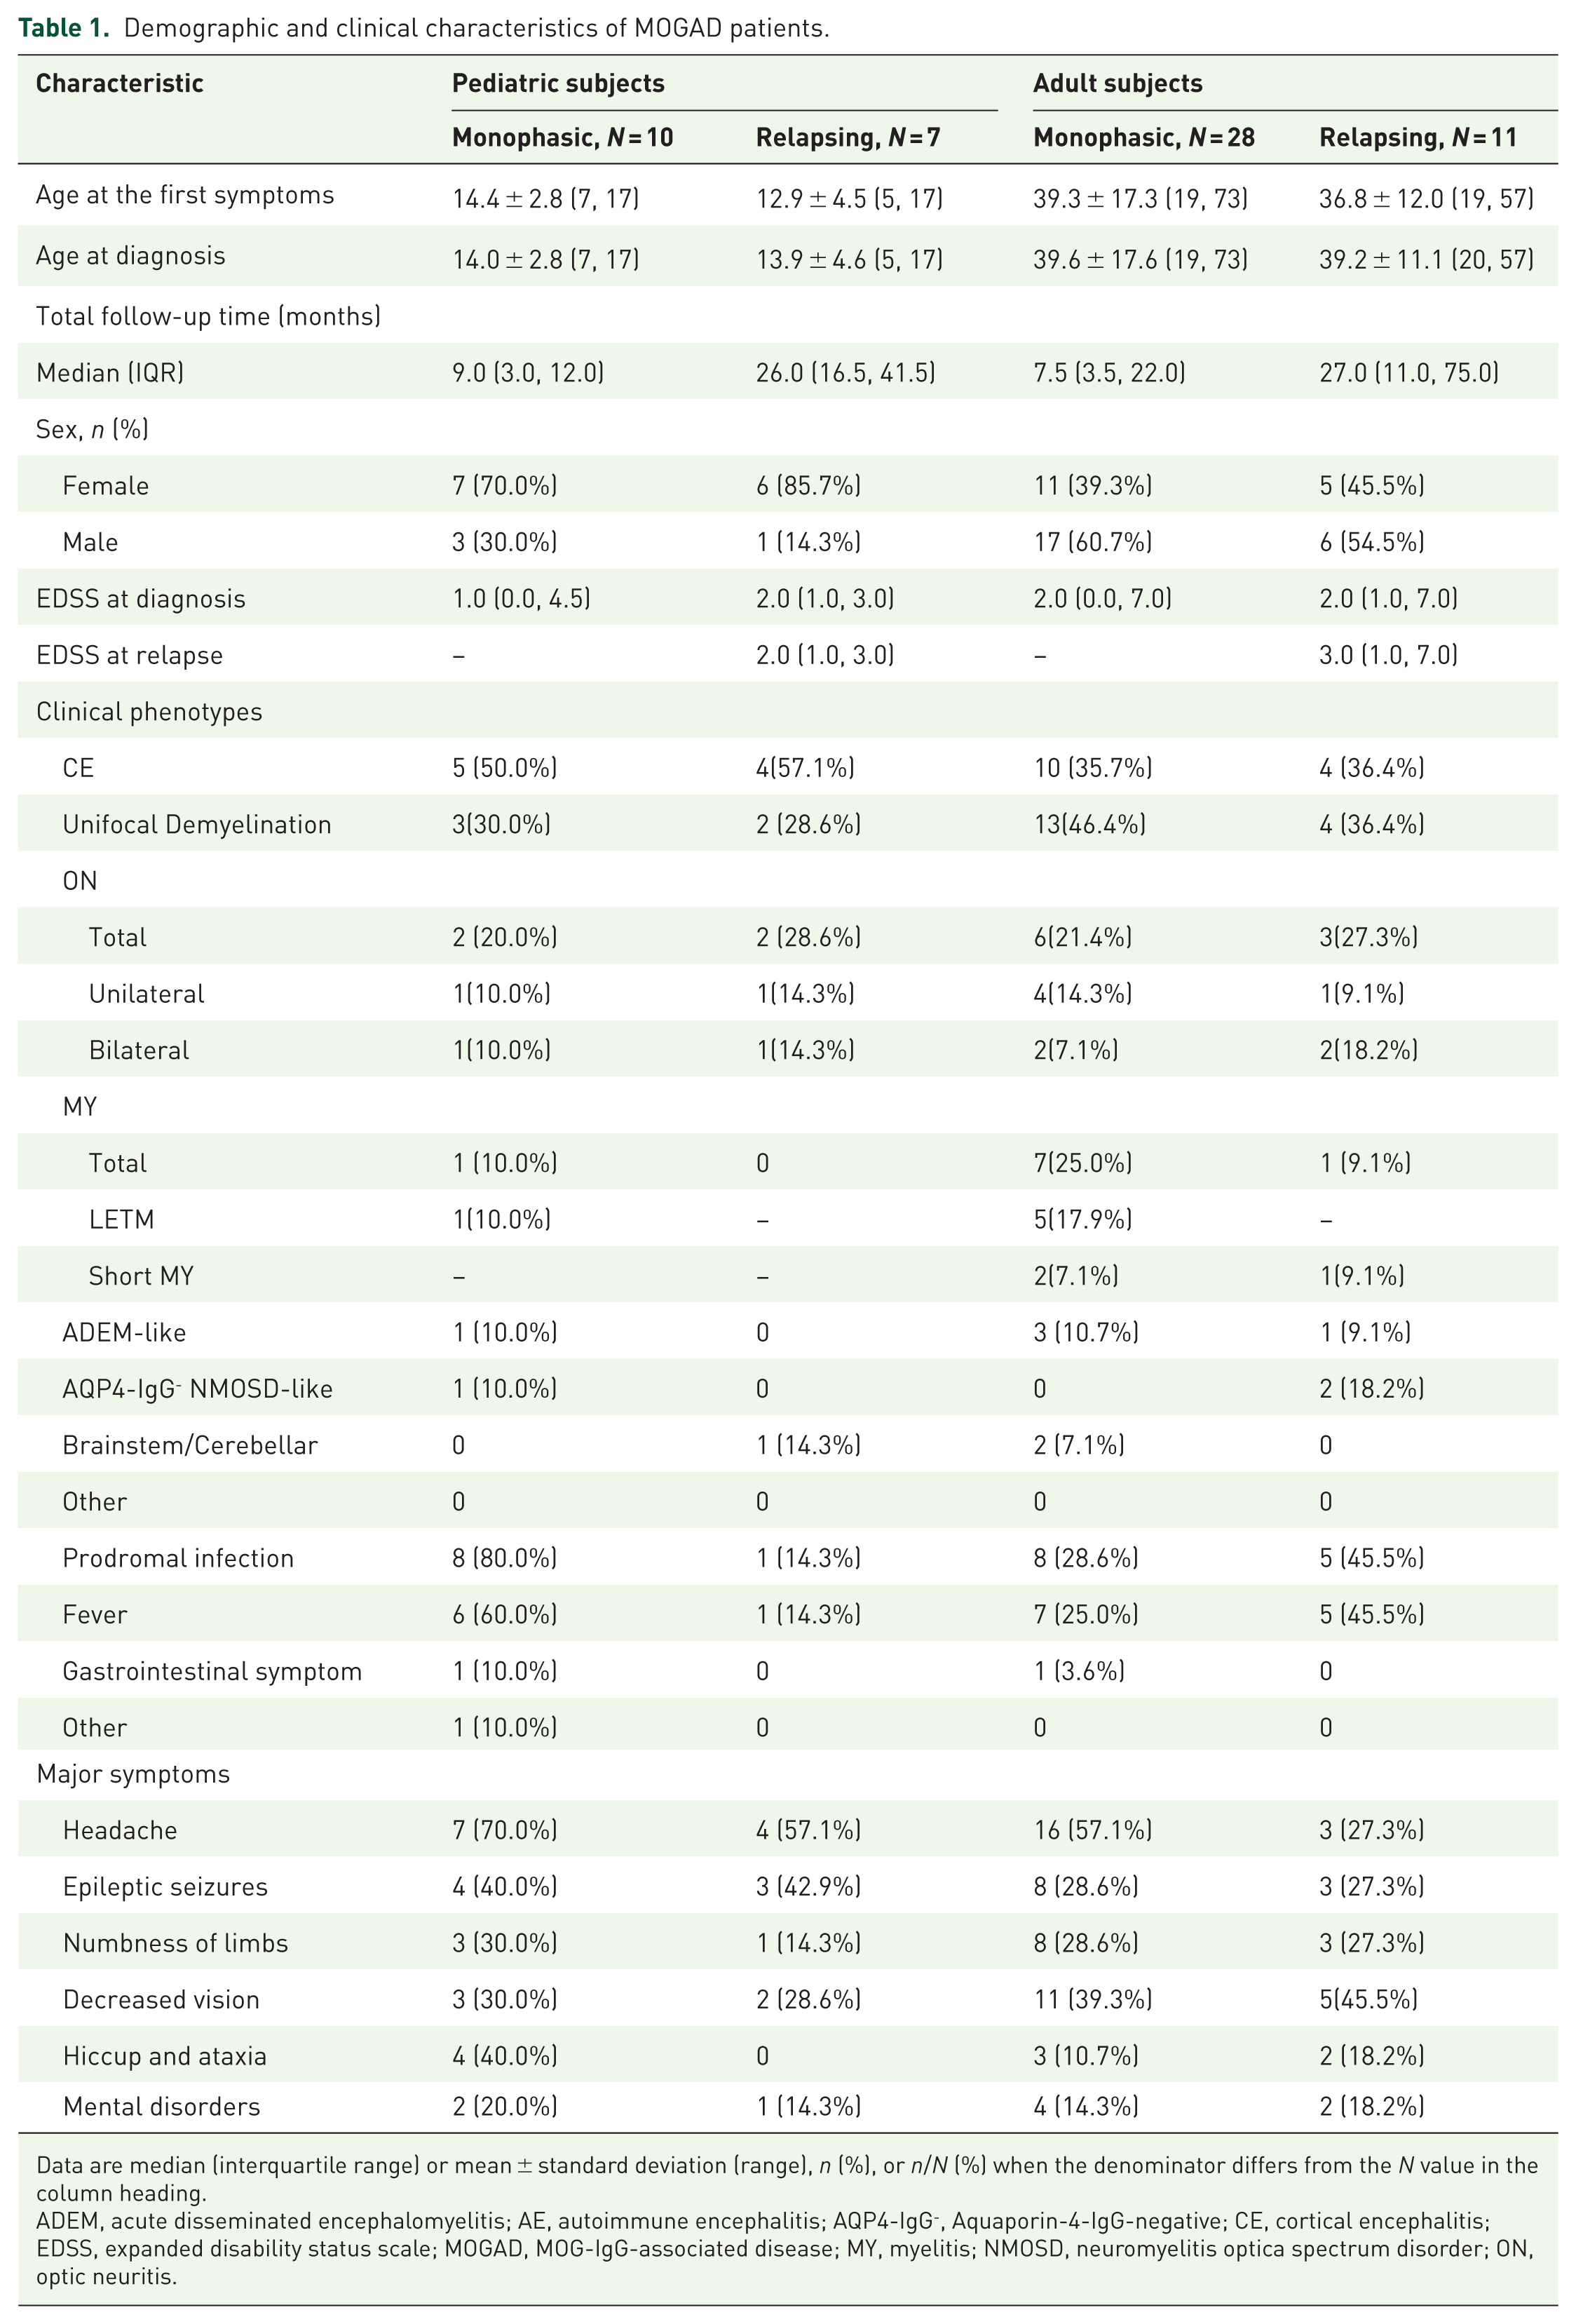
Data are median (interquartile range) or mean ± standard deviation (range), n (%), or n/N (%) when the denominator differs from the N value in the column heading.
ADEM, acute disseminated encephalomyelitis; AE, autoimmune encephalitis; AQP4-IgG-, Aquaporin-4-IgG-negative; CE, cortical encephalitis; EDSS, expanded disability status scale; MOGAD, MOG-IgG-associated disease; MY, myelitis; NMOSD, neuromyelitis optica spectrum disorder; ON, optic neuritis.
Neuroimaging and cerebrospinal fluid profiles
Among 56 patients with available imaging, cerebral cortex involvement was the most common finding (37.5%, n = 21). Radiologically, 54 patients (96.4%) had brain T2-hyperintense lesions, with 51 (94.4% of those with lesions) having 1–3 lesions. Contrast-enhanced imaging revealed enhancement in 15 patients (26.8%): parenchymal enhancement in 10 (17.9%), leptomeningeal enhancement in 3 (5.4%), and combined enhancement in 2. Detailed radiological features of specific phenotypes are shown in Figure 2.
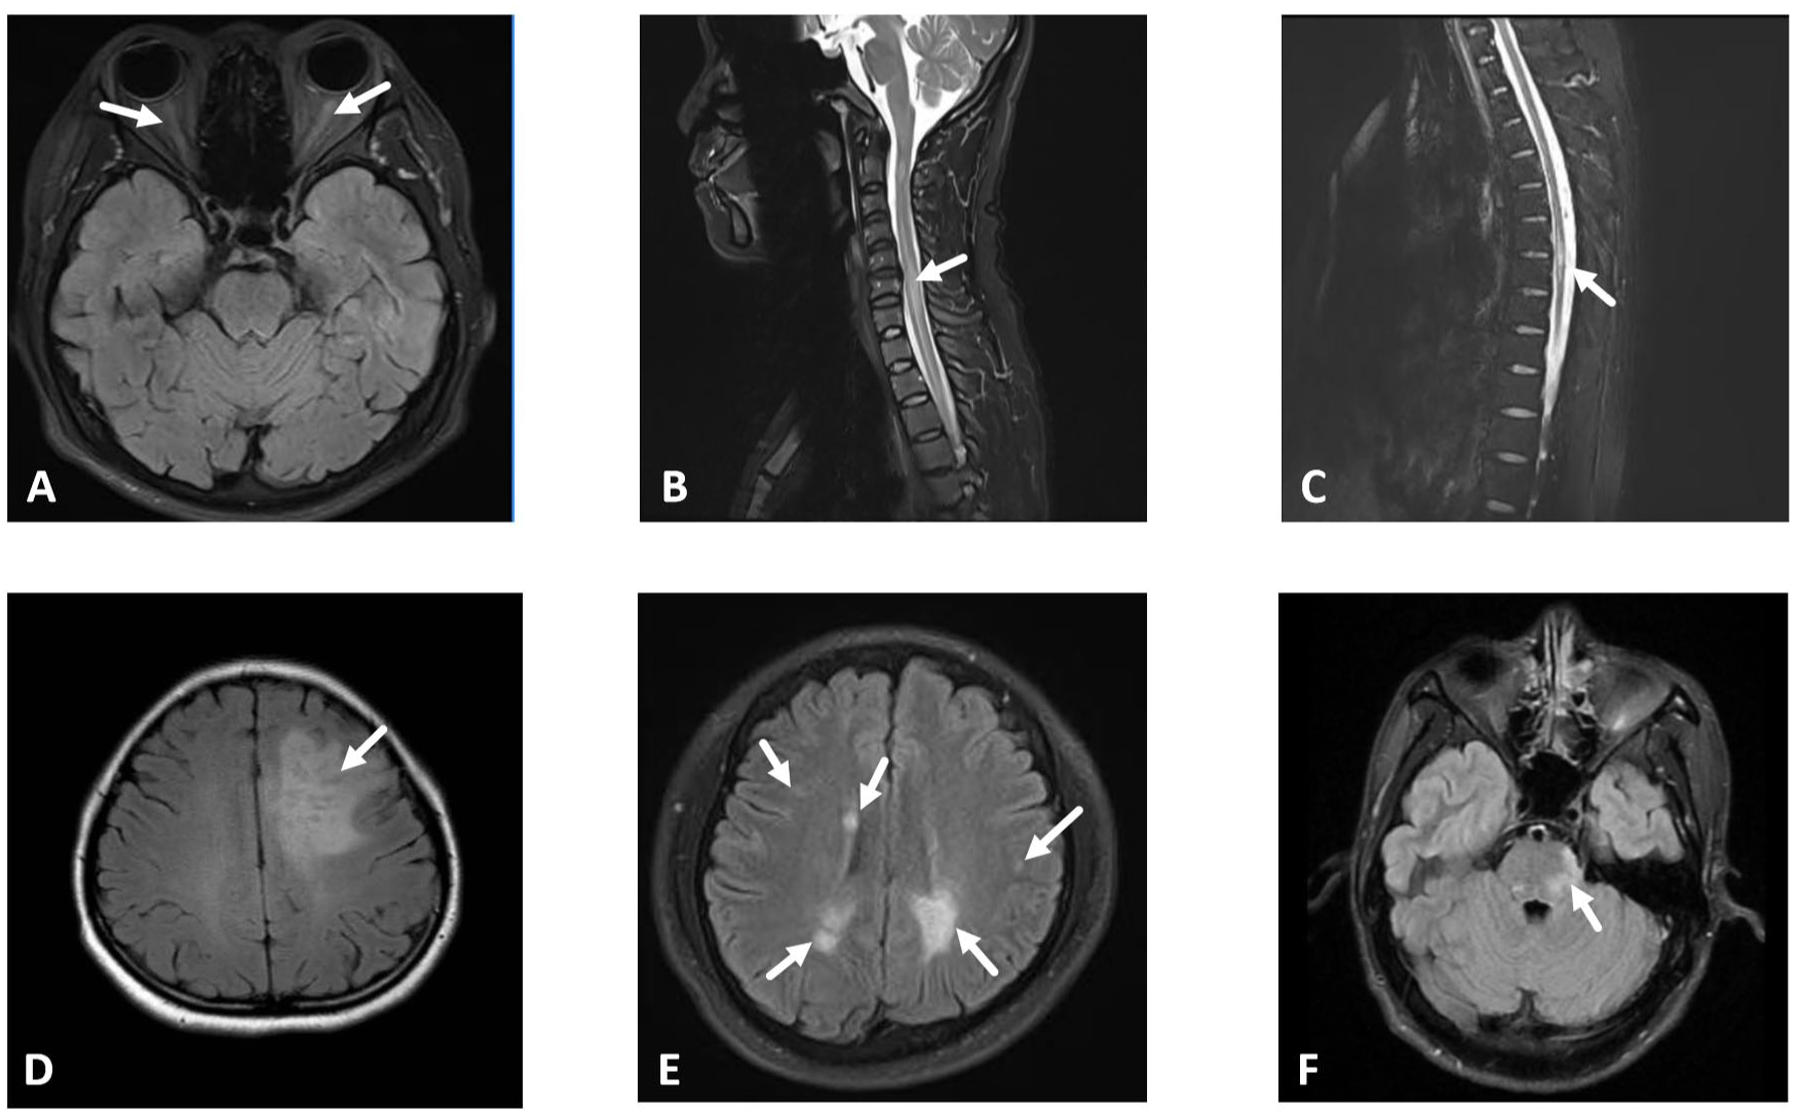
Neuroimaging manifestations of MOGAD patients. (a) T2-weighted fat-suppressed orbital MRI. Bilateral optic nerve hyperintensity with swelling (arrows), consistent with acute inflammation. (b) Sagittal T2-weighted spinal MRI. Focal hyperintensity in the cervical spinal cord (C2-C7), long-segment hyperintensity spanning ⩾3 vertebral segments consistent with longitudinal extensive transverse myelitis (LETM). (c) Sagittal T2-weighted spinal MRI. Focal hyperintensity in the thoracic spinal cord (T2–T4), involving <3 vertebral segments (short-segment myelitis). (d) Axial T2-FLAIR MRI. Hyperintensity in the left frontal cortical sulci and gyri. (e) Axial T2-FLAIR MRI. Multiple hyperintense lesions in the bilateral cerebral hemispheres, and periventricular regions. (f) Axial T2-FLAIR MRI. Hyperintensity in the pontine tegmentum.
Cerebrospinal fluid (CSF) analysis was performed in 41 patients. The median mononuclear cell count was 35.0 cells/μL (IQR 4.0–71.0). CSF pleocytosis (>5 cells/μL) was present in 30 patients (73.2%), and elevated protein level (>45 mg/dL) was found in 23 patients (56.1%). The likelihood of both CSF pleocytosis and protein elevation varied significantly depending on the clinical phenotype (p = 0.001 and p = 0.016, respectively). Specifically, the CE phenotype showed significantly higher rates of pleocytosis compared to the MY (p = 0.010), ON/NMO (p = 0.014), and IBE/ICE (p = 0.045) phenotypes, and a higher rate of protein elevation compared to the ON/NMO phenotypes (p = 0.038). Oligoclonal bands were detected in 1 of 14 tested patients (7.1%).
Comparison between pediatric and adult patients
Seventeen patients were pediatric (<18 years), and 39 were adult (⩾18 years). The most common initial symptom was headache in both groups (64.7% in children, 48.7% in adults). Seizures were more frequent in children (41.2% vs 28.2%), while visual disturbances were more common in adults (41.0% vs 29.4%). The annualized relapse rate was higher in the pediatric group (41.2%) than in adults (28.2%), though this difference was not statistically significant (p = 0.339). Regarding disability, adult patients with a relapsing disease course had a significantly higher median EDSS at diagnosis (3.0, range 1.0–7.0) compared to adult patients with a monophasic course (2.0, range 0.0–7.0) (p = 0.006). No such significant difference was observed in the pediatric group (p = 0.191). These data are detailed in Table 1.
Treatment outcomes and response to ofatumumab
In the acute phase, 54 patients (96.4%) received intravenous methylprednisolone. Patients with a relapsing course were more likely to receive intravenous immunoglobulin (IVIG) than monophasic patients (33.3% vs 5.3%, p = 0.010). For relapse prevention, the use of MMF was more common in relapsing patients (61.1% vs 15.8%, p < 0.001; Table 2). However, 5 of the 17 patients (29.4%) treated with MMF experienced relapses.
Treatment by monophasic versus relapsing subjects in MOGAD.
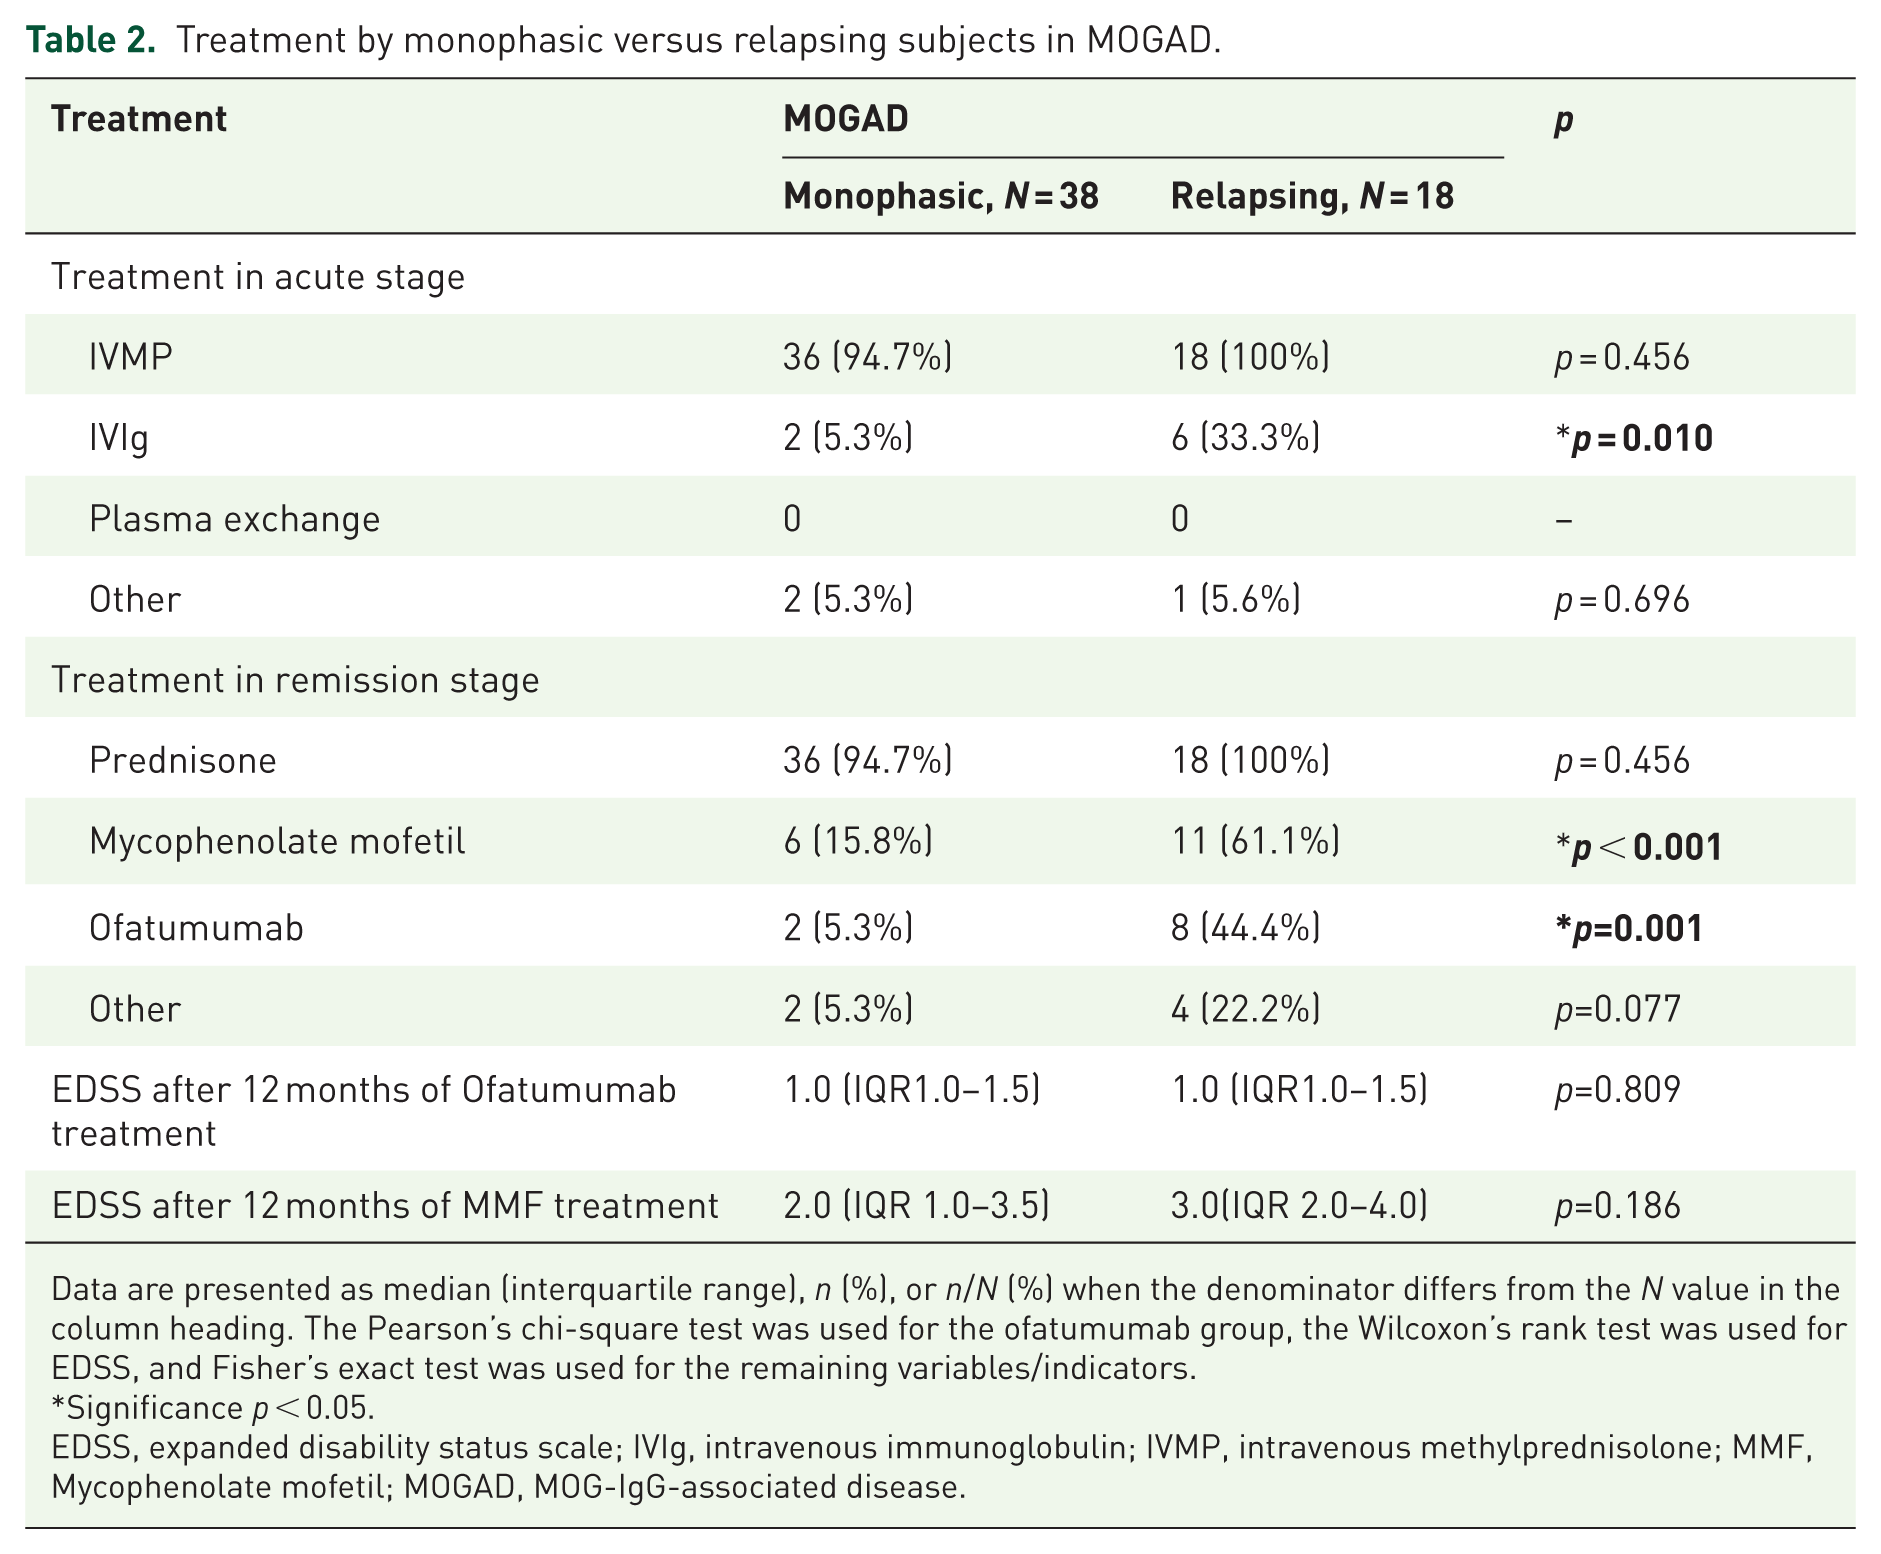
Data are presented as median (interquartile range), n (%), or n/N (%) when the denominator differs from the N value in the column heading. The Pearson’s chi-square test was used for the ofatumumab group, the Wilcoxon’s rank test was used for EDSS, and Fisher’s exact test was used for the remaining variables/indicators.
Significance p < 0.05.
EDSS, expanded disability status scale; IVIg, intravenous immunoglobulin; IVMP, intravenous methylprednisolone; MMF, Mycophenolate mofetil; MOGAD, MOG-IgG-associated disease.
Ten patients (4 children, 6 adults; mean age 26.4 ± 11.4 years) received ofatumumab treatment. After 12 months of treatment, no relapses occurred in this group. Both EDSS and mRS scores showed improvement compared to pretreatment levels (all p < 0.05, Table 3, Figure 3(a)). The median EDSS score after treatment was lower in the ofatumumab group (1.0; IQR, 1.0–1.5) than in the MMF group (2.0; IQR, 1.0–3.5; p = 0.010). Lesion burden on MRI decreased (p < 0.05), with 60% (6/10) showing complete resolution, 20% (2/10) showing shrinkage, and 20% (2/10) remaining stable (Figure 3(b)). CD19+ B-cell levels dropped below 1% in all tested patients at 6 months. A significantly higher proportion of patients in the ofatumumab group successfully discontinued glucocorticoids within 12 months compared to the conventional therapy group (5/10 (50%) vs. 9/46 (19.6%); p = 0.017; Figure 3(c)). No serious adverse events were reported in the ofatumumab group. Mild injection-site reactions occurred in two patients (20%), which resolved spontaneously. No infections or hematological abnormalities were observed during the 12-month follow-up and no treatment-related deaths were reported. The outcomes of ofatumumab treatment are summarized in Table 3.
Twelve-month outcomes of ofatumumab treatment in MOGAD patients.
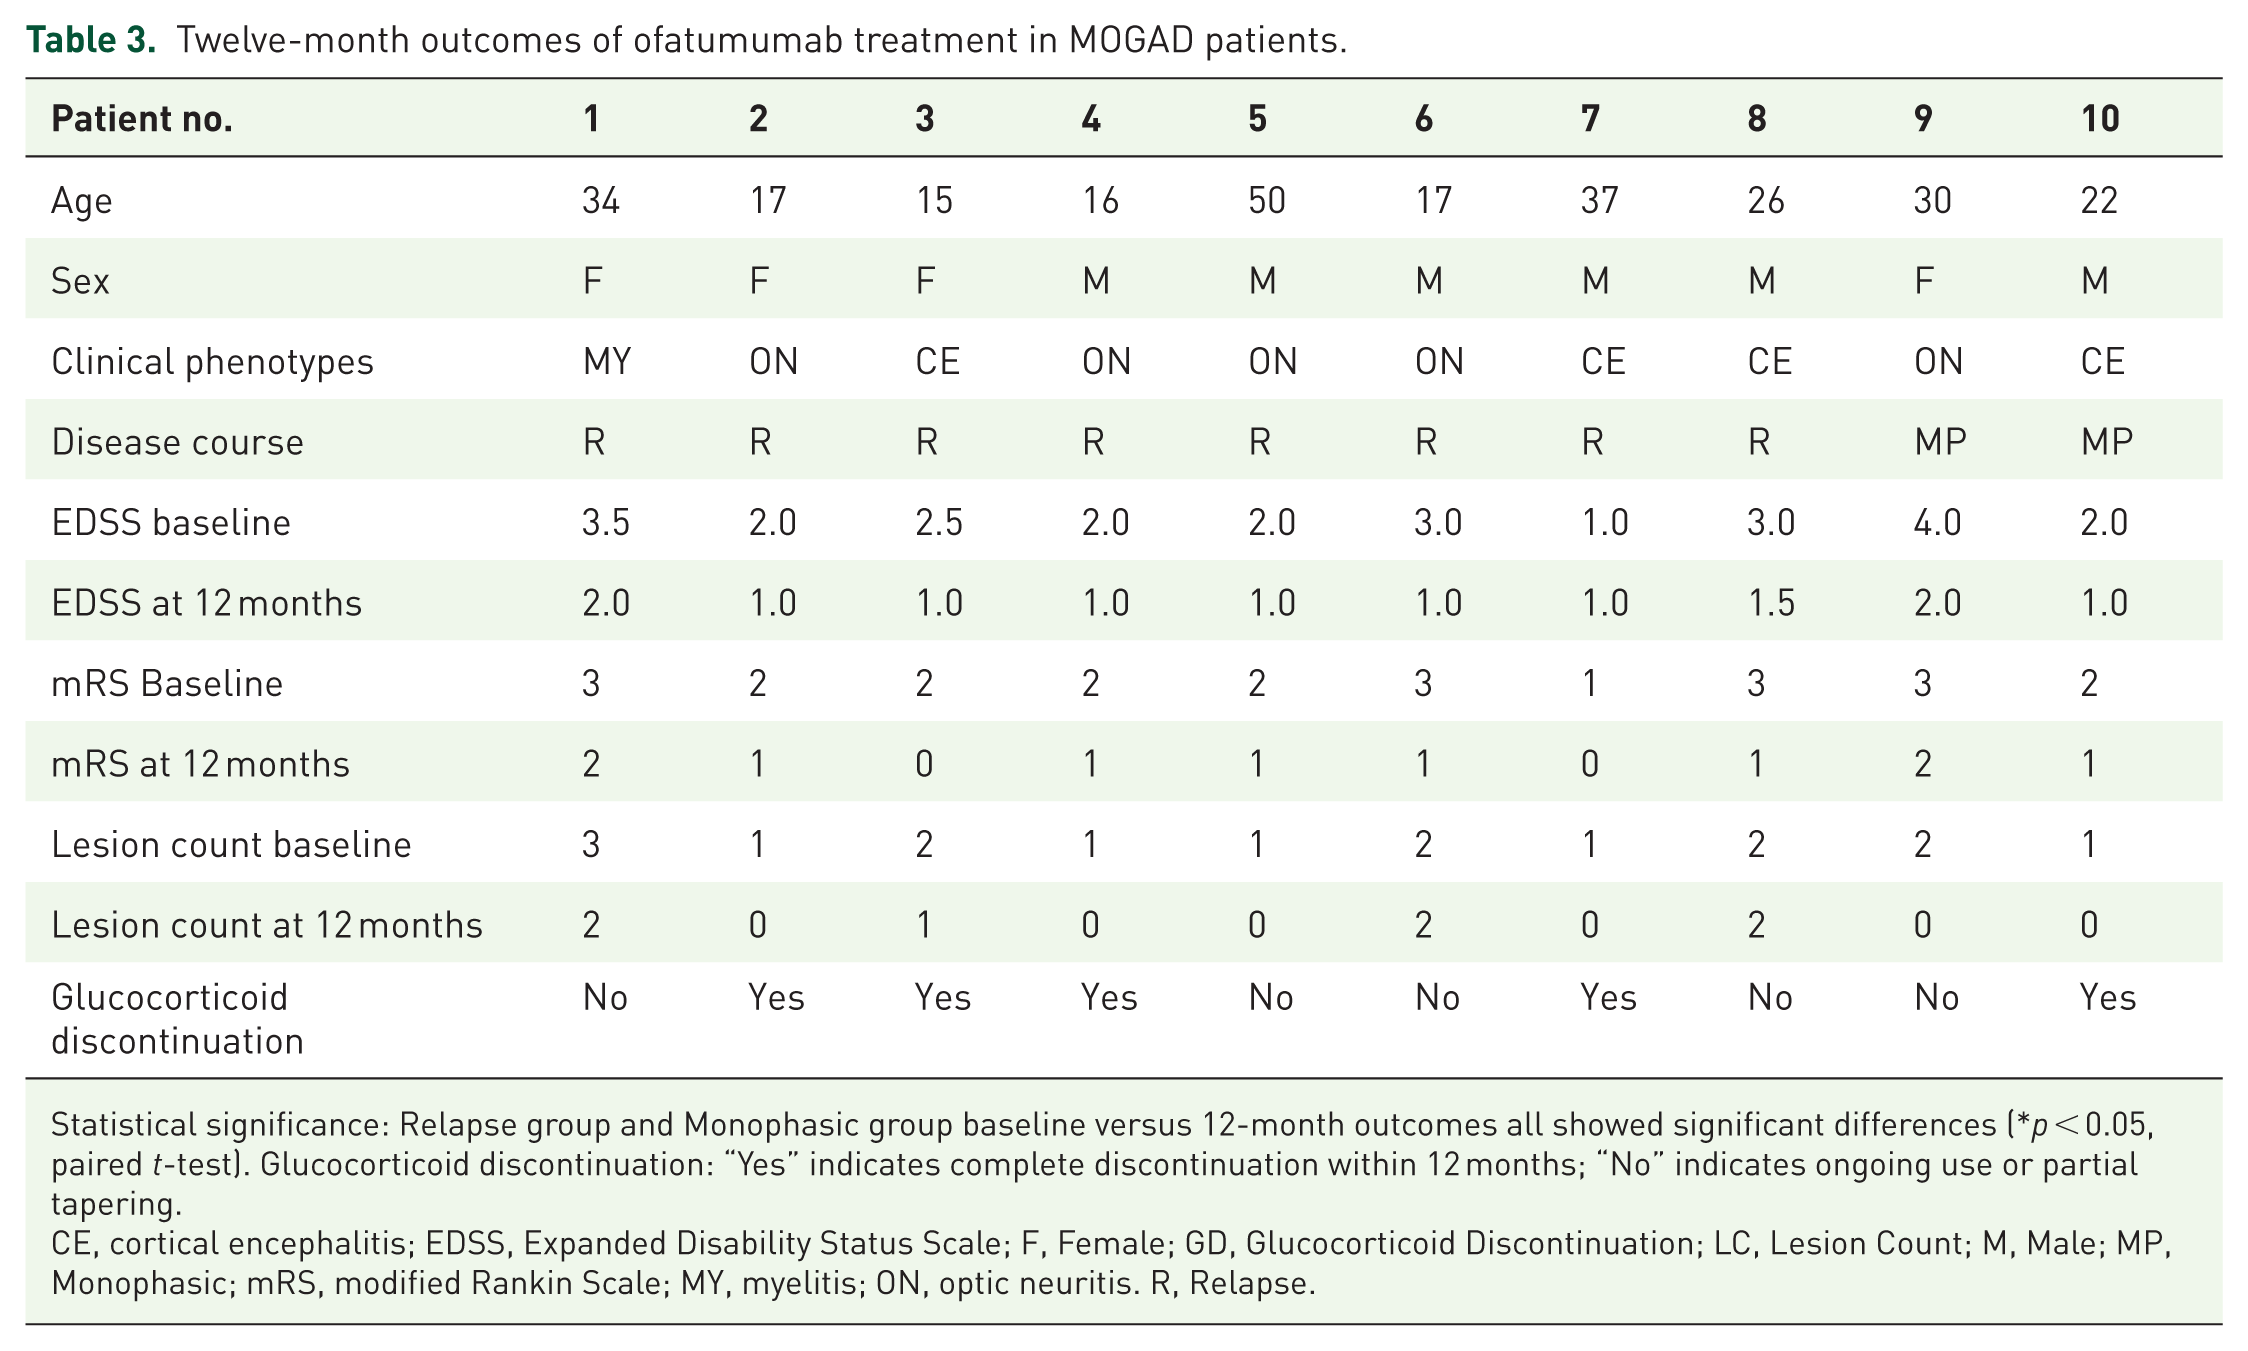
Statistical significance: Relapse group and Monophasic group baseline versus 12-month outcomes all showed significant differences (*p < 0.05, paired t-test). Glucocorticoid discontinuation: “Yes” indicates complete discontinuation within 12 months; “No” indicates ongoing use or partial tapering.
CE, cortical encephalitis; EDSS, Expanded Disability Status Scale; F, Female; GD, Glucocorticoid Discontinuation; LC, Lesion Count; M, Male; MP, Monophasic; mRS, modified Rankin Scale; MY, myelitis; ON, optic neuritis. R, Relapse.
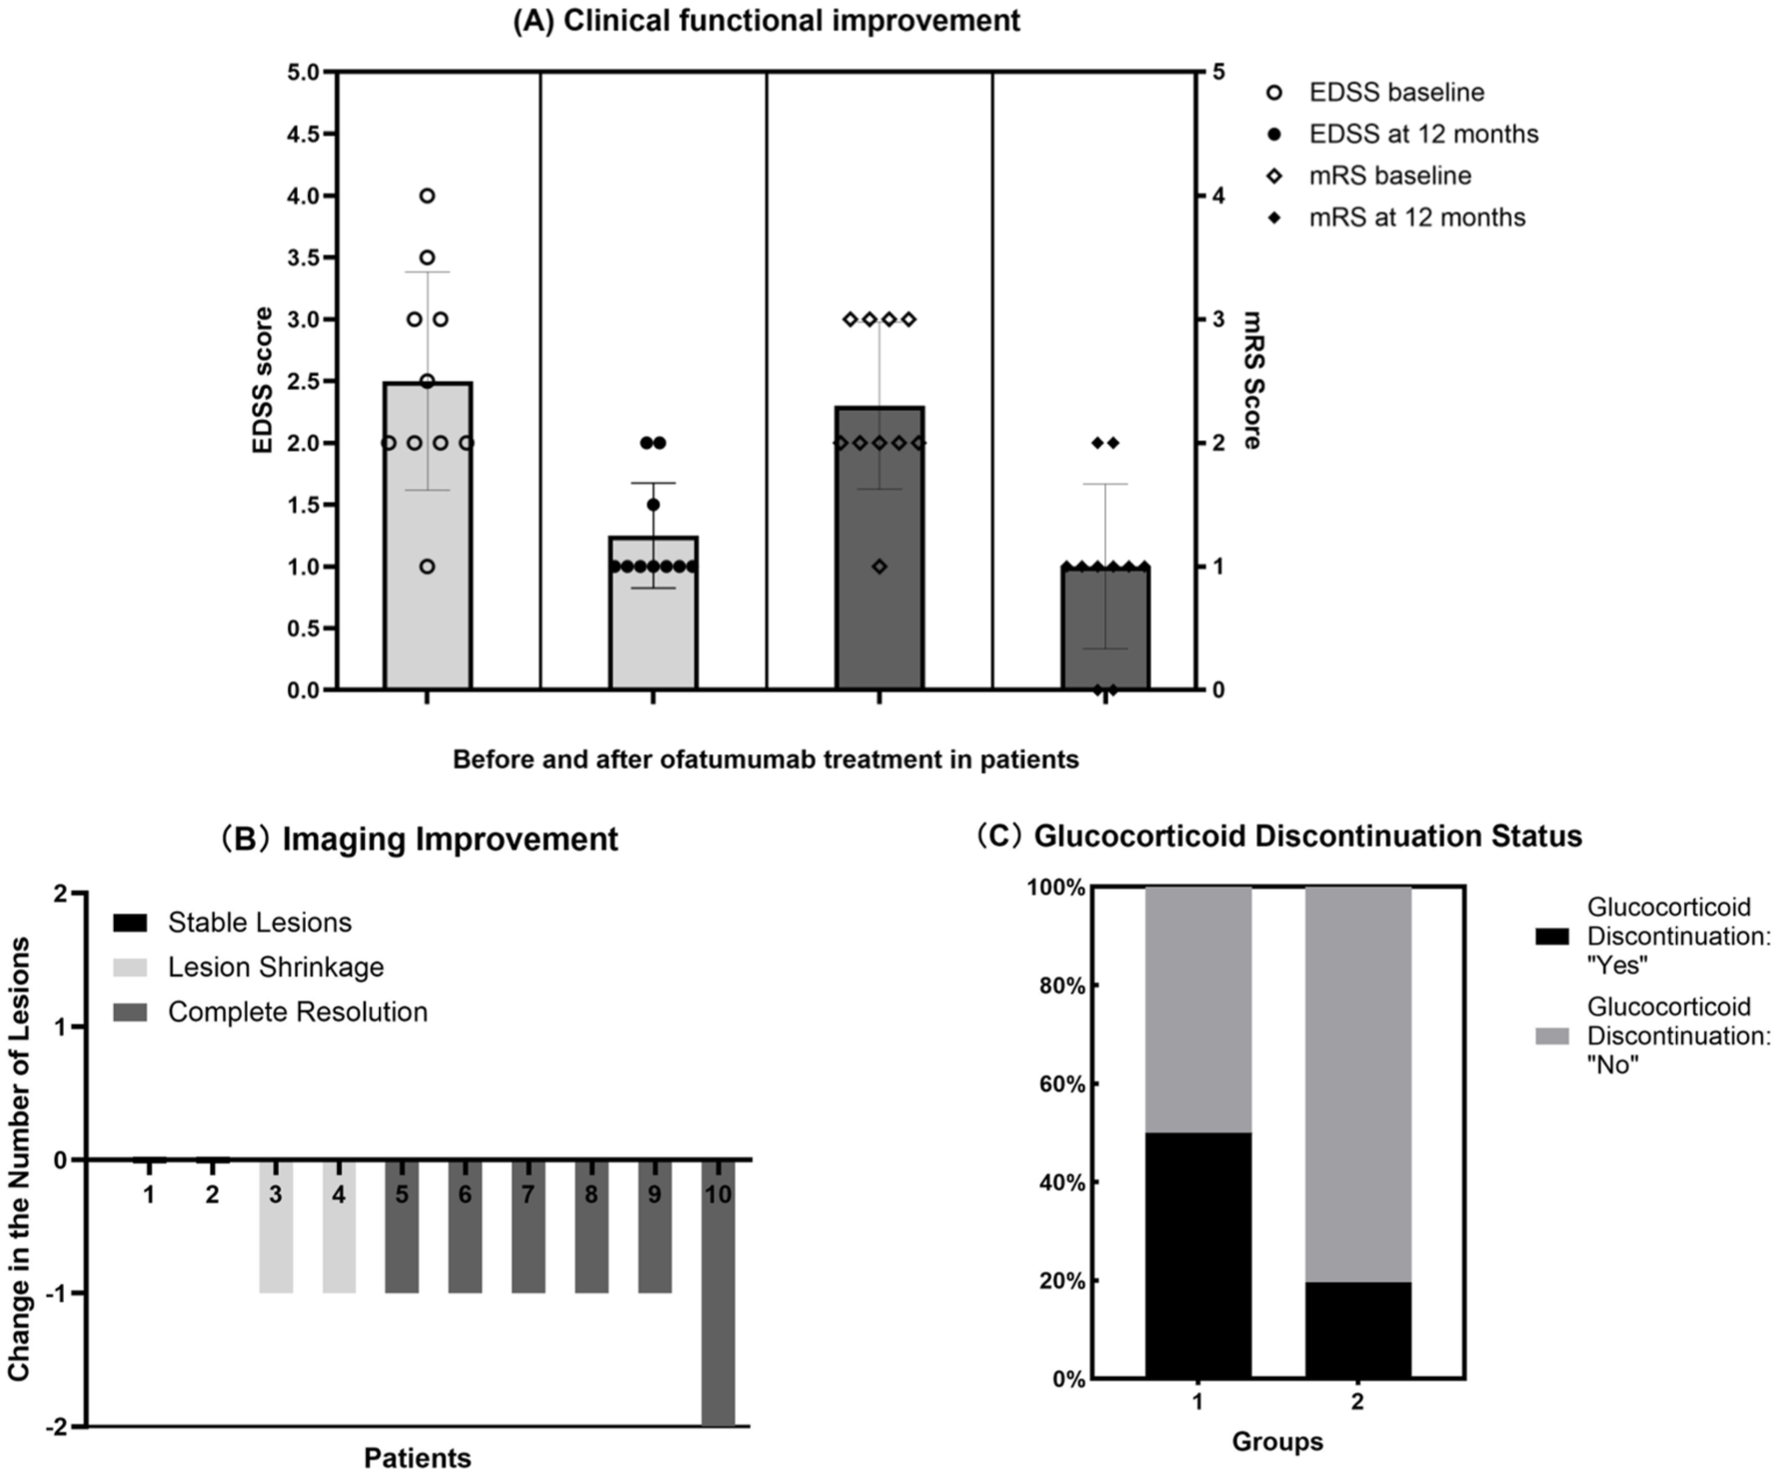
Assessment of treatment response to Ofatumumab. (a) Clinical functional improvement in patients before and after ofatumumab treatment. (b) Improvement in lesion burden on imaging following ofatumumab treatment. A change of −2 indicates a reduction of 2 lesions, and −1 indicates a reduction of 1 lesion. A value of 0 indicates no change in the number of lesions. Complete resolution is defined as the disappearance of all lesions; Lesion shrinkage refers to a reduction in the number or size of lesions without complete disappearance; Stable lesion indicates no change in lesions. (c) Comparison of glucocorticoid discontinuation rates between patients treated with ofatumumab (Group 1) and those receiving conventional therapy (Group 2) during the remission phase.
Discussion
This real-world study, comprising 56 MOGAD patients from Northern China, supports the applicability of the 2023 international diagnostic criteria in our local population while revealing a distinct clinico-radiological profile.1,24 The most striking finding of our study was the predominance of CE as the presenting phenotype (41.1%), which contrasts with the more commonly reported predominance of ON in global cohorts.1,25–28 Furthermore, we identified significant differences in prodromal infection rates and CSF inflammatory patterns across phenotypes. Most notably, we provide preliminary evidence for the clinical efficacy and steroid-sparing potential of ofatumumab in treating MOGAD, a novel application for this fully human anti-CD20 monoclonal antibody.17,29
In our cohort, the strikingly high proportion of CE (41.1%) not only distinguishes it from the global review by Trewin et al. 21 but also contrasts sharply with the 11.8% incidence reported in a Japanese study. 30 The high incidence of prodromal infections, particularly upper respiratory infections, among CE and MY phenotype patients in our cohort (52.2% and 55.6%, respectively, p = 0.037) may serve as a clue for immune phenotype stratification. Pathogens could trigger the disease through the mechanism of “Molecular Mimicry,” 31 with one possibility being that specific pathogen antigens share similarities with epitopes on the MOG protein located on the surface of the cerebral cortex or oligodendrocytes, leading to cross-reactive immune responses. 32 Another possibility is that infections act as nonspecific immune adjuvants, disrupting peripheral immune tolerance and activating autoreactive B cells and T cells targeting the central nervous system (CNS). 33 This association between infections and specific CNS targets (cortex or spinal cord) provides clinical support for the existence of “anatomical tropism” in the immune attack observed in MOGAD. MOG antibodies themselves may possess direct pathogenicity, and recent studies suggest that specific subtypes or epitope-specific MOG antibodies might exhibit higher affinity for the myelin in superficial cortical regions, particularly within sulci. 34 An alternative hypothesis is that the inherent properties of the blood–brain barrier in cortical regions make it more vulnerable to attacks by antibodies and inflammatory cells, due to factors such as higher permeability or a unique immune surveillance environment.35,36 Our cohort may be enriched with patients who produce MOG antibodies with “cortical tropism.” This not only explains the high incidence of CE but also provides a pathophysiological basis for why some patients present with focal cortical symptoms such as headache and epilepsy, rather than typical signs of ON or myelitis.34,37,38 The high prevalence of the CE phenotype in the northern Chinese population may result from the combined effects of genetic background, environmental exposures, and local infection profiles. Specific human leukocyte antigen (HLA) haplotypes might be associated with susceptibility to the CE phenotype in this regional population and influence the type of immune response to both infections and MOG antigens. 39 Additionally, specific pathogens prevalent in the region (such as certain viral or bacterial strains) may be more likely to trigger the mentioned cross-reactive immune responses targeting the cortex. 40 Climate, diet, and other environmental factors could also indirectly affect systemic immune status by modulating the gut microbiota. 41 According to the 2023 International MOGAD Diagnostic Criteria (1), the diagnosis of CE is primarily based on characteristic MRI findings (i.e., T2/FLAIR hyperintensity involving the cerebral cortex/sulci, often with leptomeningeal enhancement) and does not require the presence of encephalopathy or seizures. These criteria allow for a broad spectrum of clinical presentations, ranging from asymptomatic or mild (e.g., isolated headache, subtle cognitive changes) to severe (e.g., seizures, altered mental status). In our cohort, the high CE rate (41.1%) reflects radiological predominance rather than severe clinical encephalitis. The most common symptom among CE patients was headache (present in over 60% of CE cases), which is a recognized but nonspecific manifestation. Frank encephalopathy or recurrent seizures were present in a subset but not in the majority. Cortical lesions can be clinically “silent” or manifest only with mild symptoms.14,38 Therefore, our findings suggest that in northern China, MOGAD should be considered a primary differential diagnosis for patients presenting with acute or subacute encephalitic syndromes characterized by headache, epilepsy, altered consciousness, or behavioral changes, regardless of the presence of typical optic nerve or spinal cord involvement.42,43
In our study, we analyzed the correlation between CSF parameters and clinical phenotypes. Beyond serving as simple diagnostic markers for inflammatory responses, CSF indicators hold promise for playing a significant role in distinguishing clinical phenotypes and aiding in differential diagnosis. The significantly higher rates of pleocytosis (90.9%, p < 0.05) and protein elevation (63.6%, p < 0.05) in the CE phenotype compared to ON/NMO phenotypes suggest that CSF inflammation intensity may serve as a “phenotypic fingerprint,” potentially reflecting the magnitude of intrathecal immune activation in cortical disease. 44 This finding adds nuance to previous reports which emphasized CSF abnormalities primarily in MOGAD-associated myelitis.44–46 Radiologically, the observation that 3.6% of symptomatic patients had no acute MRI lesions reinforces the known characteristic that imaging findings can lag behind clinical symptoms in MOGAD, a crucial point for differential diagnosis against MS and NMOSD.14,38 The predominance of a limited lesion burden (1–3 lesions in 94.4% of patients) further aids in distinguishing it from the more disseminated pattern often seen in MS. 38
In treatment, our data provide some of the first real-world evidence for the use of ofatumumab in MOGAD.29,47 In 10 treated patients, relapse prevention was achieved over 12 months, alongside improvements in EDSS and mRS scores (all p < 0.05) and a reduction in MRI lesion burden. The efficacy is likely attributable to the potent and sustained peripheral B-cell depletion (<1% CD19+ by month 6) achieved by this fully human anti-CD20 antibody, which is central to interrupting the humoral autoimmune pathogenesis of MOGAD.17,48,49 Crucially, ofatumumab demonstrated a significant steroid-sparing effect, enabling 50% of patients to discontinue glucocorticoids within 12 months, a rate significantly higher than in the conventional therapy groups, such as those receiving glucocorticoids combined with MMF, glucocorticoids alone (19.6%, p = 0.017). The steroid-sparing effect of ofatumumab is likely rooted in its sustained and profound B-cell depletion, which disrupts the central loop of autoantibody production and antigen presentation in MOGAD. By selectively targeting CD20+ B cells, ofatumumab reduces the need for broad immunosuppression with glucocorticoids, thereby mitigating long-term metabolic, cardiovascular, and bone-related toxicity. This targeted approach aligns with the growing paradigm of precision immunology in neuroinflammatory diseases.13,15
In our cohort, we initiated ofatumumab treatment in a subset of eligible patients, primarily based on the following comprehensive considerations: First, compared to RTX, a chimeric anti-CD20 antibody, ofatumumab is a fully human monoclonal antibody. This design confers lower immunogenicity, potentially reducing the risk of neutralizing antidrug antibodies and infusion-related reactions, thereby allowing for more consistent and sustained B-cell depletion, a critical factor for long-term relapse prevention.17,48 Second, while MMF is widely used, its mechanism is broad and nonspecific. Ofatumumab offers a more targeted approach by precisely depleting CD20+ B cells, the central drivers of autoantibody production in MOGAD. While current management often relies on conventional immunosuppressants like MMF, which showed a 29.4% relapse rate in our cohort. 50 While diseases such as MS and AQP4 antibody-positive NMOSD now have approved disease-modifying therapies for relapse prevention, no medication is currently specifically approved for this indication in MOGAD. This unmet need is particularly critical given that a significant proportion of MOGAD patients experiences a relapsing course and accumulate disability, severely impacting their quality of life. To date, there remains no approved medication specifically indicated for relapse prevention during the remission phase of MOGAD, rendering it a condition with a critical therapeutic void. Clinically, our findings suggest that MOGAD should be considered in the differential diagnosis of encephalitic syndromes in Northern Chinese patients, even in the absence of typical opticospinal involvement. Moreover, the efficacy and steroid-sparing potential of ofatumumab position it as a viable therapeutic option for relapsing or steroid-dependent MOGAD.29,17,48,49
Limitations
This study has several limitations. First, its retrospective and single-center design may introduce selection bias and limits causal inference, the real-world, hospital-based screening may lead to a lower positive predictive value compared to a case–control study. Second, the sample size of the ofatumumab subgroup is small (n = 10), though statistically significant outcomes were observed. Third, the follow-up duration for ofatumumab treatment is relatively short (12 months), precluding assessment of long-term efficacy and safety, and the observed improvement in EDSS and MRI lesions in the ofatumumab group may partly reflect the known favorable natural history of MOGAD or the effect of concomitant acute therapies, rather than B-cell depletion per se. A controlled trial is necessary to establish true efficacy. Future directions should include prospective, multicenter, randomized controlled trials with longer follow-up to validate our findings. Mechanistic studies investigating regional phenotypic variations, MOG antibody epitope specificity, and biomarkers of treatment response are also warranted to personalize therapy in MOGAD.21,50 Concurrently, mechanistic studies are warranted to elucidate the reasons behind the regional phenotypic variation we observed, particularly the high prevalence of CE.2,30
Conclusion
This study delineates a unique clinical-radiological signature of MOGAD in a Northern Chinese cohort, characterized by a high frequency of CE and phenotype-specific CSF inflammation patterns. 24 Beyond phenotypic characterization, we present preliminary evidence that ofatumumab may effectively facilitate glucocorticoid withdrawal in patients with MOGAD.29,48 These findings advance the clinical understanding of MOGAD heterogeneity, suggesting a potential choice for relapse prevention and steroid avoidance using ofatumumab, with final conclusions pending larger, controlled studies for the management of this challenging rare neuroinflammatory condition.2,13
Supplemental Material
sj-docx-1-tan-10.1177_17562864261458528 – Supplemental material for Clinical, imaging, and immunotherapeutic features in MOGAD: a retrospective real-world cohort in Northern China
Supplemental material, sj-docx-1-tan-10.1177_17562864261458528 for Clinical, imaging, and immunotherapeutic features in MOGAD: a retrospective real-world cohort in Northern China by Xuetao Cao, Danqing Qin, Chunjuan Wang, Baojie Wang, Yuxiu Xiao, Xujun Chu and Shougang Guo in Therapeutic Advances in Neurological Disorders
Footnotes
References
Supplementary Material
Please find the following supplemental material available below.
For Open Access articles published under a Creative Commons License, all supplemental material carries the same license as the article it is associated with.
For non-Open Access articles published, all supplemental material carries a non-exclusive license, and permission requests for re-use of supplemental material or any part of supplemental material shall be sent directly to the copyright owner as specified in the copyright notice associated with the article.