
Abstract
Background:
Seasonal influenza (SI) is an acute respiratory illness that exerts a severe impact on human life year-round. Yet, very few studies have been conducted to investigate its peak timing for different age groups.
Objective:
To evaluate the average peak calendar time and intensity for the incidence of SI for different age groups.
Methods:
The study uses laboratory-confirmed Influenza data from the Centers for Disease Control and Prevention (CDC) of the USA with age groups 2, 11, 34, 57 and 65 years during 2009–2018 for the analysis. A non-parametric method of estimation of a circular probability distribution called likelihood cross-validation method has been utilised.
Results:
The average peak date of incidence for age groups 2 and 11 is around the last week of December. However, the date shifts to the last week of January to the first week of February for other groups. Age groups 65 and 2 years experienced the most severe impact among all.
Discussion:
The average peak time for SI incidence is between the last week of December to January with a single peak time for every age group. However, the incidence seems to develop an additional moderate peak time for age group 65.
Background
Seasonal influenza (SI), a contagious respiratory illness, can cause severe illness or death which spreads in humans and is the annual cause for the seasonal flu epidemic (Bhat et al., 2005; Centers for Disease Control and Prevention, 2009; Cox et al., 2011; Finelli et al., 2008; Rolfes et al., 2018; Roush et al., 2007; Shang et al., 2017, 2018; Wong et al., 2013) that claims lives, in particular, the lives of children and the elderly. Due to the omnipresence of seasonal flu in the world and its impact on every age group and gender of human beings (Dalziel et al., 2018; Fell et al., 2017; World Health Organization, 2016), there has been growing interest in understanding SI in the public health community (Antonova et al., 2014; Glezen, 1996; Zimmer et al., 2010). Various studies have been conducted to better understand its nature, impact and its mechanisms in order to estimate, predict, prevent and control the incidence because it presents a considerable public health burden.
Estimates of influenza incidence have been categorised by age groups, both individually as well as a whole (Karageorgopoulos et al., 2011; Tokars et al., 2018). There have been differences in ages of infections which have a remarkable correspondence between an influenza incidence and the global circulation pattern of climate and human viruses (Bedford et al., 2015).
Despite various efforts to understand SI, there is an insufficient amount of research from which to provide sufficient knowledge about the timing and intensity of its occurrence for different age groups. Having prior knowledge of occurrence and intensity of SI in different age groups can establish a base for and an opportunity to adequately address the issue and help to mitigate the influenza problem and thereby lessen the possibility of a catastrophe in the future. For these objectives, the author has implemented a non-parametric circular density estimation methodology called likelihood cross-validation (LCV) to investigate these issues. The author is unaware of the utilisation of this method to have been previously implemented to investigate the incidence and intensity of influenza. The methodology of LCV can assist in establishing a preventive measure as well as assist in preparation for a possible anomalous condition of influenza.
The following are research questions we attempt to and address in the study.
- Is there a difference in rate of incidence of influenza by age groups?
- What are the mean dates of annual peak timing of SI?
- What are the intensities of SI by age groups?
The remainder of this paper is organised as follows: discussion of data and methodology for analysis; results; and the conclusion of our findings. Statistical analysis and computation have been performed for this paper on the ‘R’ statistical computing platform (Agostinelli, 2017).
Methods
Data
The source data for influenza hospitalisations application originates from two influenza surveillance networks: the Emerging Infections Program (EIP) and the Influenza Hospitalization Surveillance Network (FluSurv-NET) of the Centers for Disease Control and Prevention (CDC), flu view weekly report from 2009 to 2018. The EIP programme conducts population-based surveillance for laboratory-confirmed SI-associated hospitalisations. The data covers the American states of California (CA), Colorado (CO), Connecticut (CT), Georgia (GA), Maryland (MD), Minnesota (MN), New Mexico (NM), New York (NY), Oregon (OR), Tennessee (TN), Michigan (MI), Ohio (OH) and Utah (UT). Data include weekly incidence of SI with the five age groups, 0–4 years, 5–17 years, 18–49 years, 50–64 years and 65+ years, which are represented by age groups 2, 11, 34, 57 and 65 years, respectively, hereafter.
Figure 1 shows that there are numerous variabilities in the incidence of SI which varies throughout the years but with relatively nominal incidence from the 18th week (first week of May) through the 32nd week (second week of August) of the year. The figure has been constructed to represent massive data; hence, the readers should be aware that the different scaling for y axis can be considered. The incidence appears to vary greatly by weeks and the incidence further differs by groups. The intensity of incidence appears to reach its peak, which is at weeks 41–43 (second to the fourth weeks of October) of the year for the majority of the age categories. However, the intensity of incidence reaches its peak at around the last week of the year for age group 65. This category receives the highest intensity of incidence among all categories: more than eight incidences in age group 57, whereas there were less than four incidences in age group 11. Variability in incidence among ages was also clearly visible in the dataset.
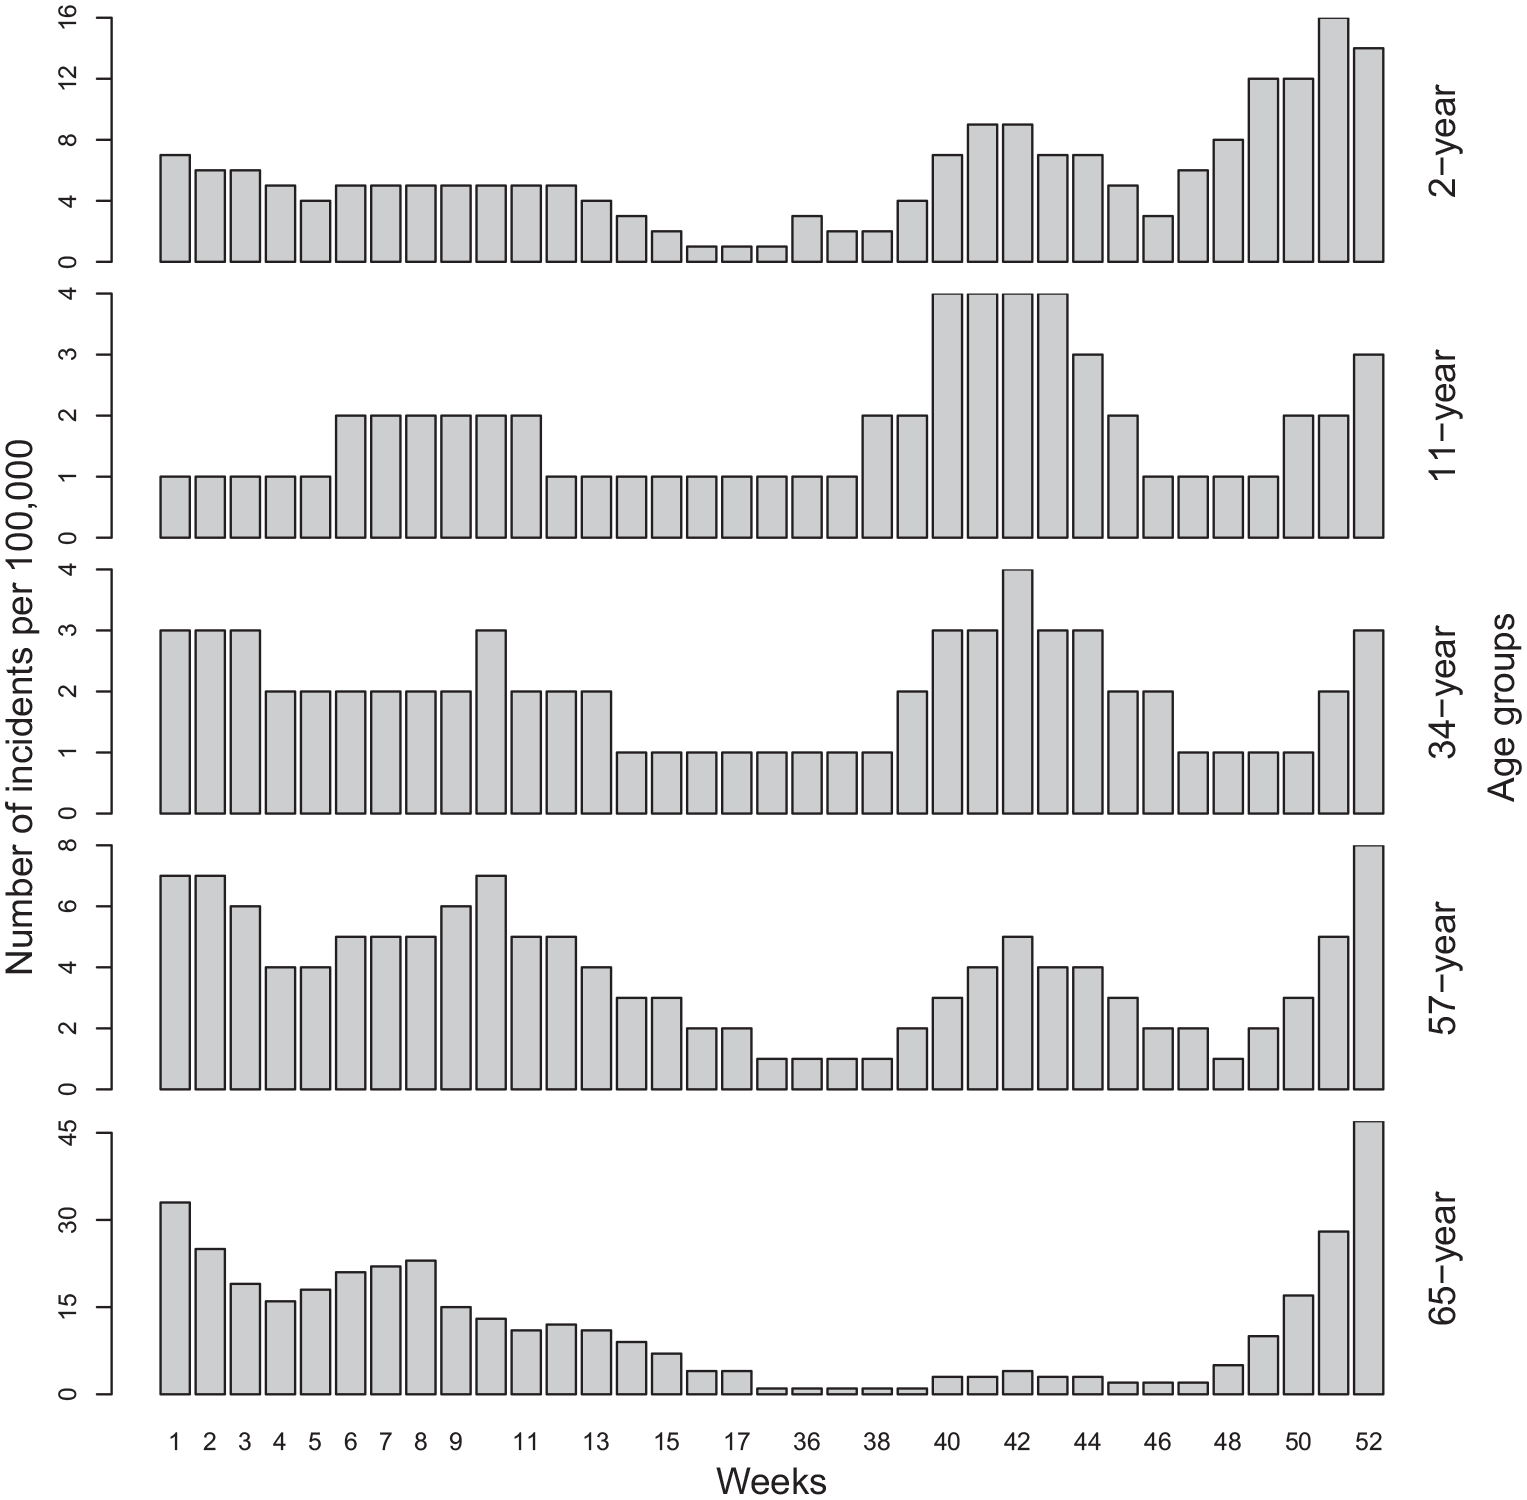
Histogram showing the rate of incidence per 100,000 by age categories during the period 2009–2018.
Descriptive circular statistics
Let x and y be the cartesian coordinates of a date of an incident of SI in a year on a unit circle and the mean date of the incidents is given by
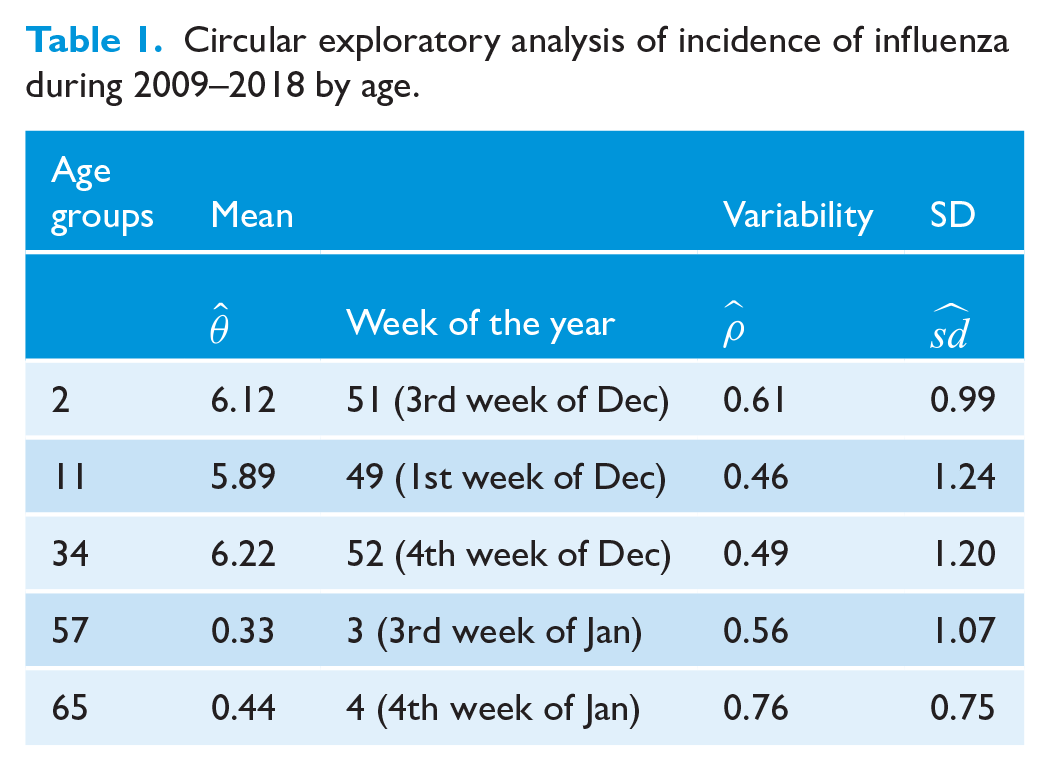
Circular exploratory analysis of incidence of influenza during 2009–2018 by age.
Circular density approach
A circular statistical approach considers the calendar time of incidence within a year as a polar coordinate of a unit circle whose center is the origin. The angular position of date of occurrence (W) of a SI event ‘i’ is defined by
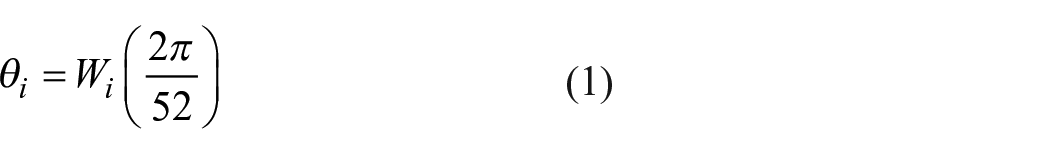
where
Circular kernel density estimation
Given a random sample of angles
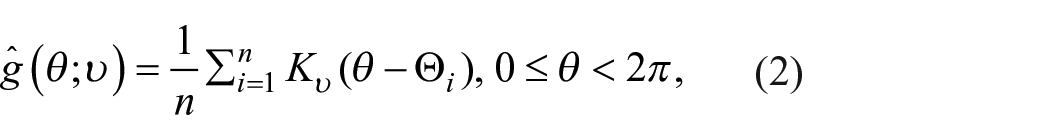
where
where
Bandwidth selection and goodness of fit
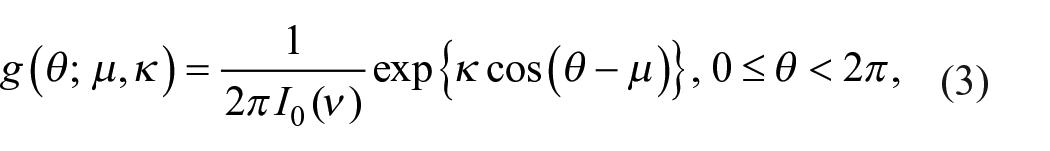
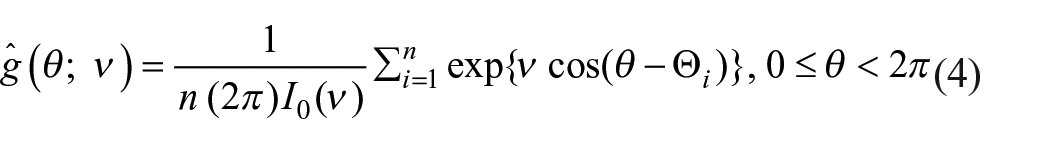
Many methods of selecting optimal bandwidth in circular density estimation have been proposed in the literature (Hall et al., 1987; Oliveira et al., 2012; Taylor, 2008). The bandwidth, in general, is selected to minimise some error criterion, for example, the mean integrated squared error. The LCV method has been considered to estimate the bandwidth in our study. LCV selects the bandwidth that maximises the LCV function (Dhakal et al., 2015; Oliveira et al., 2013) and the method can estimate optimal bandwidth for multimodal distributions. To minimise the error of estimate, the bootstrapping method has been adapted. Each time, 200 observations were resampled 1000 times with replacement and bandwidth using LCV was estimated. Finally, the median of these estimates is taken as the optimal bandwidth for the study. A routinely used P-P (probability–probability) plot is used to investigate the goodness of fit of a posited distribution (Figure 2). Upon a closer look, P-P plots appear to be a reasonable fit to the data for every age group.
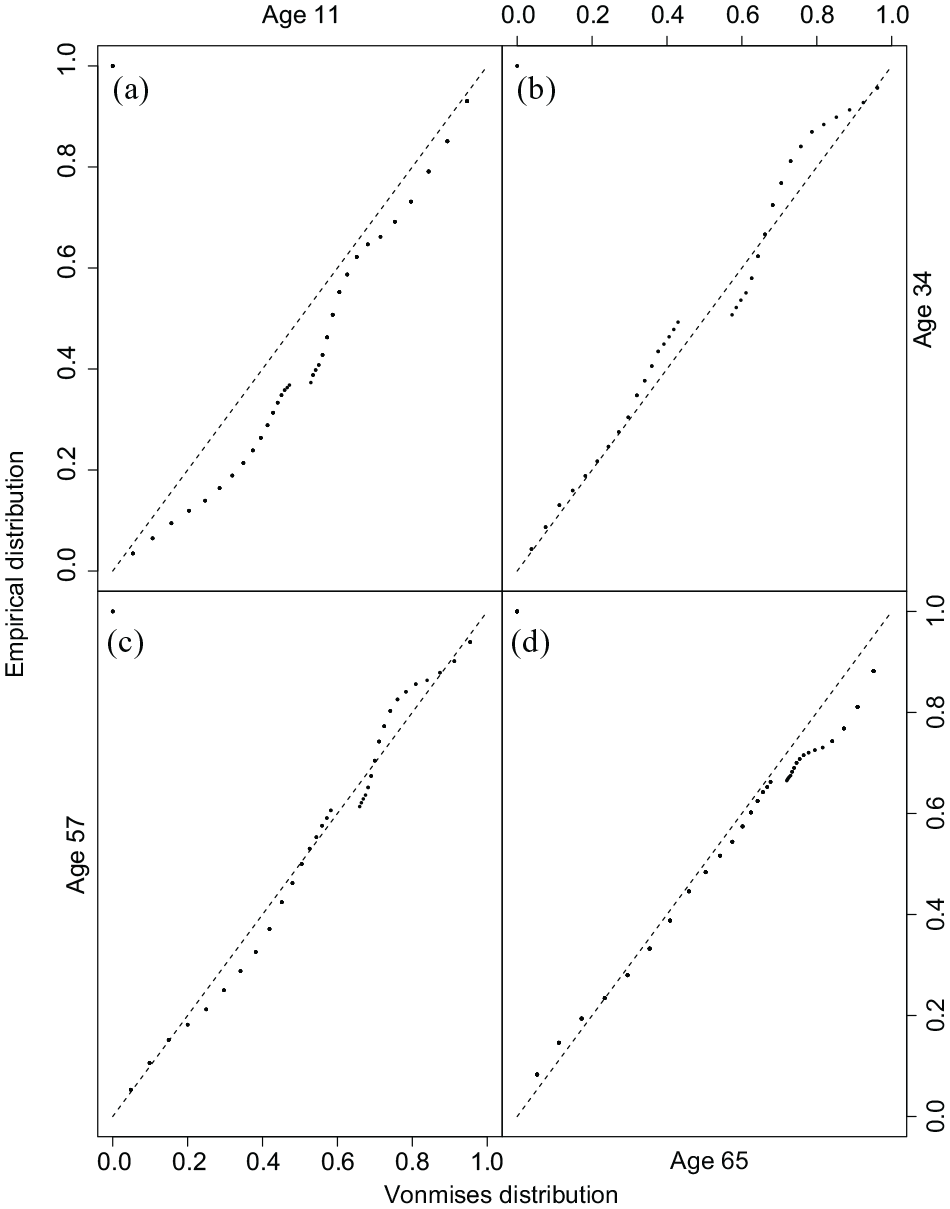
P-P (probability–probability) plot for age groups. a–d P-P plots of age groups 11 (a), 34 (b), 57 (c) and 65 (d).
Results
Statistical tests of incidence of SI
In an attempt to investigate the nature of the distribution of SI incidence, four well-defined circular statistical non-parametric tests (Jammalamadaka and SenGupta, 2001; Mardia and Jupp, 2000; Rao, 1972) have been utilised (Table 2) under the uniform null distribution. We were able to reject the null hypothesis for age groups, which was a clear indication of a departure of the distributions from uniformity. An alternative hypothesis for the tests is the unimodal distribution with some mean direction and some resultant mean length. The reason for utilising the unimodal distribution is to underline the assumption that the Rayleigh test is strong enough to detect the unimodal of the distribution. However, the Rayleigh test is not effective in identifying multimodal distributions. Alternatively, Kuiper, Rao Spacing and Watson tests are capable of identifying multimodal distributions. Although these tests are capable of identifying the multimodality of distribution, they are not able to quantify the actual distribution of data. Therefore, the non-parametric Circular kernel density estimation approach, with a well-defined systematic bandwidth selection method, has been implemented to quantify the intensity of distribution.
Showing test statistics from four different tests by age groups.
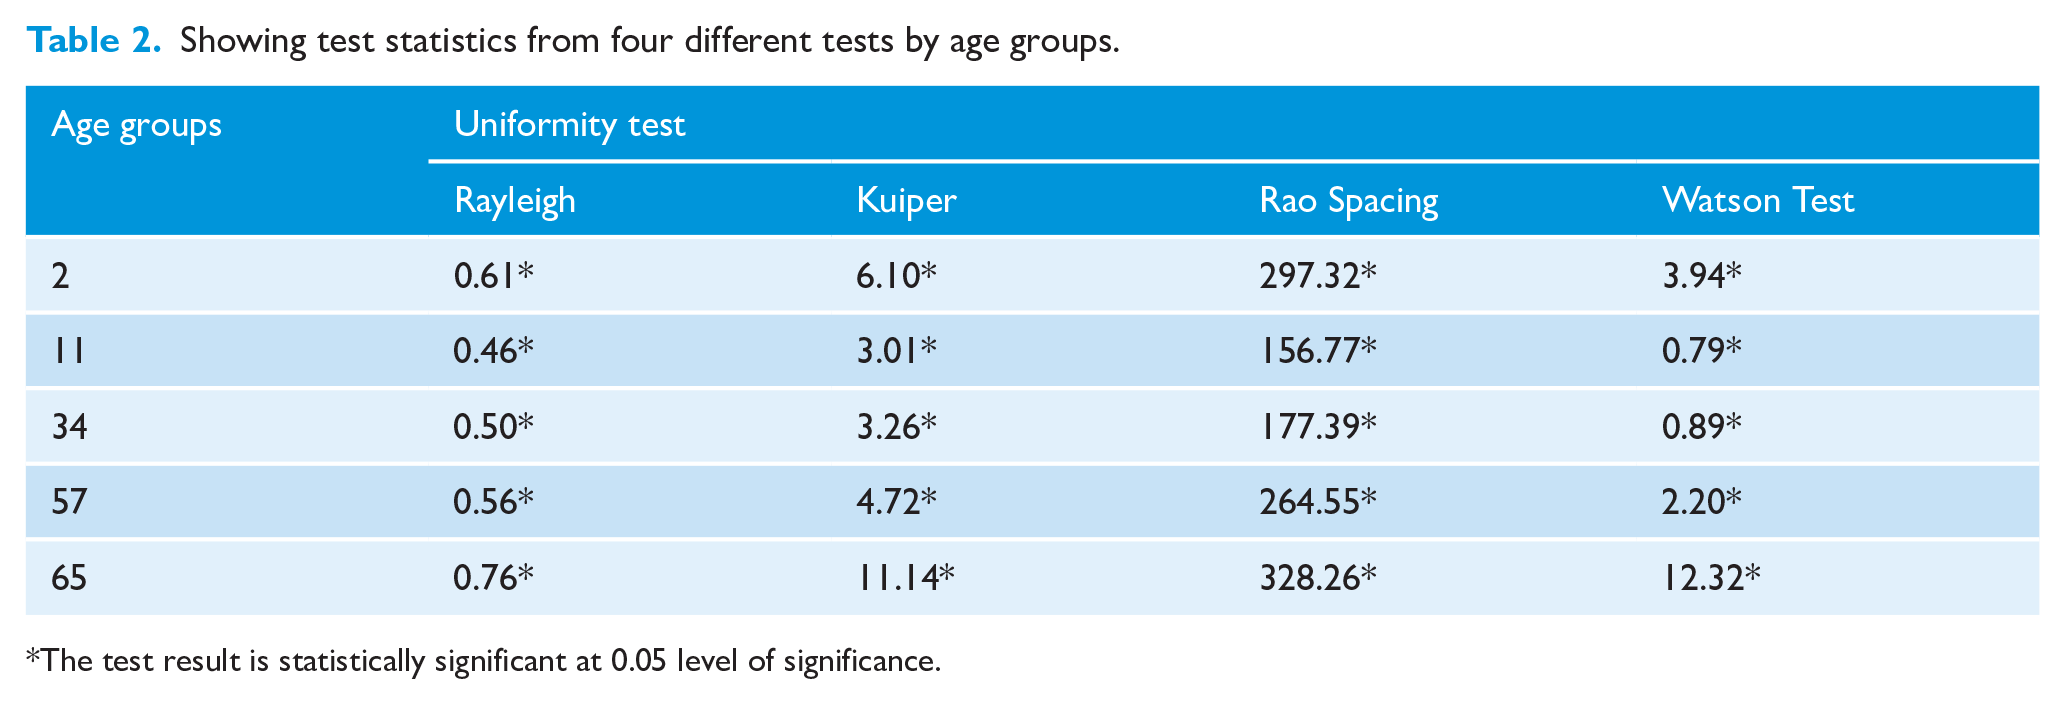
The test result is statistically significant at 0.05 level of significance.
Variability in incidence by age group
The first and third rows of Figure 3 represent the estimated kernel circular probability densities with different age groups (first row = 2 (a), 11 (b) and 34 (c), third row = 57 (g) and 65 (h)), while the second row (d-f), third row (3(i)), and fourth row represent their corresponding resultant vectors with rose diagrams. The black dashed line outside the circle of the first and third rows resemble the estimated kernel circular probability density for the age group from the LCV method for SI incidence during the time frame of 2009–2018. The black points of the circle represent the raw data. In the second and fourth rows, the grey wedge at the center of the circle depicts a rose diagram that represents the relative frequencies of incidences as an area of each sector. It further depicts circular plots, displaying the direction of each incidence of SI with an arrow. The solid black arrow of the circle depicts the mean direction and resultant length—two crucial characteristics of incidence of SI. The two explain the time of the year at which SI is likely to occur and its intensity.
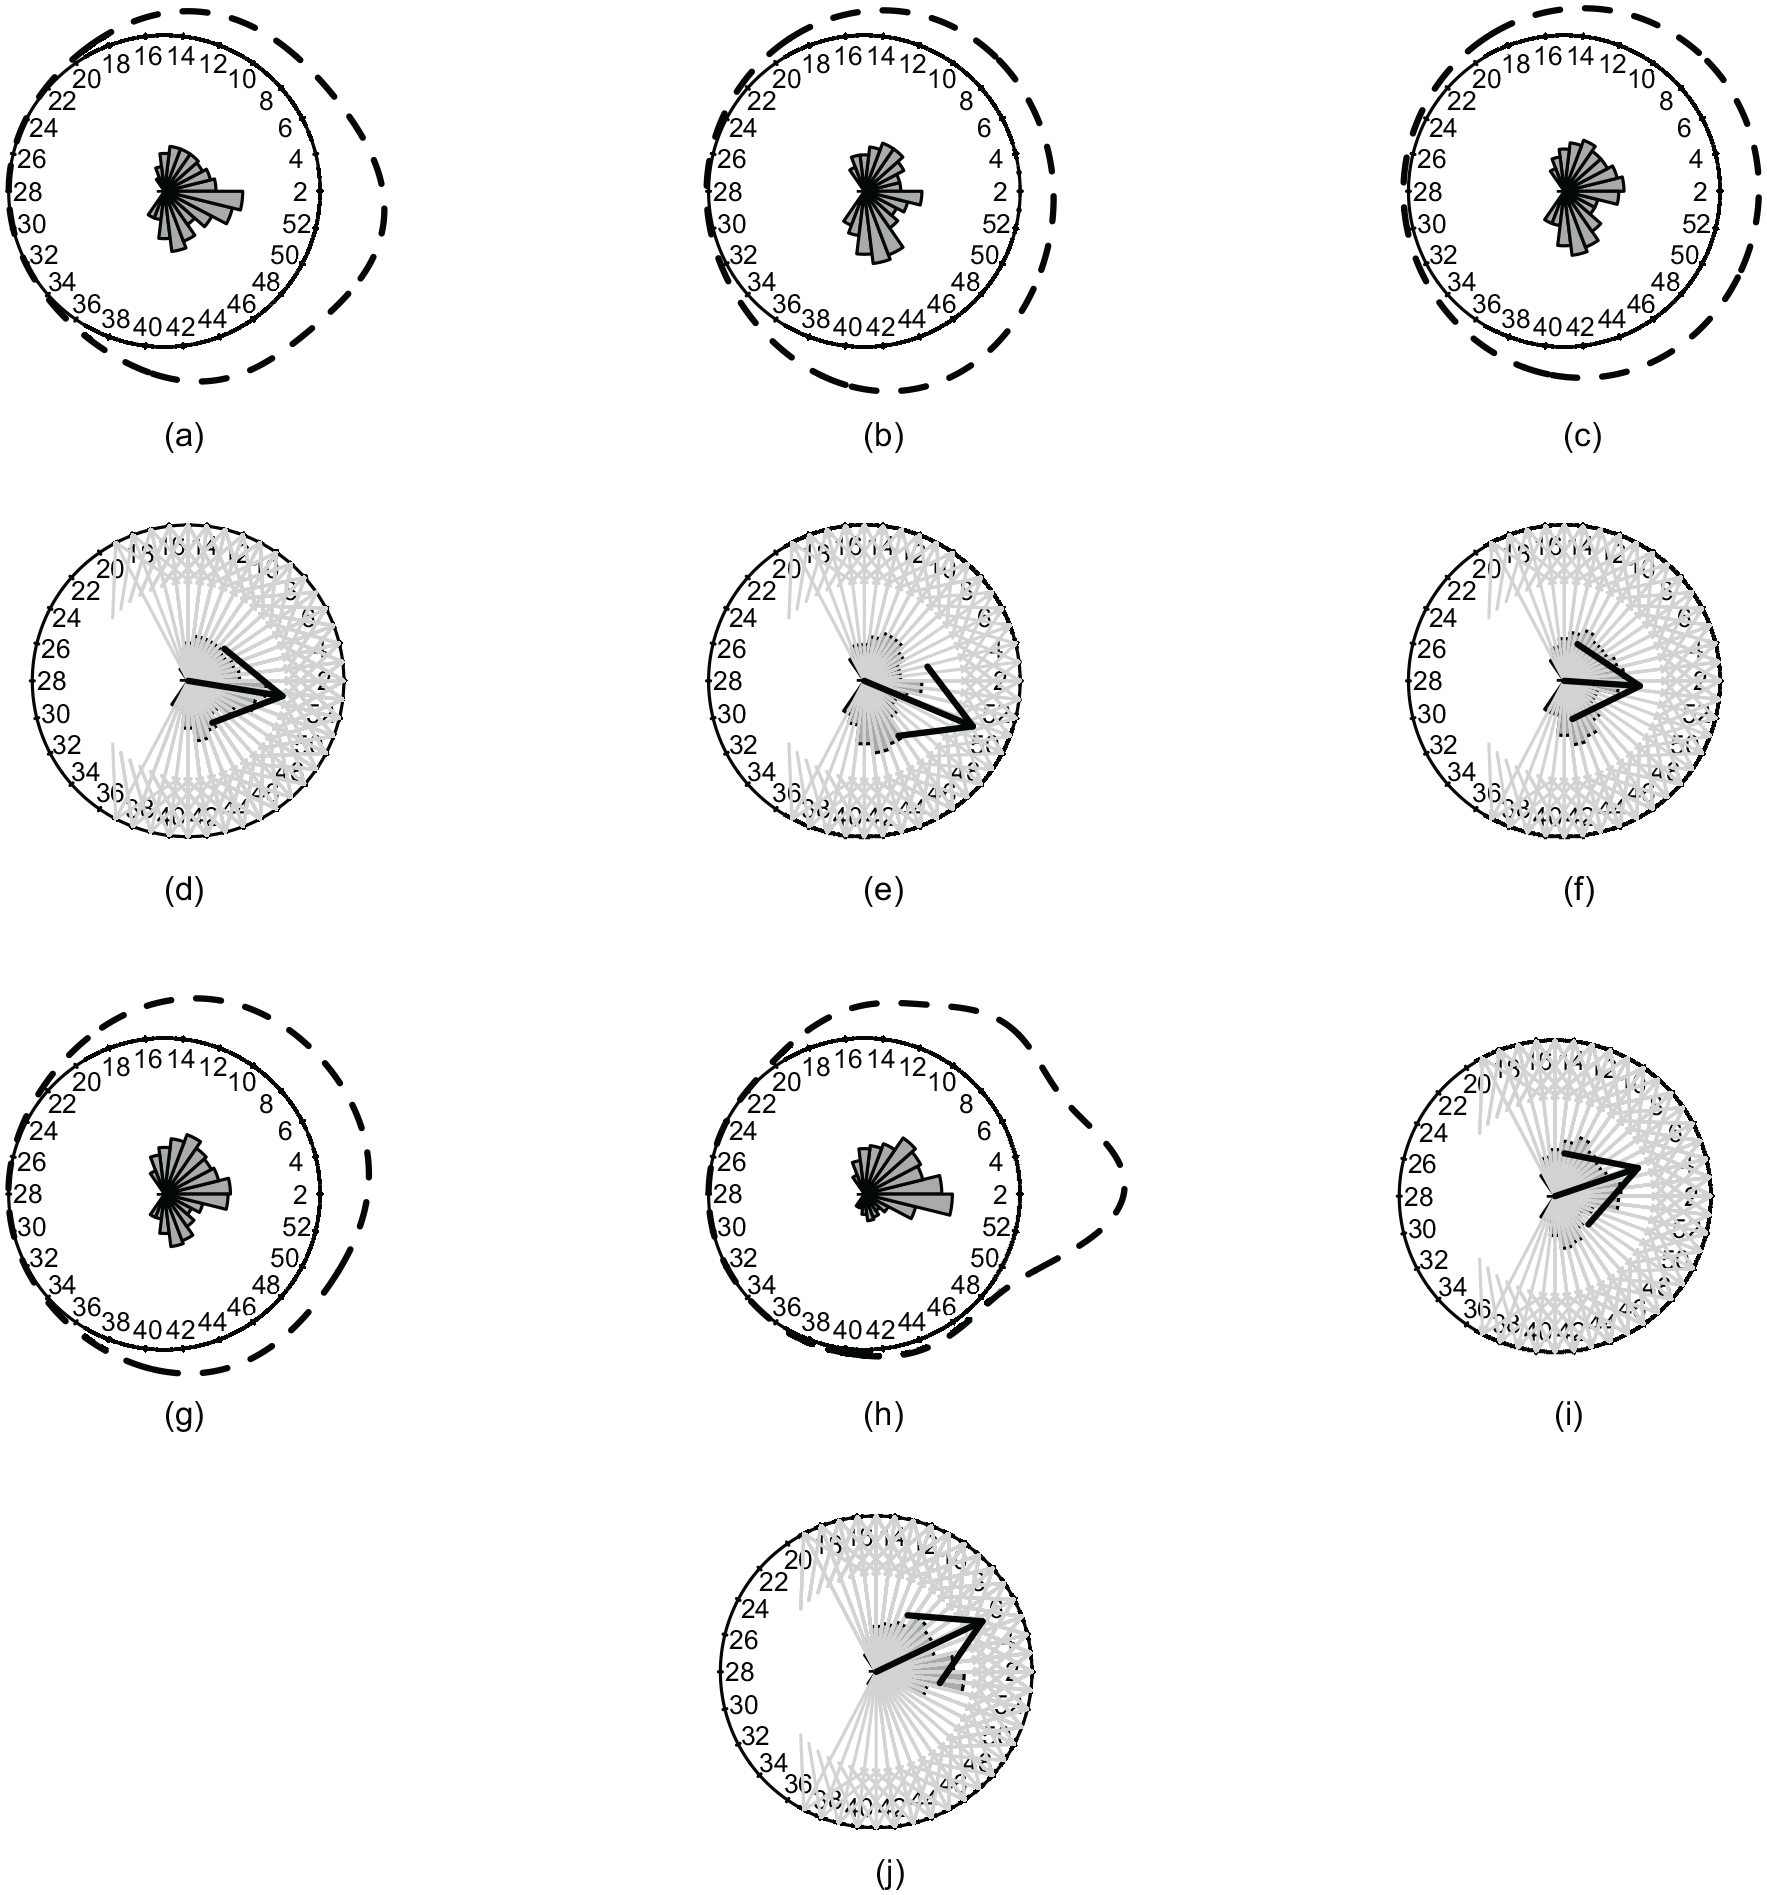
(a–c) Circular probability densities of age groups 2 (a), 11 (b) and 34 (c) while its corresponding resultant mean dates are in the second row (d–f). Estimated circular probability densities of age groups 57 (g) and 65 (h) while their corresponding mean resultant directions and dates (i, j).
The incidence of SI in the study area resembles a moderate unimodal distribution which is equally active across the half of the year beginning from the 36th week (first week of September) and weakening from the 19th week (second week of May) (Figure 3a), with a sample mean direction which is concentrated at the last week (last week of December) of the year (Figure 3d). It is worth noting from Figure 3a that this incidence is consistently stable for the age group 2, with a slight increase at the beginning of the last week (last week of December) of the year, which is the peak time. The age group 2 experiences a relatively increased incidence and is, therefore more likely to show an increase in influenza-related deaths (Karageorgopoulos et al., 2011; Shang et al., 2017).
Estimated circular density of age group 11: Figure 3b shows the unimodal distribution in SI from the 37th week (second week of September) to the 19th week (second week of May) of the year with an inconspicuous actual peak timing of incidence which has a sample mean direction concentrated at between the 51st week (third week of December) and the last week (last week of December) of the year (Figure 3e). Since age group 11 has the number of incidents from week 40 to 52, the resultant length and direction of a vector appear to be around the 51st week. This age group appears to have SI, all year round, but the number of incidences appear to be relatively fewer than that of the age group 2. Similar unimodal distribution has been observed for the age group 34 (Figure 3c). However, the mean direction appears to shift and becomes concentrated between the first week (first week of January) and second week (second week of January) of the year (Figure 3f). Therefore, it can be concluded that the age group 34 is more likely to experience flu once the age group 2 and 11 have reached their peaks. Furthermore, the sample mean direction of the peak incidence of SI for the age group 57 shifted between the fourth week (fourth week of January) and fifth week (first week of February) of the year (Figure 3i). The circular density estimates have clear unimodal distribution with increasing intensity of incidence of flu from about the 50th week (second week of December) to nearly the 14th week (first week of April) of the year (Figure 3g). The unimodal distribution indicates the seasonality of the incidents. Figure 3h explains the density of incidence, which was estimated from the sample data of the age group 65. Demonstrably, the density of incidence is unimodal with high intensity at its peak. The incidence has a sample mean direction which focuses at the fifth week (first week of February) of the year (Figure 3j), which has not significantly shifted with respect to the age group 57. However, it does show the most incidences among all age groups. From the 48th week (last week of November) to the 18th week (first week of May) is a major incidence time period from which we can observe a severe impact of SI on the age group 65, which is corroborated by previous findings (Karageorgopoulos et al., 2011).
Comparison of incidence and its intensity
The distributions of incidence of SI in different age categories are evident (Figure 4). One can conclude that different age groups encounter SI with different time periods, at different peak times and with significantly different intensities. The age group 65 appears to have the most significant impact in incidence among all. It holds the highest peak among all age groups (Karageorgopoulos et al., 2011). Further, the incidence appears to intensify twice a year; the first time is generally at the first week of the year and the second time is generally at the ninth week (first week of March), but with moderate intensity. The age group 2 is the second most severely impacted age group among all the age groups, which is consistent with earlier research (Karageorgopoulos et al., 2011). The incidence of SI in age group 2 is the most active around the 51st week (third week of December) to the first week (first week of January) of the year. However, the incidence of SI continues to exhibit its presence all year round, with nominal presence between the 20th week (third week of May) to the 32nd week (second week of August) of the year. The age group 57 is the third most impacted category to be affected. This group experiences the impact throughout the year with the same intensity as age groups 11 and 34, but it does so at a slightly higher incidence rate. We have not made any attempts to seek association or impact of other factors such as metabolism, age and physical interaction in different place such as public transportation or workplace on SI.
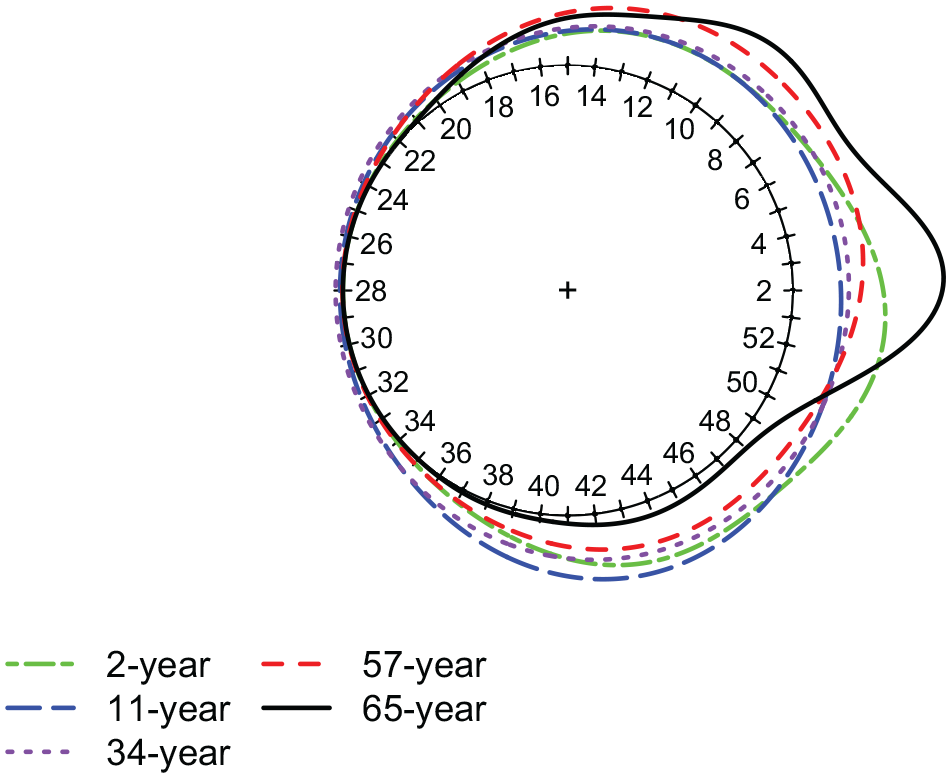
Comparative circular probability densities of all age groups estimated by the LCV method for SI incidence during 2009–2018.
Discussion
The main objectives of the study are to address the issue of the impact of SI at different age groups. The following is a summary of our findings:
- SI exhibits significant distributional variability throughout the study groups. There appears to be a large variability of incidence in SI among age categories 11, 34 and 57. However, the age categories of 2 and 65 have more distinct variations than others.
- The average mean date of incidence of SI to reach at its prime time appears to be different with different age groups. Age groups 2 and 11 have a mean date of around the last week (last week of December) of the year. However, the mean incidence date appears to shift toward January (for the age group 34, second week of January; for the age groups 57 and 65, it is between the fourth week of January and the first week of February).
- The intensity of incidence of SI is higher for the age groups 65 and 2, as opposed to the remaining age groups (11, 34 and 57). This intensity of incidence strengthens most often from the 47th week to the 10th week of the year. The age category 65 begins to resemble a bimodal distribution.
Footnotes
Acknowledgements
The author expresses his gratitude to the anonymous reviewer(s) and the editor for their comments and suggestions.
Declaration of conflicting interests
The author(s) declared no potential conflicts of interest with respect to the research, authorship, and/or publication of this article.
Funding
The author(s) received no financial support for the research, authorship, and/or publication of this article.
Peer review statement
Not commissioned; blind peer-reviewed.