
Abstract
Aims:
The aims of this study are threefold: (1) to investigate the relationship between socio-economic status (inequality) and childhood obesity prevalence within Birmingham local authority, (2) to identify any change in childhood obesity prevalence between deprivation quintiles and (3) to analyse individualised Birmingham National Child Measurement Programme (NCMP) data using a population segmentation tool to better inform obesity prevention strategies.
Methods:
Data from the NCMP for Birmingham (2010/2011 and 2014/2015) were analysed using the deprivation scores from the Income Domain Affecting Children Index (IDACI 2010). The percentage of children with excess weight was calculated for each local deprivation quintile. Population segmentation was carried out using the Experian’s Mosaic Public Sector 6 (MPS6) segmentation tool.
Results:
Childhood obesity levels have remained static at the national and Birmingham level. For Year 6 pupils, obesity levels have increased in the most deprived deprivation quintiles for boys and girls. The most affluent quintile shows a decreasing trend of obesity prevalence for boys and girls in both year groups. For the middle quintiles, the results show fluctuating trends.
Conclusion:
This research highlighted the link in Birmingham between obesity and socio-economic factors with the gap increasing between deprivation quintiles. Obesity is a complex problem that cannot simply be addressed through targeting most deprived populations, rather through a range of effective interventions tailored for the various population segments that reside within communities. Using population segmentation enables a more nuanced understanding of the potential barriers and levers within populations on their readiness for change. The segmentation of childhood obesity data will allow utilisation of social marketing methodology that will facilitate identification of suitable methods for interventions and motivate individuals to sustain behavioural change. Sequentially, it will also inform policy makers to commission the most appropriate interventions.
Keywords
Introduction
Tackling childhood obesity is one of the greatest public health challenges of the 21st century, 1 due to the potentially detrimental impacts of obesity on development, health and the wellbeing 2 of children in later life. Within England, the annual measurement of children aged five (Reception) and 11 (Year 6) is a mandated public health responsibility for local authorities and is conducted through the National Child Measurement Programme (NCMP), overseen nationally by Public Health England (PHE). These surveillance data provide detailed intelligence to Local Authorities and allow benchmarking with similar areas, 3 as well understanding obesity-related health inequalities that may exist on a localised level. Birmingham is the largest local authority in England and Wales with an estimated population of 1,073,045 (Census 2011), with a young and ethnically diverse population. In 2011, just under two-thirds (64%) of primary school-aged children were from a non-White British ethnic origin. 4
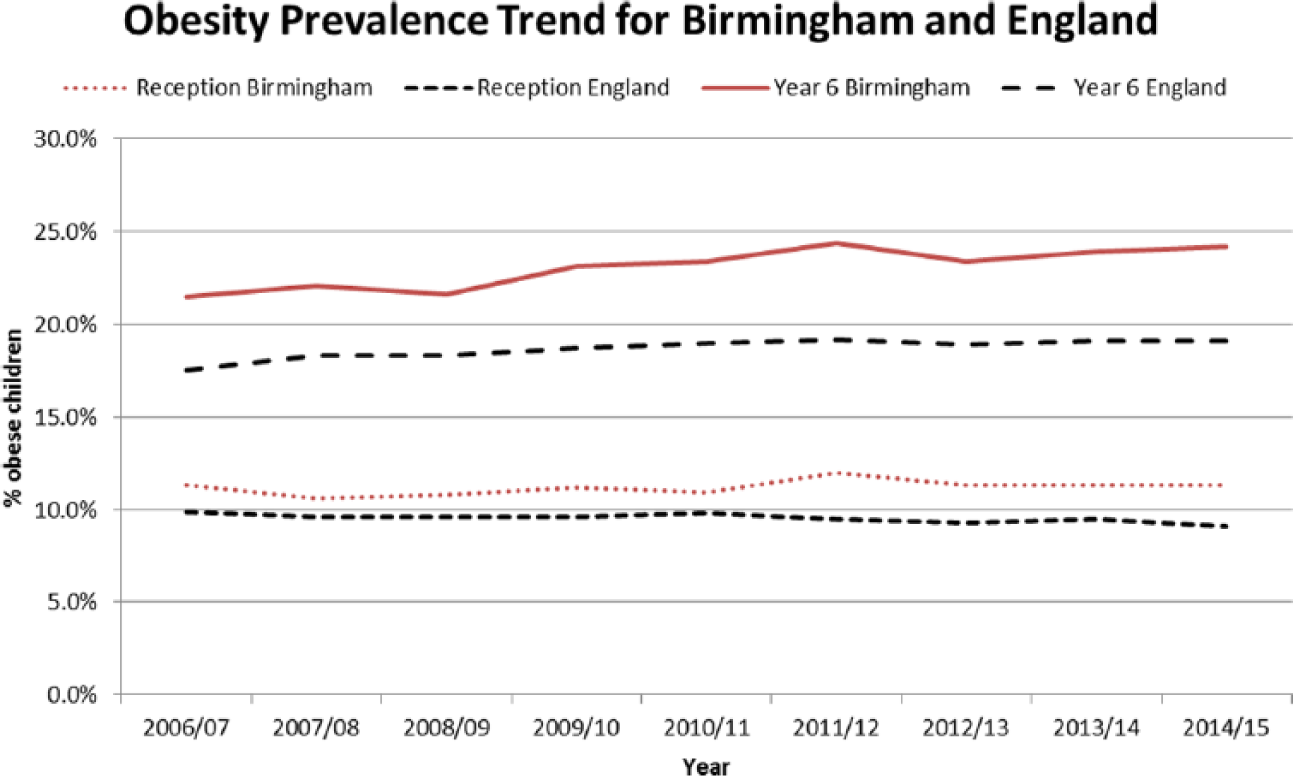
The prevalence of obesity among Reception and Year 6 children in Birmingham has been higher than the national average since surveillance started in 2006/2007, with the most recent data showing prevalence of 11.3% and 23.9%, respectively, compared with 9.1% and 19.1%, for England (NCMP, 2014–2015). This has led to childhood obesity being stipulated as a priority within Birmingham’s Health and Wellbeing Board strategy, giving it the political and strategic leadership required to confront this complex health issue.
Systematic reviews have demonstrated a clear link between lower socio-economic position (household and individual level measures) and higher prevalence of excess weight, both in the United Kingdom 5 and in other high-income countries internationally. Global prevalence of obesity has almost doubled between 1980 and 2008 6 and childhood obesity prevalence is emerging as a serious global public health challenge, where children reside in obesogenic environments leading to an imbalance of energy intake and reduced levels of physical activity. 7 The association between deprivation and obesity is complex and varies by numerous demographic and environmental factors, with the general trend of combined prevalence of overweight and obesity much greater in developed countries than in developing countries and higher rates within less affluent families. 8 In order not to exacerbate any underlying health inequities that may exist, the World Health Organization (WHO) 9 Commission on Ending Childhood Obesity recommended that governments must implement interventions that have equitable coverage, especially for excluded or marginalised children who may be at a greater risk of obesity and dwell in areas of high deprivation.
In the United Kingdom, obesity prevalence in the most deprived decile is twice as high as it is in the least deprived decile. 10 Deprivation analysis of published data from the NCMP generally examines the relationship between deprivation and prevalence of excess weight in children at larger population levels (e.g. on a local authority level), with little examination of the associations at more local geographies such as wards. This is essential to inform local commissioners on the extent of childhood obesity inequalities, to support appropriate policy interventions to address these inequities.
The current rising trend within Birmingham 11 indicates that existing obesity prevention measures are not reducing the prevalence of childhood obesity, suggesting there is a need for a paradigm shift, from a one size fits all model to a more nuanced, individualised and tailored approach. Using a population segmentation tool to better understand the values, motivations and barriers to weight loss to better inform interventions that match an individual’s needs and preferences have been reported. 12 This study will analyse individualised NCMP data for Birmingham to investigate localised variation in obesity prevalence both on a deprivation and population segment level.
Aims
The aims of this study are threefold:
To investigate the relationship between socio-economic status (inequality) and childhood obesity prevalence within Birmingham local authority;
To identify any change in childhood obesity prevalence between deprivation quintiles;
To analyse individualised Birmingham NCMP data using a population segmentation tool to better inform obesity prevention strategies.
Methods
In order to examine the link between socio-economic status and obesity prevalence, NCMP data for the period 2010/2011 to 2014/2015, aggregated into three years, together with the Income Deprivation Affecting Children Index 2010 (IDACI) was analysed. This trend data would enable detection of changes between the different years and within the deprivation quintiles.
The NCMP measures children in Reception and Year 6 within schools. In 2010/2011 and 2014/2015, across Birmingham, 24,987 and 29,444 children were measured in the respective year groups, with classification of obesity designated via body mass index (BMI). 13
The following BMI classifications were used based on the percentile relative to the UK Growth charts:
If percentile is ≤0.02, then child is ‘Underweight’.
If percentile is >0.02 and <0.85, then child is ‘Healthy Weight’.
If percentile is ≥0.85 and <0.95, then child is ‘Overweight’.
If percentile is ≥0.95, then child is ‘Obese’.
The IDACI measures the proportion of children under the age of 16 who live in low-income households. 14 Families are classed as income-deprived if they are in receipt of Income Support, Income-Based Jobseeker’s Allowance or Pension Credit, or Child Tax Credit with an equivalised income (excluding housing benefits) below 60% of the national median before housing costs. Using the IDACI scores, Birmingham super output areas were divided into quintiles and the proportion of children with excess weight in each quintile was calculated.
In terms of the segmentation tool, Experian’s Mosaic Public Sector 6 (MPS6) © Experian 2014 was utilised 15 to allocate a segment based on each child’s home postcode. Birmingham City Council commissioned the MPS6 segmentation tool to target communication effectively towards Birmingham citizens. MPS6 is a geo-demographic profiling tool, which has the ability to classify and identify neighbourhood household types and person types based on demographic data, such as age, sex and property characteristics, as well as financial measures indicating behaviours. 12 There are currently 15 group classifications within the MPS6 tool (Table 1).
Experian’s MPS6 group descriptions © Experian 2014.
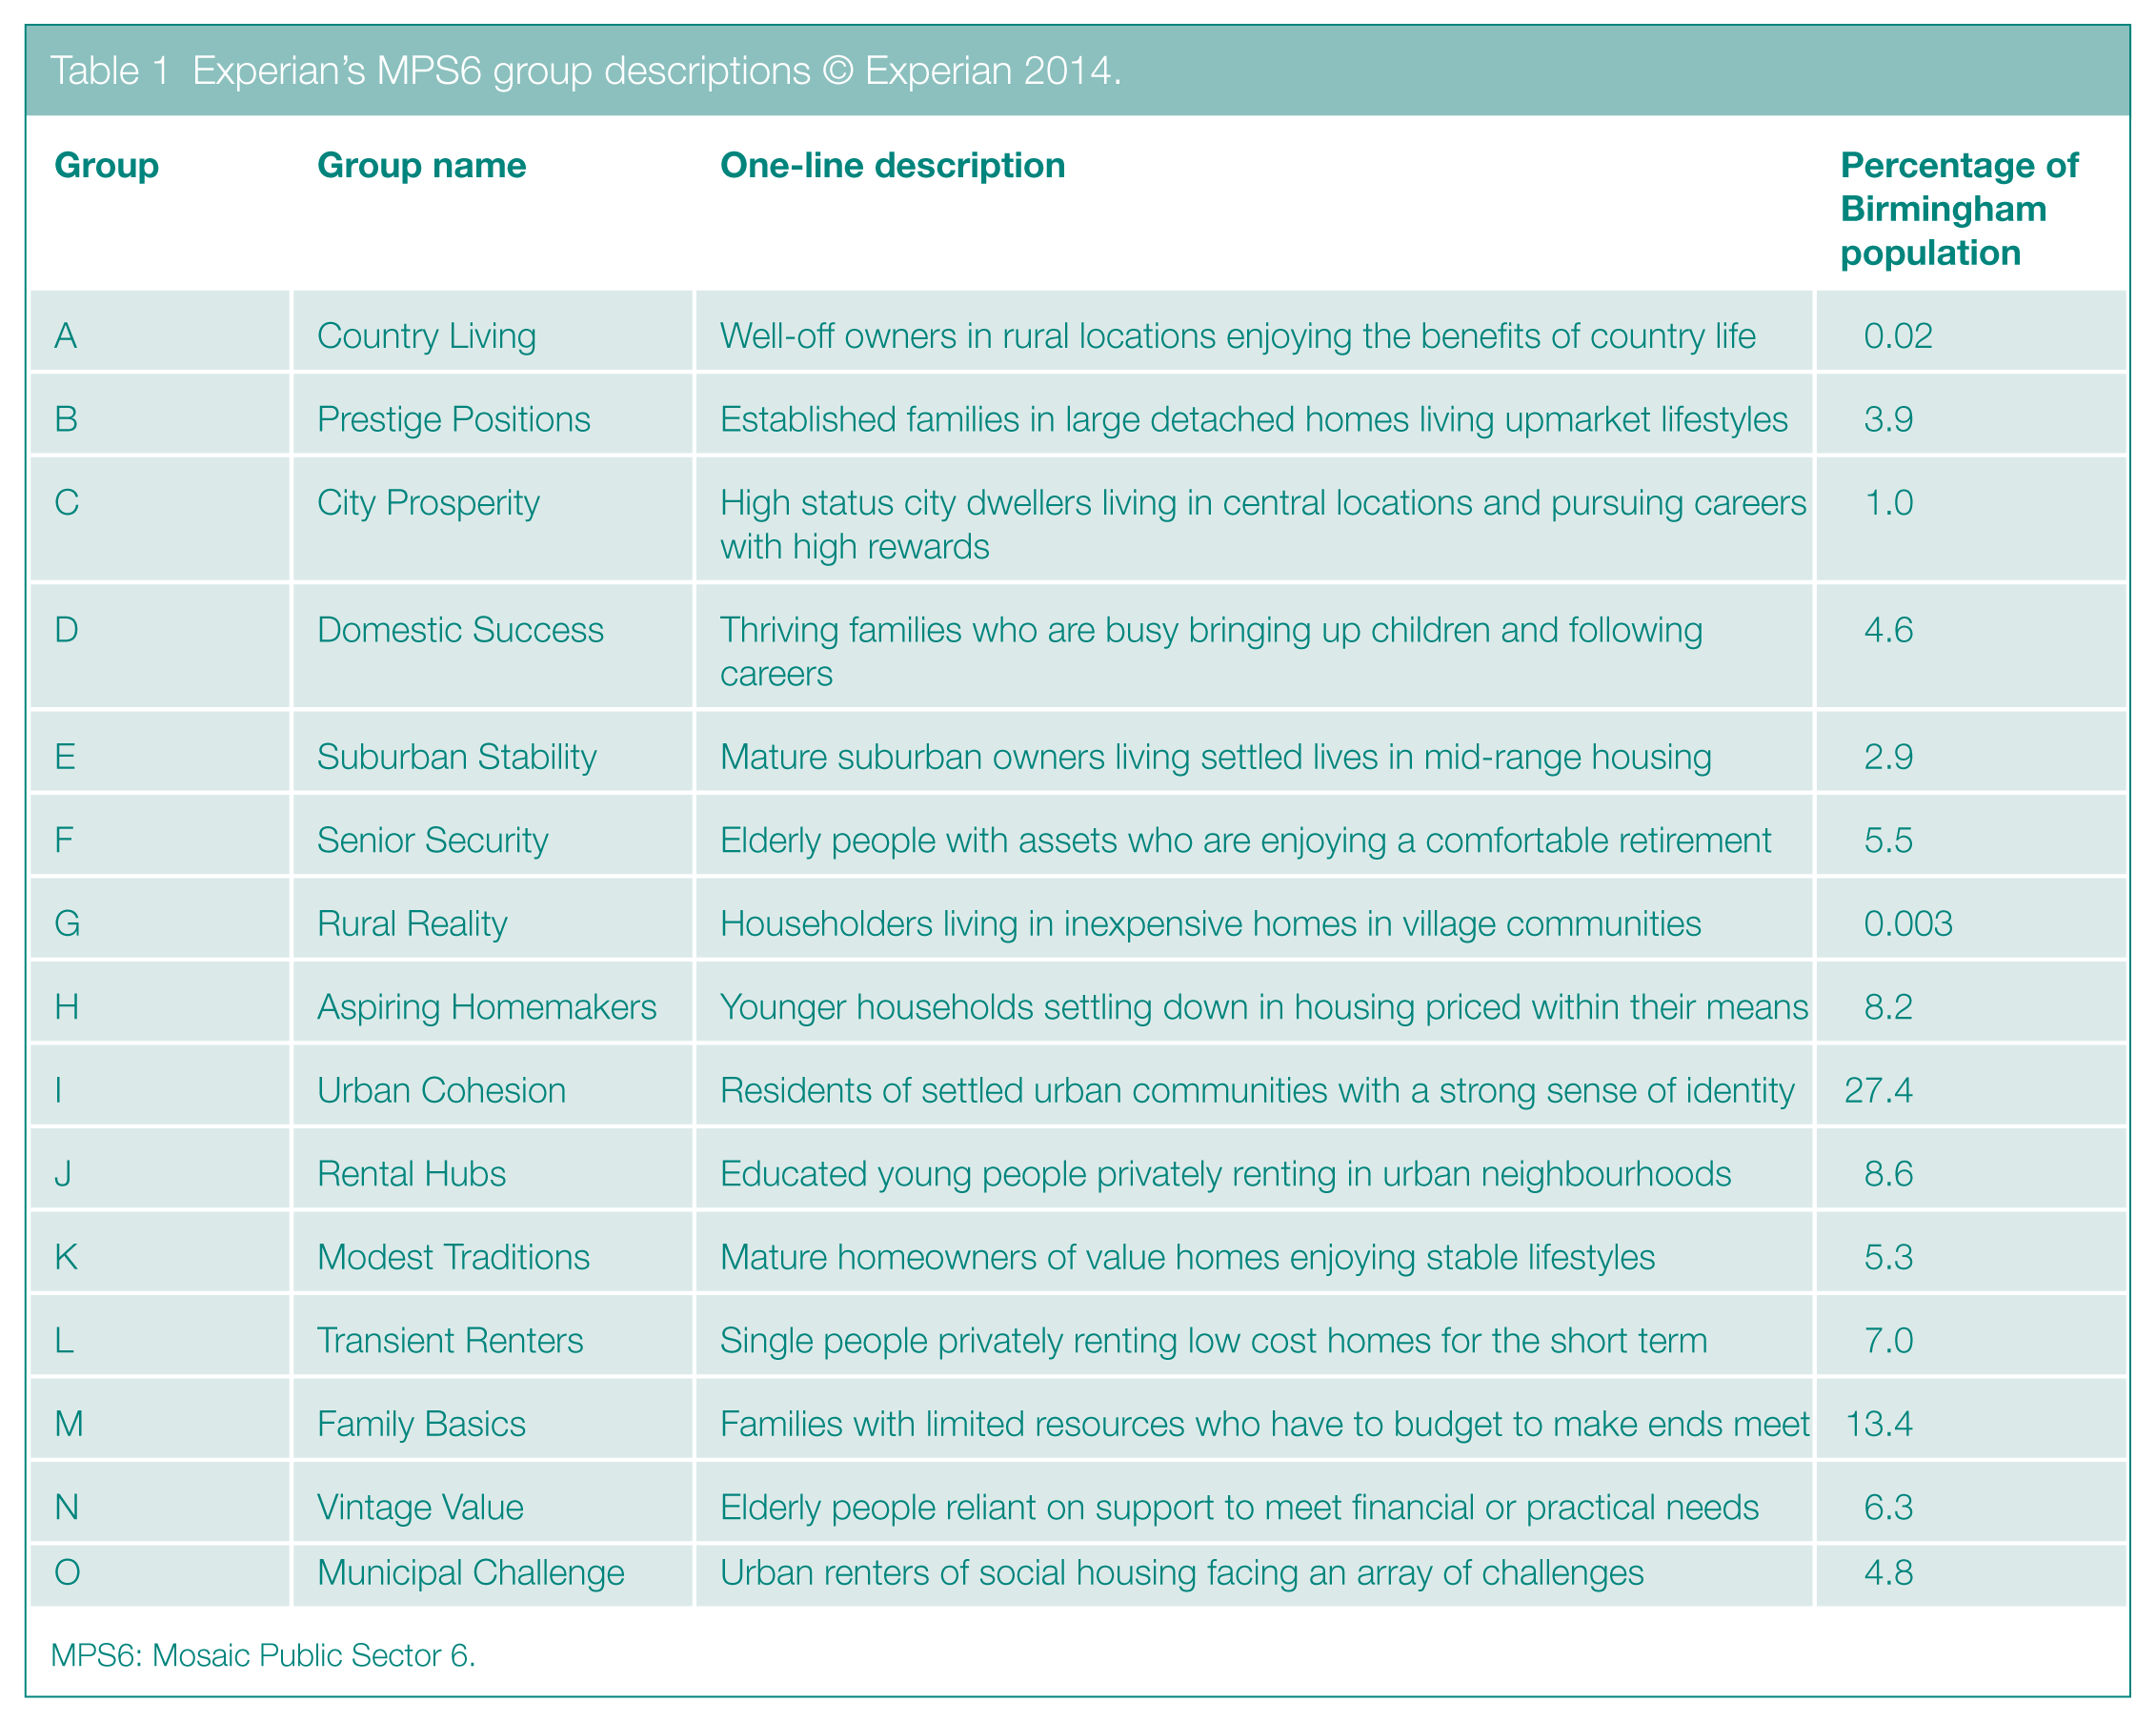
MPS6: Mosaic Public Sector 6.
Results
Obesity prevalence and deprivation changes between 2010/2011 and 2014/2015
In Birmingham and England, between 2010/2011 and 2014/2015, the average level of obesity in Reception remained at similar levels (Birmingham 10.9%–11.3%, England 9.8%–9.1%). Likewise, in Year 6, the average level of obesity rose slightly (Birmingham 23.4%–24.2%, England 19.0%–19.1%), neither of which was statistically significant (Figure 1).
In terms of IDACI 2010 for Birmingham overall, Figure 2 shows the obesity prevalence trend between 2010/2011 and 2014/2015 for each IDACI quintile in Birmingham, for both Reception and Year 6 boys and girls, where one is the most deprived quintile and five is the most affluent.
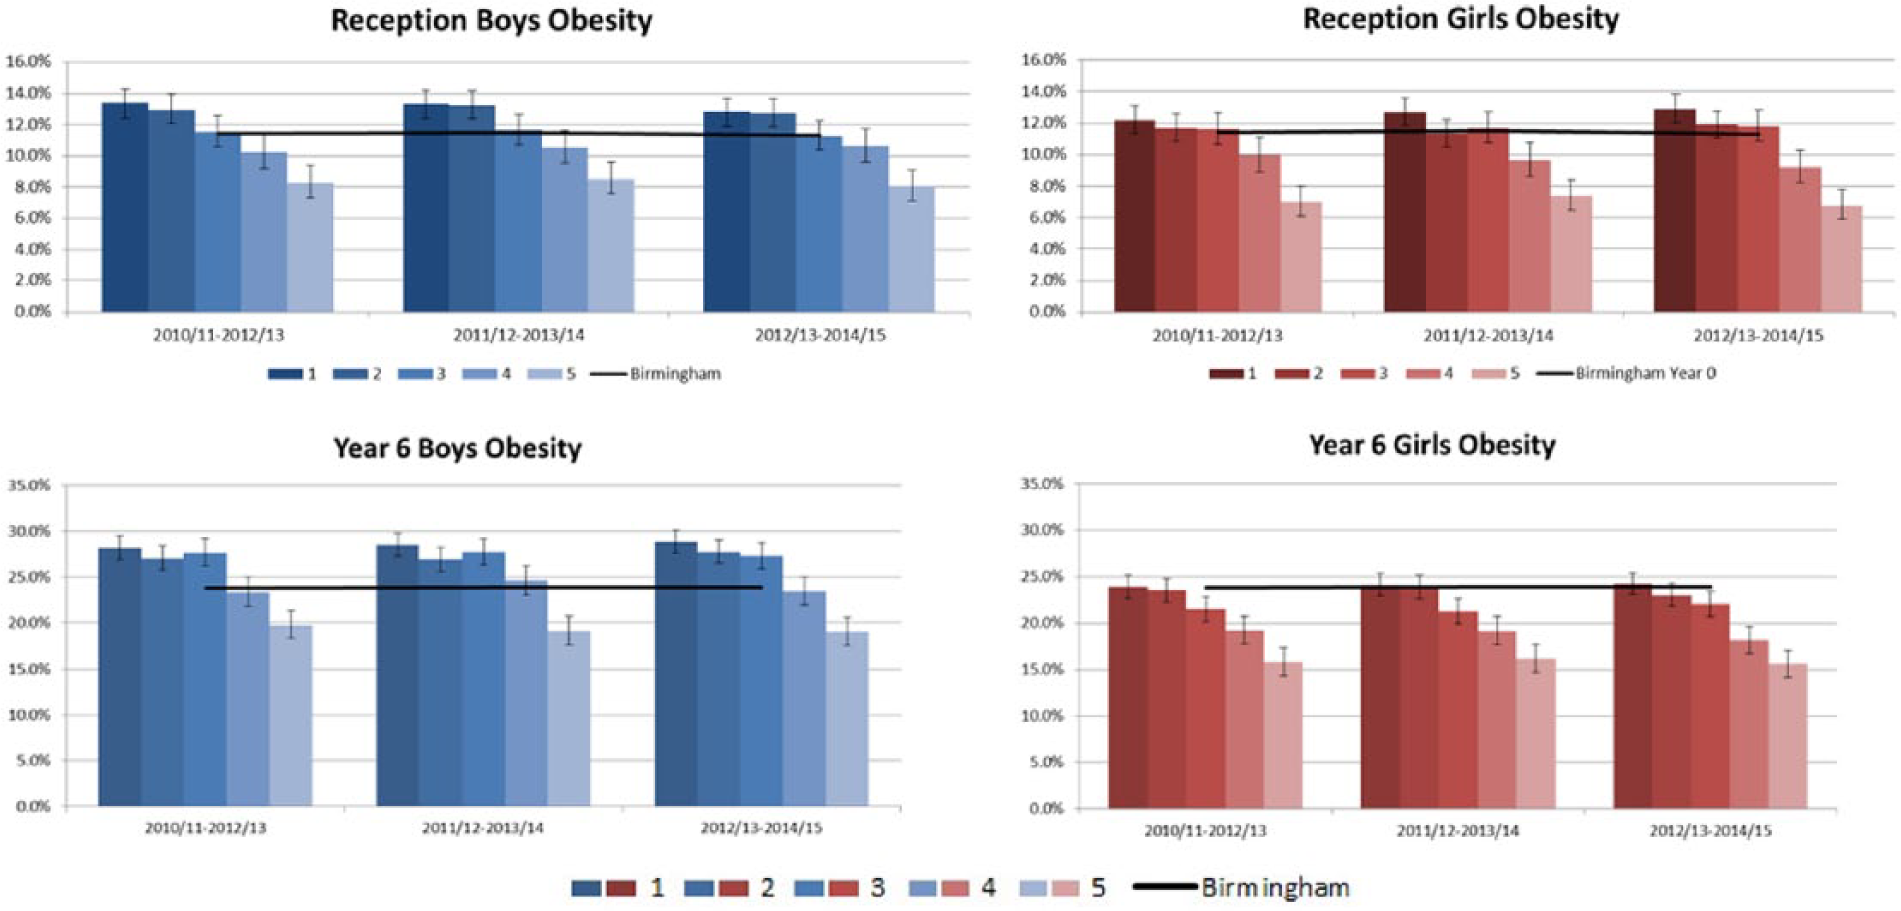
Overall, childhood obesity levels have remained static at the national and Birmingham level; however for Year 6 pupils, obesity levels have increased in the most deprived quintiles for boys and girls. The most affluent quintile shows a decreasing trend of obesity prevalence for boys and girls in both year groups. For the middle quintiles, the results show fluctuating trends.
Between 2010/2011–2012/2013 and 2012/2013–2014/2015 for Reception boys, there was a decrease of obesity in the most deprived quintile, dropping from 13.4% to 12.8%, although the most deprived quintile remains statistically significantly higher than the Birmingham average. For Reception girls, there was an increase in obesity prevalence within the most deprived quintile, rising from 12.2% to 12.9% for the same time period, demonstrating a shift to levels statistically significantly higher than the Birmingham average.
Figure 2 also highlights the difference in obesity prevalence in Year 6 between boys and girls. The proportion of Year 6 boys in the three most deprived quintiles is significantly higher than the Birmingham average. The obesity prevalence in 2012/2013–2014/2015 Year 6 boys in the most deprived quintile was 28.8%, with a Birmingham average of 23.9%. The level of obesity for Year 6 boys in the most affluent quintile had decreased to 19.0% and is significantly lower than Birmingham average. The results for the Year 6 girls show a correlation between deprivation and obesity; however, the most deprived quintiles are not significantly higher than the Birmingham average. The most affluent quintiles are significantly below the Birmingham average (19.1%) and also significantly lower than the England average (17.1%).
Closer examination of the sub-ward level data by deprivation quintiles has also highlighted that the inequality of childhood obesity prevalence is not just increasing year on year; the gap between the most deprived and most affluent quintiles is also changing. For the period 2010/2011–2012/2013, the difference between quintile 1 (most deprived) and quintile 5 (most affluent) for Reception boys was 5.1 percentage points. By 2012/2013–2014/2015, this gap had reduced by 0.4 percentage points to 4.7%. Conversely, the obesity prevalence gap between the most deprived and most affluent quintiles for Year 6 boys had increased from a 8-percentage point difference in 2010/2011–2012/2013 to a 10-percentage point difference in 2012/2013–2014/2015. This worsening inequality is not visible when evaluating the data on a local authority level.
Overall, the data show variations in the obesity prevalence gap between quintiles, Reception and Year 6, gender and time periods (although this variation is less pronounced between the middle quintiles for Year 6 boys). While there is clear evidence to support an association between obesity levels and deprivation, the disparities between quintiles indicate that other factors, whether socio-economic or health related, may also affect obesity
MPS6 segmentation
To further build upon deprivation analysis of these data, segmentation analysis would provide suitable mechanisms through which the various segments across Birmingham could be engaged. Trend analysis was carried out on the schoolchildren identified as obese between 2010/2011–2013/2014 and 2012/2013–2014/2015 using the MPS6 segmentation tool. Figure 3 shows the changes in the levels of excess weight for each MPS6 group in Birmingham for both Reception and Year 6 children.
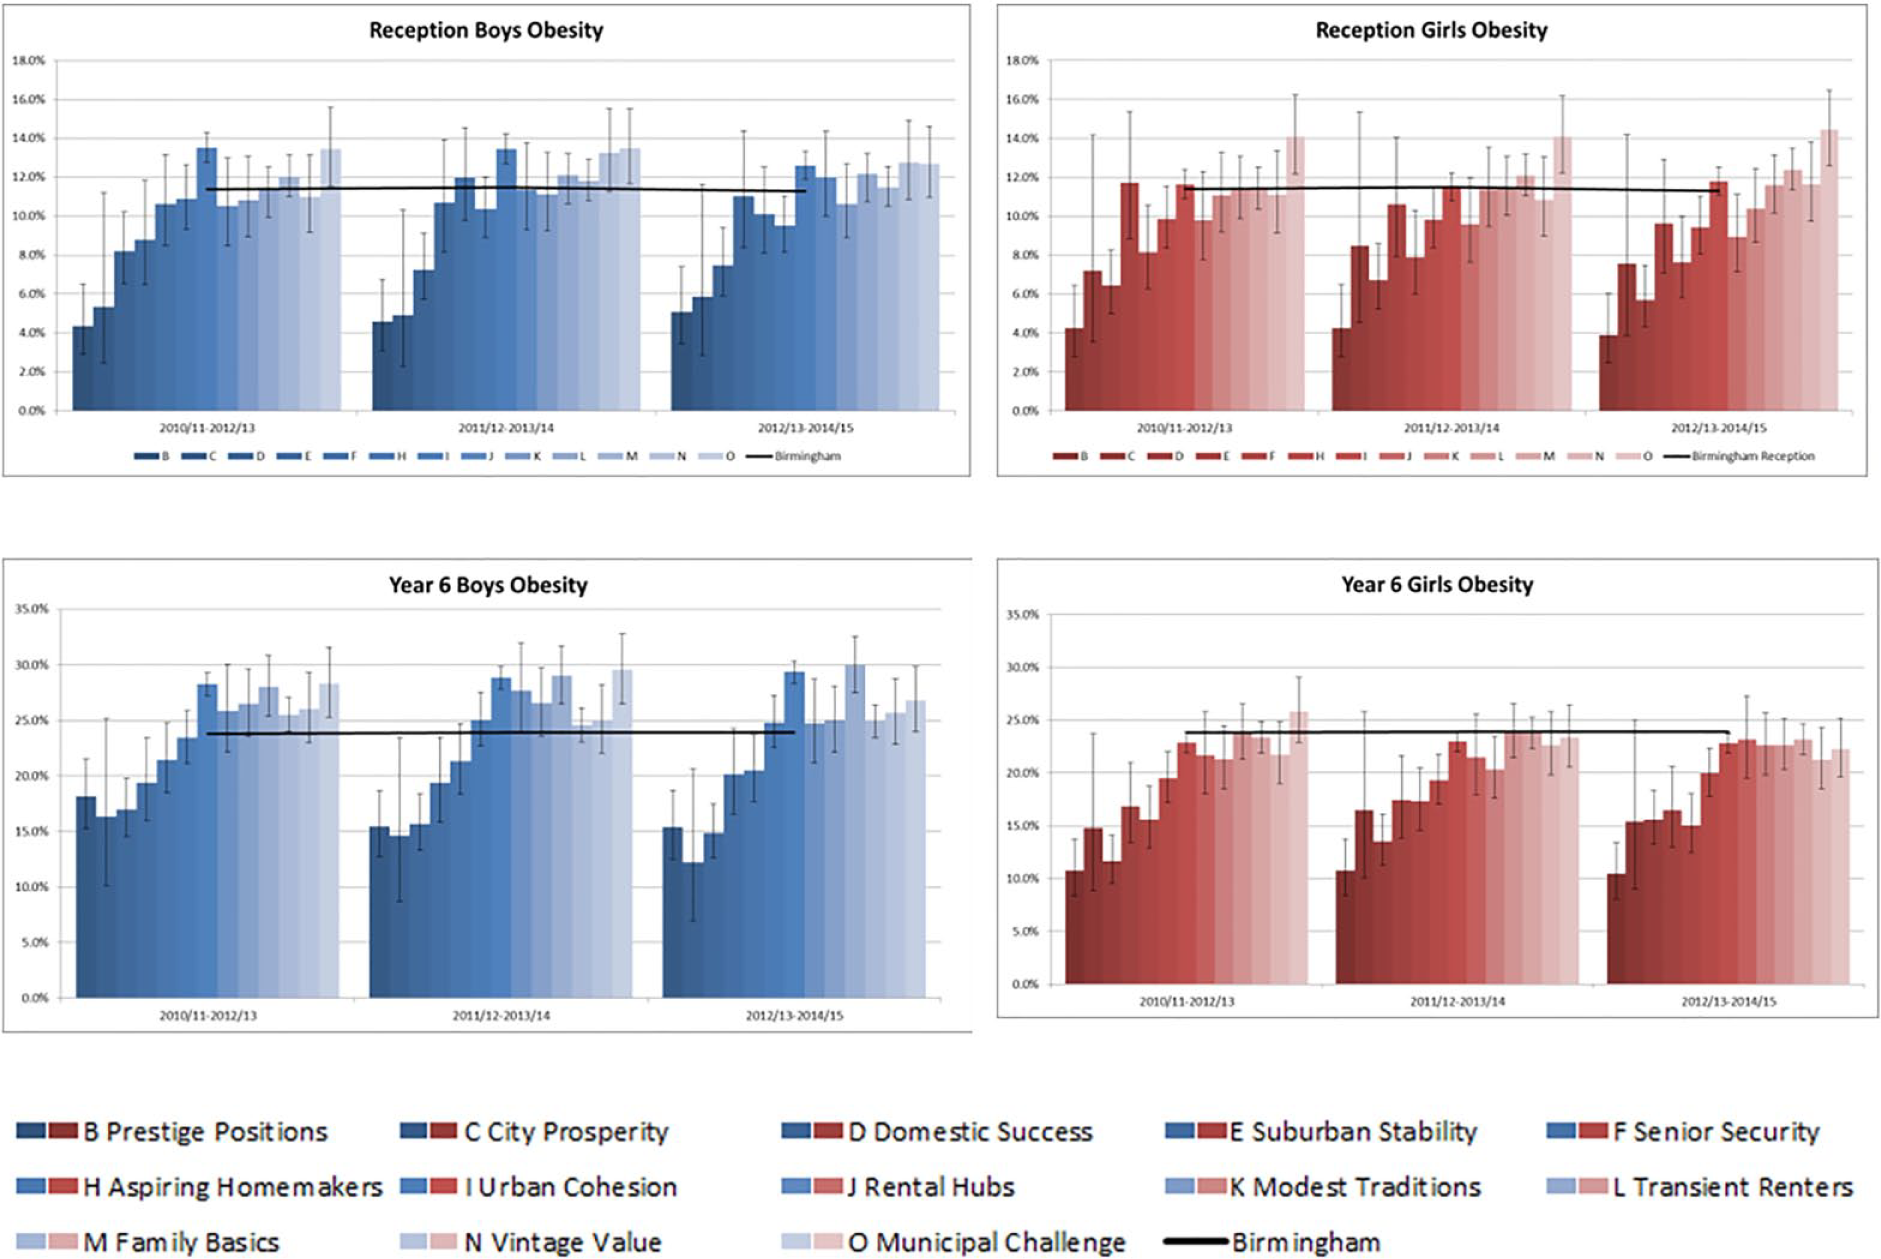
The MPS6 groups are based on different characteristics and ordered tentatively according to affluence with Group A (Country Living) being the most affluent and Group O (Municipal Challenge) the least affluent. The segmentation analysis supports the deprivation analysis with similar patterns of lower obesity prevalence in more affluent segments for both boys and girls in each year group. Pupils in Groups B (Prestige Positions) and D (Domestic Success) are significantly below the average obesity prevalence for boys and girls in both year groups. The largest number of schoolchildren in Birmingham can be found in Group I (Urban Cohesion). This category falls within the centre of the MPS6 segmentation spectrum; the second largest number of Birmingham schoolchildren is in Group M (Family Basics), a low affluence group. 15 There were no schoolchildren measured as part of the NCMP in Group G and only a small number in Group A and are not therefore shown in Figure 3.
Figure 3 shows how the rates of obesity have been increasing and decreasing within the segments. Decreases in prevalence were seen in both boys and girls in Reception for Groups B, D and H. Group H (Aspiring Homemakers) decreased to be significantly below the Birmingham average. For Reception boys, the largest group, I (Urban Cohesion), was significantly higher than average, but the overall prevalence has been decreasing. The obesity prevalence for Reception girls in Group I was not significant but has been increasing.
In Year 6, there is a much greater difference between boys and girls. None of the MPS6 Groups for Year 6 girls are significantly higher than the Birmingham average. Year 6 girls in Groups B, D, E, F, H and I are significantly below average. Group I has the largest number of children and for Year 6 girls the prevalence has been decreasing. However, the obesity prevalence for Year 6 boys in Group I is significantly higher than the average and has been increasing. Other groups that have a significantly higher prevalence for Year 6 boys are Group L (Transient Renters) which has been increasing and Group O (Municipal Challenge) where the prevalence has been decreasing.
Conclusion
Tackling childhood obesity is a major priority for Birmingham City Council Public Health as well as for wider child health stakeholders including schools and the National Health Service (NHS). The triangulation of analysis within this study of NCMP, IDACI 2010 and MPS6 provides further insight into the complexity of tackling this major public health concern.
Geo-demographic segmentation using MPS6 provides greater insight into those populations with high rates of obesity prevalence and could enable public health to engage with communities more effectively in reducing health and social inequalities. By adopting a proportionate universalism 16 approach and tackling obesity at all levels of deprivation, local health policy makers will be better informed on the most appropriate and effective interventions for the population. The utilisation of population segmentation in health-related social marketing enables identification of suitable methods to motivate individuals to behavioural change, with social marketing theory postulating that for continual and sustainable change in behaviour, it is imperative to understand the detrimental behaviour and an alternative is offered, which is valued by the target population. 12 The analysis within this study highlighted variation of obesity prevalence within the population segments, deprivation quintiles and gender within a culturally diverse local authority. In order to commission effective interventions, there is a necessity for policy makers to consider a nuanced approach to the understanding of the distinctive communities in order to tackle childhood obesity effectively. Attention needs to be given to an individual’s needs and preferences relevant to the population segment groups, as opposed to ‘a City-wide approach’ utilising a uni-dimensional risk stratification such as BMI.