
Abstract
Background:
Goal setting is an important step in planning physical activity promotion strategies. Based on the dose–response relationships between physical activity and health and the goal-setting theory, setting higher goals without exceeding people’s acceptance is desirable. Understanding maximum acceptance of physical activity increases is helpful for enabling such goal setting. Nonetheless, the level of maximum acceptance of physical activity increase and its sociodemographic differences remain unclear. This study examined the level and sociodemographic correlates of maximum acceptable physical activity increase among Japanese adults.
Methods:
A web-based cross-sectional questionnaire survey was conducted with 2259 Japanese adults aged 20–64 years. Based on the Capability, Opportunity, Motivation, and Behavior model, the acceptable time for increasing physical activity in a day was examined from three perspectives: capabilities, opportunities and motivations. For motivation, two definitions were employed: definition I regarded unchanged motivation as acceptable, and definition II regarded it as unacceptable. The maximum acceptable physical activity increase was identified by combining the responses of these subcomponents. This study measured sociodemographic factors such as gender, age, current marital status, current working status, educational background, annual household income and current physical activity duration.
Results:
The means (95% confidence intervals) and standard deviations of maximum acceptable physical activity increase were 17.0 (16.3–17.7) and 16.9 min per day in definition I and 9.0 (8.4–9.6) and 13.9 min per day in definition II. Across both definitions, multiple regression analyses showed that younger age, greater levels of annual household income and longer current physical activity duration were significantly associated with longer maximum acceptable physical activity increases.
Conclusions:
From the findings, an increase in physical activity of approximately 10–15 min per day might be an important option in goal setting, and setting higher goals would be feasible for younger adults, adults with higher household incomes, and physically active adults.
Introduction
Numerous studies have established dose–response relationships between physical activity and health (1,2). For example, an umbrella review reported dose–response associations between physical activity and all-cause mortality, cardiovascular mortality and incident cardiovascular disease (1). In addition, meta-analyses have supported the dose–response associations of physical activity with the risk of breast cancer, colon cancer, diabetes, heart disease and stroke (2). While the World Health Organization (WHO) recommends that adults perform moderate-intensity aerobic physical activity for at least 150–300 min, vigorous-intensity aerobic physical activity for at least 75–150 min, or their equivalent combinations, WHO also emphasizes that this level is not a stable or definitive threshold of health benefits and engagement beyond this level can lead to better health (3). In Japan, in addition to recommending moderate-to-vigorous physical activity of at least 60 min per day for Japanese adults aged 20–64 years, the Japanese ministry emphasizes the importance of increasing physical activity levels (4). To briefly and simply communicate the dose–response relationships between physical activity and health, since 2013 the Japanese ministry has disseminated a campaign message, ‘Plus Ten’, which suggests adding 10 min of physical activity time every day (5–7). Based on their dose–response relationships, increasing physical activity is beneficial to various health outcomes (1,2) for both physically active and inactive individuals.
Understanding people’s perceptions of acceptable levels of physical activity increase is essential for planning physical activity promotion strategies. Goal setting is an important step in planning strategies at multiple levels, including the individual, community and policy levels. At the individual level, goal setting is a behavioral change technique (8) for self-regulation (9). Meta-analyses (10,11), which included the studies conducted in non-Western countries, such as Japan, Brazil, Iran (10), South Korea, and Thailand (11), as well as Western countries, have shown that interventions employing goal setting are effective in increasing participants’ physical activity behavior. Goal-setting is also an important step in developing an action plan to promote physical activity at the community level (12). A national-level policy audit tool includes the item about physical activity goals as a key element for successfully promoting physical activity (13). Based on the dose–response relationships, setting higher physical activity goals is more desirable. Goal-setting theory (14–16) supports such goal setting; this theory assumes that setting difficult goals is more effective than setting easy goals in increasing performance. Although the SMART (Specific, Measurable, Achievable, Realistic and Timebound) heuristic indicates the importance of setting achievable and realistic goals, empirical studies have not supported the SMART heuristic for goal setting in promoting physical activity (17). Rather, a meta-analysis of various behavioral changes (e.g. achieving cognitive goals such as completion of the maze, health goals and educational goals) (18) and randomized controlled trials on physical activity behavior change (19–21) have supported the importance of setting difficult goals. However, the goal-setting theory (14–16) also assumes that extremely difficult goals beyond their commitment and ability do not enhance motivation and performance. From this theory, setting higher physical activity goals without exceeding people’s acceptance is desirable when planning physical activity promotion strategies. For example, the Japanese ministry has recommended that the Japanese population increase daily physical activity time by 10 min via the ‘Plus Ten’ campaign (5–7). Understanding people’s maximum acceptance of physical activity increases is helpful in justifying and improving goal-setting campaigns such as the ‘Plus Ten’ campaign.
Nonetheless, the level of maximum acceptance of physical activity increase among populations and its sociodemographic differences remain unclear. Previous studies have investigated the maximum acceptable walking distance (22–26), or equivalent concepts, such as reasonable walking distance/time (27) and easy walking distance (28), to better understand transportation systems (22–24) and physical activity promotion (25–28). However, they (22–28) have been specific for walking behavior and few previous studies have examined the acceptance of overall physical activity engagement. As people also accumulate physical activity volume via other types of physical activity (29), the findings from acceptable walking distance (22) cannot be directly generalized to overall physical activity. Furthermore, maximum acceptable walking distances differ according to sociodemographic characteristics (22,23,25–27). If the maximum acceptable physical activity increase also differs according to sociodemographic characteristics, it indicates that planners of physical activity promotion strategies should set different physical activity goals according to the variabilities of the targets’ characteristics.
The Capability, Opportunity, Motivation and Behavior (COM-B) model (30) is helpful in examining the maximum acceptable physical activity increase. This model (30) assumes that behavioral change occurs through the interaction of capability, opportunity and motivation. In this model, capability, opportunity and motivation represent individuals’ psychological and physical capacities, social and environmental opportunities, and reflexive and automatic motivation toward behavioral change, respectively (30). Physical activity studies have used this model to understand the correlates (31,32) and intervention strategies (33,34) of physical activity. The sources of acceptable physical activity increases can be captured by the three subcomponents of this model: capability, opportunity and motivation toward physical activity increase. This model provides a theoretical basis for acceptable physical activity increase.
By applying the COM-B model (30), this study examined the level and sociodemographic correlates of the maximum acceptable physical activity increase among Japanese adults.
Methods
Participants and procedures
Supplementary Text 1 describes the details of the participants and procedures. Supplementary Figure 1 shows the flow of the participants. Briefly, a cross-sectional online questionnaire survey was conducted on 2259 registered participants aged 20 to 64 years of a Japanese research service company in 2024. The distribution ratios of gender, age groups and educational backgrounds were matched with those of the Japanese general population (35). This study excluded invalid respondents using a questionnaire developed by the previous study (36).
This study was approved by the Ethics Committee of Graduate School of Human Development and Environment, Kobe University (no. 710). All procedures involving human participants were performed in accordance with the 1964 Declaration of Helsinki and its later amendments or comparable ethical standards. Informed consent was obtained from all participants.
Measures
Duration of acceptable physical activity increase
Supplementary Text 2 describes the details of measures for the duration of an acceptable increase in physical activity. Briefly, based on the COM-B model (30) and the current Japanese guidelines (4), this study prepared 10 items to measure acceptable increase in daily moderate-to-vigorous physical activity from capability, opportunity and motivation respectively by replacing ‘X’ in the following template item with 5 or a multiple of 5 (from 5–50 min): ‘my physical and mental conditions are capable to increase moderate-to-vigorous physical activity time for X min per day (capability)’, ‘there are opportunities in my environment and living conditions to increase moderate-to-vigorous physical activity time for X min per day (opportunity)’ and ‘if a professional or organization recommends you to increase moderate-intensity physical activity time for X min per day, how will your motivation toward physical activity be changed?’ For the items of capability and opportunity, this study employed a four-point Likert scale (‘strongly disagree’ and ‘somewhat disagree’ as unacceptable, ‘somewhat agree’ and ‘strongly agree’ as acceptable). For motivation, this study used a seven-point Likert scale – ‘extremely decreased’, ‘considerably decreased’, ‘somewhat decreased’, ‘unchanged’, ‘somewhat increased’, ‘considerably increased’ and ‘extremely increased’ – and employed two definitions: definition I regarded the response of ‘unchanged’ as acceptable, whereas definition II regarded it as unacceptable. We identified the maximum acceptable physical activity increase from capability, opportunity and motivation simultaneously by combining the upper limit of acceptable time for three sub-components.
Sociodemographic factors
This study measured gender (men, women), age (years), current marital status (unmarried, married), current working status (non-workers, part-time workers, full-time workers), educational background (>4-year college, 2-year college, high school, junior high school), annual household income (Japanese yen [JPY]; ⩾10m, <10m, <8m, <6m, <4m, <2m), and current physical activity duration (min per day) as the sociodemographic factors. In accordance with the formats for acceptable physical activity increases and current recommendations by the Japanese ministry, this study measured the current physical activity duration using a single item that asked participants to indicate the time spent in moderate-to-vigorous physical activity on a usual day. Currently, physical activity questionnaires created on a daily basis are unavailable in Japan. Thus, we developed this item. Because it was unconfirmed whether the relationship between the current physical activity duration and the maximum acceptable physical activity increase was linear or non-linear, this study categorized the response of this item. As the majority of the individuals responded that they engaged in it under 60 min per day (mean (95% confidence interval (CI)), 41.3 (38.7–44.0) min; standard deviation, 64.5 min), this study categorized the response into 11 groups: 0 min, 1–9 min, 10–19 min, 20–29 min, 30–39 min, 40–49 min, 50–59 min, 60–79 min, 80–99 min, and ≥100 min per day.
Analyses
This study employed multiple regression analyses. The dependent variable of the main analysis was the maximum acceptable physical activity increase from capability, opportunity and motivation simultaneously. Additional analyses were conducted to set maximum acceptable physical activity increase from capability, opportunity and motivation separately as the dependent variables. All sociodemographic factors were included in the models as independent variables using the forced-entry method. As the variance inflation factor of independent variables was 1.05 to 3.16 and Pearson’s correlation coefficients within the independent variables were −0.47 to 0.23, we did not consider multicollinearity as a critical issue.
As an online questionnaire survey was conducted, there were no missing data. Statistical significance was set at p < 0.05. IBM SPSS Statistics 25 for Windows was used for all the analyses.
Results
Sociodemographic characteristics of respondents
Of the respondents, 48.9% were men and 51.1% were women. The mean age was 44.6 years. Other sociodemographic characteristics are summarized in Supplementary Table 1.
Level of maximum acceptable physical activity increase
Supplementary Figure 2 shows the distribution of acceptable physical activity increases according to capability, opportunity and motivation at each time point. Table 1 indicates the mean and standard deviation of the maximum acceptable physical activity increase from 1) capability; 2) opportunity; 3) motivation; and 4) capability, opportunity and motivation simultaneously. Combining three subcomponents simultaneously, average respondents maximally accepted 17.0 (definition I: standard deviation (SD), 16.9; 95% CI, 16.3, 17.7) or 9.0 (definition II: SD, 13.9; 95% CI, 8.4, 9.6) min of physical activity increase per day.
Means and standard deviations of maximum acceptable physical activity increases.
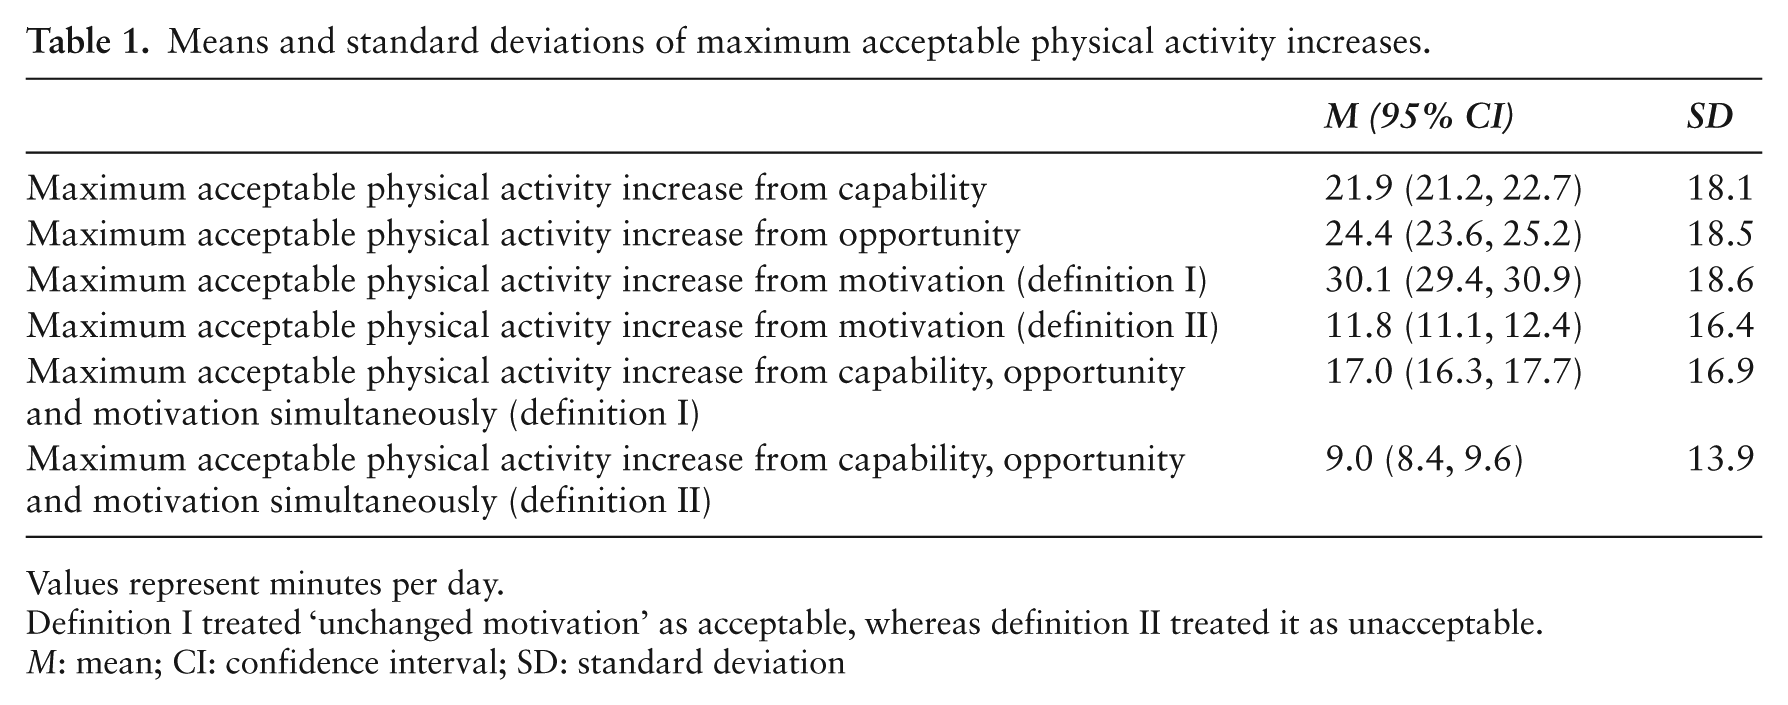
Values represent minutes per day.
Definition I treated ‘unchanged motivation’ as acceptable, whereas definition II treated it as unacceptable.
M: mean; CI: confidence interval; SD: standard deviation
Sociodemographic correlates of maximum acceptable physical activity increase
Supplementary Tables 2–4 and Table 2 show the results of the multiple regression analyses for sociodemographic correlates of the maximum acceptable physical activity increase from capability (Supplementary Table 2), opportunity (Supplementary Table 3), motivation (Supplementary Table 4) and combining the three subcomponents simultaneously (Table 2). As shown in Table 2, in both definitions, older age (Β (95% CI) in definition I and Β (95% CI) in definition II; 30–39 years, −2.9 (−5.2, −0.6) or −3.0 (−4.9, −1.1); 40–49 years, −4.3 (−6.4, −2.1) or −4.0 (−5.8, −2.1); 50–59 years, −3.9 (−6.1, −1.7) or −4.0 (−5.8, −2.1); 60–64 years, −3.1 (−5.8, −0.5) or −3.9 (−6.2, −1.7)) and lower household income (<4m, -3.9 [-6.7, -1.1] or -2.9 [-5.3, -0.6]; <2m, -4.0 [-7.1, -1.0] or -3.7 [-6.3, -2.1]) were significantly associated with a shorter maximum aceptable physical activity increase from capability, opportunity, and motivation simultaneously. Longer current physical activity duration ( 10-19 min, 3.5 [1.2, 5.8] or 2.0 [0.1, 4.0]; 20-29 min, 6.0 [3.0, 8.9] or 2.5 [-0.0, 5.1]; 30-39 min, 7.2 [5.1, 9.3] or 3.1 [1.3, 4.9]; 40-49 min, 7.0 [3.2, 10.8] or 2.9 [-0.3, 6.2]; 50-59 min, 8.8 [2.7, 14.8] or 5.3 [0.2, 10.5]; 60-79 min, 12.0 [9.7, 14.3] or 4.6 [2.7, 6.5]; 80-99 min, 15.0 [10.0, 20.1] or 5.3 [1.0, 9.6]; 100 min, 13.9 [11.3, 16.5] or 5.7 [3.5, 7.9]) was significantly associated with a longer maximum acceptable physical activity increase from capability, opportunity, and motivation simultaneously in both definitions. Furthermore, being married (1.8 [0.4, 3.1]) was associated with a longer time in maximum acceptable physical activity increase from capability, opportunity, and motivation simultaneously in definition II but not in definition I.
Multiple regression analyses for sociodemographic correlates of maximum acceptable physical activity increase from capability, opportunity and motivation simultaneously.
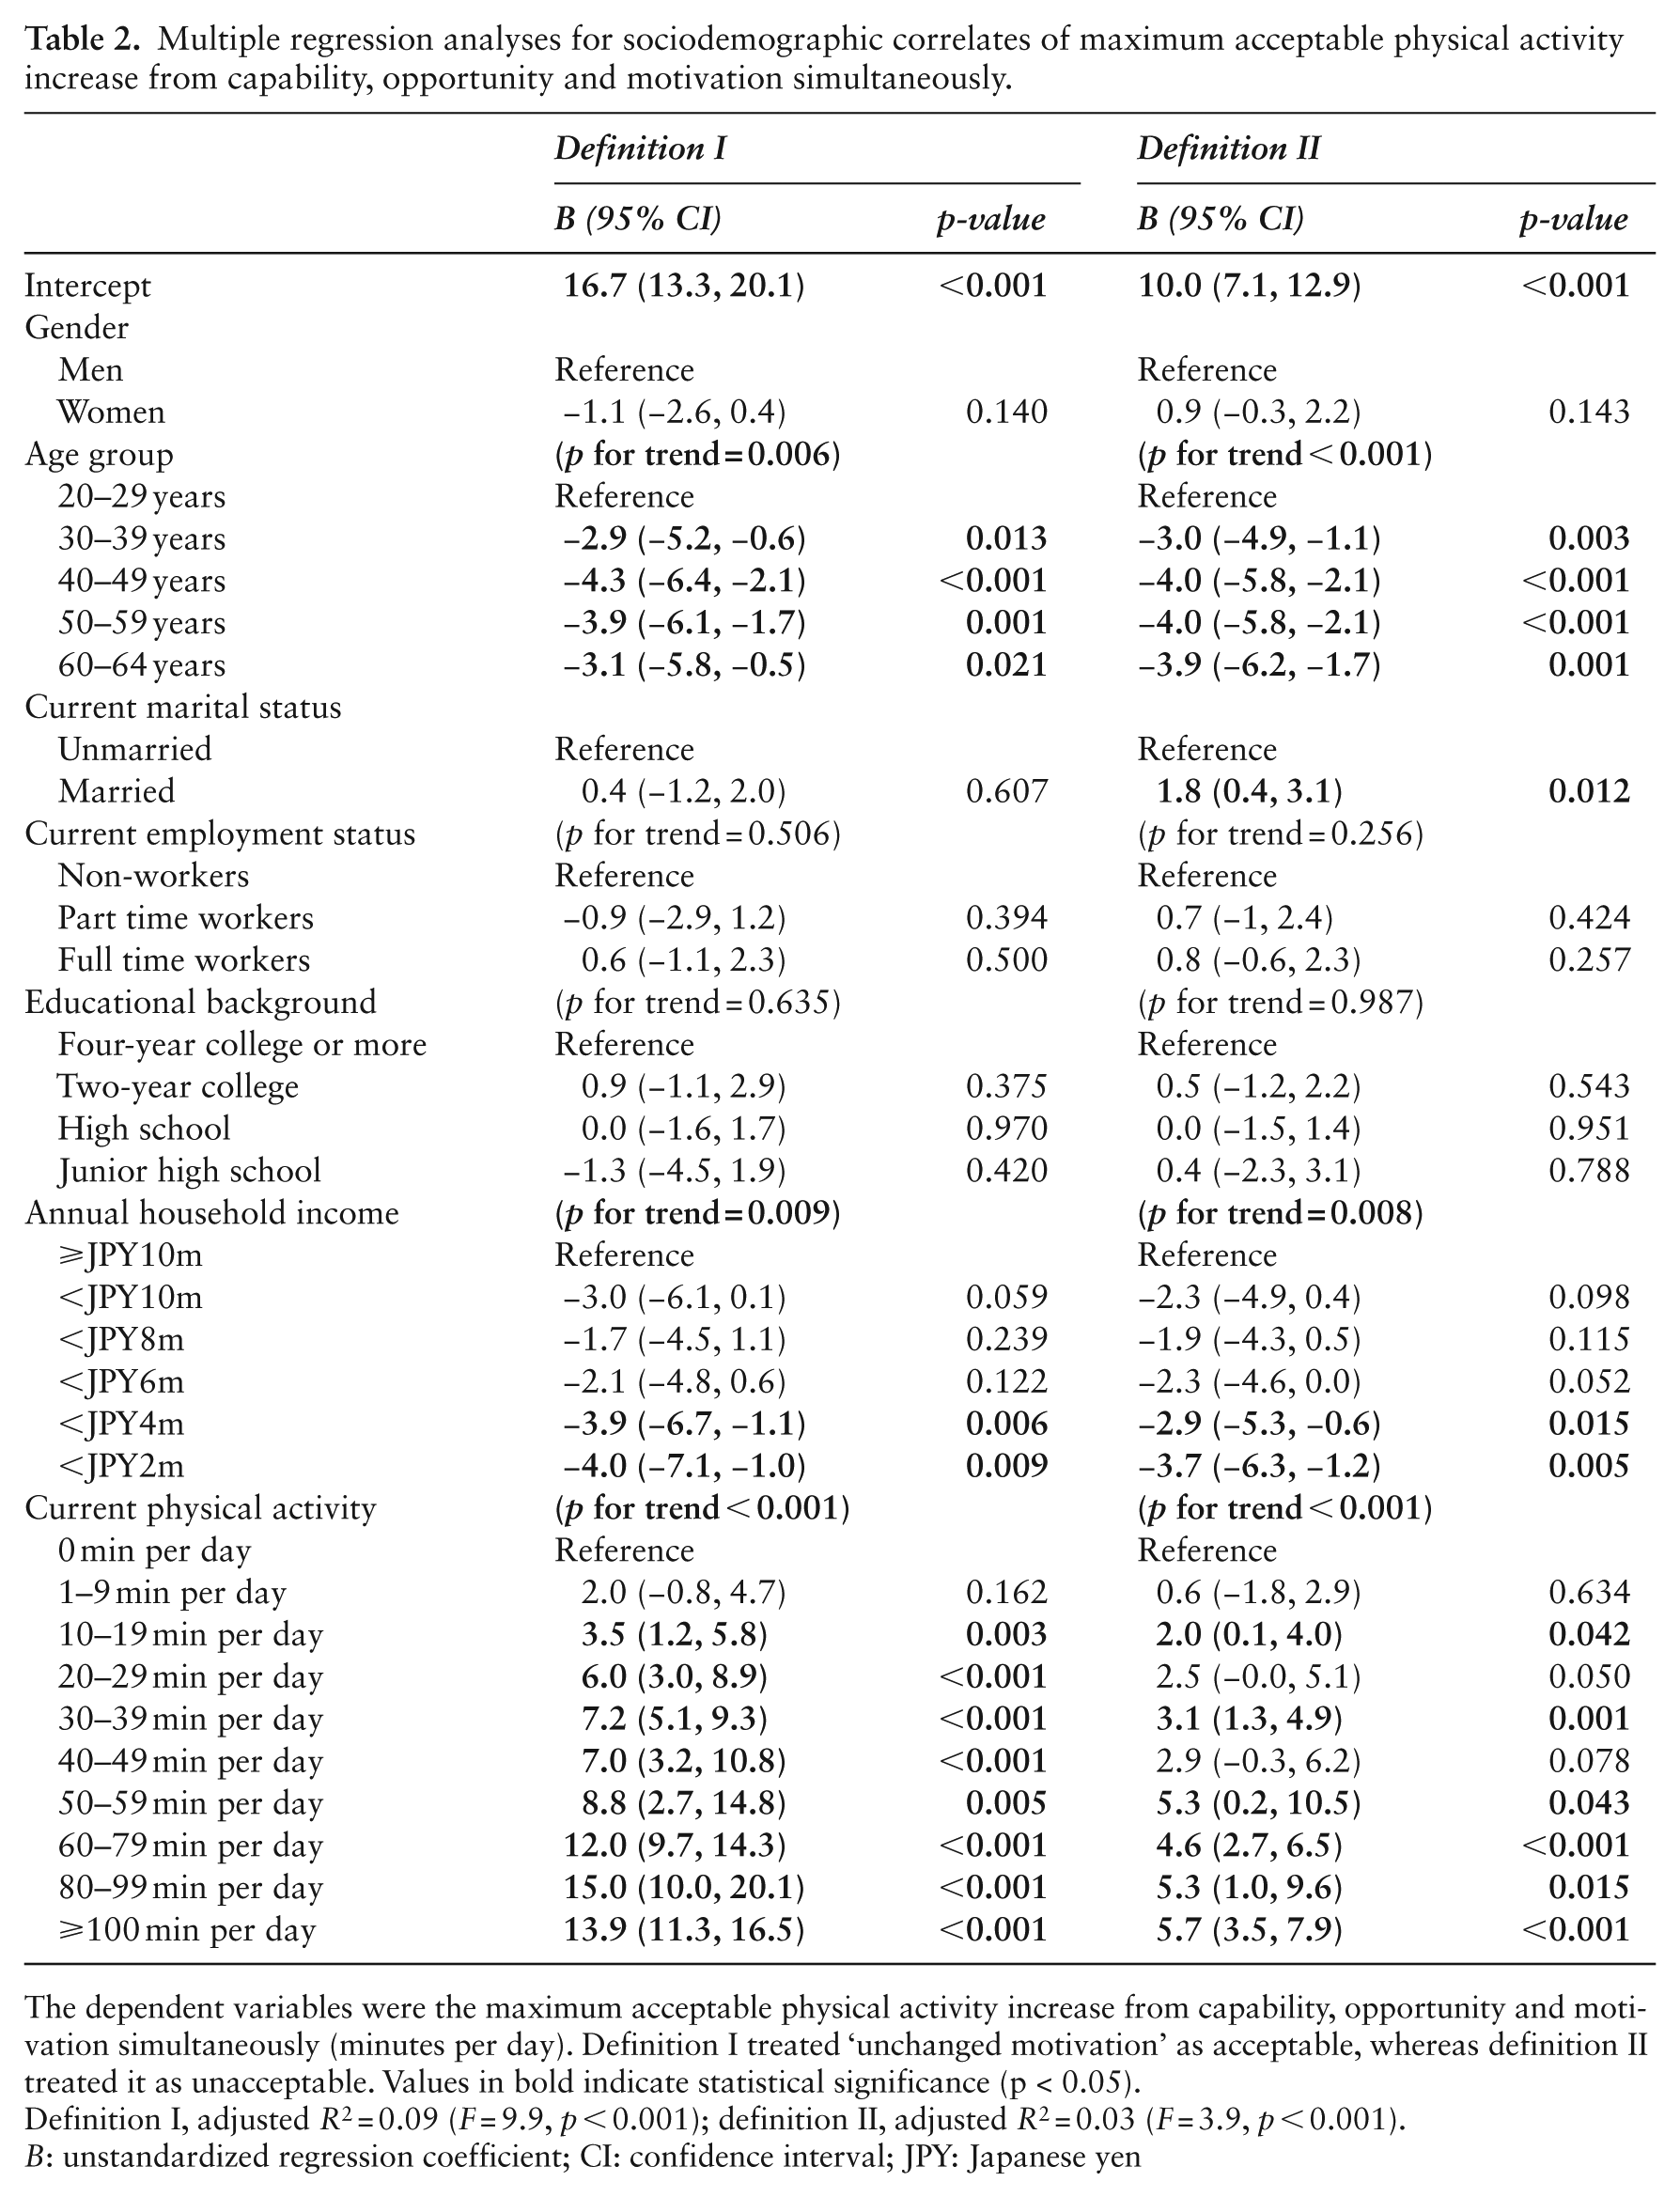
The dependent variables were the maximum acceptable physical activity increase from capability, opportunity and motivation simultaneously (minutes per day). Definition I treated ‘unchanged motivation’ as acceptable, whereas definition II treated it as unacceptable. Values in bold indicate statistical significance (p < 0.05).
Definition I, adjusted R2 = 0.09 (F = 9.9, p < 0.001); definition II, adjusted R2 = 0.03 (F = 3.9, p < 0.001).
B: unstandardized regression coefficient; CI: confidence interval; JPY: Japanese yen
Discussion
This study found that the mean values for maximum acceptable physical activity increases from capability, opportunity and motivation simultaneously were 9.0 or 17.0 min per day among the respondents. This finding indicates that an increase of approximately 10–15 min per day might be an important option in goal setting for physical activity among the Japanese population. Although previous studies have not captured the acceptance of overall physical activity, they have frequently reported the acceptance of distance or duration for walking behavior, which is the most popular style of physical activity (29). In particular, previous studies have reported that: the maximum acceptable walking distance is 1.16 km among the average Japanese older population (25); 73% of US adults regard walking trips up to 10 min as reasonable (27); the mean easy walking duration is 14.8 min among US adolescent girls; and the acceptable walking duration and distance are 9.48–23.33 min or 450–894 m among Indians. Thus, the maximum acceptance levels for the overall increase in physical activity in this study are comparable to the levels specified for walking in previous studies (22,25,27,28). As the average duration of one walking trip is 9.0–14.9 min (37–39), the results of this study imply that average people might accept the increase of one more walking trip in a day. Furthermore, the results support that the campaign message ‘Plus Ten’ (adding 10 min of physical activity in a day) by the Japanese ministry (5–7) would be reasonable as the goal setting at the national level. Although this campaign has been implemented since 2013 (5), the scientific basis of setting a 10-min increase in daily physical activity time for the entire Japanese population, instead of other time lengths, has not been confirmed. This study provides a scientific basis for this campaign message for the entire Japanese population.
Regardless of the definitions of motivation, this study also showed that the maximum acceptable physical activity increase was likely to be higher among those with a younger age, higher household income and longer duration of current physical activity. As a scoping review proposes (40), developing targeted physical activity messages is more effective than generic messages. The findings of this study help to develop targeted physical activity messages by sociodemographic subgroups and indicate that the differences by age, household income and current physical activity levels should be considered in goal settings for physical activity. Setting higher goals, such as a 15- or 20-min increase in daily physical activity time, would be feasible for younger adults, adults with higher household income and physically active adults. In contrast, for middle-aged adults, adults with low household income and physically inactive adults, setting lower goals, such as a 5- or 7-min increase in the daily physical activity time, would be feasible at the initial phase, followed by gradually elevating goals. The current campaign by the Japanese ministry divides the Japanese population into only three groups, children, adults and older adults, and recommends a 10-min increase in the daily physical activity time for all three groups as the generic message (6). Based on the findings of this study, dividing the adult group and providing different messages (e.g. higher goals for younger adults and lower goals for middle-aged adults) might be more effective in promoting physical activity at the national level. One potential reason for the significant correlation between younger age and higher household income with greater maximum acceptable increases in maximum acceptable physical activity might be that those with younger age (41) and higher household income (42) tend to have higher subjective well-being. Higher subjective well-being is linearly associated with greater acceptance of self (43), aggressor (44), chronic illness (45) and the culture of new places (46). Along with these factors, a dose–response relationship might exist between higher subjective well-being and more acceptance of physical activity increase. Another potential reason for their significant correlation might be that environmental factors differ by age and household income levels. Environmental factors are conceptually overlapped with the maximum acceptable physical activity increase from opportunity. Previous studies have reported that there are age differences in the patterns of perceived neighborhood walkability (47), and socio-economically higher areas tend to show higher walkability (48). Environmental factors, such as walkability, might link age and household income levels with the maximum acceptable physical activity increase. Regarding the positive associations between current physical activity levels and the maximum acceptable increase in physical activity, this study supports the findings of a previous study that reported a positive association with walking behavior (27). From the present and previous studies (27), physically active people might easily find more room to increase their physical activity, thereby exhibiting higher levels of maximum acceptable physical activity increase. Sociodemographic factors would be insufficient to comprehensively explain the individual differences in the maximum acceptable physical activity increase, considering the low values of regression coefficients and adjusted R2 squares. Other factors, including subjective well-being and environmental factors, might explain the individual differences more predominantly.
The major strength of this study was the measurement of acceptable physical activity increases based on capability, opportunity and motivation from the COM-B model (30). Their measurement strengthens the theoretical basis of this study. However, this study had limitations. First, the validity and reliability of the measures of acceptable physical activity increases and current physical activity duration were unconfirmed. Second, because this study prioritized adherence to Japanese domestic guidelines (4), acceptable physical activity increases and current physical activity duration were measured daily rather than weekly, which is not consistent with the WHO recommendations (3). Third, this study has a selection bias. Although >80% of Japanese adults aged 20–69 years use the Internet (49), generalizability of the findings to non-users or light users of the Internet is unclear. Fourth, as discussed above, we did not collect the data on subjective well-being and environmental factors. Fifth, this study excluded older adults aged 65 years and above. This was because selection bias in online questionnaire surveys would be more critical for them because the prevalence of Internet users decreases with age in Japan (49). Sixth, this study did not differentiate the four domains of physical activity of leisure-time, occupation, household and transportation (3). The levels and combinations of sources of the maximum acceptable physical activity increase would differ by its domains. Finally, the present study considered only the perception of the maximum acceptable physical activity increase, thereby not examining the limits of the actual physical activity increase. Nonetheless, this study contributes to the establishment of better methodologies for goal setting to increase physical activity. It also offers valuable insights for designing targeted physical activity interventions tailored to specific sociodemographic groups, potentially leading to more effective public health campaigns.
In conclusion, this study found that the mean values of maximum acceptable physical activity increases were 9.0–17.0 min per day and were higher among those with younger age, higher household income and longer current physical activity duration, among Japanese people. An increase of approximately 10–15 min per day might be an important option in goal setting, and setting higher goals would be feasible for younger adults, adults with higher household incomes and physically active adults.
Supplemental Material
sj-docx-1-ped-10.1177_17579759251370984 – Supplemental material for Level and sociodemographic correlates of maximum acceptable physical activity increase among Japanese adults
Supplemental material, sj-docx-1-ped-10.1177_17579759251370984 for Level and sociodemographic correlates of maximum acceptable physical activity increase among Japanese adults by Kazuhiro Harada, Takayuki Tajima, Yoshinobu Saito, Noriko Takeda and Yuko Oguma in Global Health Promotion
Supplemental Material
sj-docx-2-ped-10.1177_17579759251370984 – Supplemental material for Level and sociodemographic correlates of maximum acceptable physical activity increase among Japanese adults
Supplemental material, sj-docx-2-ped-10.1177_17579759251370984 for Level and sociodemographic correlates of maximum acceptable physical activity increase among Japanese adults by Kazuhiro Harada, Takayuki Tajima, Yoshinobu Saito, Noriko Takeda and Yuko Oguma in Global Health Promotion
Supplemental Material
sj-docx-3-ped-10.1177_17579759251370984 – Supplemental material for Level and sociodemographic correlates of maximum acceptable physical activity increase among Japanese adults
Supplemental material, sj-docx-3-ped-10.1177_17579759251370984 for Level and sociodemographic correlates of maximum acceptable physical activity increase among Japanese adults by Kazuhiro Harada, Takayuki Tajima, Yoshinobu Saito, Noriko Takeda and Yuko Oguma in Global Health Promotion
Supplemental Material
sj-docx-4-ped-10.1177_17579759251370984 – Supplemental material for Level and sociodemographic correlates of maximum acceptable physical activity increase among Japanese adults
Supplemental material, sj-docx-4-ped-10.1177_17579759251370984 for Level and sociodemographic correlates of maximum acceptable physical activity increase among Japanese adults by Kazuhiro Harada, Takayuki Tajima, Yoshinobu Saito, Noriko Takeda and Yuko Oguma in Global Health Promotion
Supplemental Material
sj-docx-5-ped-10.1177_17579759251370984 – Supplemental material for Level and sociodemographic correlates of maximum acceptable physical activity increase among Japanese adults
Supplemental material, sj-docx-5-ped-10.1177_17579759251370984 for Level and sociodemographic correlates of maximum acceptable physical activity increase among Japanese adults by Kazuhiro Harada, Takayuki Tajima, Yoshinobu Saito, Noriko Takeda and Yuko Oguma in Global Health Promotion
Supplemental Material
sj-docx-6-ped-10.1177_17579759251370984 – Supplemental material for Level and sociodemographic correlates of maximum acceptable physical activity increase among Japanese adults
Supplemental material, sj-docx-6-ped-10.1177_17579759251370984 for Level and sociodemographic correlates of maximum acceptable physical activity increase among Japanese adults by Kazuhiro Harada, Takayuki Tajima, Yoshinobu Saito, Noriko Takeda and Yuko Oguma in Global Health Promotion
Supplemental Material
sj-docx-7-ped-10.1177_17579759251370984 – Supplemental material for Level and sociodemographic correlates of maximum acceptable physical activity increase among Japanese adults
Supplemental material, sj-docx-7-ped-10.1177_17579759251370984 for Level and sociodemographic correlates of maximum acceptable physical activity increase among Japanese adults by Kazuhiro Harada, Takayuki Tajima, Yoshinobu Saito, Noriko Takeda and Yuko Oguma in Global Health Promotion
Supplemental Material
sj-docx-8-ped-10.1177_17579759251370984 – Supplemental material for Level and sociodemographic correlates of maximum acceptable physical activity increase among Japanese adults
Supplemental material, sj-docx-8-ped-10.1177_17579759251370984 for Level and sociodemographic correlates of maximum acceptable physical activity increase among Japanese adults by Kazuhiro Harada, Takayuki Tajima, Yoshinobu Saito, Noriko Takeda and Yuko Oguma in Global Health Promotion
Footnotes
Data availability statement
The data that support the findings of this study are available from the corresponding author upon reasonable request.
Declaration of conflicting interests
The authors have no conflicts of interest to declare.
Funding
The authors disclosed receipt of the following financial support for the research, authorship, and/or publication of this article: This work was supported by the MHLW Program Grant Number JPMH22FA1004 from Ministry of Health, Labour, and Welfare of Japan.
Supplemental material
Supplemental material for this article is available online.
References
Supplementary Material
Please find the following supplemental material available below.
For Open Access articles published under a Creative Commons License, all supplemental material carries the same license as the article it is associated with.
For non-Open Access articles published, all supplemental material carries a non-exclusive license, and permission requests for re-use of supplemental material or any part of supplemental material shall be sent directly to the copyright owner as specified in the copyright notice associated with the article.