
Abstract
Introduction
The influence of pain and a concomitant digital nerve injury on the course of rehabilitation after flexor tendon injury remains ambiguous. The objectives of the study were to: i) analyse the evolution of pain spanning one year after a primary flexor tendon repair in zones 1–3; ii) examine the differences in pain levels in patients with and without digital nerve injury; and iii) evaluate the relationship between pain, digital nerve injury and pain medication, total active motion (TAM), DASH scores and patient satisfaction.
Methods
Data from 189 patients were retrieved from a flexor tendon registry between 2014 and 2020. Differences in pain, TAM, DASH and patient satisfaction were analysed. Multiple linear and binary logistic regression analyses were performed to determine the relationship between clinical outcomes.
Results
Pain significantly decreased in the course of rehabilitation (p < 0.001 to 0.006). No relationship could be identified between nerve injury and pain (p = 0.21–0.97). In week 6, the presence of pain and a nerve injury were significantly associated with lower TAM scores (p = 0.001). In week 13, pain during motion (p < 0.001) and the presence of a nerve injury (p = 0.036) were significantly associated with worse DASH scores. Patient satisfaction was significantly inversely correlated to pain during motion in weeks 13 and 26 (p < 0.001).
Conclusion
We found a significant relationship between pain during motion and pain medication intake, TAM, DASH scores and patient satisfaction. It is therefore advisable to closely monitor this parameter after flexor tendon injuries.
Study registration
This multi-center cohort study is registered under https://clinicaltrials.gov: NCT04312412.
Introduction
Flexor tendon injuries of the hand are relatively common but demanding injuries for both the patient and the clinical hand therapist.1,2 From the patient’s perspective, former experiences, limited hand use, and anxiety linked to concerns regarding permanent functional loss and pain may impact recovery after injury. 3 The therapists’ expertise during the different rehabilitation regimens is fundamental to safely guiding the patients through the recovery process, in conjunction with a continuous and standardized measurement of the treatment outcomes.4–6 In this day and age, patient-reported outcome measures (PROMs), such as satisfaction with treatment results and pain should be documented in support of clinician-reported outcome measures (CROMs), such as grip and pinch strength or range of motion. 7 The patient’s perceived level of pain is an important factor that guides the therapeutic process and may delay or even hinder the recovery of finger motion and resumption of daily activities. Pain is defined as “an unpleasant sensory and emotional experience associated with, or resembling that associated with, actual or potential tissue damage,” (p 1976). 8 However, pain after surgery is described as a sequela to an inflammatory process and isolated injury to nerves. 9 It can be expected to be controlled and resolved within one week post-surgery. 10 To better understand the course of pain after flexor tendon surgery, it is imperative for a hand therapist to routinely document and address both pain at rest and pain caused by movement during rehabilitation. Pain triggered by movement, for example, could be caused by tissue damage, potentially getting better over time, while pain at rest might be caused by nerve laceration or tissue inflammation. Therefore, pain may potentially hinder active range of motion (aROM) as well as generating an emotional burden for the patient.
Concomitant digital nerve injury occurs in 25%–43% of flexor tendon lacerations in zones 1–3.1,11–14 Previous studies on the outcome after flexor tendon repair reported contradictory results on the association between concomitant nerve lacerations and different CROMs and PROMs.12–15 For example, Trumble et al. 12 stated that a concomitant nerve injury resulted in reduced aROM and worse patient satisfaction, while Rigo and Røkkum, 15 Rosberg et al. 11 and Keane et al. 16 concluded that a nerve injury had no influence on the functional recovery. However, it remains unclear if a concomitant digital nerve injury affects pain. Although there is an emphasis on addressing pain during the course of rehabilitation, 17 the distinction between pain at rest and during motion has often been neglected in the past. Therefore, the primary purpose of this study was to document how pain at rest and during motion changes over the course of recovery after primary flexor tendon repairs in zones 1–3. The secondary objective was to explore if there is a difference in the level of pain at rest and during motion in patients with and without a concomitant digital nerve injury in weeks 1, 2, 3, 6, 13, 26, and 52. The third objective was to evaluate if pain medication intake, total active motion (TAM), self-defined functional recovery and patient satisfaction were affected by the level of pain or by the presence of a concomitant digital nerve injury during the first year after surgery.
Methods
The participants of this retrospective cohort study represent a subgroup of patients from a Swiss flexor tendon registry who were treated at three public university hospitals since 2014. Inclusion criteria were: (i) signed informed consent, (ii) aged between 18 and 75 years, (iii) primary finger flexor tendon injury in zones 1–3, (iv) ≥50% of the flexor digitorum profundus (FDP) tendon injured, treated (v) with an immediate active motion regime (CAM) using a long dorsal dorsal-blocking splint with the wrist in 20° of extension, and the MCPs in 40° of flexion, (vi) in one of the three hand therapy units of the participating hospitals. Data were analyzed from January 2014 to December 2020 and only if ≥80% of data relating to pain and pain medication were present. Therapy started within 2–5 days after surgery. All patients were prescribed oral pain medication (paracetamol and metamizole) and instructed by their hand surgeon to take them in a standardized manner. Concomitant injuries to digital nerves that underwent surgery did not alter the therapy protocol. Exclusion criteria were the presence of (i) concomitant fractures (e.g. avulsion fracture of FDP), (ii) laceration of FPL, (iii) diagnosis of rheumatological conditions, (iv) more than one finger involved and (v) finger replantation.
Data collection
Clinical data were routinely collected from week 1 up to one-year post-surgery during hand therapy visits in one of the three clinics by occupational and physical therapists specialized in hand therapy. Pain (at rest and during motion) was collected in weeks 1, 2, 3, 6, 13, 26 and 52; aROM in weeks 6, 13, 26 and 52; patient satisfaction, self-reported physical functioning, and symptoms in weeks 13, 26 and 52.
Patient-reported outcome measures
Verbal Numeric Rating Scale (VNRS)
In our hand therapy units, we use the Verbal Numeric Rating Scale as a more practical alternative for assessing pain at rest and during motion in everyday clinical practice instead of the ‘gold standard’ Visual Analogue Scale (VAS). It is rapid, requires no instruments and does not require intact motor skills. The VNRS has demonstrated that it correlates well with the VAS (r = 0.95, 95% CI 0.94–0.96) and it is as sensitive for detecting clinically important changes in pain. 18 The minimum clinically important difference (MCID) in VNRS for acute pain is 1.4 points (95% CI 1.2–1.6), 18 being slightly lower than the established MCID in a non-shoulder hand and upper extremity postoperative population after elective hand surgery (range between 1.6 and 1.9 points on the VAS). 19 Patients were asked to score their pain on the VNRS from zero to 10 with zero indicating “no pain” and 10 indicating “worst pain imaginable.” The scores are interpreted as: “no pain” (0), “mild pain” (1–3), “moderate pain” (4–6), “severe pain” (7–10).20,21 In addition, patients were asked each week if they had taken pain medication or not (“yes” or “no” questions without further indication of the kind and dosage of medication).
Patient satisfaction
We asked our patients to respond to the following question: “Today, how satisfied are you with your hand in general?” on an 11-point Likert scale ranging from 0 to 10 (10 indicating maximum satisfaction).
Self-reported questionnaire regarding physical function and symptoms (DASH)
The Disabilities of the Arm, Shoulder and Hand Outcome Measure is a 30-item, self-reported questionnaire designed to measure physical functioning and symptoms in patients with single or multiple musculoskeletal disorders of the upper limb. 22 Scores range from 0 (no disability) to 100 (completely disabled). The MCID of the DASH after hand surgical interventions ranges from 10.8 to 18.8 points. 19
Clinician-reported outcome measures
Active range of motion (aROM) and ability to reach the palm of the hand
Measurement of finger joint mobility was assessed using manual goniometry. The total active motion (TAM) was calculated as the sum of degrees patients can actively flex and extend their proximal and distal interphalangeal joints. Then, the TAM scores were transferred to the proposed classification system by Tang, 17 where the return of motion is expressed in percentages to the contralateral hand: 1 = “excellent” (90–100%), 2 = “good” (70–89%), 3 = “fair” (50–69%), 4 = “poor” (30–49%) and 5 = “failure” (<30%). Fingertip to palm mobility of the injured finger, where a ‘touch-down’ was defined as the affected fingertip touching the palm, was noted as “yes” or “no” by the therapist.
Data analysis
Demographics were analyzed using descriptive statistics. Means and standard deviations (SD), medians and interquartile ranges (IQR) for continuous variables and percentages for categorical variables were computed. As the Shapiro-Wilk test did not show a normal distribution of pain at rest and during motion, the non-parametric Friedman test was applied to calculate differences between all seven measurement time points for pain at rest and during motion, followed by post-hoc tests (Wilcoxon-sign-rank-test with Bonferroni adjustment). Small, medium and large effect sizes (ES) were calculated as d = 0.20, 0.50, and 0.80. 23 Differences in the level of pain at rest and during motion in patients with and without a concomitant digital nerve injury were evaluated for each of the seven measurement time points using the Mann-Whitney U-test. Blockwise multiple linear and binary logistic regression models were performed to determine the relationship between pain at rest and during motion (block 1) and the presence of a nerve injury (block 2) on pain medication intake, TAM scores, touch-down, DASH and satisfaction scores. One model was calculated per measurement time point, using the corresponding outcomes from that time point (e.g. level of pain at week 6 and TAM scores at week 6). Statistical significance was set at p ≤ 0.05. The guidelines from Strengthening the Reporting of Observational Studies in Epidemiology (STROBE) Statement were used for this study. 24
Results
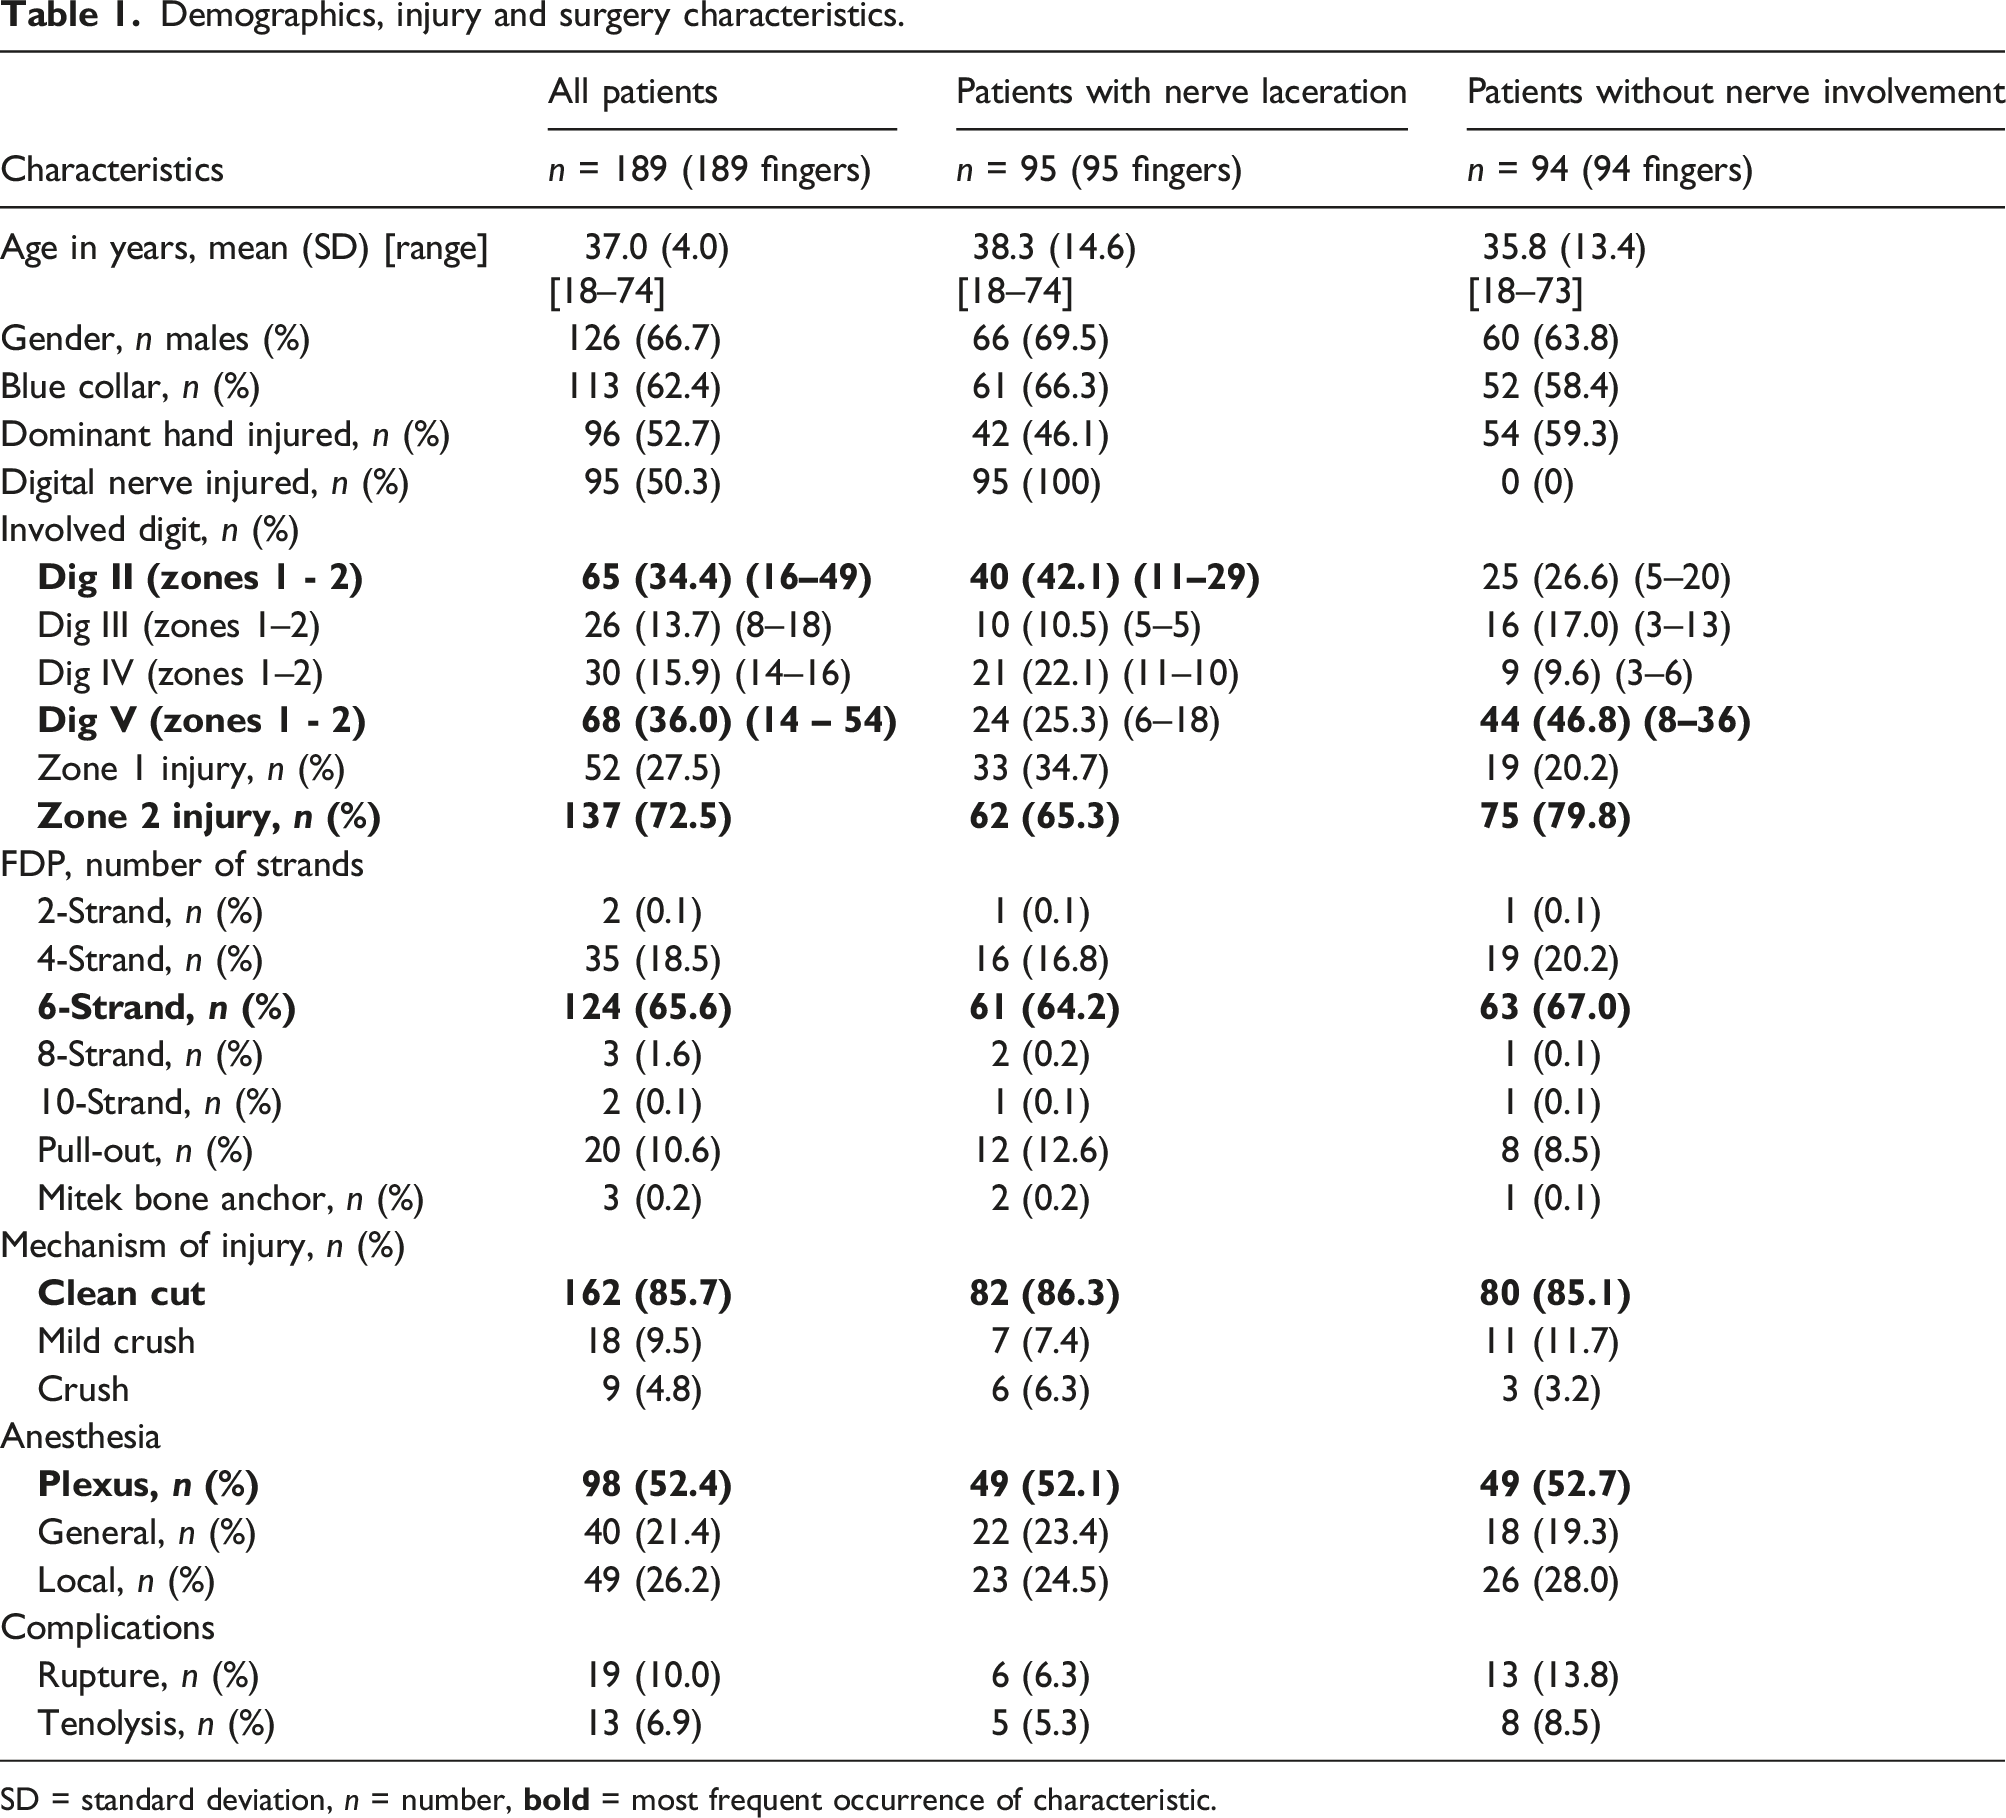
Of the 308 participants in the data pool, 189 patients were included in this study and further divided into two subgroups: with and without concomitant digital nerve laceration (Figure 1). 72.5% of injuries occurred in zone 2 and 27.5% in zone 1. All zone 3 injuries in the data pool (n = 38) did not fulfil the inclusion criteria. Demographics, injury and surgery characteristics are presented in Table 1. Study flow chart. Demographics, injury and surgery characteristics. SD = standard deviation, n = number, 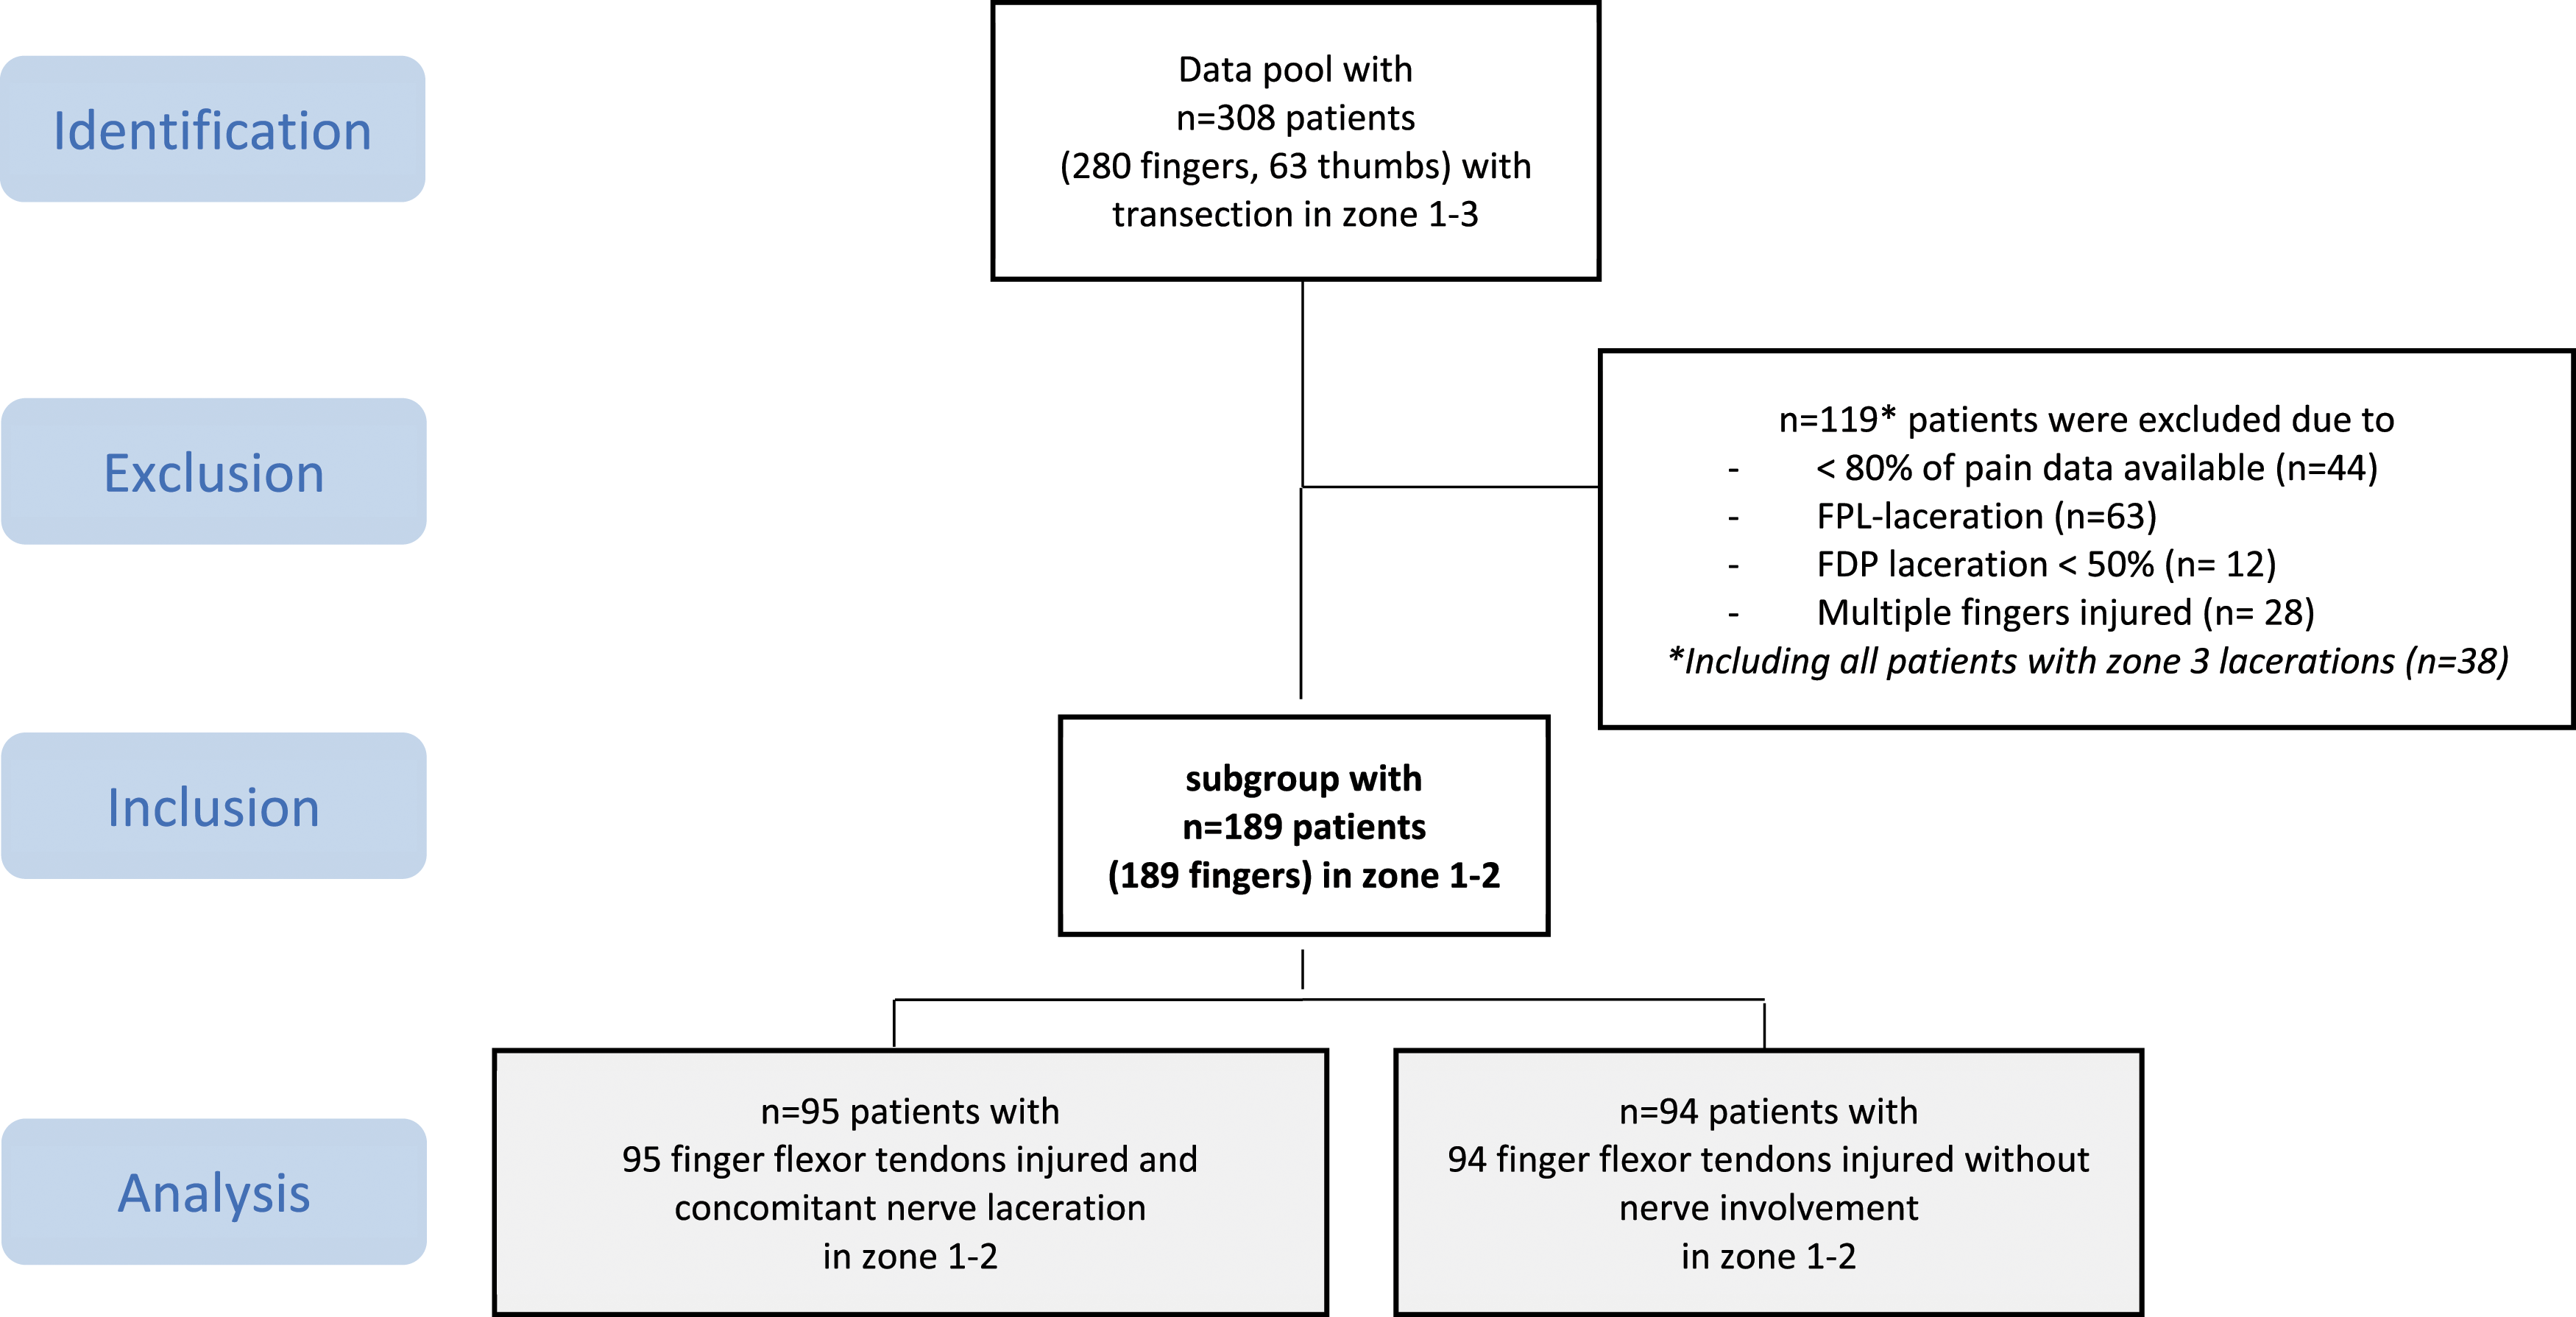
Change of pain at rest and pain during motion over the course of rehabilitation
Median and mean pain scores at rest and while moving in all patients and subgroups with differences between subgroups (Mann-Whitney-U-Scores).
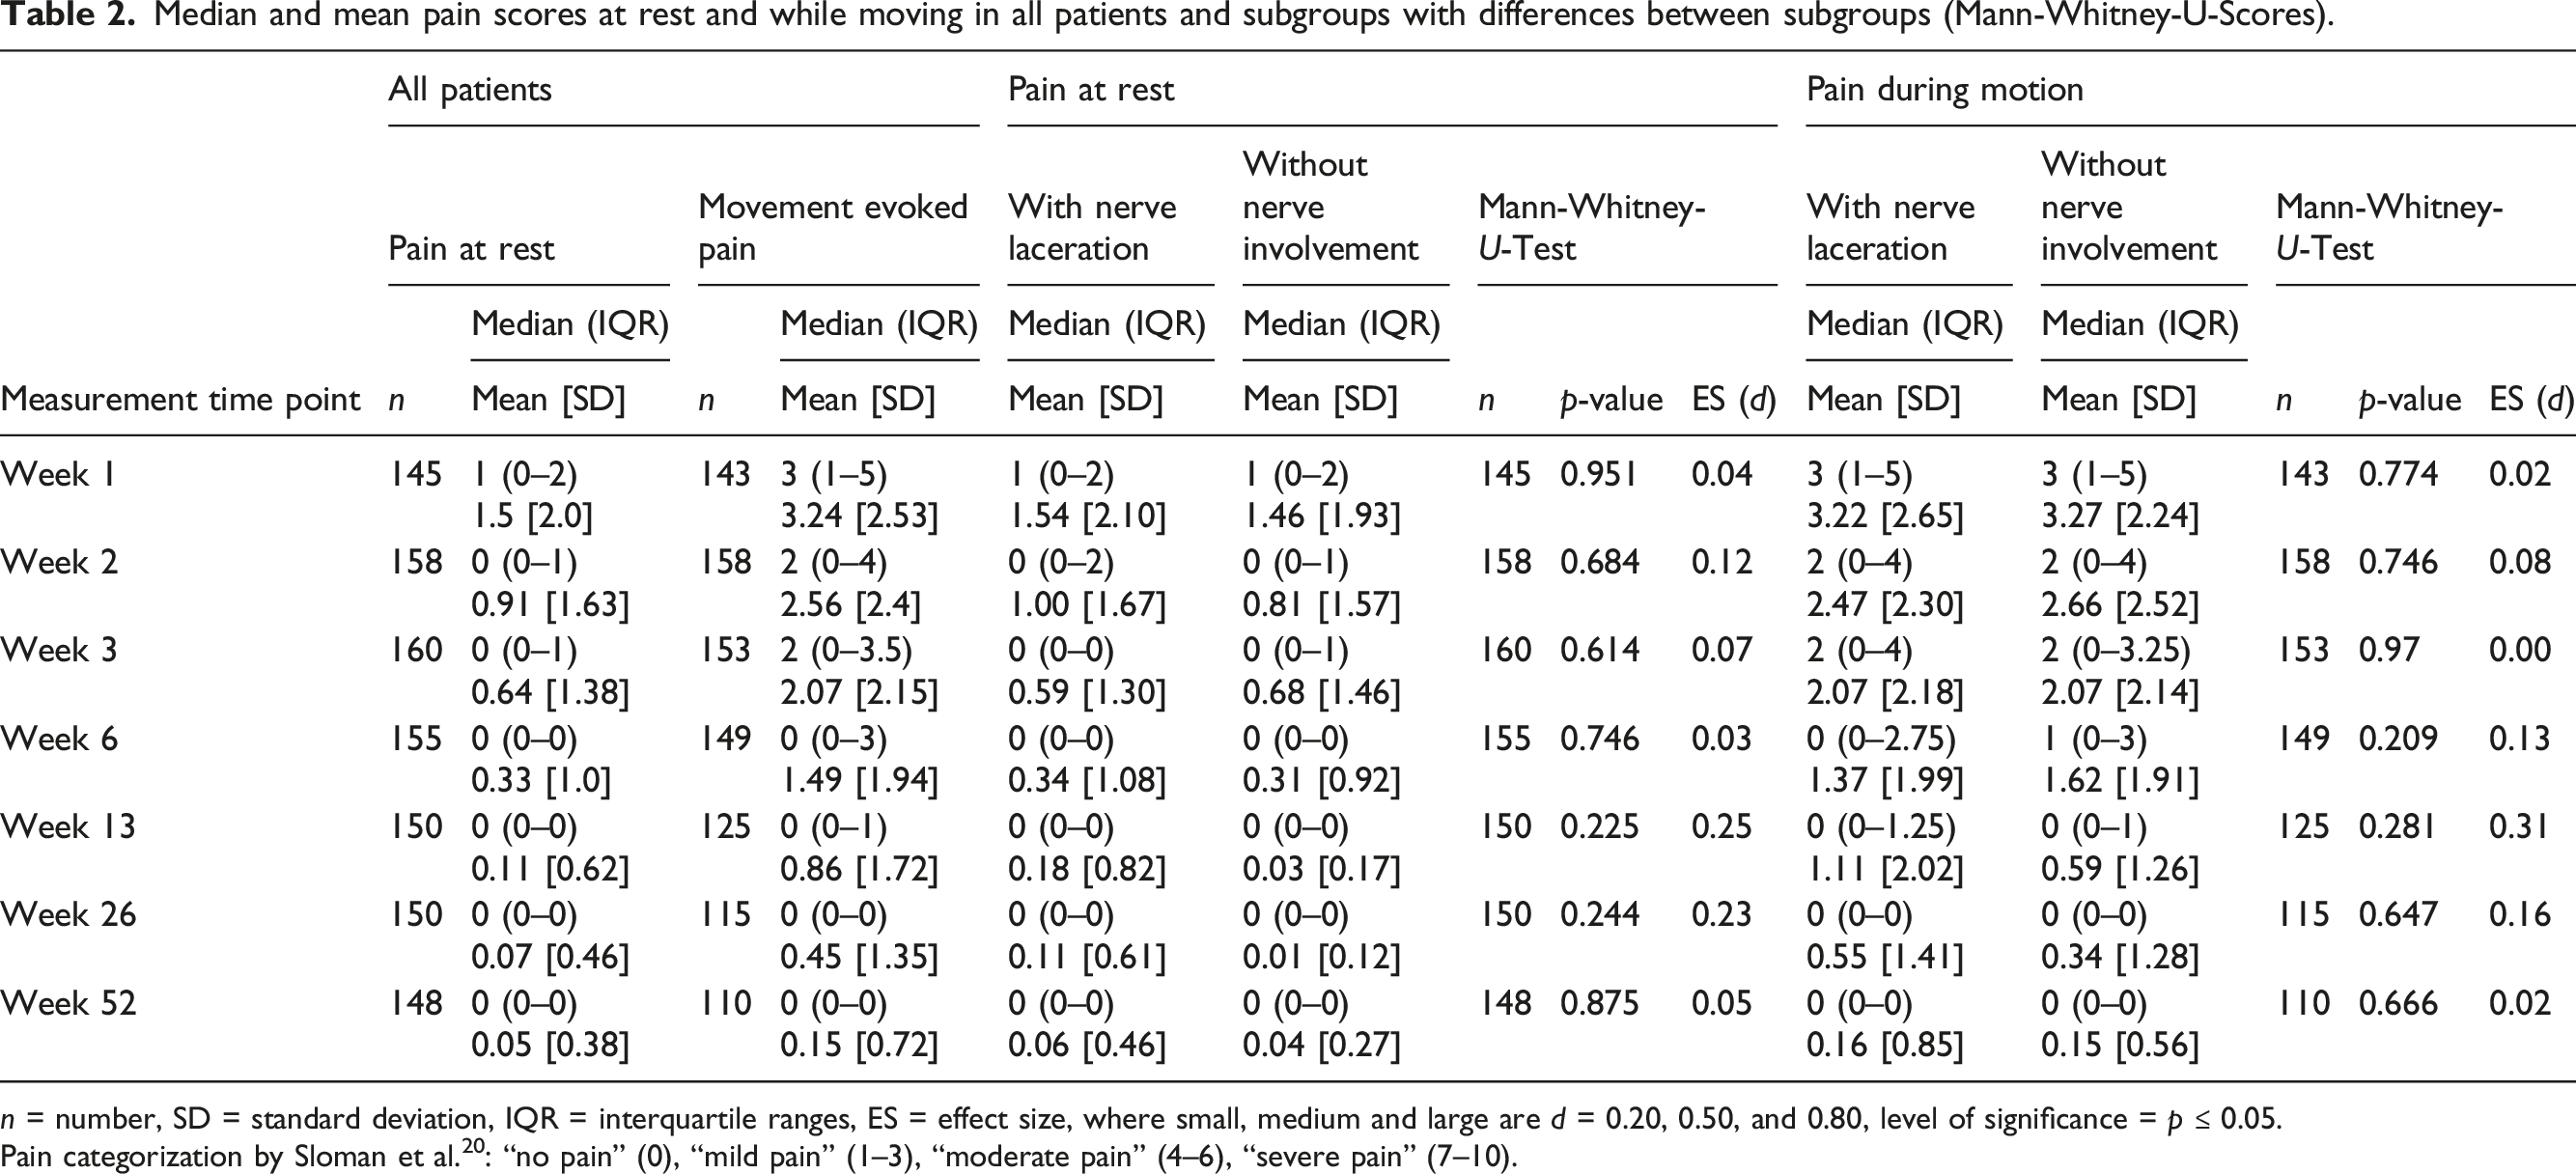
n = number, SD = standard deviation, IQR = interquartile ranges, ES = effect size, where small, medium and large are d = 0.20, 0.50, and 0.80, level of significance = p ≤ 0.05.
Pain categorization by Sloman et al. 20 : “no pain” (0), “mild pain” (1–3), “moderate pain” (4–6), “severe pain” (7–10).
Differences between pain at rest and pain during motion over time of all patients (Wilcoxon sign rank test scores).
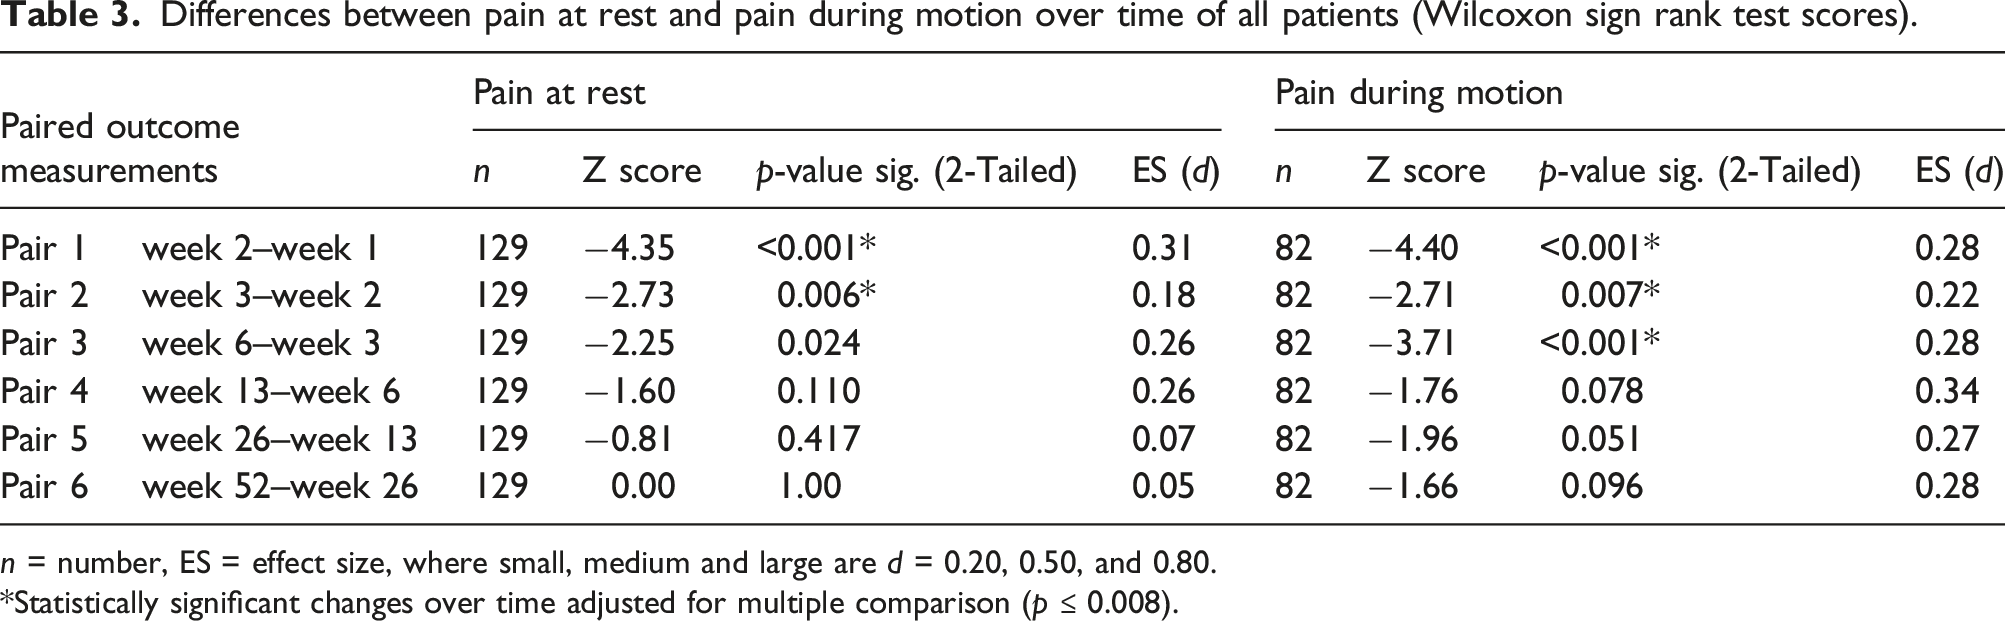
n = number, ES = effect size, where small, medium and large are d = 0.20, 0.50, and 0.80.
Statistically significant changes over time adjusted for multiple comparison (p ≤ 0.008).
Differences in level of pain at rest and pain during motion in patients with and without a concomitant digital nerve injury
There were no statistically significant differences in pain at rest and during motion between patients with and without a concomitant nerve injury at any measurement time point. Effect sizes were small (pain at rest: p =0.225 to 0.951, ES d = 0.03 to 0.25; pain during motion: p =0.209 to 0.970, ES d = 0.00 to 0.31) (Table 2).
Relationship between concomitant nerve injury, pain level and pain medication intake
In the first week post-surgery, 72.5% of patients with (n = 68) and 70.4% without (n = 66) nerve involvement took pain medication. In week 2, 37.5% (n = 35) with and 29.5% (n = 27) without concomitant nerve injury were still using pain medication, decreasing to 28.3% (n = 27) and 22.7% (n = 21) in week 3 and to 12.5% (n = 11) and 11.4% (n = 10) in week 6, respectively. From week 13 onwards, only one patient (1.8%) with nerve injury continued taking pain medication for up to one year, while no patient without nerve involvement was still on pain medication during this time span.
Binary logistic regression models for the outcome measurements “pain medication and ‘touch down.”
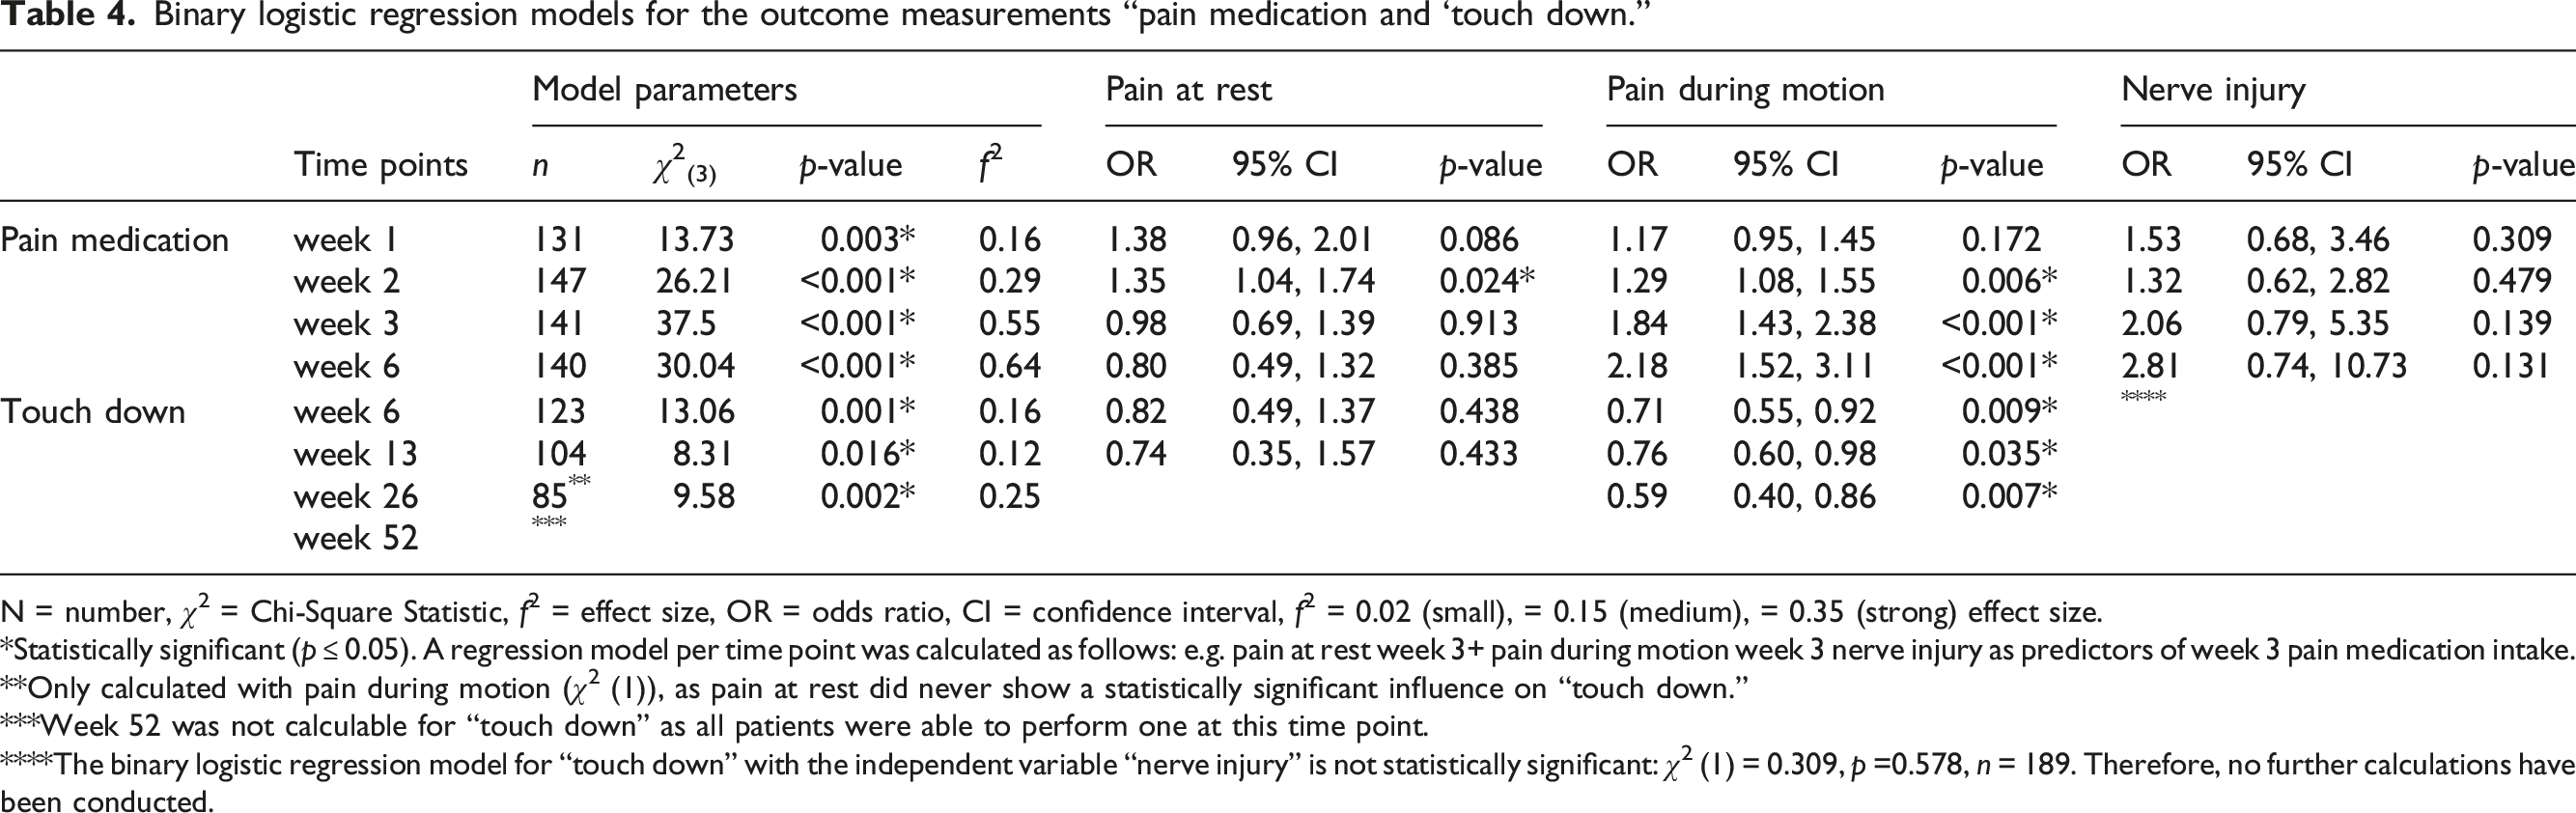
N = number, χ2 = Chi-Square Statistic, f2 = effect size, OR = odds ratio, CI = confidence interval, f2 = 0.02 (small), = 0.15 (medium), = 0.35 (strong) effect size.
Statistically significant (p ≤ 0.05). A regression model per time point was calculated as follows: e.g. pain at rest week 3+ pain during motion week 3 nerve injury as predictors of week 3 pain medication intake.
Only calculated with pain during motion (χ2 (1)), as pain at rest did never show a statistically significant influence on “touch down.”
Week 52 was not calculable for “touch down” as all patients were able to perform one at this time point.
The binary logistic regression model for “touch down” with the independent variable “nerve injury” is not statistically significant: χ2 (1) = 0.309, p =0.578, n = 189. Therefore, no further calculations have been conducted.
Relationship between concomitant nerve injury, pain level and “touch down”
We found no relationship between the presence of a nerve injury and the performance of a “touch-down” at any measurement time point (Table 3). Pain during motion had a significant association with the ability to perform a “touch down” (p = 0.009 week 6; p = 0.035 week 13; p = 0.007 week 26), but not pain at rest (p = 0.438 week 6, p = 0.433 week 13). For week 26, only 3.3% of all patients had pain at rest, therefore, the model was only calculated with pain during motion. Week 52 was not modelled as all patients were able to perform a ‘touch-down’ at this time point. For a one-unit increase in pain during motion, the relative probability of performing a “touch-down” decreased by 18.5% (95% CI [0.49, 1.37]) at week 6, 26.1% (95% CI [0.35, 1.57]) at week 13 and 41.5% (95% CI [0.4, 0.86]) after 26 weeks.
Relationship between concomitant nerve injury, pain level and TAM scores
Tang criteria for assessment of total active movement (TAM).
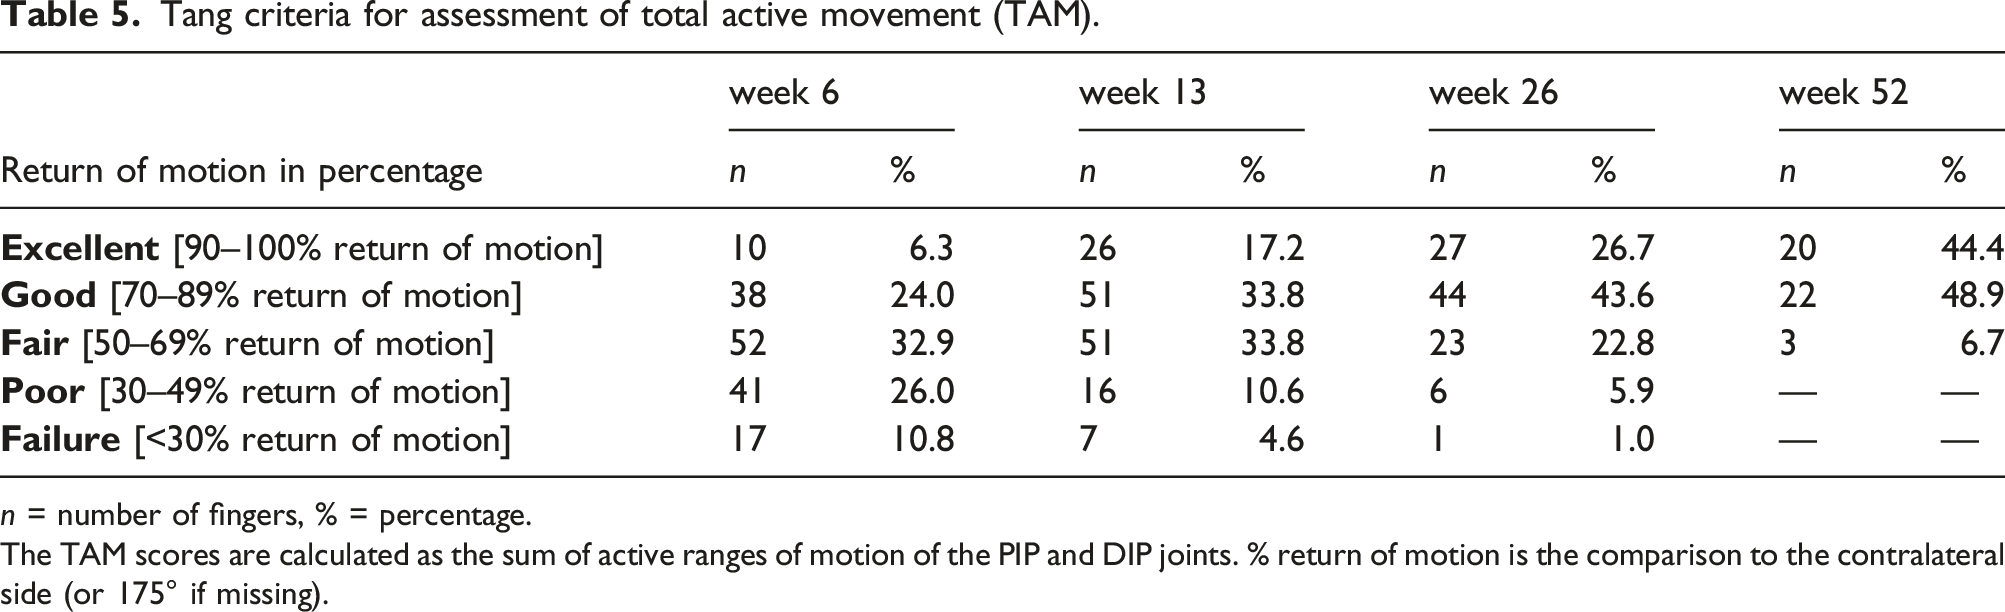
n = number of fingers, % = percentage.
The TAM scores are calculated as the sum of active ranges of motion of the PIP and DIP joints. % return of motion is the comparison to the contralateral side (or 175° if missing).
Multiple regression models for the outcome measurements TAM (total active motion), DASH and patient satisfaction scores.
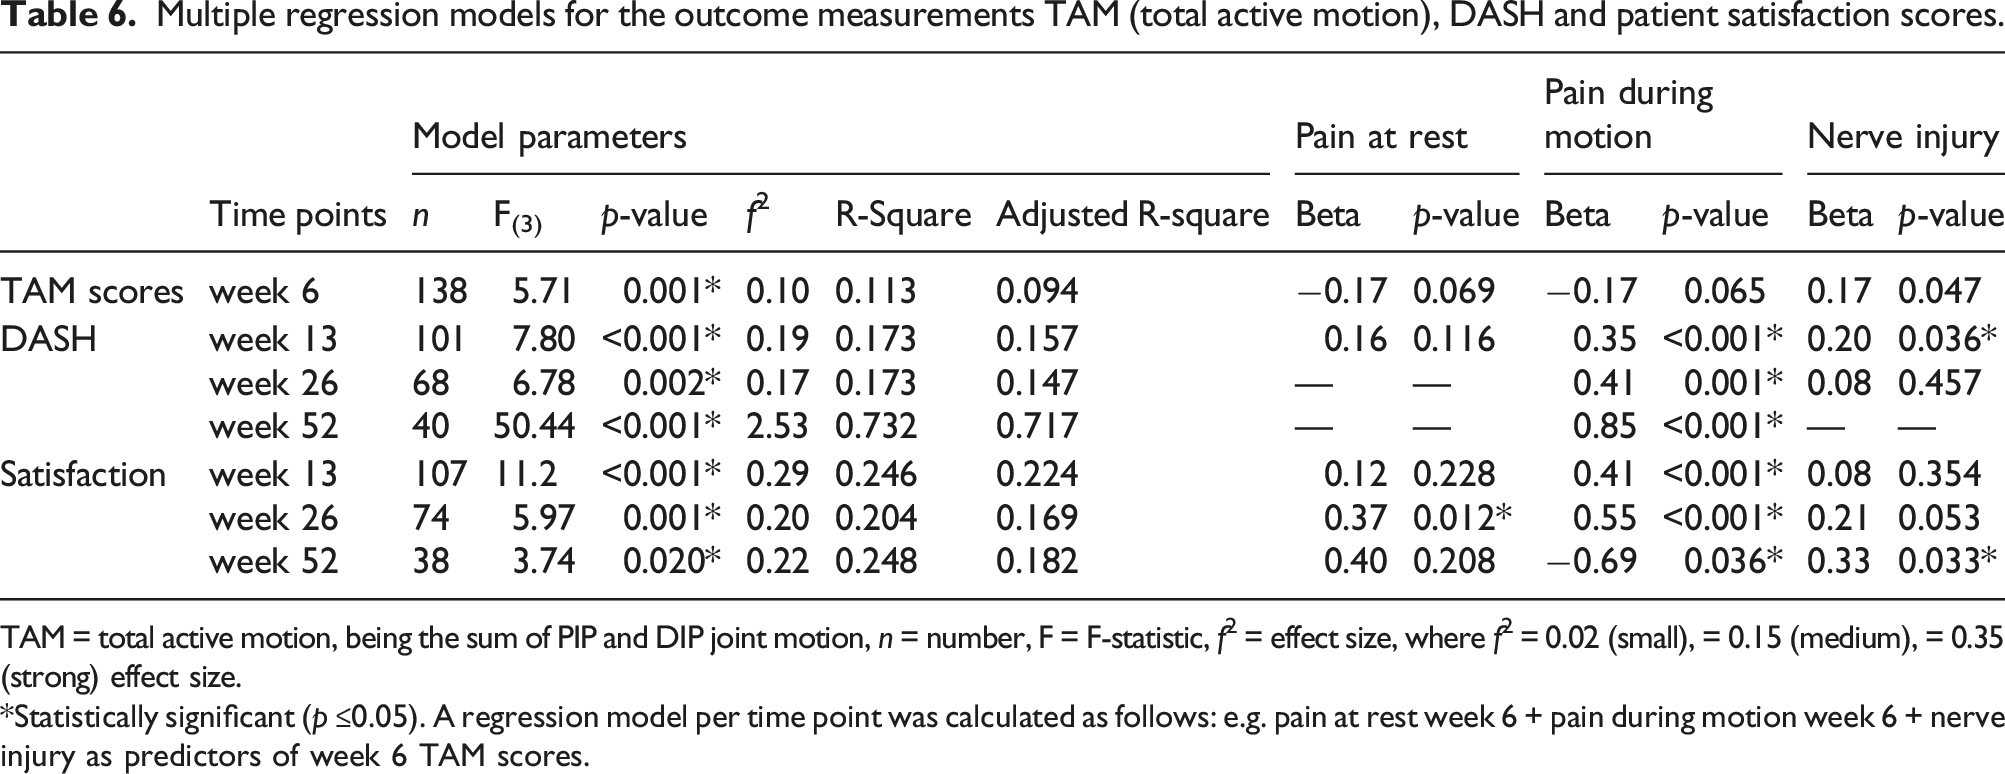
TAM = total active motion, being the sum of PIP and DIP joint motion, n = number, F = F-statistic, f2 = effect size, where f2 = 0.02 (small), = 0.15 (medium), = 0.35 (strong) effect size.
Statistically significant (p ≤0.05). A regression model per time point was calculated as follows: e.g. pain at rest week 6 + pain during motion week 6 + nerve injury as predictors of week 6 TAM scores.
Relationship between nerve injury, pain and the DASH
The mean DASH scores showed low levels of disability already at week 13 (mean 17.0 ± 14.7 points), decreasing constantly from week 26 (mean 7.1 ± 7.8 points) to week 52 (mean 5.1 ± 8.6 points). For week 13, pain during motion and the presence of a nerve injury were statistically significantly associated with worse DASH scores (Table 6). If pain during motion increased by one point, the DASH scores increased on average by 2.1 points (SE 0.77). If no concomitant nerve injury is present, the DASH scores decreased on average by 4.6 points (SE 2.37) at week 13.15.7% of the variance in the DASH scores can be explained by this model, corresponding to a medium effect size. For those patients still experiencing pain during motion at weeks 26 and 52, DASH scores were on average slightly higher than for those patients without pain during motion, namely 2.1 points (SE 0.57) at week 26 and 5.8 points (SE 0.58) after one year per each one-unit increase in pain during motion.
Relationship between concomitant nerve injury, pain level and patient satisfaction
Patient satisfaction in all patients increased from 7.2 (SD 1.9) points in week 13, 8.1 (SD 1.6) points in week 26 up to 8.7 (SD 1.1) points in week 52. The multiple regression model showed a relationship between pain during motion, pain at rest, the presence of a nerve injury and patient satisfaction at weeks 13, 26 and 52 with medium effect sizes (Table 6). Pain during motion had a statistically significant effect on satisfaction at week 13 (p ≤ 0.001), causing an increase in patient satisfaction by every 0.5 points (SE 0.1) decrease in pain during motion. After 26 weeks, both pain during motion and pain at rest had a statistically significant effect on satisfaction, but not the presence of a nerve injury. If both pain during motion and at rest decreased by one point, patient satisfaction increased on average by 0.5 points (SE 0.14) and 0.9 points (SE 0.36), respectively. At week 52, patient satisfaction increased on average by 0.6 points (SE 0.29) per each point decrease in pain during motion.
Discussion
The primary purpose of this study was to analyse the evolution of pain at rest and during motion spanning one year after a primary flexor tendon repair in zones 1–3. As all zone 3 patients did not fulfil our inclusion criteria, our findings only apply to zone 1-2 injuries. Both pain at rest and during motion steadily decreased over time, with significant decreases up to 6 weeks post-surgery. Most patients perceived no to mild pain at rest during the first three weeks and were pain-free thereafter. Pain during motion was markedly higher than pain at rest in the first six weeks. Hah et al. 25 identified a pain level of ≥3 on day 10 after surgery as a cut-off score for predicting chronic post-surgical pain at day 90. In our cohort, patients reported median levels of pain at rest of one point in week 1, decreasing to zero thereafter. Median levels of pain during motion were three points in week 1, going down to two points in weeks 3 and 4 and to zero thereafter. Therefore, most of our patients were never at risk of developing chronic post-surgical pain.
The secondary objective was to examine the differences in pain at rest and during motion in patients with and without digital nerve injury. In our study, 50.3% of injured fingers had an additional concomitant digital nerve lesion. This rate is comparable with previous studies (range from 34.4 to 56.1%).1,13,15,26–30 We could not find a statistically significant association between a concomitant digital nerve injury and the course of pain over one year after primary finger flexor tendon repair in zones 1-2. Our study shows that pain at rest after flexor tendon repair is generally low in both patient groups with and without concomitant nerve injury. Pain was reported in previous studies in patients after flexor tendon surgery, but rarely distinguished between pain at rest and pain during motion.26,31,32 Furthermore, these authors did not discriminate between patients with and without nerve involvement. Our study demonstrates that there is no need to make this distinction, as there were no statistically significant differences in perceived pain levels between patients with and without a concomitant nerve injury at any measurement time point. This result, however, might be influenced by the (on average) 56.5-fold higher chance of pain medication intake over the first 6 weeks post-surgery when a concomitant nerve injury was present. Sade et al. 31 for example, reported mean VAS pain levels of 6.5 (SD 2.5) points at the beginning of therapy and 1.3 (SD 2.0) points 12 weeks after flexor tendon surgery. The average pain level was markedly higher than in our study, but it was not stated if this was pain at rest or during motion or if patients were on pain medication.
The final objective was to evaluate the relationship between pain at rest, pain during motion, concomitant digital nerve injury and pain medication, total active motion (TAM), self-defined functional recovery (DASH) and patient satisfaction. Our results showed that during the first two weeks post-surgery, most patients took pain medication. After 3 weeks, we observed a change in that pain at rest was also tolerated without pain medication. Although the likelihood for pain medication intake increased the longer the pain during motion lasted, a combination of oral pain medications (paracetamol and metamizole) seemed nevertheless to be efficient and sufficient for postoperative pain control. This is in line with the algorithm for hand surgery patients with acute postoperative pain developed by Kelley et al. 33 recommending oral pain medication for patients after soft-tissue surgery and no major pain history.
In our study, we found a significant relationship between the pain level, presence of a concomitant nerve injury and TAM at week 6 only, as most patients did not suffer from pain at rest after that time point. Additionally, the majority of patients had “no” to “mild” pain during motion thereafter. We found no relationship between the presence of a nerve injury and the ability to perform a “touch-down.” Pain at rest had a small but statistically non-significant effect up to 13 weeks post-surgery. Pain during motion showed a statistically significant association up to 6 months post-surgery. Previous studies found no relationship between nerve laceration and return of finger mobility, but they did not distinguish between pain at rest and pain during motion.16,34
The DASH has previously been used in studies of patients after flexor tendon injury.12,26,32,35–38 In a study by Wong et al. 39 patients at discharge after acute traumatic hand injuries achieved on average 14 (SD 15) DASH points. These results are comparable to our scores, as patients are typically discharged from therapy three months after flexor tendon surgery. The presence of a concomitant nerve injury was only significantly associated with the DASH scores at 13 weeks post-surgery, resulting in an average increase of 4.6 points.
We found a statistically significant relationship between pain during motion and the DASH up to one year after flexor tendon repair, while pain at rest did not show any association with hand function. Previous studies found generally low DASH scores after flexor tendon injuries,12,26,32,35–37 leaving little room for clinically important changes. For example, by scoring on average 17.0 points at week 13, achieving a clinically important change of 18.8 points 40 was not possible for our patients. Therefore, it is questionable if this is the right instrument to evaluate hand function after a flexor tendon injury.
Patient satisfaction with their rehabilitation outcomes is considered an essential metric of quality regarding the outcome after hand surgery. 41 There is moderate evidence that pain and limitations in functioning influence patient satisfaction. 42 In our cohort, pain during motion was statistically significantly associated with patient satisfaction up to one year post-surgery. We only found a significant relationship between pain at rest and satisfaction at week 26, but not at week 13. This finding shows that pain at rest at week 13 was tolerated but started to negatively impact the satisfaction of these few patients (3%, n = 5) who continued to suffer from pain at rest 6 months post-surgery.
Limitations
This study has several limitations. First, during the assessment of pain intensity, we evaluated pain in a unidimensional way. We could have measured pain with multidimensional scales, including pain duration and relief. Well-validated instruments, such as the McGill Pain Questionnaire, 43 are recommended for a more comprehensive pain assessment. However, we considered the VNRS as an appropriate instrument for flexor tendon patients, as it reflects sensory and not affective pain dimensions, the former being of most concern in acute post-surgery-related pain. 44 Second, we did not specifically assess whether patients were at risk of fear of movement (kinesiophobia), as there is evidence that pain could lead to kinesiophobia and ultimately to fear of tendon rupture. 45 Third, our measurement time points were fixed beforehand, therefore we don’t know if we captured pain when it was most elevated. Fourth, although the same pain medications were prescribed and administered by hand surgeons in all participating clinics, the intake of pain medication may have been influenced by the hand therapist’s and/or surgeon’s way of encouraging patients to take them. This may have produced a bias within our results. A further limitation was the exclusion of 44 patients due to too much missing data regarding pain values; this reduced our sample size. Finally, due to the retrospective nature of our study design, we did not calculate a-priori sample size. Performing a posthoc power analysis is more common for this type of study. However, it is debatable if post-hoc power analyses really can inform power for detecting significant results because the random component in the study disappears once data are collected, challenging the rationale for making such power estimates. 46
Conclusions
This study shows a significant relationship between pain during motion and pain medication intake, TAM, DASH scores and patients’ satisfaction. No relationship was identified between pain at rest and any of the outcome measurements, indicating that monitoring pain at rest may be unnecessary with this patient group. These findings notably indicate that pain during motion plays a crucial role in flexor tendon rehabilitation. Especially, as it can hinder the patient from actively moving the injured finger from week 1 onwards, thus, negatively affecting clinical outcomes. Our key recommendation is therefore to monitor pain during motion as opposed to pain at rest during the rehabilitation of flexor tendon injuries in zones 1-2.
The presence of a concomitant nerve injury increased post-surgical pain medication intake and was associated with worse TAM scores in week 6 and higher self-perceived disability in week 13. This relationship is in contrast with previous studies that found no association between nerve laceration and return of finger mobility, but they did not distinguish between pain at rest and pain during motion.26,31,32 Therefore, future studies should state whether they assess pain at rest or during motion, the latter being required for future flexor tendon research.
Footnotes
Acknowledgements
We would like to thank the Hand Therapy and Hand Surgery Departments of the University Hospitals of Zurich, Bern and Basel for their support in data collection and the patients for their willingness to participate in this study. Many thanks go to Lieutenant Colonel Jamie Jamison, Royal Marines Commando, Royal Navy, for proof reading the final manuscript.
Declaration of conflicting interests
The authors declared no potential conflicts of interest with respect to the research, authorship, and/or publication of this article.
Funding
Funding was provided by the SUVA, the Swiss national accident insurance. The funds were used to pay set-up and maintenance of the data cloud (REDCap) used in this multi-center study and the support of a statistician.
Ethical approval
This study was approved by the ethical committee of Zurich, Switzerland (BASEC-Nr. 2017–02267).
Informed consent
Written informed consent was given by all patients prior to study entry.
Guarantor
BT.
Contributorship
All authors designed the study and developed the protocol. VBF, BT and LS entered patient data into REDCap, VBF and BT extracted the data used for this study and analysed the data. VBF wrote the manuscript. All authors reviewed and edited the manuscript and approved the final version.