
Abstract
Background:
Methotrexate (MTX) remains the anchor drug in rheumatoid arthritis (RA) management. However, treatment response varies widely.
Objectives:
This study aimed to develop and validate a simple scoring model for predicting MTX monotherapy treatment success at 6 months.
Methods:
We conducted a multicenter, retrospective cohort study of newly diagnosed, disease-modifying antirheumatic drug-naïve RA patients treated with MTX monotherapy. Treatment success was defined as achieving remission or low disease activity at 6 months based on Disease Activity Score-28 with erythrocyte sedimentation rate (DAS28-ESR). Multivariable logistic regression was used to identify baseline predictors and construct a scoring model. Internal validation was performed using stratified 10-fold cross-validation and bootstrap resampling, while external validation was conducted in an independent cohort from three hospitals. Model performance was evaluated by discrimination and calibration.
Results:
The development cohort included 840 patients. Four independent predictors of MTX success were identified: age >60 years, normal ESR, lower baseline disease activity (DAS28-ESR ⩽5.1), and lower glucocorticoid dose. The model demonstrated an area under the ROC curve (AUC) of 0.66. Internal validation yielded a mean AUC of 0.65, with a calibration intercept of −0.001 and slope of 0.943. Bootstrap analysis showed minimal optimism (0.003). External validation in 265 patients showed moderate discrimination (AUC 0.63; 95% confidence interval 0.56–0.70) with acceptable calibration (intercept 0.16; slope 0.890) and a stable Brier score of 0.23. No significant difference in AUC was observed between cohorts (p = 0.31). Decision curve analysis demonstrated that the scoring system provided a higher net benefit compared to default strategies across a threshold probability range of 35%–80%.
Conclusion:
The MTX response scoring system demonstrated stable performance and may serve as an adjunctive tool to aid in early risk stratification for MTX treatment success, particularly in resource-limited settings.
Plain language summary
Rheumatoid arthritis (RA) is a long-term autoimmune disease that causes joint pain, swelling, and stiffness. If not treated adequately, it can lead to permanent joint damage and disability. Methotrexate (MTX) is usually the first medicine given to people with RA because of its efficacy and affordability. However, not everyone responds well to this treatment. In this study, we developed and tested a simple scoring system to help clinicians estimate whether a patient is likely to respond well to MTX after six months of treatment. We analyzed medical records from more than 1,000 newly diagnosed RA patients from 10 hospitals across Indonesia. We found that four factors were linked to better treatment response: (1) being older than 60 years, (2) having normal inflammation levels (measured by ESR blood test), (3) having lower disease activity at the start of treatment, and (3) using a lower dose of steroid medication. These factors were combined into a practical scoring system called the DEAP score. The score helps estimate the chance that methotrexate alone will successfully control the disease. We tested the score in different groups of patients and found that it performed consistently. We also created a free online calculator so clinicians can easily use this tool in daily practice. This scoring system may help clinicians identify patients who are likely to benefit from MTX alone and those who may need earlier combination or advanced treatments. This is especially important in countries where access to expensive medications may be limited.
Introduction
Rheumatoid arthritis (RA) is a chronic, systemic autoimmune disease that primarily affects the joints. Its prevalence varies across regions, with global estimates ranging from 0.5% to 1.0% of the population.1,2 Despite its relatively low prevalence, RA can cause irreversible joint damage, leading to significant disability and impaired quality of life, particularly when inadequately treated. This contributes to a substantial socioeconomic burden, accounting for approximately 3.08 million disability-adjusted life years worldwide. 3 Achieving early and sustained disease control is therefore crucial to prevent irreversible disability and reduce disease burden.
Current RA management emphasizes achieving remission or, at minimum, low disease activity (LDA), in accordance with the “treat-to-target” strategy endorsed by international guidelines.4,5 Methotrexate (MTX), a conventional synthetic disease-modifying antirheumatic drug (csDMARD), is considered the anchor drug for RA management due to its proven efficacy, safety profile, and cost-effectiveness, making it the recommended first-line therapy.6,7 It is commonly used as monotherapy during the first 6 months of treatment, after which therapy should be adjusted, often requiring combination treatment or the addition of biologics, if treatment targets are not achieved.4,7
However, treatment response to MTX varies considerably among patients.8 –10 Approximately 30% of patients on MTX monotherapy discontinued the drug due to either drug inefficacy or adverse events.11 –13 Suboptimal response results in prolonged disease activity, progressive joint damage, and increased healthcare costs. 14 Although combination with biologic DMARDs offers higher response rates and improved outcomes, 15 monotherapy strategy is still widely used in developing countries due to the high cost of biologic agents.
Previous studies have identified various factors associated with MTX treatment outcomes in RA, including age, sex, rheumatoid factor (RF) positivity, smoking status, disease activity, disease duration, obesity, tender joint count (TJC), and genetic polymorphisms.10,11,16 However, existing prediction models are often based on small observational cohorts, data from highly selected clinical trial populations with rigid treatment protocols,15,17 or outcome measures focused on treatment discontinuation rather than a comprehensive evaluation of patient condition. 18 Furthermore, incorporating these variables into routine clinical decision-making is often impractical. There is therefore a need for a simplified scoring system that integrates easily obtainable clinical and laboratory parameters and has undergone comprehensive validation using real-world, multicenter data.
To address these gaps, this study aims to identify predictors of remission after 6 months of MTX therapy and to develop a practical, real-world scoring system for predicting treatment response to MTX monotherapy in patients with RA using multicenter data. Subsequently, the performance and generalizability of this model would be evaluated through both internal and external validation. Model performance was evaluated in terms of discrimination, calibration, and overall accuracy, thereby providing a comprehensive assessment of its clinical utility for predicting MTX treatment response in routine practice.
Methods
Study design and participants
This retrospective, multicenter study consisted of a development cohort and an independent validation cohort. The development and internal validation cohorts were derived from seven hospitals across Indonesia (Jakarta, Palembang, Semarang, Malang, Surabaya, Bali, and Banjarmasin) and included newly diagnosed, DMARD-naïve RA patients between January 2021 and December 2023. The external validation cohort involved patients from three additional hospitals (Padang, Surakarta, and Makassar) during the same period. These hospitals were distributed across major regions of the Indonesian archipelago (Sumatra, Java, and Sulawesi islands) to support geographical representativeness.
Eligible participants were aged ⩾18 years, fulfilled the 2010 ACR/EULAR classification criteria for RA, 19 had moderate-to-high disease activity at baseline (Disease Activity Score-28 with erythrocyte sedimentation rate (DAS28-ESR) >3.2), and received MTX monotherapy as initial treatment. Patients were excluded if they had contraindications or intolerance to MTX that led to discontinuation, incomplete data, or did not complete 6 months of MTX monotherapy for any reason, including loss to follow-up. In Indonesia, MTX administration generally follows the national RA management guideline. 20 MTX treatment is typically initiated at a dose of 7.5–10 mg/week and titrated according to clinical response to a maximum of 25 mg/week.
Data collection
Data were obtained retrospectively from medical records. Each participant was followed for 6 months from the time of diagnosis and initiation of MTX therapy. Baseline demographic data collected included age, sex, body weight, and height. Body mass index (BMI) was calculated from weight and height data, and classified according to the WHO Asia-Pacific classification, in which BMI ⩾25.0 kg/m2 was considered obese. 21
Clinical and RA-related data collected included TJC, swollen joint count (SJC), comorbidities, and baseline glucocorticoid use. TJC and SJC were dichotomized (⩽5 and >5 for TJC; ⩽1 and >1 for SJC) based on cut-off values obtained from a previous study. 9 Comorbidities were assessed using the Rheumatic Disease Comorbidity Index, ranging from 0 to 9. 22 Baseline glucocorticoid use was recorded as a prednisone-equivalent dose per day. Laboratory parameters included ESR and RF. ESR was classified as normal or elevated, and RF as positive or negative, according to each center’s laboratory reference ranges.
Outcome assessment
Disease activity was evaluated using the DAS28-ESR and categorized as remission (⩽2.6), low (2.6–3.2), moderate (3.2–5.1), or high (>5.1) disease activity. Treatment success was defined as achieving remission or LDA after 6 months of MTX monotherapy. Patients who failed to reach remission or LDA, or required additional DMARDs due to inadequate response despite maximal tolerated MTX doses, were classified as having treatment failure.
Statistical analysis
Model development
As this study was based on a retrospective dataset, no a priori sample size calculation was performed. However, sample size adequacy was assessed using the concept of events per variable (EPV), defined as the number of outcome events divided by the number of candidate predictor variables included in model development. In accordance with recommended practice, the smaller of the two outcome groups was used to calculate EPV. 23 In our study, there were 406 outcome events and 10 candidate predictors, resulting in an EPV of 40.6, which exceeds the commonly recommended minimum threshold. 24
Categorical variables were presented as frequencies and percentages, while continuous variables were summarized as means and standard deviations (SD) for normally distributed data or medians with interquartile ranges (IQR) for non-normal distributions. Between-group comparisons were performed using the independent t-test, Mann–Whitney U test, or Chi-square test, as appropriate. Missing data were handled using complete-case analysis. Given the low proportion of missing data (<5%) across all variables, the impact of imputation on model estimates was considered minimal. 25 The proportion of missing data for each variable was assessed and is reported.
Multicollinearity testing was performed for DAS28 components. Candidate predictors were initially selected based on clinical relevance and availability in routine clinical practice. Univariable logistic regression was subsequently conducted to explore the association between each potential predictor and treatment success. Variables with a p-value < 0.25 in univariable analysis were considered for inclusion in the multivariable logistic regression model, 26 along with clinically important variables regardless of univariable significance. Manual backward elimination was performed until only statistically significant predictors (p < 0.05) remained in the final model. Results were expressed as odds ratios (OR) with 95% confidence intervals (CI).
To construct the scoring system, regression coefficients from the final multivariable model were transformed into a point-based score. Each coefficient was divided by the smallest coefficient in the model to obtain relative weights, and the resulting values were rounded to the nearest integer to assign points for each predictor. The total score was calculated by summing the points across all predictors. Calibration was evaluated using the Hosmer–Lemeshow (H–L) test, while discrimination was assessed by the area under the ROC curve (AUC).
Model validation
Discrimination and calibration
In validation cohorts, discrimination was assessed using AUC. Calibration was evaluated using the H-L test and Brier score (lower scores indicating better calibration). 27 Intercept and slope were used to assess model fitting. 28
Internal validation
Bootstrapping (with 1000 resamples) was used as the primary method to assess internal validity and adjust for overfitting. Optimism was measured as the difference between test and apparent data performance, yielding an optimism-corrected estimate. 27 In addition, 10-fold stratified cross-validation was conducted in the development cohort, and results were presented as mean AUC, providing complementary information on the stability and variance of model performance across data partitions. The use of both methods was intended to provide a comprehensive assessment of the robustness of the model.
External validation
The model was applied to the external validation cohort. The difference in performance between the development and validation datasets was evaluated using the DeLong test. Sensitivity and specificity at the optimal cut-off value were determined using the Youden index.
Model implementation
Decision curve analysis (DCA) was performed to assess the clinical utility of the model by quantifying the net benefit plotted against a range of threshold probabilities. This analysis compared the prediction model against two default strategies: treating all patients with MTX monotherapy or treating no patients with MTX monotherapy (implying immediate step-up or combination therapy). 29 The final MTX prediction model would be incorporated into an open-access, web-based calculator to facilitate ease of use in clinical practice.
Statistical analyses were performed using R version 4.5.2 (pROC, caret, CalibrationCurves, dcurves packages) and IBM SPSS Statistics version 28.0.30 –32 A p-value of less than 0.05 was considered statistically significant.
Results
Study participants and baseline characteristics
In the development cohort, a total of 902 newly diagnosed RA patients were initially assessed. Of these, 22 patients were excluded due to the use of other DMARDs and 6 due to incomplete baseline data. Among the remaining 874 eligible subjects, 9 patients discontinued MTX due to intolerance, and 25 were lost to follow-up without available disease activity assessment at 6 months. This resulted in a final cohort of 840 patients.
In the validation cohort, 307 patients were initially identified. Of these, 6 patients were excluded due to the use of other DMARDs and 10 due to incomplete baseline data. Among the remaining 291 eligible subjects, 11 patients discontinued MTX because of intolerance, and 15 were lost to follow-up. The final validation cohort therefore included 265 patients. The flow of patient selection is presented in Figure 1.

Flow diagram of patient selection. (a) Development cohort. (b) Validation cohort.
In the development cohort, the majority of patients were female (91.3%) with a mean age of 50.6 ± 12.1 years. High disease activity (DAS28-ESR >5.1) was observed in 31.7% of patients at baseline. After 6 months of MTX monotherapy, 52% (434/840) were classified as achieving treatment success, with 24% of patients achieving remission and 28% achieving LDA.
In the external validation cohort, the mean age was slightly lower at 47.4 ± 13.8 years, and 89.1% of participants were female. Baseline disease activity was generally lower compared to the development cohort, with only 17.0% of patients presenting with high disease activity. The rate of treatment success in the validation cohort was higher, with 157 patients (61.3%) achieving treatment success. Baseline characteristics of the development and validation cohorts are presented in Table 1. The proportion of missing data by variable is presented in Table S1.
Characteristics of subjects.
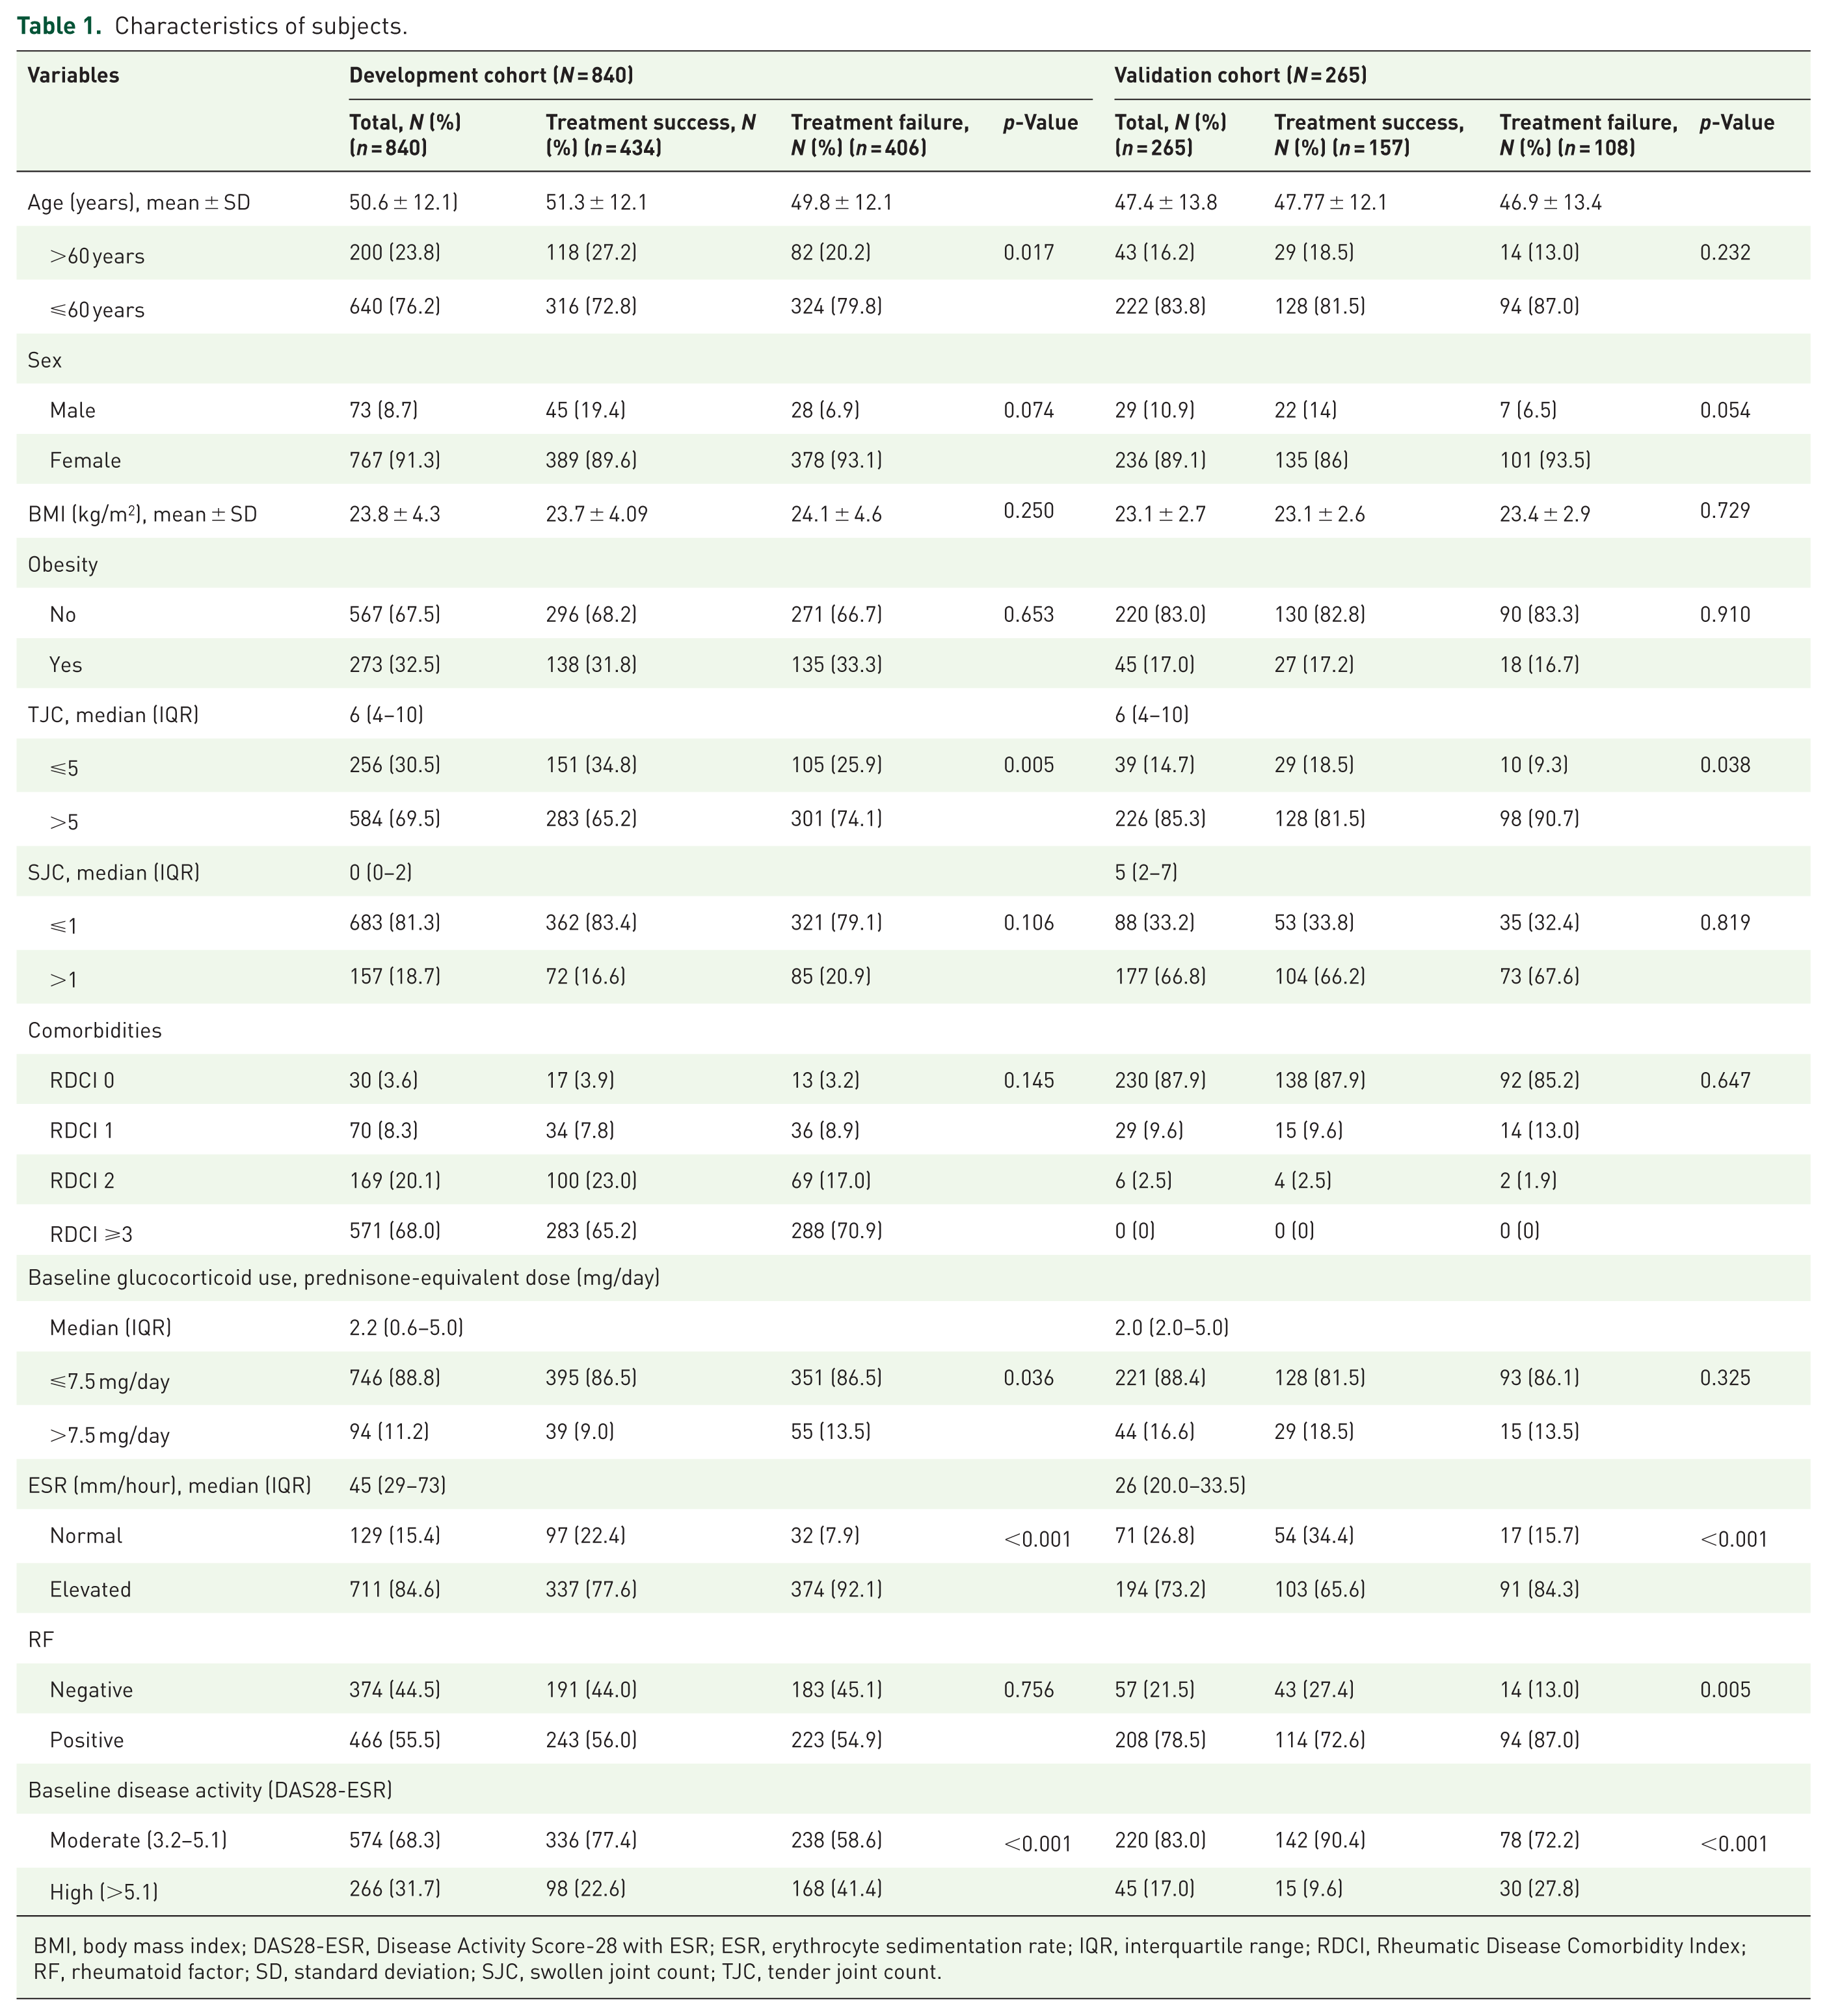
BMI, body mass index; DAS28-ESR, Disease Activity Score-28 with ESR; ESR, erythrocyte sedimentation rate; IQR, interquartile range; RDCI, Rheumatic Disease Comorbidity Index; RF, rheumatoid factor; SD, standard deviation; SJC, swollen joint count; TJC, tender joint count.
Development of the scoring system
Univariable and multivariable logistic regression analyses were performed to identify predictors of treatment success at 6 months. Age, sex, comorbidities, tender and SJC, ESR, baseline disease activity, and glucocorticoid dose were included in the multivariable model. RF was not statistically significant in univariable analysis; however, it was retained in the model due to its established clinical relevance as a predictor of treatment response.4,33 Following backward elimination, four variables remained as independent predictors: age >60 years (OR 1.43; 95% CI: 1.03–2.00), normal ESR (OR 2.84; 95% CI: 1.83–4.42), lower disease activity (OR 2.09; 95% CI: 1.53–2.85), and baseline glucocorticoid dose ⩽7.5 mg/day (OR 1.64; 95% CI: 1.04–2.59; Table 2). Multicollinearity testing between ESR, DAS28-ESR, and glucocorticoid dose confirmed no significant collinearity. Therefore, all four predictors were included in the final model.
Multivariable analysis and development of a scoring model for predicting MTX monotherapy treatment success at 6 months.

Rounded off to the nearest integer.
CI, confidence interval; DAS28, Disease Activity Score-28; ESR, erythrocyte sedimentation rate; MTX, methotrexate; OR, odds ratio.
Regression coefficients were converted into an integer-based risk scoring system. The presence of each predictor contributed a weighted score, with the resulting score ranging from 0 to 7, forming the following scoring equation for MTX treatment success:

The predicted probabilities of treatment success, along with corresponding sensitivity and specificity, were calculated for each score (Table S2). The AUC was 0.66 (95% CI: 0.62–0.69; Figure 2), indicating modest discriminative ability of the model. The H–L test demonstrated good model calibration (p = 0.705).

ROC comparison between developing and validating sets.
Internal validation
Stratified 10-fold cross-validation (Table S3) yielded a mean AUC of 0.65, with a range across folds of 0.524–0.739, and a mean Brier score of 0.233. Calibration analysis showed a mean intercept of −0.001 and a slope of 0.943. Despite heterogeneity in some subsets (e.g., fold 9 exhibiting lower performance with an AUC of 0.524), results indicated acceptable discrimination and calibration.
Bootstrap resampling (Table S4) resulted in an optimism-corrected AUC of 0.653 (estimated optimism 0.003). The optimism-corrected Brier score was 0.233, with a calibration intercept of 0 and a slope of 0.966. Overall, bootstrap validation demonstrated robust discrimination and calibration with minimal overfitting.
External validation
In the independent cohort (n = 265), the model achieved an AUC of 0.63. Calibration parameters (intercept 0.16, slope 0.890) suggested mild miscalibration with a tendency toward risk underestimation (Figure 3), while the Brier score was 0.23. Although performance was slightly reduced compared to internal validation, the DeLong test (p = 0.31) indicated no statistically significant difference in discrimination between the datasets (Figure 2).

Calibration curves for the prediction model in (a) developing and (b) validating sets.
Predicted probabilities increased with higher score cut-offs. A score ⩾1 yielded 39% probability (98% sensitivity, 9% specificity), rising to 83% probability at score ⩾7 (6% sensitivity, 99% specificity). Intermediate cut-off (score of 4) provided a balanced sensitivity and specificity for clinical decision-making (Table S5).
Model implementation in clinical practice
Decision curves for the prediction model in the development and validation cohorts are presented in Figure 4. In both cohorts, the prediction model demonstrated higher net benefit compared to the “treat-all” and “treat-none” strategies across a threshold probability range of approximately 35%–80%.

DCA for the prediction model in (a) development and (b) validation cohorts.
To facilitate the use of the scoring system in routine clinical practice, the model was implemented as a web-based calculator accessible through the Indonesian Rheumatology Association website (https://reumatologi.or.id/deap-score-calculator/). Using this calculator, clinicians can select categories for DAS28-ESR (remission, low, moderate, or high), ESR status (normal or above normal), age (⩽60 or >60 years), and prednisone-equivalent dose (⩽7.5 or >7.5 mg/day). Subsequently, the calculator automatically calculates the total DEAP score and displays the corresponding probability of treatment success. In addition, applying a predefined cut-off score of 4, the calculator classifies patients into high (⩾4) or low (<4) probability groups for treatment success. An example of the calculator output is presented in Figure 5.

Implementation of the DEAP score in clinical practice using a web-based platform.
Discussion
In this multicenter study, we developed and validated a simple scoring model to predict treatment success with MTX monotherapy in newly diagnosed, DMARD-naïve patients with RA. Multivariable analysis identified four independent predictors of treatment success: age >60 years, normal ESR, lower baseline disease activity, and lower glucocorticoid dose. Incorporating these readily available variables, the model demonstrated modest discriminative ability and acceptable calibration across both the development and validation cohorts.
The predictors identified in our study are consistent with those reported previously. Lower baseline disease activity and lower acute-phase reactants have been associated with a favorable response to MTX.9,11,34,35 Interestingly, older age (>60 years) was associated with better MTX response, aligning with an earlier study that identified younger age as a predictor of poorer response in early RA. 10 The relationship between glucocorticoid use and treatment outcomes has been more complex. While glucocorticoids effectively suppress inflammation and provide rapid symptomatic relief,36 –38 their use should be limited to short-term bridging therapy and tapered as soon as disease control is achieved. 4 Although lower baseline glucocorticoid doses may reflect lower initial disease activity, 36 our multicollinearity analysis showed no collinearity between these two variables. Consistent with our findings, other studies have reported better outcomes among patients receiving lower glucocorticoid doses. For instance, lower cumulative glucocorticoid exposure has been associated with reduced levels of inflammation-related proteins compared with higher exposure, and glucocorticoid use has also been linked to dose-dependent increases in mortality, particularly at doses exceeding 8 mg/day.39,40
Internal validation with bootstrapping yielded stable performance with minimal optimism (0.003), indicating a low risk of overfitting. 41 In addition, stratified cross-validation demonstrated that overall mean performance remained consistent across different data partitions, despite some expected heterogeneity between subsets. External validation showed a slight decrease in discrimination (AUC 0.63), a common observation in independent datasets. 42 However, the DeLong test revealed no significant difference between development and validation AUCs, suggesting that the modest decline likely reflects random variation rather than a true loss of predictive ability. 43
Regarding calibration, internal validation demonstrated intercepts near zero and slopes near one. In the external validation cohort, the calibration intercept (0.16) and slope (0.89) suggested mild miscalibration, similar to findings by Gehringer et al. 44 Nevertheless, the Brier score remained stable at approximately 0.23 across all validation stages, reflecting reasonable overall accuracy of probabilistic predictions and supporting the model’s transportability to external real-world data.
We developed a model-based scoring system, named the DEAP score, ranging from 0 to 7. Patients with lower scores had a lower probability of achieving MTX monotherapy success. However, whether these patients would actually benefit from earlier combination or escalation therapy based on score-guided treatment decisions warrants further prospective evaluation. Conversely, patients with higher scores have a relatively greater likelihood of achieving remission or LDA with MTX monotherapy, which may support a cost-effective and stepwise treatment approach. Intermediate cut-off, with a score of 4 in our model, allowed for a more balanced trade-off between sensitivity and specificity and may be useful for rapid clinical stratification, particularly in low- and middle-income countries.
DCA showed that the model had a higher net benefit compared to the “treat-all” (treating all with MTX monotherapy) and “treat-none” (treating no patients with MTX monotherapy, implying immediate step-up therapy) strategies, specifically between a threshold probability range of approximately 35%–80%. This indicates that at lower decision thresholds (<35%), the model performs similarly to the “treat-all” strategy, which is expected since MTX is the standard first-line therapy. However, at higher threshold probabilities, where patients or clinicians may be more hesitant to prescribe MTX monotherapy unless there is a high probability of success, the model may provide potential clinical benefit by helping to identify patients who are more likely to respond to treatment.
A growing number of MTX response prediction models have been proposed, but most rely on complex laboratory panels, psychosocial variables, or genetic polymorphisms, limiting their feasibility in routine practice, particularly in low‑resource settings. When compared with these existing models, which report AUC values ranging from approximately 0.70–0.85, the discriminative performance of our score is more modest.11,16,44 –48 However, our model uses only simple clinical and laboratory parameters that are universally available. This positions the DEAP score as a pragmatic alternative to more complex models, offering a balance between feasibility and predictive utility. While its modest discriminative ability limits its capacity to definitively distinguish between individual responders and non-responders, the model demonstrates stable calibration and consistent external performance. This supports its role as an adjunctive triage tool to assist risk stratification in MTX therapy, especially in resource-limited settings.
In recent years, machine learning approaches have gained increasing attention in clinical prediction modeling due to their ability to capture complex and nonlinear relationships. However, comparative studies have shown that traditional logistic regression often performs similarly to machine learning methods when applied to structured, tabular clinical datasets with moderate sample sizes and a limited number of predictors, as in the present study. Moreover, machine learning approaches typically require larger datasets to achieve stable performance and may have a higher risk of overfitting in smaller samples. Importantly, the primary aim of this study was to develop a simple, interpretable scoring system for clinical use. Logistic regression is well suited for this purpose, as it enables translation into a point-based score and provides greater transparency in model structure and interpretation.49,50
The strengths of this study include its real-world, multicenter design, encompassing a large cohort from various hospitals across major islands in Indonesia. This diverse sample enhances the representativeness of our findings to the broader national RA population. Importantly, most existing scoring models of MTX treatment response were derived from the Western population. Our study provides additional insights specifically from the Indonesian population, although generalizing these findings to a broader Asian or global context requires further evaluation. Furthermore, this simple prediction scoring is easy to use and has been available online, which makes it more applicable than some of the existing response prediction models.
Limitations
This study also has several limitations. Variable selection strategy using stepwise elimination methods has a potential limitation of unstable selection and risk of overfitting. More robust methods, such as the penalized regression techniques, may be considered in future studies to improve stability and model performance. However, in this study, internal validation using cross-validation and bootstrapping demonstrated minimal optimism, suggesting that the risk of overfitting was limited.
Second, as a retrospective study relying on medical record data, control over variable completeness was limited. Certain factors known to influence treatment response, such as disease duration and smoking status, were unavailable for most subjects and therefore could not be included in the analysis. In addition, certain laboratory parameters, particularly anti-cyclic citrullinated peptide antibodies, have been identified as important predictors of treatment outcomes; however, these tests are not routinely covered by the national insurance system and were therefore inconsistently measured across centers, precluding their inclusion.10,51 Furthermore, the exclusion of patients who discontinued MTX because of intolerance or were lost to follow-up may introduce selection bias, as these individuals may have had poorer treatment response or discontinued therapy due to inefficacy. Nevertheless, the proportion of excluded patients was relatively small, which may mitigate the risk of bias. The model’s discriminative ability, while acceptable, may be improved by incorporating additional clinical or laboratory predictors in future research.
Finally, although external validation was performed across multiple hospitals in different regions of Indonesia, all centers were in the same country and utilized data collected within a similar period, reflecting geographic validation within a national context. Generalizability of the model beyond similar clinical settings should be interpreted with caution. Further external validation in other populations, including different countries and healthcare systems, is required before broader clinical implementation. Future studies should focus on model updating and recalibration in diverse populations and on prospective studies to assess the clinical impact of implementing the scoring model in guiding treatment strategies.
Conclusion
In this multicenter real-world study, we developed and validated a scoring system to predict 6-month MTX treatment response in patients with RA. The model demonstrated modest discriminative ability and acceptable calibration across internal and external cohorts, with minimal overfitting. Using basic clinical predictors, this scoring system may serve as an adjunctive tool for early risk stratification to estimate the likelihood of treatment success, particularly in resource-limited settings. However, the model requires further prospective validation before it can be recommended to guide routine treatment decisions in clinical practice. Future research should focus on externally validating the model outside the Indonesian population, incorporating additional predictors, and assessing the clinical impact of using this score to guide individualized MTX therapy.
Supplemental Material
sj-docx-1-tab-10.1177_1759720X261454006 – Supplemental material for Development and validation of a clinical scoring system for the prediction of methotrexate treatment response in rheumatoid arthritis patients: a multicenter real-world study
Supplemental material, sj-docx-1-tab-10.1177_1759720X261454006 for Development and validation of a clinical scoring system for the prediction of methotrexate treatment response in rheumatoid arthritis patients: a multicenter real-world study by Rudy Hidayat, Fara Fauzia, Suryo Anggoro Kusumo Wibowo, Anna Ariane, Radiyati Umi Partan, Putri Muthia, Ika Vemilia Warlisti, Bantar Suntoko, Mirza Zaka Pratama, Cesarius Singgih Wahono, Lita Diah Rahmawati, Pande Ketut Kurniari, Anggarda Kristianti Utomo, Najirman Najirman, Eka Kurniawan, Yulyani Werdiningsih, Faridin Pango, Mochammad Alfansyah Dhifanra, Jessica Audrey and Faisal Parlindungan in Therapeutic Advances in Musculoskeletal Disease
Footnotes
Acknowledgements
We would like to thank the clinical and research staff—Johanda Damanik, Abirianty Priandani Araminta, Rakhma Yanti Hellmi, Brilliant, Bagus Putu Putra Suryana, Arinditia, Gede Kambayana, Dewa Ayu Kartika Tejawati, Sandra Surya Rini, I. Nyoman Suarjana, Arief Nurudhin, Indrayana, Abdul Rahman, and Nur Muallima—from the participating institutions for their valuable support in data collection.
Declarations
Supplemental material
Supplemental material for this article is available online.
References
Supplementary Material
Please find the following supplemental material available below.
For Open Access articles published under a Creative Commons License, all supplemental material carries the same license as the article it is associated with.
For non-Open Access articles published, all supplemental material carries a non-exclusive license, and permission requests for re-use of supplemental material or any part of supplemental material shall be sent directly to the copyright owner as specified in the copyright notice associated with the article.