
Abstract
Background:
Spectral computed tomography (CT) enables non-invasive visualization and quantification of monosodium urate deposits and has an important role in gout diagnosis and monitoring. However, artifact-related false-positive findings may reduce diagnostic confidence, particularly when artifacts show attenuation features overlapping with tophi.
Objectives:
To evaluate advanced spectral CT parameters as quantitative imaging biomarkers for differentiating tophi from common artifacts.
Design:
Prospective cross-sectional study.
Methods:
Consecutive participants with suspected foot gout were prospectively recruited from May 2023 to May 2024 and underwent foot spectral CT scans. Participants were classified into gout and non-gout groups. Regions of interest (ROIs) were delineated on index tophi in the gout group and on artifact regions in the non-gout group, including nail bed, skin, beam-hardening, vascular, and tendon artifacts. Conventional attenuation (HU120-kV) and three advanced spectral parameters (effective atomic number (Zeff), electron density (ED), and dual-energy ratio (DER)) were measured and compared. Diagnostic performance of each parameter was assessed using receiver operating characteristic curves and the area under the curve (AUC).
Results:
The final analysis included 82 tophus ROIs and 243 artifact ROIs. Tophi differed significantly from beam-hardening, vascular, and tendon artifacts across all parameters (p < 0.001). ED (AUC = 0.848–0.939) and HU120-kV (AUC = 0.819–0.935) showed the most consistent performance for overall artifacts, beam-hardening, vascular, and tendon artifacts, with no significant difference between them. In contrast, discrimination of nail bed and skin artifacts was more limited. DER (AUC = 0.728) and Zeff (AUC = 0.722) provided complementary values for nail bed artifacts, while ED showed the highest AUC for skin artifacts (AUC = 0.740).
Conclusion:
Spectral CT parameters may support artifact-specific tophus differentiation in gout. An artifact-specific parameter selection approach may help reduce false-positive interpretations and improve confidence in spectral CT-based gout assessment.
Trial registration:
Chinese Clinical Trial Registry, ChiCTR2300069114, https://www.chictr.org.cn/showproj.html?proj=185804.
Plain language summary
Keywords
Introduction
Gout is a metabolic disorder characterized by monosodium urate (MSU) crystal deposition resulting from sustained hyperuricemia, leading to inflammatory arthritis and progressive structural damage. 1 Its global prevalence has increased substantially in recent decades, imposing a growing burden on healthcare systems and patients’ quality of life. 2 Early and accurate identification of MSU deposition is essential for preventing disease progression, guiding urate-lowering therapy, and enabling optimal patient management.3–6
Spectral computed tomography (CT) has emerged as a valuable imaging tool for the detection and quantification of urate deposits, with reported high sensitivity and specificity.7–11 By exploiting differences in X-ray attenuation between MSU crystals and surrounding tissues, spectral CT enables color-coded visualization of urate deposition. However, most current urate analysis algorithms rely on fixed CT value thresholds, resulting in high false-positive rates and quantitative errors. 12 Although threshold adjustment may partially reduce false positives, it often occurs at the expense of decreased sensitivity, potentially leading to missed lesions. 13 These challenges highlight the need for more robust and individualized imaging strategies for gout diagnosis.
From a precision medicine perspective, reliance on single-parameter attenuation values is insufficient to capture the complex compositional characteristics of biological tissues. Several normal structures, such as tendons, calcifications, and nail beds, may exhibit attenuation properties overlapping with MSU crystals, further complicating accurate differentiation. 14 Therefore, the development of quantitative imaging biomarkers that reflect intrinsic material composition, rather than density alone, is critical to improving diagnostic specificity and enabling personalized image interpretation.
Spectral CT techniques, including dual-layer detector CT (DLCT), dual-source CT, and rapid kVp-switching CT, can provide quantitative material characterization beyond conventional attenuation values. Depending on the imaging platform and reconstruction algorithm, advanced spectral parameters such as effective atomic number (Zeff), electron density (ED), and dual-energy ratio (DER) may be obtained and used for material differentiation. Recently, advanced spectral parameters have shown potential value for material characterization and differentiation in various clinical applications, including tumor differentiation and urinary calculus composition analysis.15–19 In the field of gout diagnosis and treatment, some studies have found that there are significant differences in the Zeff and ED measurements between the tophi and artifacts in the cardiovascular system. 20 These findings indicate that advanced spectral parameters (Zeff, ED, DER, etc.) may be more conducive to differentiating gout and false positives than the currently used CT value, and thus may potentially enable the improvement of the current spectral CT gout analysis algorithm or the realization of a multi-parameter differentiated discrimination strategy.
This prospective study measured both conventional attenuation (HU120-kV) and advanced spectral parameters (Zeff, ED, DER) within spectral CT gout analysis algorithm-highlighted tissue regions, with the following objectives: (1) to investigate differences between true tophi and common artifact types, and (2) to assess the feasibility of using spectral parameters as quantitative imaging biomarkers to support personalized differentiation and improve diagnostic accuracy in gout.
Methods
The reporting of this study conforms to the Strengthening the Reporting of Observational Studies in Epidemiology statement, 21 and the completed checklist was included as Supplemental Appendix 2.
Participants
From May 2023 to May 2024, two rheumatologists prospectively and consecutively recruited adults with suspected gout affecting the feet. The inclusion criteria were as follows: (1) age ⩾18 years; (2) clinical suspicion of gout involving the foot or ankle, based on gout-related symptoms such as joint swelling, limited mobility, or joint pain; and (3) referral for spectral CT examination of the affected foot or feet based on the treating physician’s recommendation and the participant’s agreement. Clinical information, physical examination findings, serological results, and musculoskeletal ultrasound findings were collected as part of the composite clinical reference standard, and all participants underwent DLCT examination of the affected foot or feet.
Participants were classified into gout and non-gout groups based on a composite clinical reference standard according to the American College of Rheumatology and the European League Against Rheumatism introduced classification criteria for gout in 2015 (ACR/EULAR 2015 criteria). 22 The gout group included participants with an ACR/EULAR 2015 criteria score ⩾8 and a final clinical diagnosis of gout based on clinical manifestations, serological results, musculoskeletal ultrasound findings, and rheumatologist assessment. The non-gout group included participants with an ACR/EULAR 2015 criteria score <8 and a final clinical diagnosis of other non-gout joint diseases, such as osteoarthritis or synovitis.
Exclusion criteria comprised: (1) incomplete medical records; (2) an interval of more than 72 h between ultrasound and DLCT examinations; (3) clinically diagnosed gout participants without an analyzable index tophus regions of interest (ROI) suitable for quantitative measurement; and (4) severe artifacts compromising DLCT image quality. The participant recruitment workflow is detailed in Figure 1.
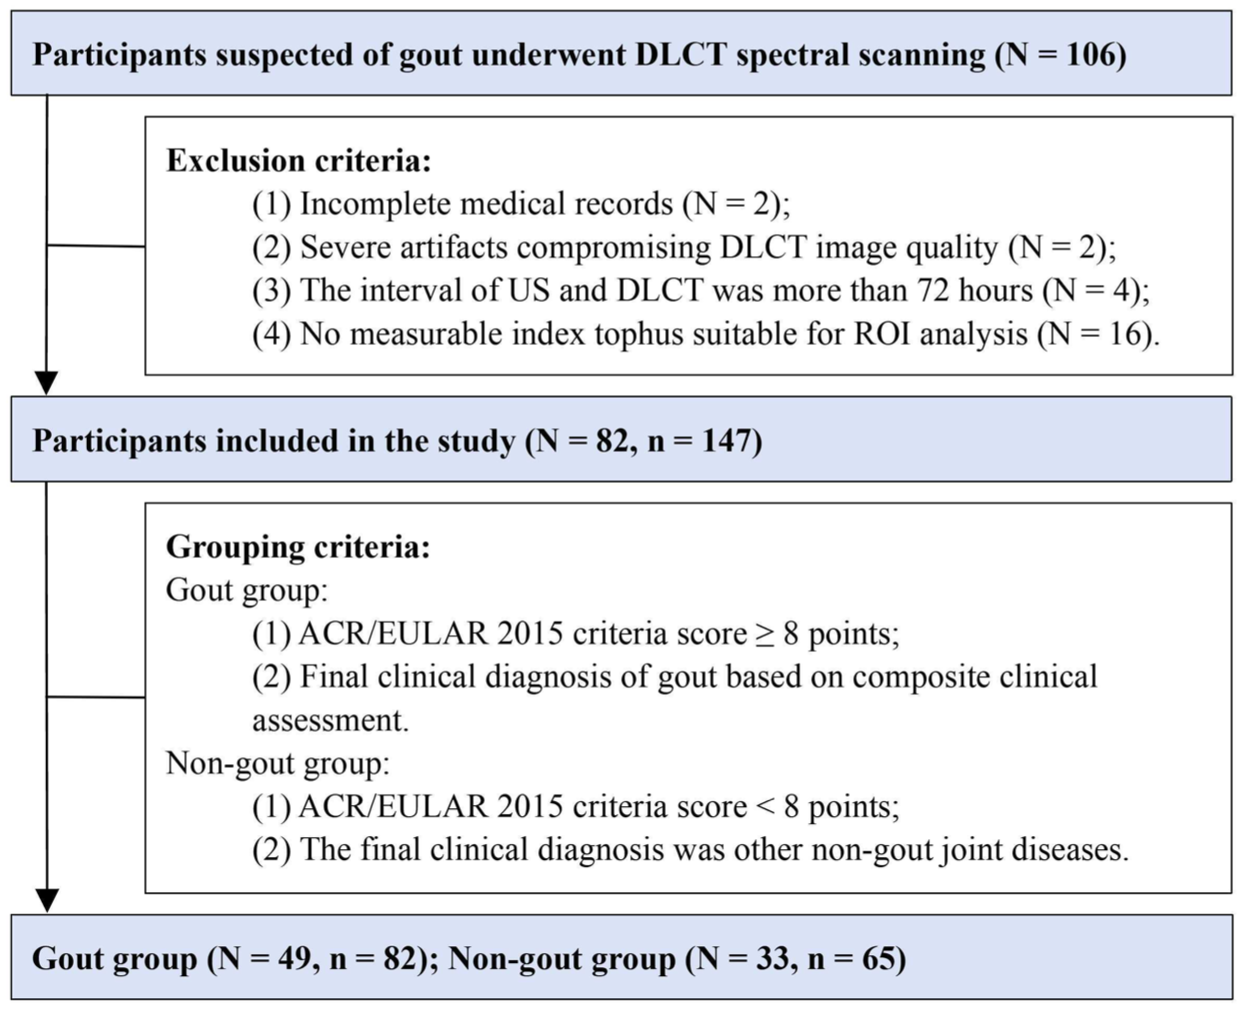
Participant recruitment workflow.
CT examination and post-processing
CT examinations of all participants were performed using the same DLCT scanner (CT7500 Spectral CT; Philips Healthcare, Amsterdam, Netherlands). Participants were positioned supine on the examination table, with the knees extended, feet internally rotated, and hands placed on the abdomen. The scan range extended from the tips of the toes to 2 cm above the ankle, covering the ankle joint and foot. The imaging parameters are as follows: tube voltage, 120 kV; tube current, 160 mA; collimator width, 128 × 0.625 mm2; field of view, 412 mm; pitch, 0.4; tube rotation time, 0.5 s; slice thickness, 0.67 mm; reconstruction interval, 0.67 mm.
The SBI dataset was imported into the IntelliSpace Portal post-processing workstation (V12.1; Philips Healthcare) for energy spectrum analysis to generate conventional grayscale images, Zeff images, ED images, uric acid images, virtual monoenergetic images (40-keV images, 70-keV images), and overlapping gout images (generated by overlaying uric acid maps onto conventional grayscale images; Figure 2).
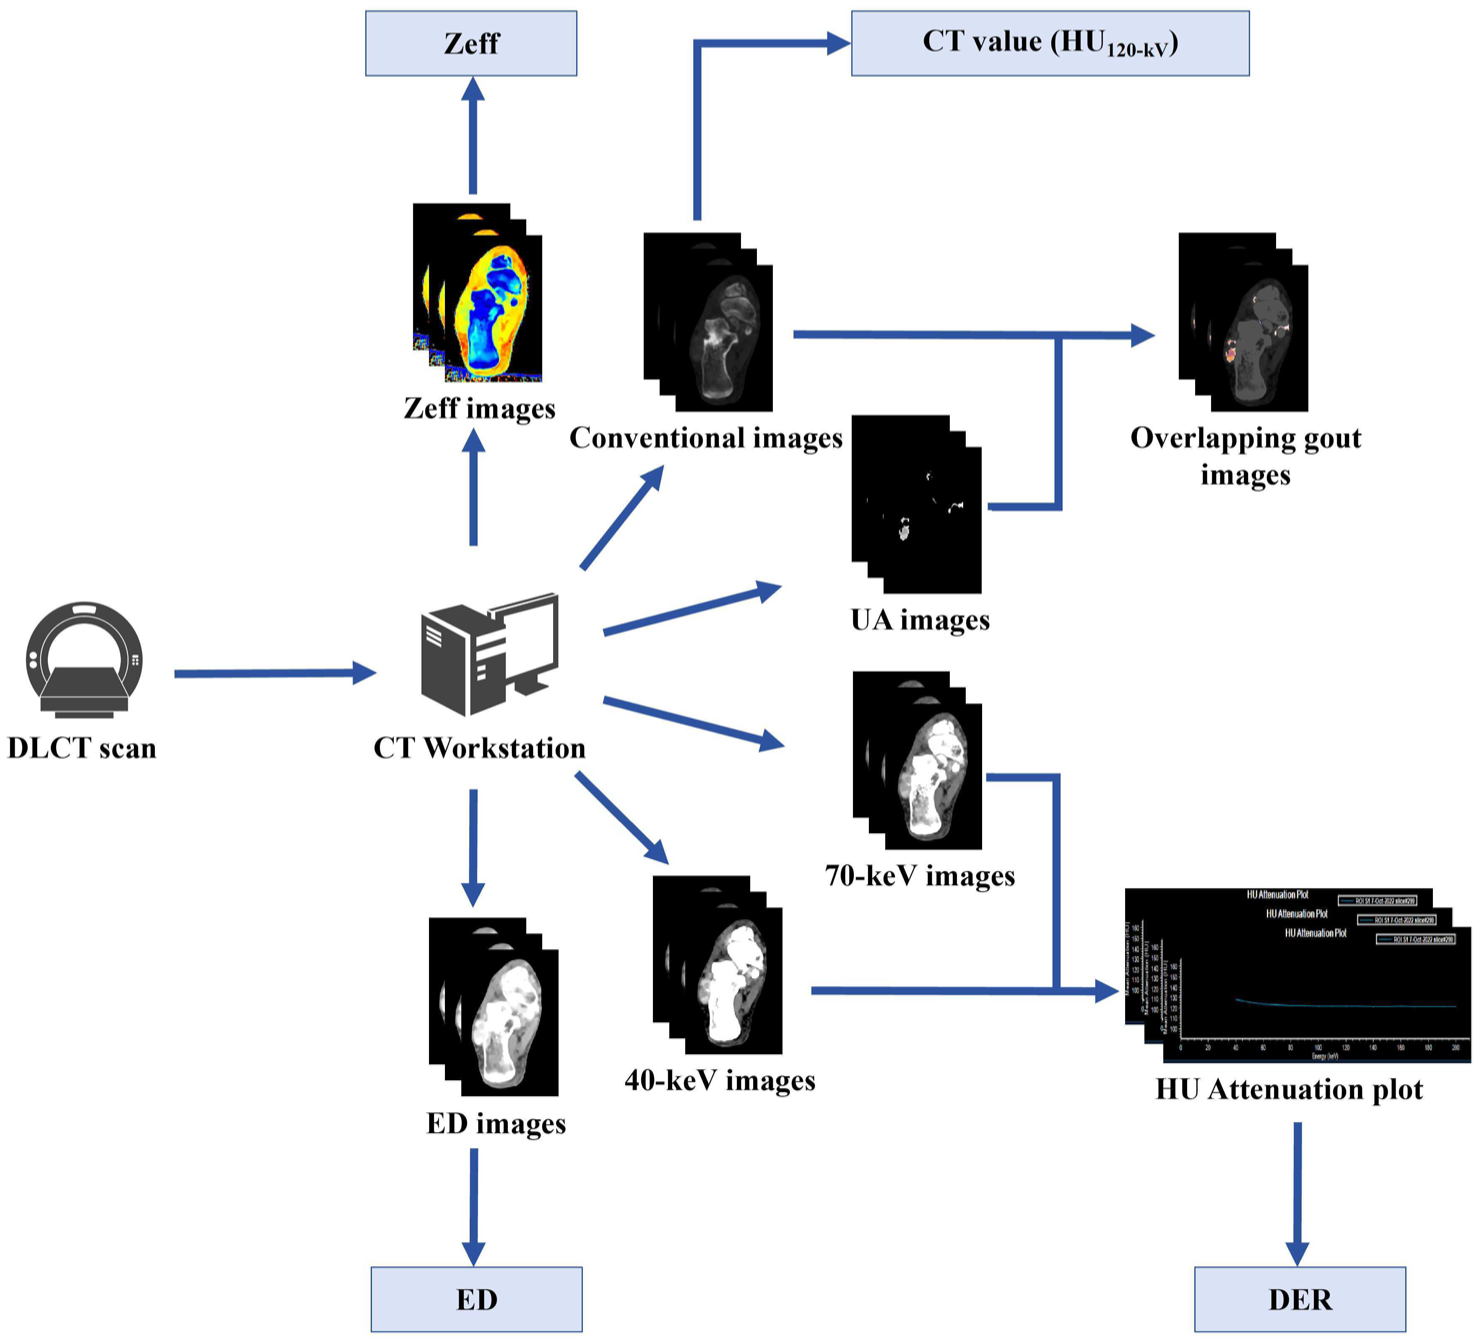
The image post-processing and measurement indicators of DLCT.
Imaging analysis
Two radiologists (Reader 1 (with 5 years of experience in musculoskeletal radiology) and Reader 2 (with 15 years of experience in musculoskeletal radiology)), both blinded to the clinical and laboratory data, independently reviewed all images and performed ROI delineation using the IntelliSpace Portal workstation (V12.1; Philips Healthcare). ROIs were selected from clearly identifiable tophi or artifacts based on image appearance, lesion location, and artifact pattern, as detailed in Supplemental Appendix 1 (Figure S1, Table S1). Regions with uncertain classification or poorly defined boundaries were excluded from the analysis. The measured parameter values were not used to determine ROI eligibility or classification.
Analysis in the non-gout group
For participants in the non-gout group, artifacts were identified on axial overlapping images and classified into five categories based on their underlying mechanisms: nail bed artifacts, skin artifacts, beam-hardening artifacts, vascular artifacts, and tendon artifacts (Supplemental Appendix 1, Figure S1, and Table S1).
For each participant, at most one representative ROI was selected for each artifact category, representing the most typical and confidently identified example of that artifact type. If an artifact type was absent or its classification was uncertain, no ROI was included for that category. ROI delineation was performed on the slice demonstrating the largest and most clearly defined stained region, while avoiding boundary transition zones and adjacent tissues to minimize partial volume effects (Figure 3).
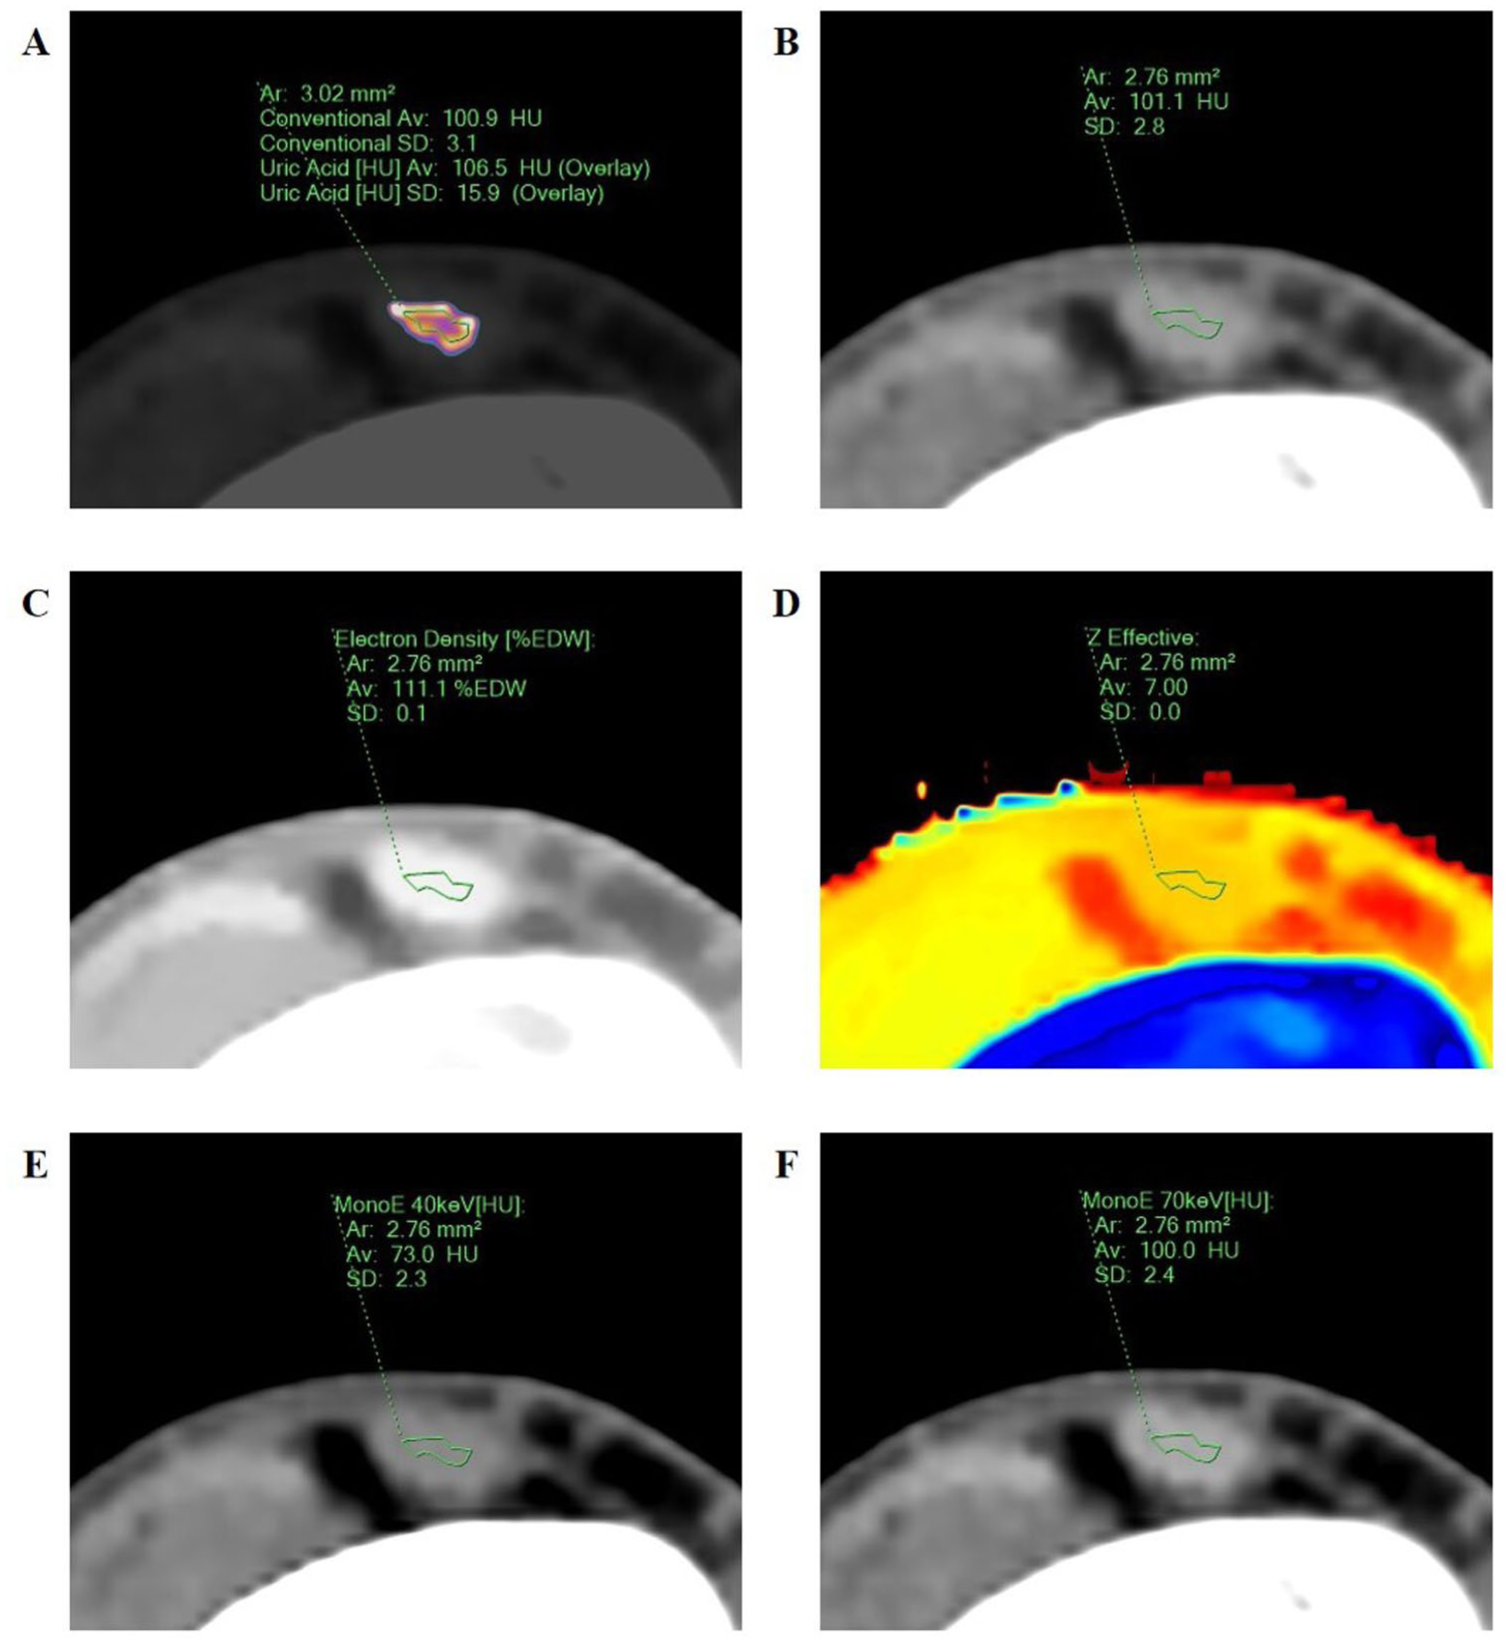
ROI delineation of the spectral CT quantitative parameters in a 46-year-old male with synovitis. The overlapping image (a) shows a pseudo-color staining within the tendon. An ROI is drawn and copied. The same ROI was pasted on the conventional image (b), ED image (c), Zeff image (d), 40 keV image (e), and 70 keV image (f) at the same level. Values of ROI: HU120-kV = 101.1 HU, ED = 111.1% EDW, Zeff = 7.00, HU40-keV = 73.0 HU, HU70-keV = 100.0 HU. The calculated DER = 0.90. HU120-kV = CT value measured by the conventional 120-kV images.
Analysis in the gout group
For participants in the gout group, the tophus with the largest volume was defined as the index tophus. ROI delineation was performed on the slice with the largest cross-sectional area of the index tophi.
A semi-automatic contour tracking tool was used, followed by manual adjustment to ensure accurate boundary definition. The ROI was required to cover at least two-thirds of the lesion area while avoiding edge transition zones to minimize partial volume effects and improve measurement reproducibility (Figure 4). Lesions with uncertain morphology were excluded.
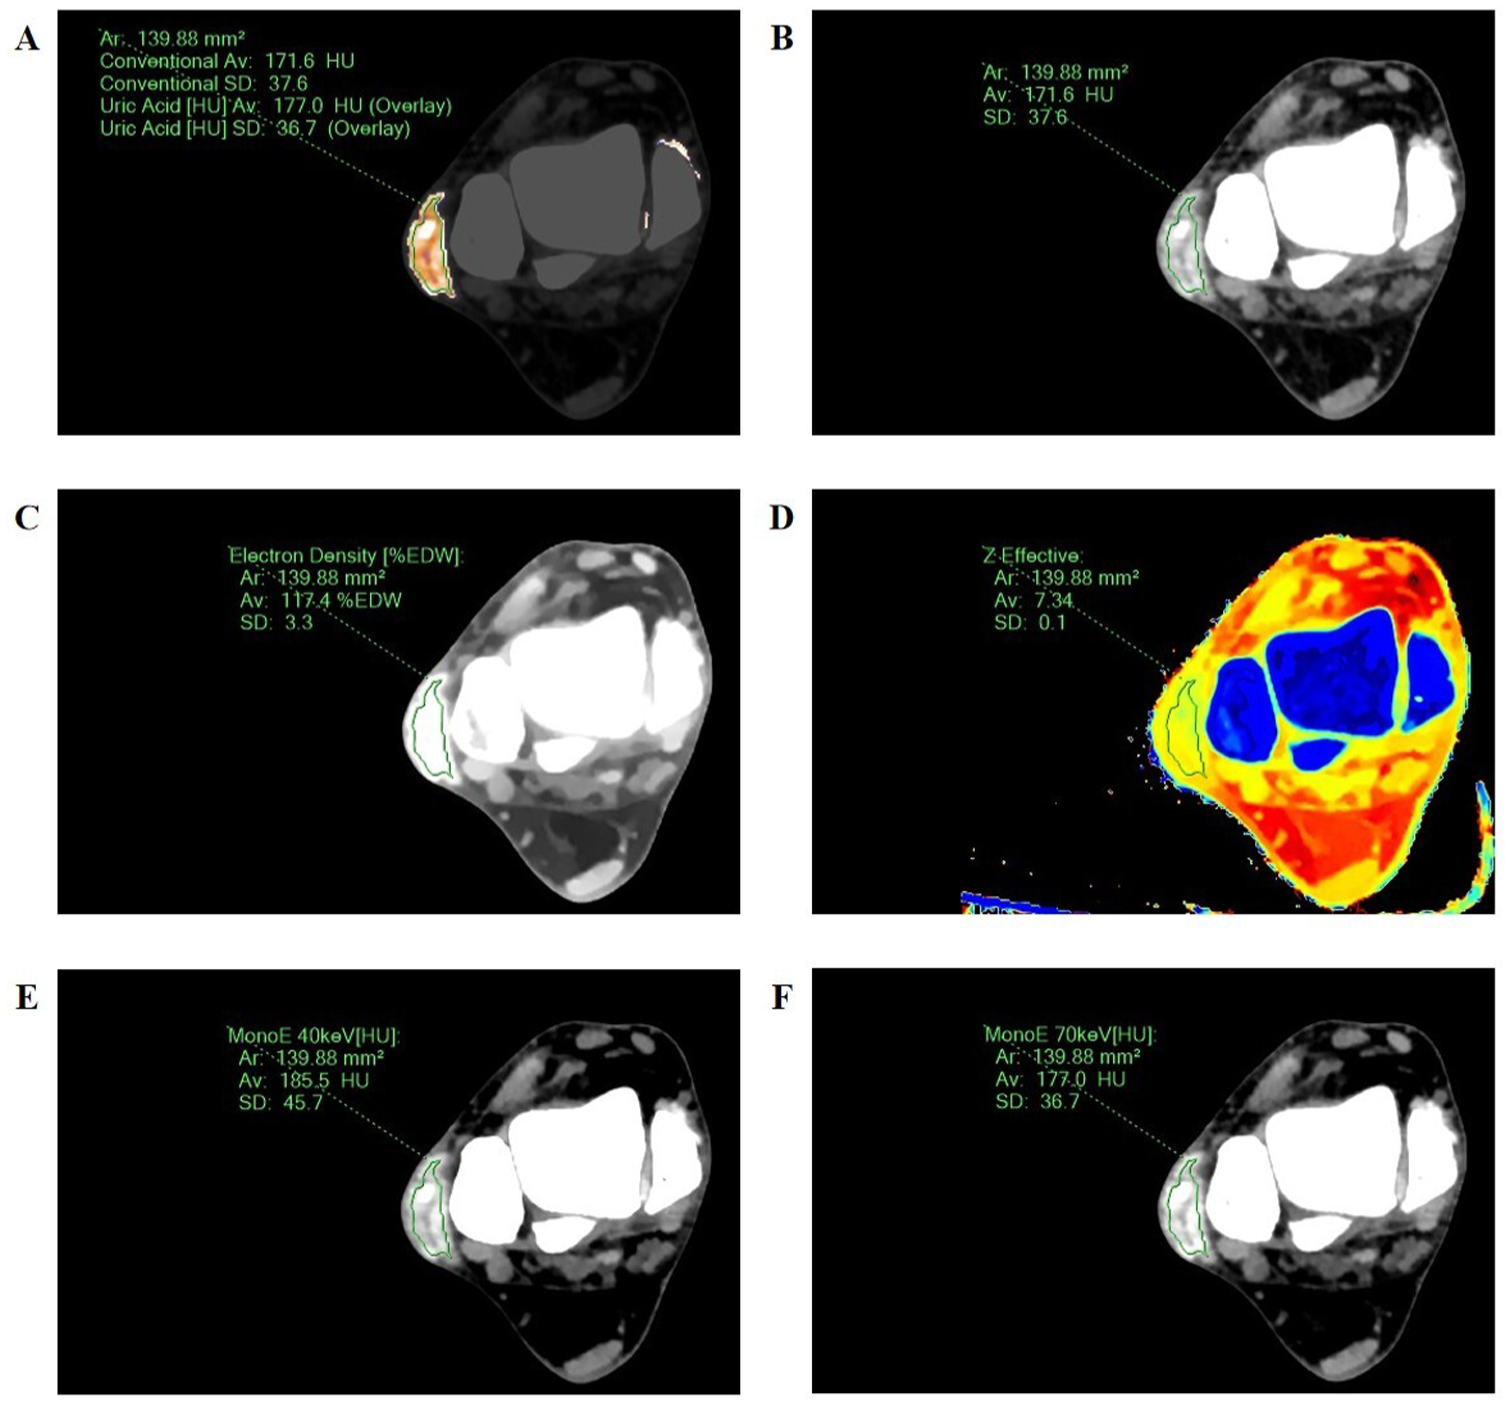
ROI delineation of the spectral CT quantitative parameters in a 45-year-old male with subcutaneous tophi. The overlapping image (a) shows a pseudo-color staining on the lateral side of the right foot. An ROI is drawn and copied. The same ROI was pasted on the conventional image (b), ED image (c), Zeff image (d), 40-keV image (e), and 70-keV image (f) at the same level. Values of ROI: HU120-kV = 171.6 HU, ED = 117.4% EDW, Zeff = 7.34, HU40-keV = 185.5 HU, HU70-keV = 177.0 HU. The calculated DER = −0.28. HU120-kV = CT value measured by the conventional 120-kV images.
Parameter acquisition
ROIs delineated on the overlapping gout images were copied to the conventional 120-kV CT images, the Zeff images, the ED images, the 40-keV images, and the 70-keV images (Figures 3 and 4). The workstation automatically calculated the following parameters for each ROI: (1) HU120-kV, defined as the mean CT value of the pixels within the ROI on the conventional 120-kV CT images; (2) Zeff, calculated based on the dual-energy CT material decomposition model; (3) ED, automatically standardized to the water equivalent ratio; (4) DER, calculated from the CT values measured on the 40- and 70-keV virtual monoenergetic images according to the following formula 23 :

Each reader performed ROI delineation three times, and the mean value of the three measurements was recorded for each parameter. Inter-observer agreement was assessed by comparing the mean measurements obtained by the two readers. To assess intra-observer agreement, Reader 1 repeated ROI delineation after a 30-day interval, and the repeated measurements were compared with the initial measurements. After confirming good inter- and intra-observer agreement, the averaged values from the two readers were used for the final statistical analysis.
An additional participant-level validation analysis was performed to further evaluate the robustness of the main findings. In this analysis, each gout participant contributed one representative index tophus ROI, and each non-gout participant contributed at most one representative ROI for each artifact category. The results were compared with those of the primary analysis.
Statistical analysis
All statistical analyses of this study were conducted using SPSS software (V27.0; IBM SPSS Corporation, Chicago, IL, USA), GraphPad Prism software (V9.3.1; GraphPad Software, Boston, MA, USA) and MedCalc software (V23.1.7; MedCalc Software Ltd, Ostend, Belgium).
The sample size was estimated for diagnostic receiver operating characteristic (ROC) analysis of continuous spectral CT-derived quantitative parameters using the Hanley–McNeil method by MedCalc software. 24 Assuming a null area under the ROC curve (AUC) of 0.50, an expected AUC of 0.70, a two-sided α of 0.05, 80% power, and a negative-to-positive sample size ratio of 0.5 for artifact-specific comparisons, at least 45 positive subjects and 23 negative subjects were required.
The Shapiro–Wilk test was used to test the normality of all quantitative data. Quantitative data conforming to the normal distribution were expressed as “mean ± standard deviation,” and quantitative data not conforming to the normal distribution were expressed as “median (interquartile range).” Qualitative data were expressed as “counts (percentages).”
The independent samples t-test was used for the comparison of two groups of quantitative data that conformed to the normal distribution. The Mann–Whitney U-test was used for the comparison of two groups of quantitative data that did not conform to the normal distribution. The Fisher’s exact test was used for the comparison of qualitative data between two groups. The Kruskal–Wallis H-test was used for the comparison of multiple groups of quantitative data, and the Dunn’s test was used for post hoc multiple comparisons. ROC curve, AUC, and the 95% confidence interval (CI) were used to describe the discriminatory ability of HU120-kV, Zeff, ED, and DER for tophi and artifacts. The differences in the discriminatory efficacy of ROC models for different indicators were analyzed using DeLong’s test. For each type of artifact, the Youden index, cutoff value, sensitivity, and specificity of the top AUC-dominant parameters were reported. The consistency between observers was evaluated by using a two-way random-effects, absolute-agreement, single-measure intraclass correlation coefficients (ICC). An ICC ⩾ 0.75 was considered to have good consistency. Statistical significance was defined as p < 0.05 for all tests.
Results
Participants
A total of 106 participants with suspected foot gout underwent DLCT spectral scanning. After applying the exclusion criteria, 24 participants were excluded because of incomplete medical records (n = 2), severe artifacts compromising DLCT image quality (n = 2), an interval of more than 72 h between ultrasound and DLCT examinations (n = 4), or no measurable index tophus suitable for ROI analysis (n = 16). Finally, 82 participants were included in the analysis, including 49 participants in the gout group (100% male) and 33 participants in the non-gout group (90.9% male; Figure 1). Based on clinical requirements, 16 participants in the gout group underwent unilateral foot DLCT, while 33 received bilateral examinations, yielding 82 spectral CT datasets of the feet. In the non-gout group, 32 participants underwent bilateral foot DLCT and 1 unilateral, providing 65 foot spectral CT datasets.
There were no statistically significant differences in gender distribution, age, weight, height, and body mass index between the two groups (p > 0.05). Detailed clinical characteristics of both groups are presented in Table 1.
Characteristics of participants in the gout and non-gout groups.
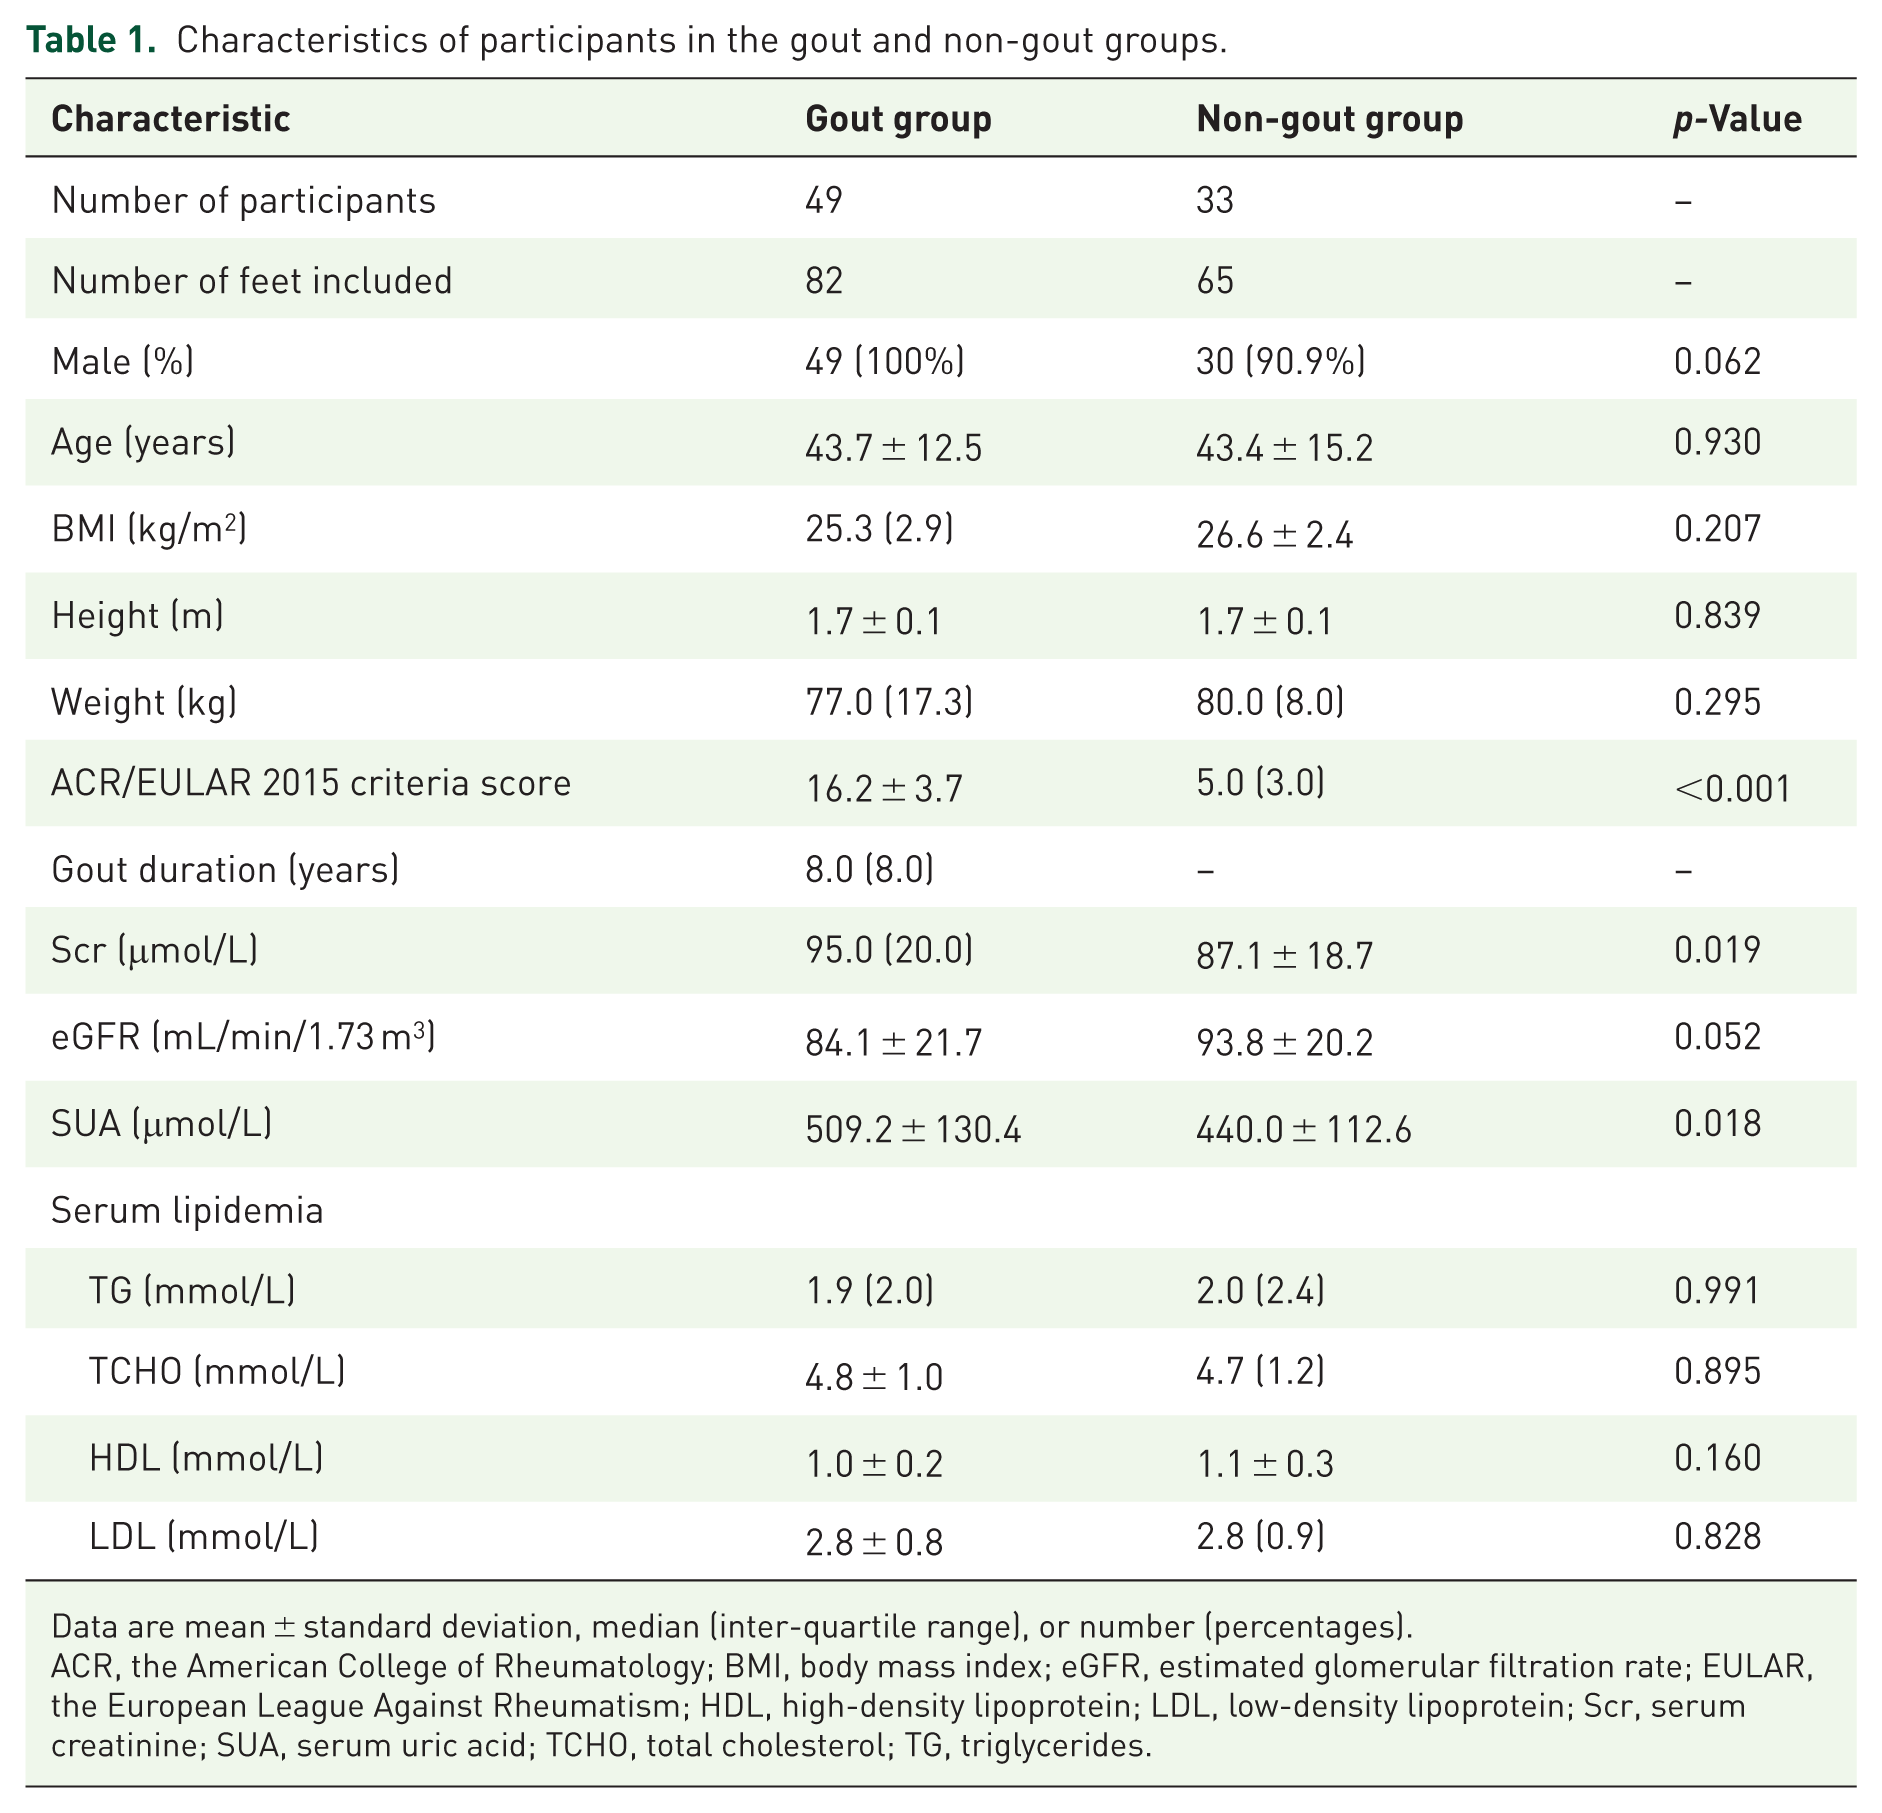
Data are mean ± standard deviation, median (inter-quartile range), or number (percentages).
ACR, the American College of Rheumatology; BMI, body mass index; eGFR, estimated glomerular filtration rate; EULAR, the European League Against Rheumatism; HDL, high-density lipoprotein; LDL, low-density lipoprotein; Scr, serum creatinine; SUA, serum uric acid; TCHO, total cholesterol; TG, triglycerides.
Quantitative CT parameter measurements of tophi and artifacts
The final analysis included 82 tophi ROIs and 243 artifact ROIs, including 47 nail-bed artifacts, 35 skin artifacts, 58 beam-hardening artifacts, 44 vascular artifacts, and 59 tendon artifacts. Inter- and intra-observer agreement for quantitative CT parameter measurements was good to excellent, with ICCs of 0.852–0.971 and 0.953–0.989, respectively (p < 0.001; Supplemental Appendix 1, Table S2).
Overall comparisons showed significant differences between tophi and the five artifact types across all parameters (all p < 0.001; Table 2). In pairwise comparisons, tophi differed significantly from beam-hardening, vascular, and tendon artifacts for all four parameters (all p < 0.0001). Zeff and DER further differentiated tophi from nail-bed artifacts (p < 0.05), whereas no parameter significantly differentiated tophi from skin artifacts (all p > 0.05). The distributions of parameter values and the corresponding pairwise comparison results are shown in Figure 5.
Comparison of quantitative CT parameters between tophi and different artifact types.
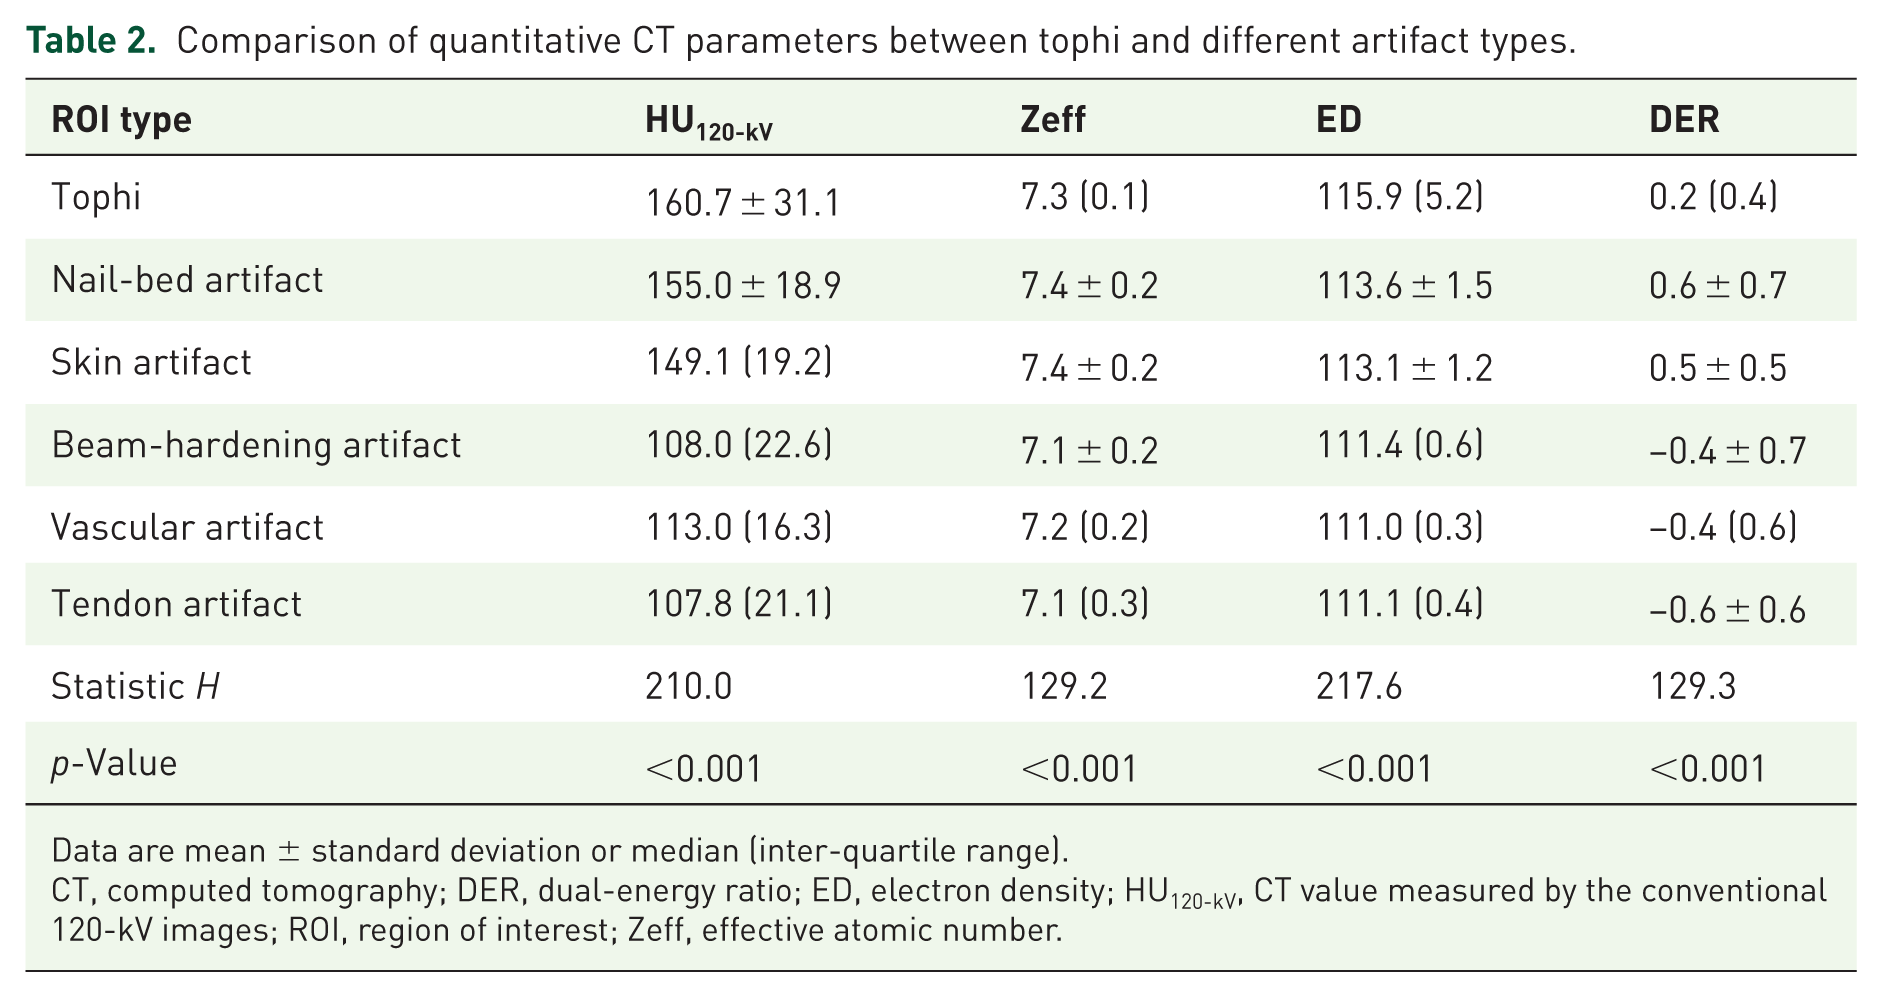
Data are mean ± standard deviation or median (inter-quartile range).
CT, computed tomography; DER, dual-energy ratio; ED, electron density; HU120-kV, CT value measured by the conventional 120-kV images; ROI, region of interest; Zeff, effective atomic number.
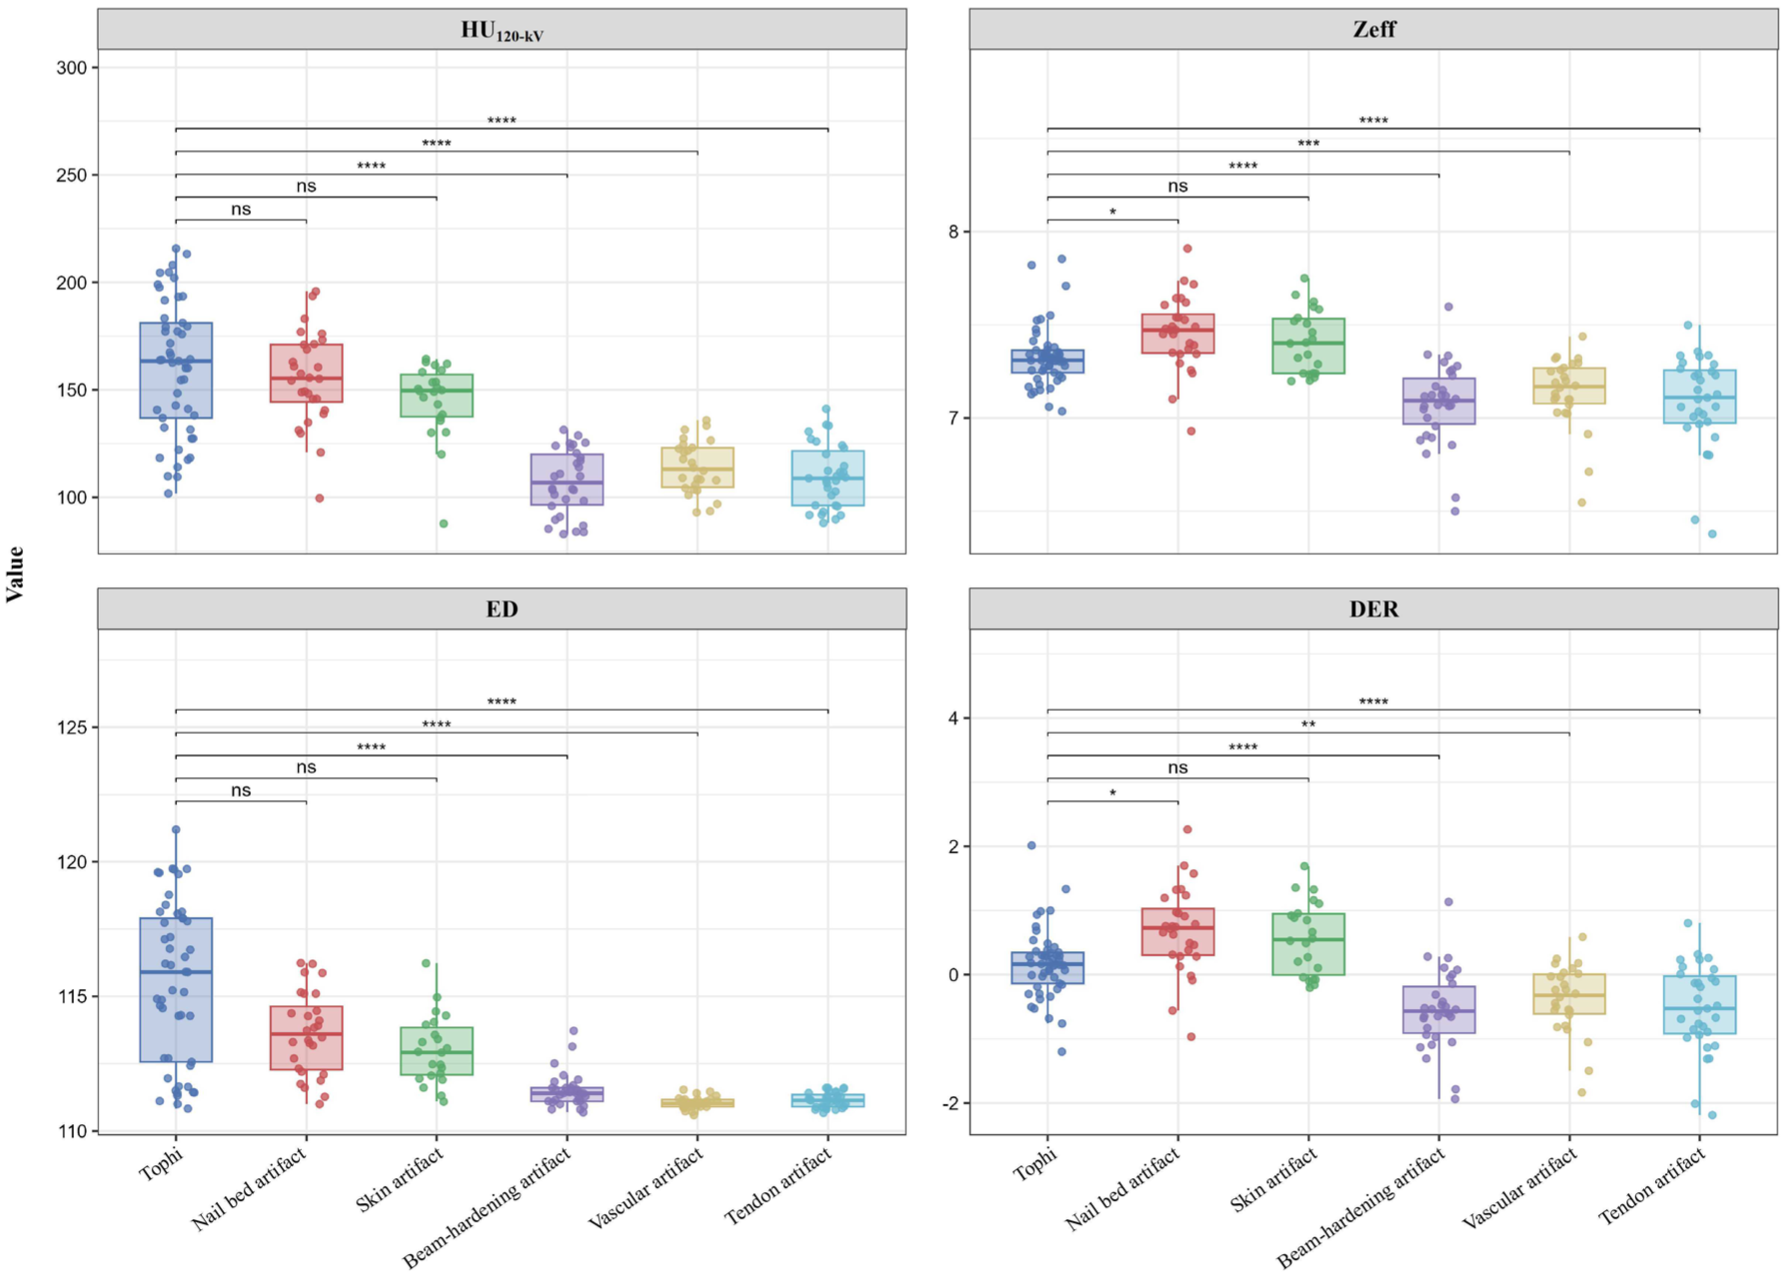
Comparison of spectral CT quantitative measurements between tophi and artifact ROIs. Box-and-scatter plots illustrate the distributions of HU120-kV, Zeff, ED, and DER across tophi and artifact ROIs. Statistical significance is indicated as follows:
Discriminative performance for tophi and different types of artifacts
AUC across artifact types
ROC analysis showed that the discriminative performance of quantitative CT parameters varied across artifact types (Figure 6). Detailed AUC values and pairwise DeLong test results are provided in Supplemental Appendix 1 (Tables S3 and S4).
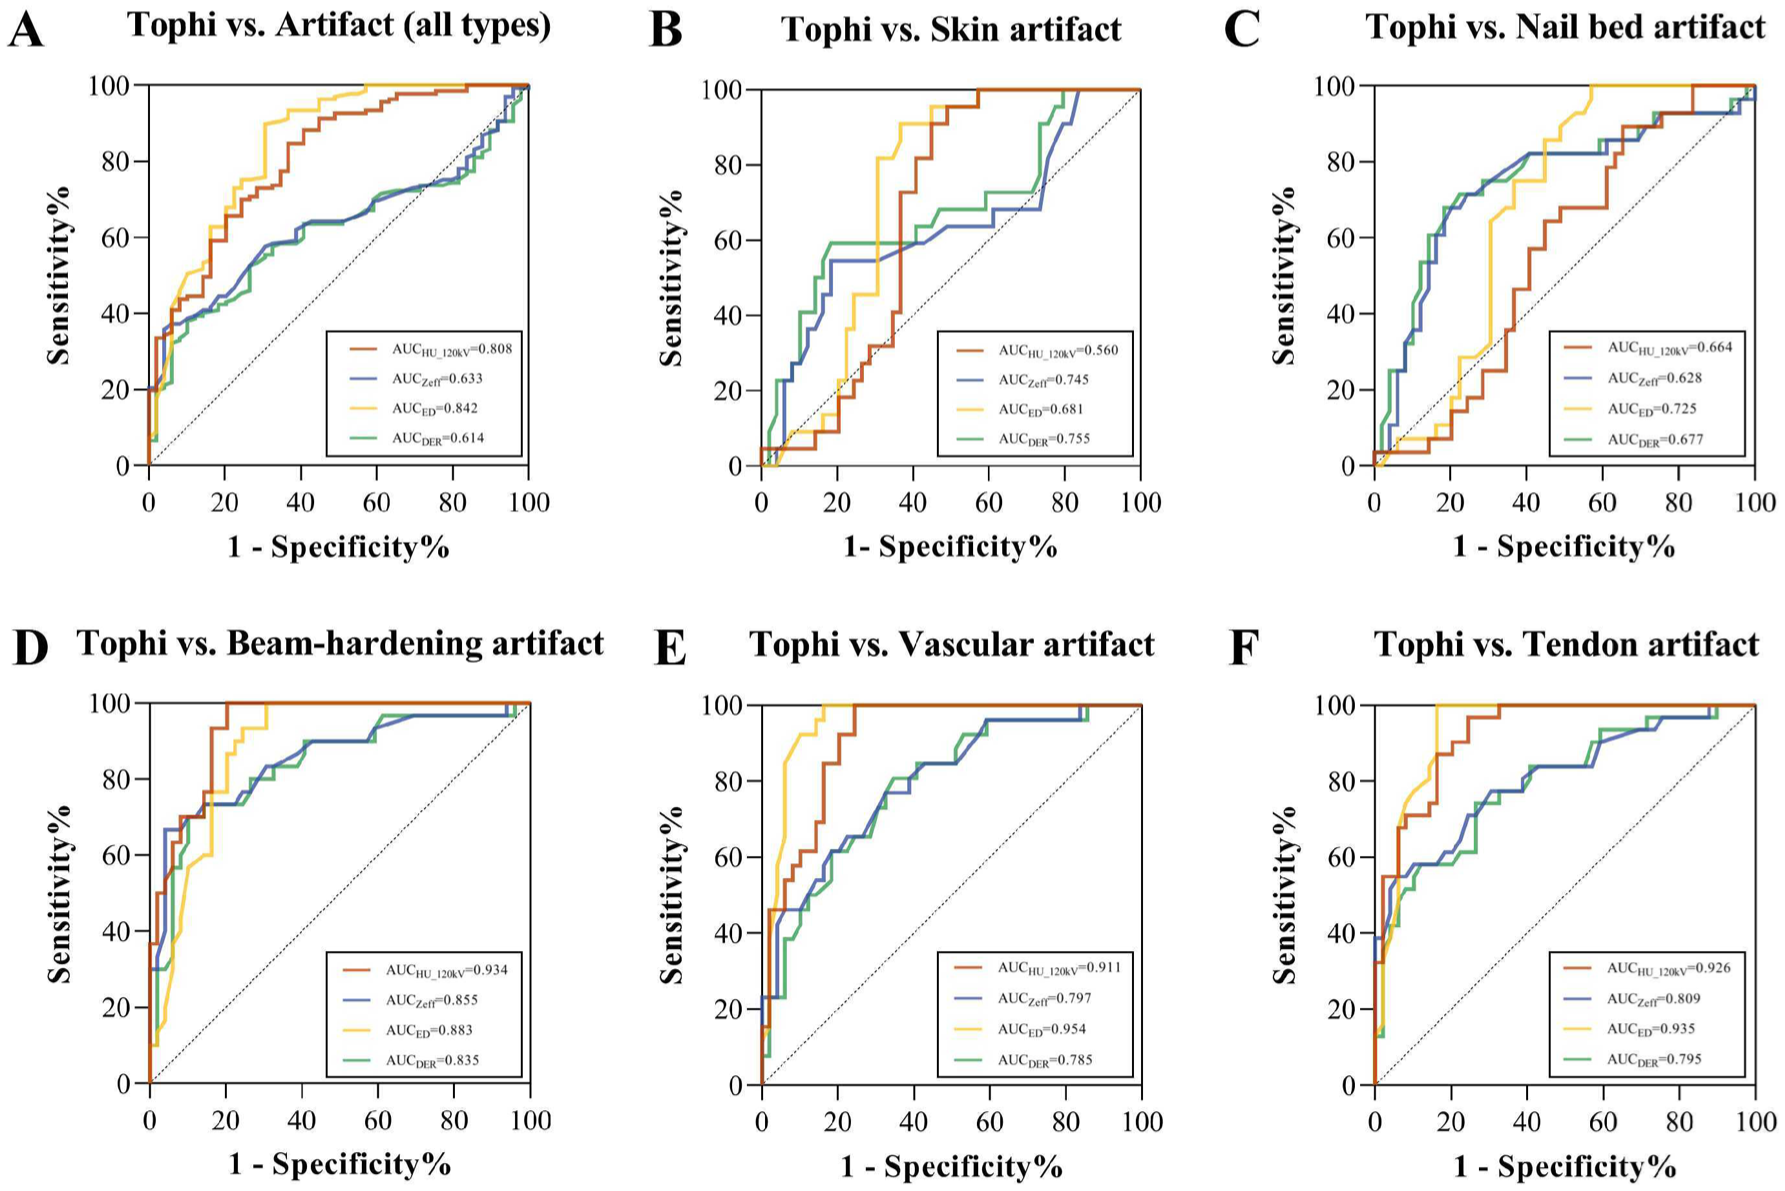
ROC analysis of spectral CT quantitative parameters for the diagnosis of tophi and artifacts. (A) Tophi vs. artifacts (all types). (B) Tophi vs. skin artifact. (C) Tophi vs. nail bed artifact. (D) Tophi vs. beam hardening artifact. (E) Tophi vs. vascular artifact. (F) Tophi vs. tendon artifact. The AUC of four parameters for each comparison is shown in the corresponding panel.
For artifacts of all types, ED showed the highest diagnostic performance (AUC = 0.848, 95% CI: 0.793–0.903), followed by HU120-kV (AUC = 0.819, 95% CI: 0.766–0.872). The difference between the AUC of ED and HU120-kV was not significant (p = 0.084), whereas both parameters significantly outperformed Zeff and DER (p < 0.0001).
The artifact-specific analysis showed different parameter patterns. For nail-bed artifacts, DER and Zeff yielded the highest AUCs (0.728 and 0.722, respectively), whereas HU120-kV showed no significant discrimination (AUC = 0.571, 95% CI: 0.473–0.669; p = 0.183). For skin artifacts, ED showed the highest AUC (0.740, 95% CI: 0.652–0.828), but no significant differences were observed among the four parameters. HU120-kV showed the highest performance for beam-hardening (AUC = 0.924, 95% CI: 0.883–0.964), vascular (AUC = 0.906, 95% CI: 0.855–0.956), and tendon artifacts (AUC = 0.935, 95% CI: 0.898–0.971), while ED yielded comparably high AUCs (AUC = 0.885–0.939).
Recommended parameters for artifact-specific discrimination
Based on the Youden index, recommended quantitative CT parameters and potential cutoff values were identified for each artifact-specific comparison (Table 3). ED showed the highest performance for artifacts of all types, as well as for skin, vascular, and tendon artifacts, with HU120-kV serving as a complementary parameter for overall, vascular, and tendon artifact discrimination. HU120-kV was the preferred parameter for beam-hardening artifacts, whereas ED provided an additional high-performing alternative. For nail-bed artifacts, DER and Zeff showed the highest AUCs and were selected as the recommended parameters. The participant-level validation analysis showed a consistent result pattern, and the detailed results are provided in Supplemental Appendix 1 (Tables S5–S9, Figures S2 and S3).
ROC analysis of recommended parameters for artifact-specific discrimination.
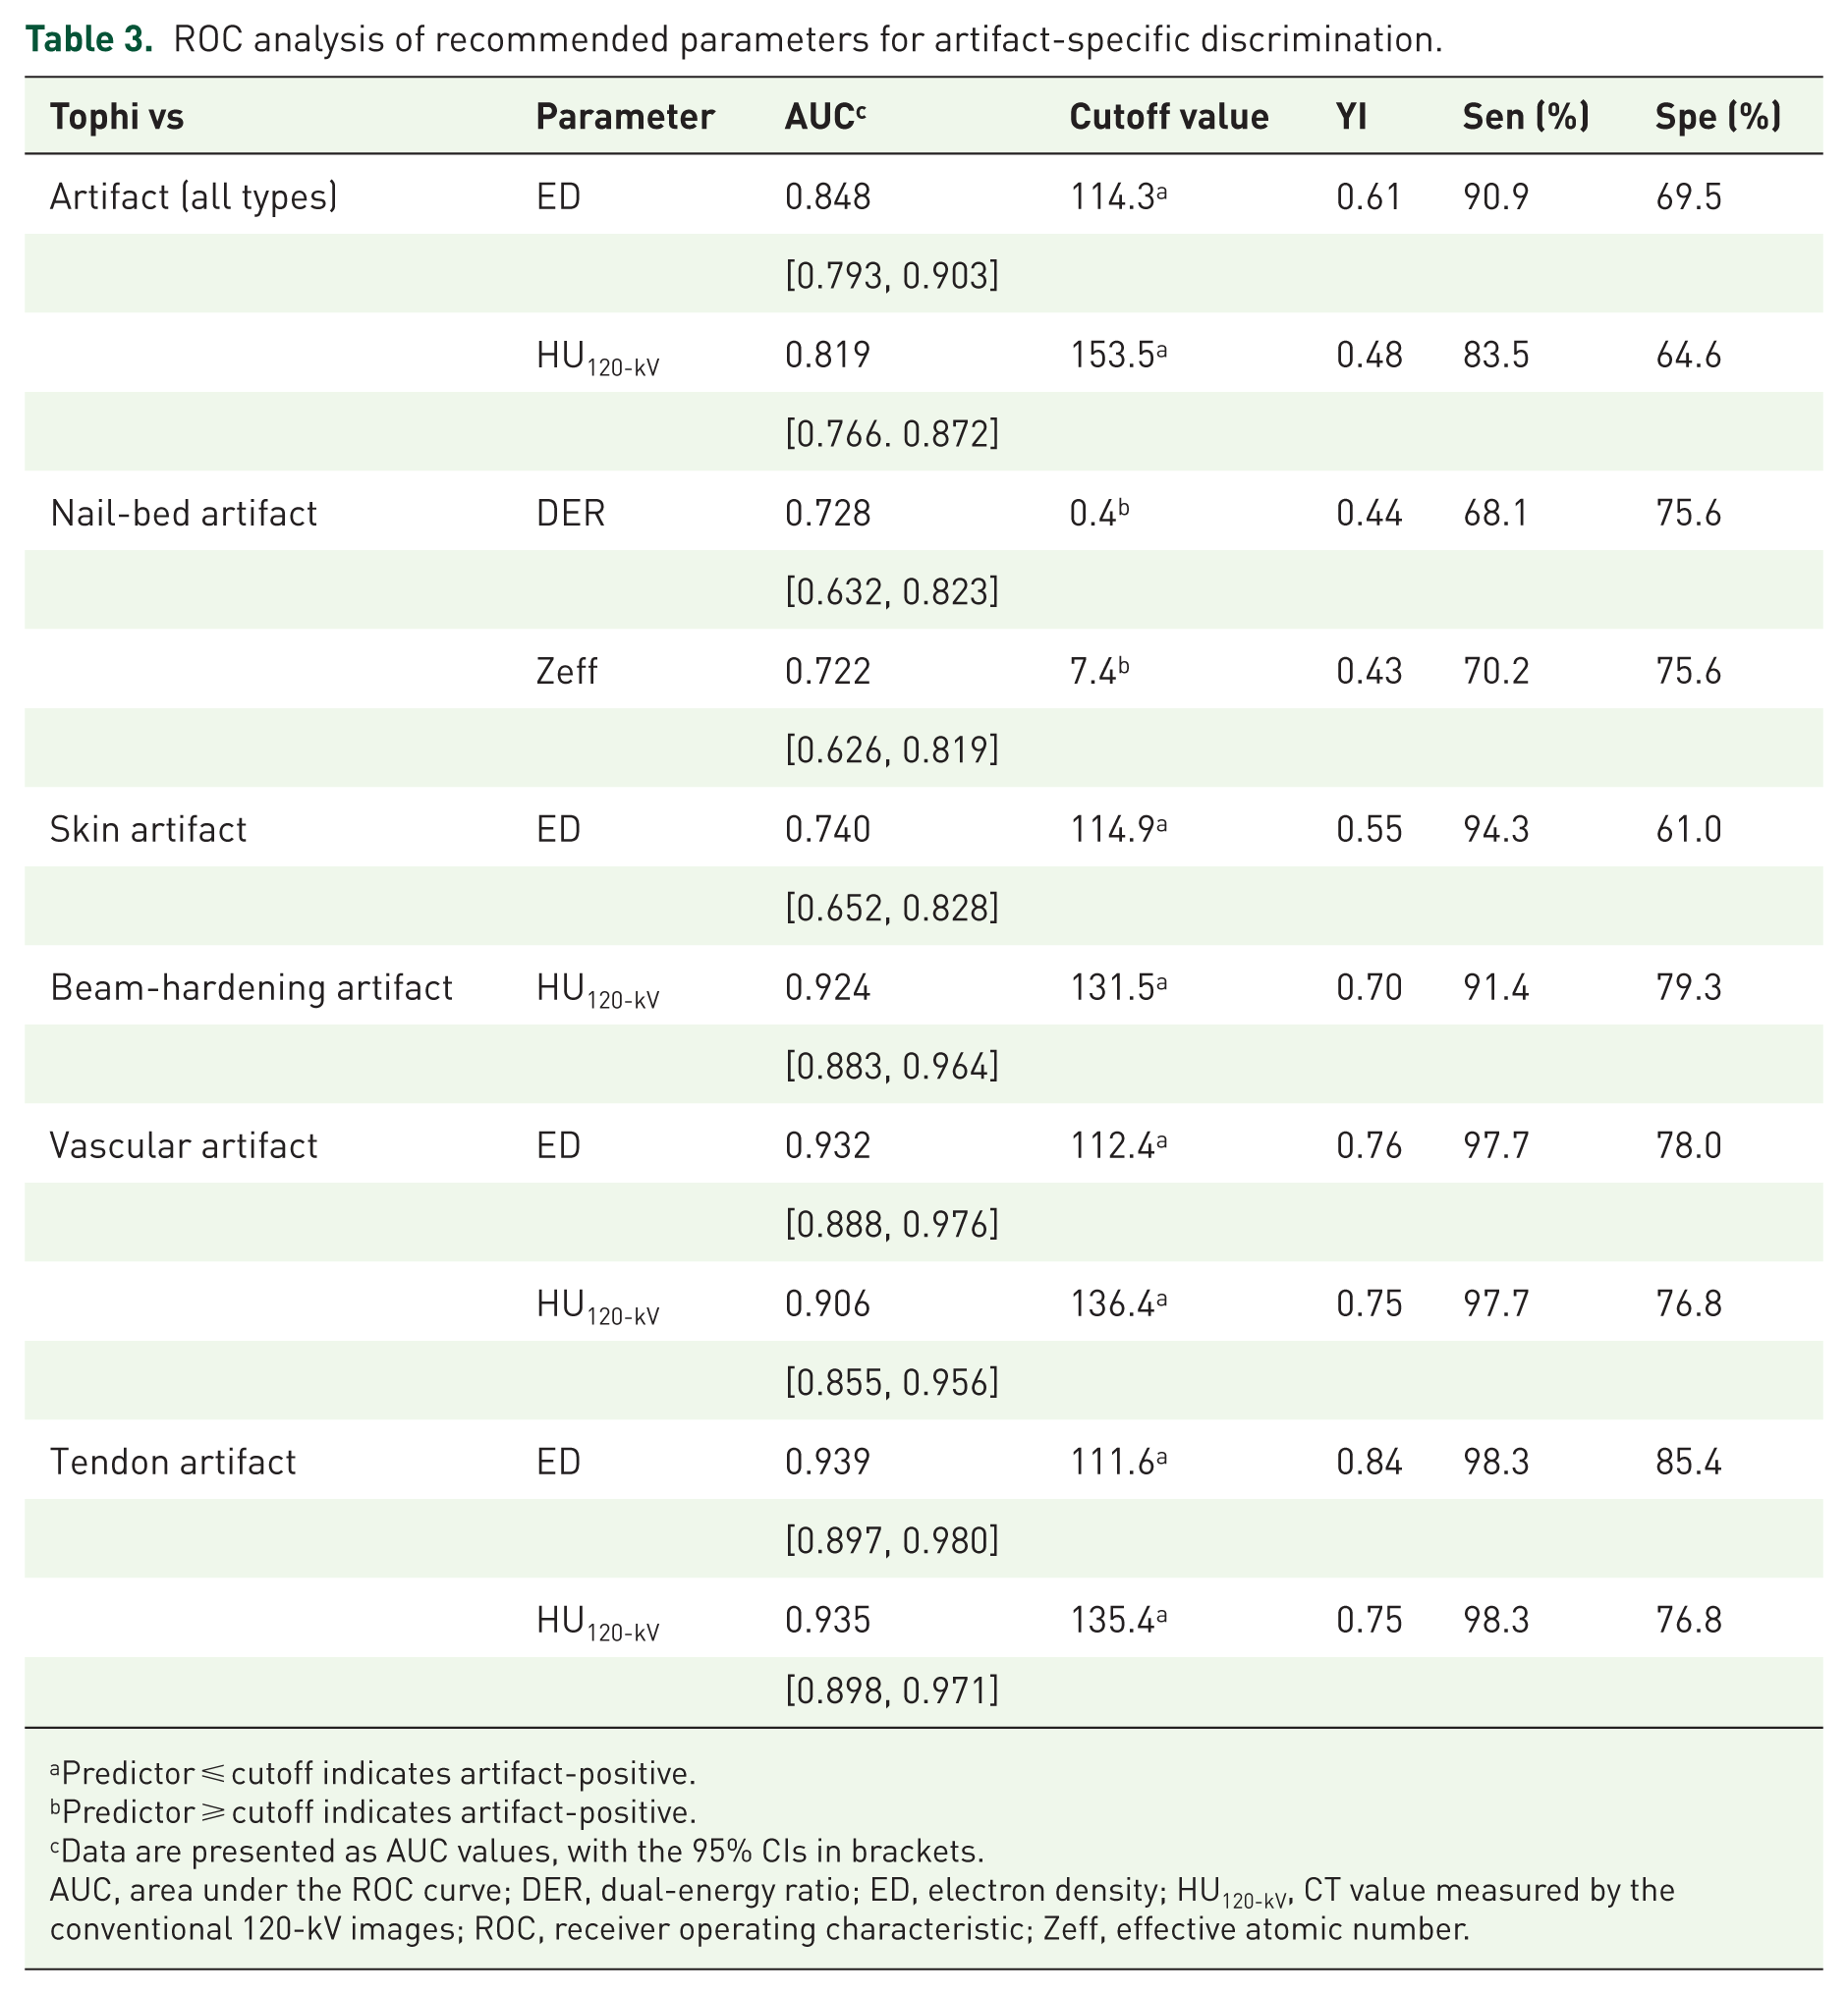
Predictor ⩽ cutoff indicates artifact-positive.
Predictor ⩾ cutoff indicates artifact-positive.
Data are presented as AUC values, with the 95% CIs in brackets.
AUC, area under the ROC curve; DER, dual-energy ratio; ED, electron density; HU120-kV, CT value measured by the conventional 120-kV images; ROC, receiver operating characteristic; Zeff, effective atomic number.
Discussion
This prospective study demonstrates that HU120-kV and advanced spectral parameters can help differentiate tophi from false-positive findings, with diagnostic performance varying across artifact types. Among the evaluated parameters, ED and HU120-kV showed the highest overall diagnostic performance, whereas Zeff and DER provided complementary value in selected applications, particularly for nail-bed artifacts. These findings support an artifact-specific parameter selection approach for improving the interpretability of spectral CT-based gout assessment.
Spectral CT plays an important role in gout imaging by enabling noninvasive visualization and quantification of MSU deposition. Compared with joint aspiration, serological assessment, and ultrasonography, spectral CT has distinct and complementary advantages: it avoids invasive sampling, provides lesion-level material-specific information beyond indirect biochemical information, and offers more objective three-dimensional evaluation of urate burden, particularly for anatomically complex or deep-seated deposits.25–27 This quantitative capability is clinically relevant to treat-to-target urate-lowering therapy, which aims to reduce serum urate below the saturation threshold and thereby promote MSU crystal dissolution. 28 Previous studies have linked MSU volume measured by spectral CT to treatment response and clinical outcomes in patients with gout.4,6,29,30 supporting its value not only in lesion detection but also in disease monitoring. However, these applications depend on reliable separation of true urate deposition from artifact-related false-positive findings. Therefore, the artifact-specific parameter strategy evaluated in this study may help refine spectral CT-based tophus assessment and support more reliable urate burden evaluation, thereby providing a basis for more individualized imaging interpretation in gout management.
The selection of Zeff, ED, and DER was based on their established roles in material characterization across various clinical applications and spectral CT platforms.31,32 Prior studies have shown that the relative performance of spectral parameters is context-dependent, with different parameters demonstrating superiority in specific applications: DER has outperformed Zeff in thyroid microcarcinoma and calcium pyrophosphate deposition detection,33,34 while Zeff has shown superiority in gastric cancer characterization, 35 and conventional Hounsfield unit (HU) has demonstrated comparable performance to Zeff in certain applications. 32 In cardiovascular gout research, significant differences in ED and Zeff between tophi and artifacts have also been reported. 20 Thus, we selected parameters with established diagnostic utility in other fields to provide a reference for future gout imaging studies.
The generally higher overall performance of ED and HU120-kV compared with Zeff and DER may be related to their underlying physical properties. Although ED and HU120-kV are both related to X-ray attenuation, they provide related but not identical information. HU120-kV reflects conventional attenuation on polychromatic 120-kV CT images and is influenced by both photoelectric absorption and Compton scattering, as well as beam-hardening and partial volume effects.36,37 In contrast, ED is derived from spectral decomposition and represents the ED of the material relative to water, making it more closely associated with the Compton scattering component and potentially less affected by attenuation overlap between MSU deposits and certain artifacts. 38 This may explain why ED showed a numerically higher overall AUC and more stable performance, while HU120-kV remained a strong complementary parameter. Zeff mainly reflects atomic-number-related differences driven by the photoelectric effect, whereas DER represents the slope of the spectral attenuation curve and is also referred to as λHU in some studies.32,35,39–41 Although DER has previously been reported to distinguish tophi with high accuracy, 42 Zeff and DER generally showed lower overall performance than ED and HU120-kV in our study. This may be because the moderate atomic number of MSU crystals (Zeff ≈ 7.0–7.7) overlaps with many biological tissues, limiting the ability of atomic-number-based parameters to distinguish materials with similar average Z, particularly with voxel heterogeneity or partial volume effects.
Despite these advances, certain artifact types remain challenging. A notable challenge was the poor differentiation of skin artifacts by all parameters (AUC: 0.630–0.740). These artifacts arise from uneven voxels in thickened skin, commonly in areas like the heel and toe. 43 Their spectral properties mimic intermediate-Z materials such as MSU. ED showed the highest discrimination (AUC = 0.740), possibly due to reduced water content in thickened skin. Nevertheless, the persistent overlap suggests that skin artifacts generate material signatures intrinsically similar to MSU at current DLCT resolution, making them an important source of false positives.44,45 In clinical interpretation, however, most skin artifacts can be identified by their location and appearance.43,44 For nail-bed artifacts, HU120-kV showed limited discriminative value, whereas DER and Zeff yielded the highest AUCs. Nails consist of sulfur-rich keratin, yielding higher Zeff and DER than MSU crystals. 46 While traditional HU-based algorithms misclassify dense keratin as MSU due to attenuation overlap, 47 spectral parameters partially overcome this by detecting atomic number disparities. However, the suboptimal AUCs of Zeff and DER indicate residual limitations, possibly due to keratin’s variable mineralization or the influence of adjacent soft tissues on spectral measurements.
Conversely, beam-hardening, vascular, and tendon artifacts were excellently discriminated by HU120-kV (AUC = 0.906–0.935) and ED (AUC = 0.885–0.939). Beam-hardening artifacts are algorithmic miscolorations without true density, and adjusting HU thresholds can reduce them. 48 Tendon artifacts, from densely packed collagen, exhibit high HU but lack MSU’s crystalline structure, allowing ED to detect electron-density differences. 49 Vascular artifacts related to calcification, iodine, or flow may be identified by ED or HU120-kV because their attenuation and electron-density characteristics differ from those of MSU.
The cutoff analysis further highlights the limitation of relying solely on attenuation-based threshold adjustment. Current spectral CT gout analysis algorithms commonly rely on a specific HU threshold for voxel classification. In our study, the HU120-kV cutoffs for beam-hardening, vascular, and tendon artifacts clustered around 130 HU (131.5–136.4 HU), while the overall artifact cutoff was 153.5 HU. This pattern aligns with commonly used or investigated HU thresholds in spectral CT gout algorithms (120, 150, and 170 HU), and helps explain why increasing the attenuation threshold can reduce artifact-related false-positive findings.30,48,50–52 However, threshold elevation may also exclude true MSU deposits with lower attenuation, thereby reducing sensitivity and underestimating lesion burden. 50 Recent studies have explored multiparametric spectral CT approaches to improve MSU detection beyond HU-threshold algorithms,53,54 while methods based on artificial intelligence have been investigated for image reconstruction and precise lesion differentiation.55–57 These developments suggest a shift toward more quantitative, multiparametric, and automated interpretation in gout imaging. Our artifact-specific findings may therefore provide useful reference for future refinement of spectral CT-based tophus interpretation and algorithm development.
This study has several limitations. First, DER calculation lacks standardization in gout research. While most studies use 40- and 70-keV images,23,35,40,41 others use different energy levels.32,33,39,58,59 Whether the differences in calculation methods will lead to variations in diagnostic efficacy still needs further exploration. Second, differences in spectral CT platforms, scanner vendors, reconstruction algorithms, and parameter calibration may affect the generalizability of the cutoff values reported in this study. Further multi-platform validation is needed, although the artifact-specific parameter selection strategy may provide a useful reference for future studies. Third, synovial fluid crystal confirmation was not used as a lesion-level reference standard. Although synovial fluid aspiration is considered the gold standard, it is invasive and difficult to spatially match with individual spectral CT deposits. To improve measurement consistency and reduce classification ambiguity, ROI selection was restricted to clearly identifiable tophi and artifacts, while equivocal regions were excluded. Moreover, although the sample size supported the planned diagnostic performance analysis in this study, larger cohorts may be required to further evaluate the small differences in AUCs between individual parameters, particularly between ED and HU120-kV. Finally, certain artifacts (such as nail-bed or skin-related artifacts) remain difficult to differentiate. Future advances in spectral CT technology and post-processing methods may further improve discrimination performance.
Conclusion
In summary, spectral CT quantitative parameters (HU120-kV, Zeff, ED, DER) showed distinct characteristics between tophi and common artifacts, supporting their potential role as precision imaging biomarkers in gout. An artifact-specific parameter selection approach may improve the reliability of spectral CT-based tophus differentiation, reduce artifact-related false-positive findings, and provide a quantitative basis for more individualized image interpretation.
Supplemental Material
sj-docx-1-tab-10.1177_1759720X261458947 – Supplemental material for Precision imaging biomarkers for gout: artifact-specific spectral CT parameters for personalized differentiation of tophi in a prospective study
Supplemental material, sj-docx-1-tab-10.1177_1759720X261458947 for Precision imaging biomarkers for gout: artifact-specific spectral CT parameters for personalized differentiation of tophi in a prospective study by Yiteng Zhang, Yu Zhang, Yi Liu, Hanyu Li, Zejun Liang, Jianrong He, Jun Xie, Zhenlin Li and Jing Tang in Therapeutic Advances in Musculoskeletal Disease
Supplemental Material
sj-docx-2-tab-10.1177_1759720X261458947 – Supplemental material for Precision imaging biomarkers for gout: artifact-specific spectral CT parameters for personalized differentiation of tophi in a prospective study
Supplemental material, sj-docx-2-tab-10.1177_1759720X261458947 for Precision imaging biomarkers for gout: artifact-specific spectral CT parameters for personalized differentiation of tophi in a prospective study by Yiteng Zhang, Yu Zhang, Yi Liu, Hanyu Li, Zejun Liang, Jianrong He, Jun Xie, Zhenlin Li and Jing Tang in Therapeutic Advances in Musculoskeletal Disease
Footnotes
References
Supplementary Material
Please find the following supplemental material available below.
For Open Access articles published under a Creative Commons License, all supplemental material carries the same license as the article it is associated with.
For non-Open Access articles published, all supplemental material carries a non-exclusive license, and permission requests for re-use of supplemental material or any part of supplemental material shall be sent directly to the copyright owner as specified in the copyright notice associated with the article.