






Abstract
The Single European Sky (SES) legislation is intended to have a major impact on the fragmentation in the European Air Traffic Management and Communications, Navigation and Surveillance (ATM/CNS) system. A fundamental aspect of the SES initiative is functional airspace blocks (FABs), which have the goal of reducing the inefficiencies—in terms of safety, capacity, and cost—that result from the fragmentation of European airspace. FABs are seen as an explicit bottom-up first step toward the ultimate integration of European airspace. In this article, we focus on the analysis of the evolution of the cost-effectiveness in the provision of ATM/CNS services at FABs. We proceed in two stages. First, we develop a theoretical framework that allows us to decompose the change in cost-effectiveness of FABs into its basic sources. Second, we use stochastic frontier analysis techniques to estimate the cost equations and decompose the change in the cost-effectiveness of the nine European FABs into several components. Our analysis sheds light on (1) the drivers of changes in the air navigation service providers (ANSPs) and FABs cost-effectiveness from 2006 to 2016, (2) the role that FABs play in enhancing cooperation between ANSPs to obtain operational efficiency gains, and (3) the existence of economies of scale in the European ATM/CNS service provision.
Introduction
The “Roadmap to a single European Transport Area” (EC, 2011) recognizes the need to develop a competitive and efficient system that will remove barriers and increase mobility. In this regard, the main challenge for a key transport mode such as aviation is to address the capacity, efficiency, and connectivity constraints imposed by a fragmented European airspace. In order to achieve this, a high-level group report was launched in November 2000 (EC, 2000), which led to the EU creating an ambitious regulatory initiative: the so-called Single European Sky (SES) legislation.
The SES legislation was adopted by the EU Council and European Parliament and entered into force in April 2004 and is intended to have a major impact on the fragmentation in the European Air Traffic Management and Communications, Navigation and Surveillance (ATM/CNS) system. A fundamental aspect of the SES initiative is the functional airspace blocks (FABs), which have the goal of reducing the inefficiencies 1 related to safety, capacity, and cost that result from the fragmentation of European airspace. FABs are seen as an explicit bottom-up response to the ultimate integration of European airspace.
The regulatory framework upon which FABs were developed was settled in the first legislative package of the SES (SES I) (EC, 2004). FABs are now the main means for reducing the European airspace fragmentation. The SES II tackles the creation of FABs in terms of service provision, in addition to the airspace organization issues (EC, 2009). There are nine FABs planned for Europe (see Figure 1 and Online Supplementary Table A.1) and their long-term implementation has suffered important delays. The FABs should have been completed by December 2012 and implementation is still far too slow for almost all FABs (Fox, 2016).
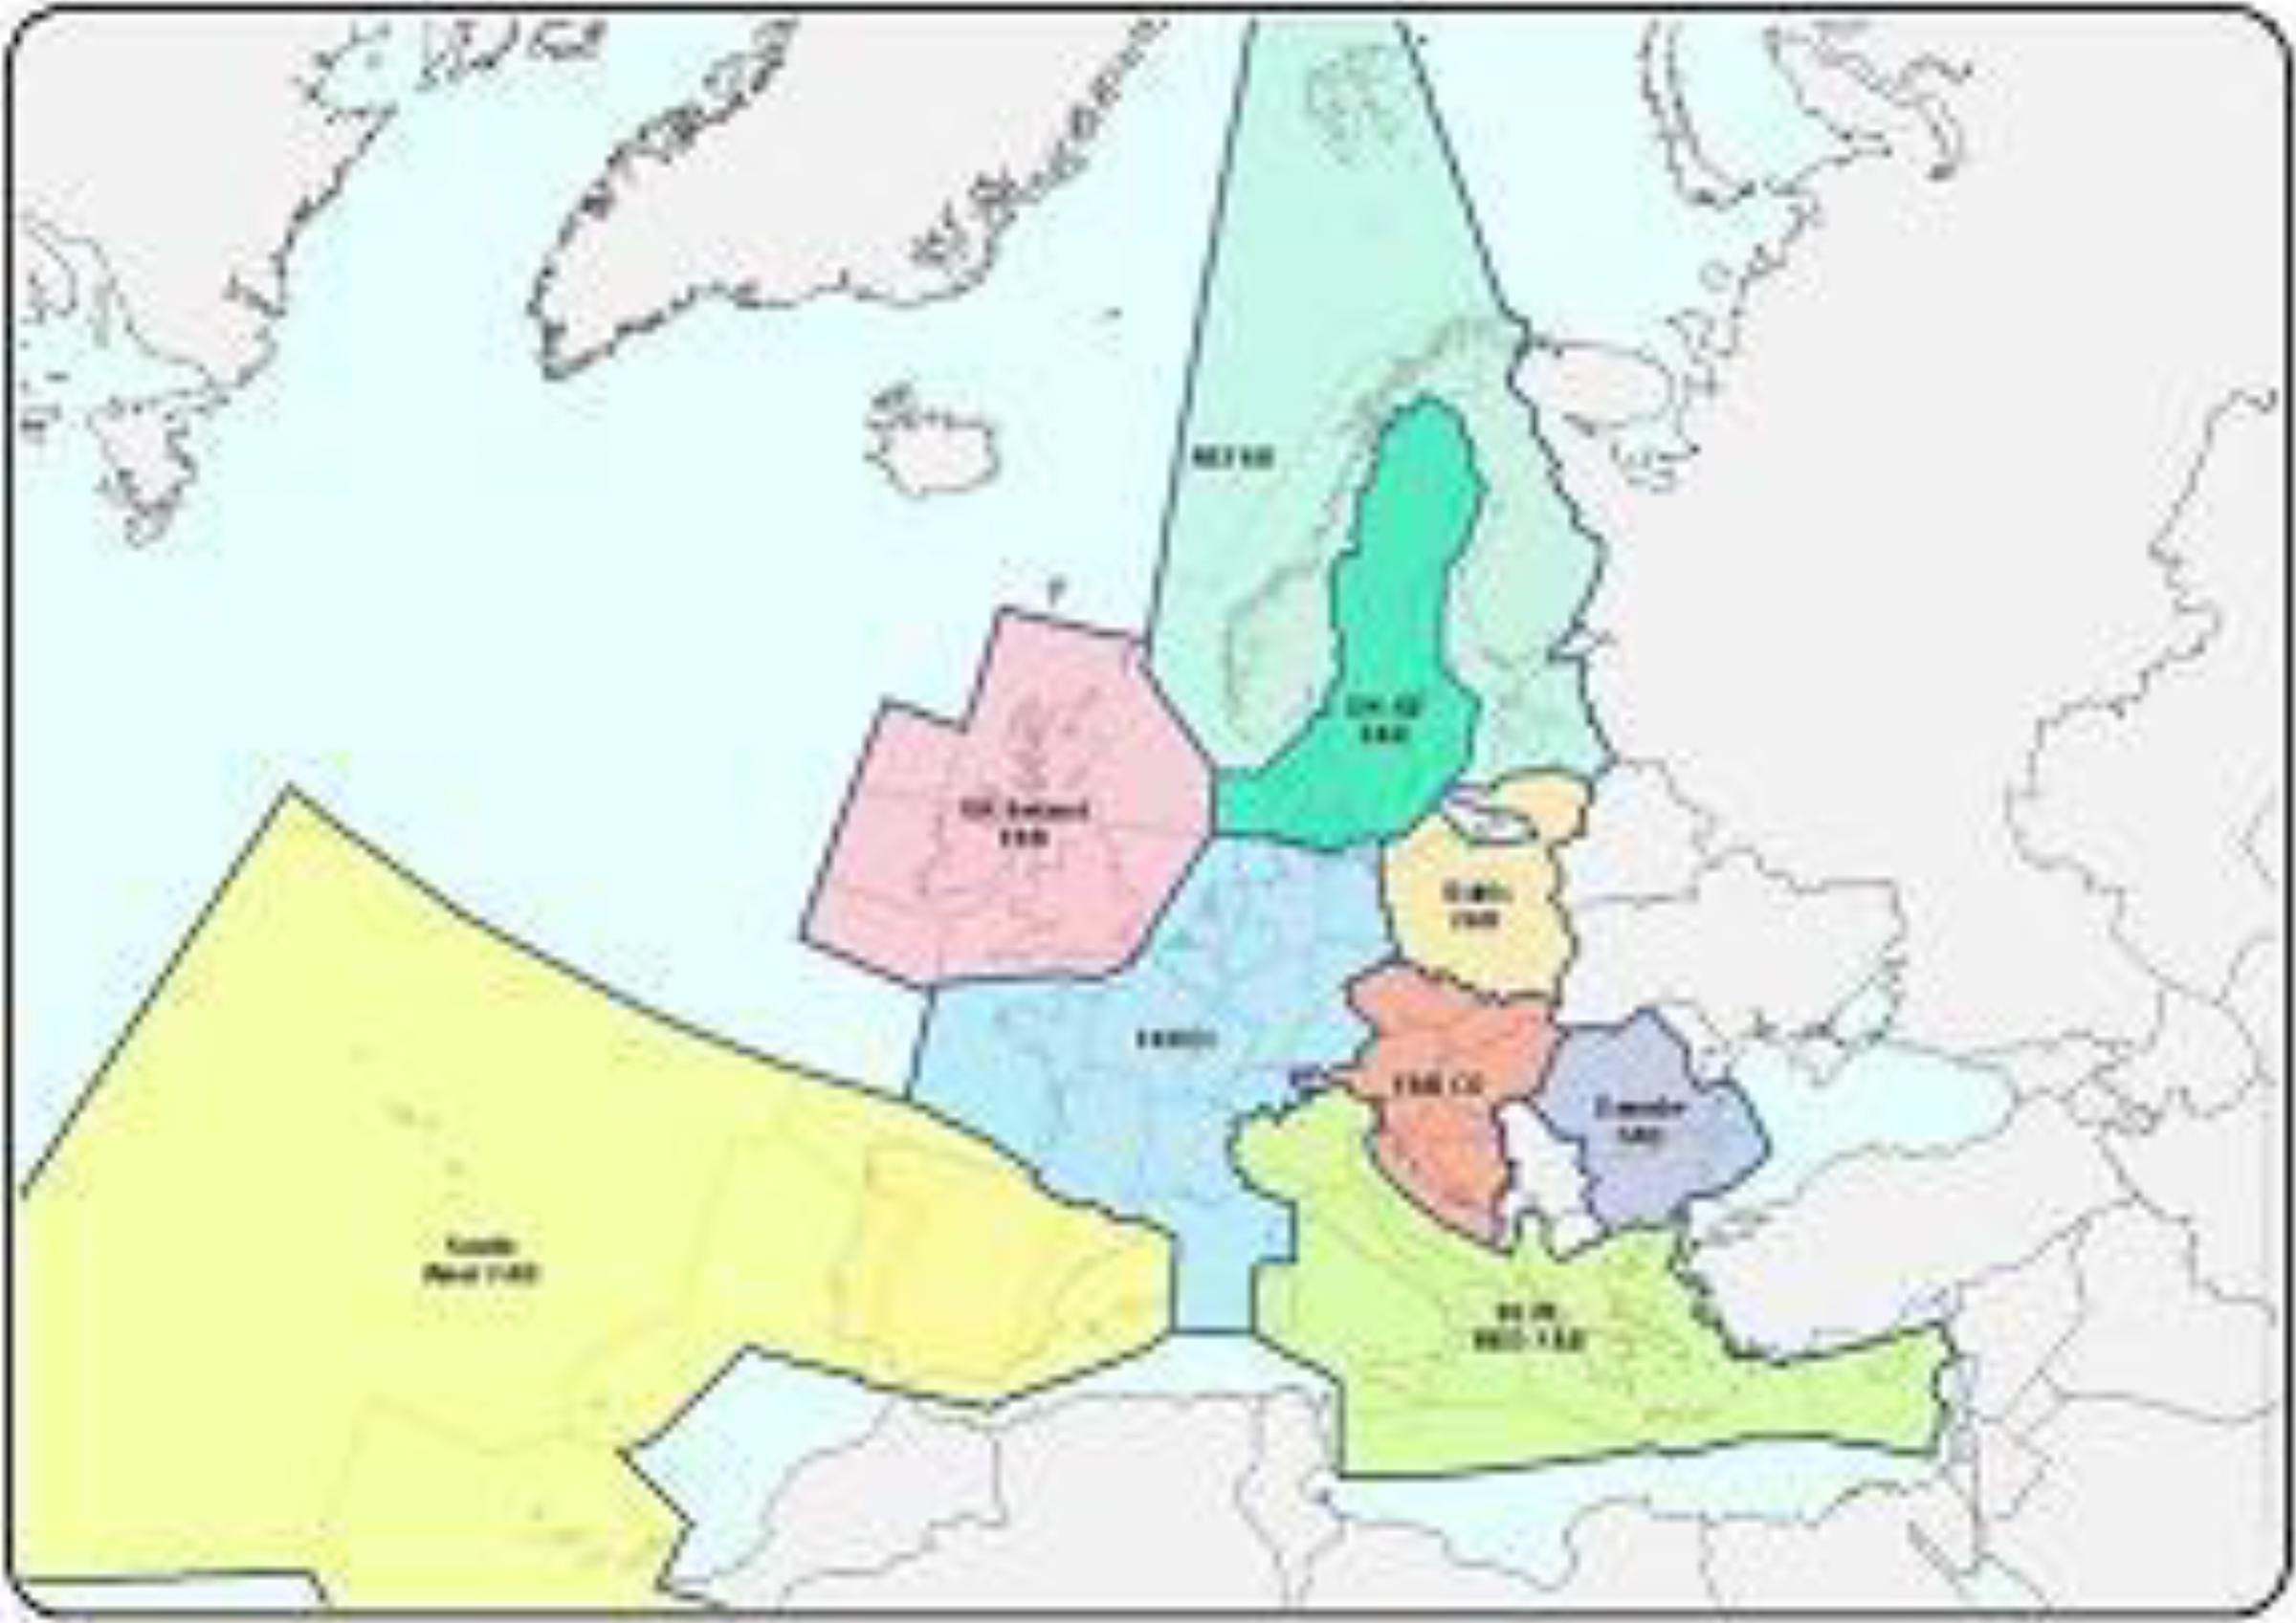
Functional airspace blocks. Source: European Commission.
A number of publications and studies have tried to assess the cost-effectiveness of air navigation service providers (ANSPs) as one of the main indicators for measuring the performance of ATM system. Thus, EUROCONTROL, an intergovernmental organization with 41 member states and 2 comprehensive agreement states, has been producing benchmarking reports of European ANSPs’ cost efficiency for the last 16 years. Three econometric studies have also been conducted using stochastic frontier analysis (SFA). In 2006, NERA Economic Consulting (NERA, 2006) applied SFA techniques to compare the efficiency of European ANSPs between 2001 and 2004. However, due to the lack of data, the study could not draw any major conclusions. Five years later, the Competition Economists Group (CEG) implemented a more ambitious estimation of European ANSPs cost efficiency using a stochastic frontier approach (CEG, 2011). With a Cobb–Douglas specification for the cost function and the inclusion of several explanatory variables, those authors found the presence of economies of scale in the provision of air navigation services. More recently, Dempsey and Volta (2018) used an SFA approach to test whether the institutional structures of ANSPs have an impact on their cost-efficiencies; they concluded that ownership does not directly impact either the ANSPs’ cost structures or their cost efficiencies and that the European ANSPs are operating on the increasing return to scale part of the technology. However, no research has been undertaken to analyze the evolution of cost-effectiveness in the provision of air navigation services at FAB level. The aim of our research is to fill this gap in the literature.
The article is structured in five sections. After this brief introduction, the second section develops the theoretical framework that will allow us to decompose the change in cost-effectiveness of FABs into several components. The third and fourth sections present the data and results of the analysis, respectively. Finally, the last section concludes and suggests future research directions.
The methodology
Decomposing the change in cost-effectiveness
This subsection develops a theoretical framework that allows us to decompose the change in cost-effectiveness of FABs into its basic sources. Let us first assume that, for the ith ANSP, ATM/CNS provision costs can be modeled entirely by using the following cost equation:

where Ci
is a measure of ATM/CNS provision costs,
Finally,
In what follows we will show that an estimated cost function can constitute a useful tool for the measurement of changes in the cost-effectiveness of FABs and the decomposition of these changes into their basic sources. We will define cost-effectiveness here in terms of average costs. Thus, the cost-effectiveness indicator of a FAB comprising N ANSPs (AC) would be obtained dividing total ATM/CNS provision costs by the number of flight hours controlled
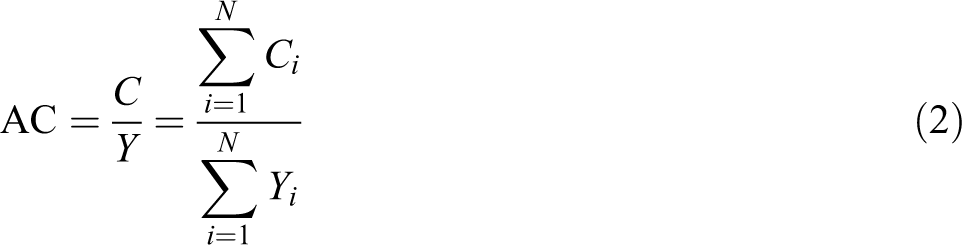
Therefore, the aggregate (or mean) rate of growth of the cost-effectiveness of the FAB can be decomposed as follows 2 :

where

where
Using this decomposition, and subtracting the output increase

Equation (5) can be expressed as follows:

where
Decomposition analysis: Effects and formulae.
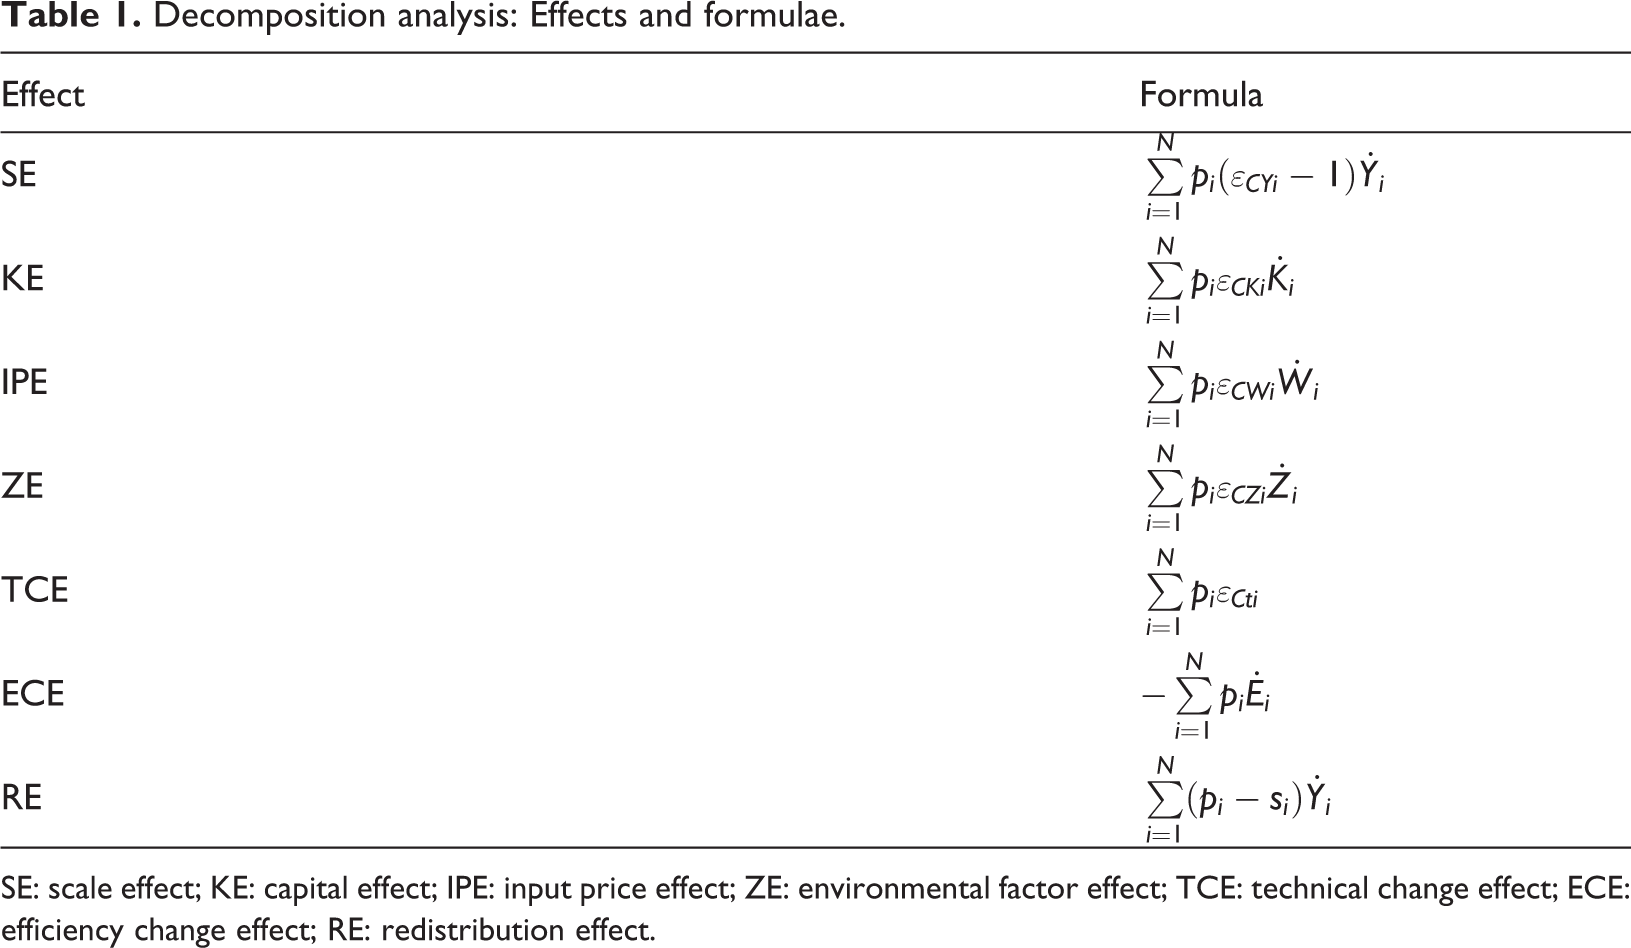
SE: scale effect; KE: capital effect; IPE: input price effect; ZE: environmental factor effect; TCE: technical change effect; ECE: efficiency change effect; RE: redistribution effect.
Estimation method
In this subsection, we introduce the parametric frontier technique used to estimate the cost equation (3). After adding a time subscript, the econometric specification of equation (3) can be written as 3

where β is now a vector of technological parameters of the cost function, γ measures the effect of observable environmental variables,
Equation (7) is estimated via maximum likelihood (ML) once particular distributional assumptions on both random terms are made. As it is common in the SFA literature, we will assume that
This model can accommodate heteroskedastic noise and inefficiency terms simply by making
The data
Most data used in our analysis are extracted from the ATM Cost-Effectiveness (ACE) Benchmarking reports, which are published on an annual basis by EUROCONTROL (2008, 2009, 2010, 2011, 2012, 2013, 2014, 2015, 2016, 2017, 2018). The data set includes information for 37 European ANSPs from 2006 to 2016. There are two output measures for ANS provision: for en route services, the en route flight hours controlled, and for terminal services, the number of IFR airport movements controlled. However, as suggested in the EUROCONTROL’s ACE Benchmarking reports, it is better to consider a “gate-to-gate” perspective in order to avoid heterogeneity between ANSPs in the allocation of costs between these two types of services. Thus, we follow the approach in the aforementioned reports and consider a composite indicator of gate-to-gate flight hours determined by weighting the output measures by their respective average cost of the service for the whole Pan-European system. 4 As capital (K), we use the net book value for fixed assets in operation. The price of air traffic controllers (ATCOs;w 1) and the price of other labor (w 2) correspond to ATCOs in on operational duty (OPS) employment costs divided by ATCOs in OPS hours on duty and the total employment costs for support staff divided by the total number of support staff, respectively. Following the technical note produced by a group of competition economists for EUROCONTROL’s Performance Review Unit (PRU; CEG, 2011), a producer price index for all goods provided by Eurostat (turned into real terms using a general price index as deflator) is used for the price of non-staff operating inputs (w 3). We also follow the same report when calculating the capital-related input price (w 4) as the sum of depreciation costs and the cost of capital divided by the net book value in operation adjusted by the annual produced price index provided by Eurostat. The size of the airspace controlled by each ANSP (z 1) is measured in square kilometers. The structural traffic complexity (z 2) is composed of the sum of three metrics: ascending and descending routes, crossing routes, and variable speeds (a proxy for traffic mix). The traffic variability measure (z 3) is computed as traffic at the peak week divided by the traffic in the average week. Three additional variables that will be used as potential regressors of the inefficiency term are the number of ANSPs integrating the FAB (FAB number), the size of the airspace controlled by the FAB (FAB size), and the inverse of the productivity of ATCOs (atcop) that is obtained dividing the total number of ATCOs in OPS by the number of flight hours controlled. With regard to the ownership structure, we follow ACE Benchmarking Reports, and Dempsey and Volta (2018) consider four ANSPs under public ownership (DCAC, DSNA, MCCA, and DHMI), three ANSPs (MUAC, NATS, and Skyguide) under private ownership, and all the others as commercialized companies. Table 2 provides summary statistics of the data set.
Summary statistics.

FAB: functional airspace block.
Results
In Table 3, we show the parameter estimates. The first-order coefficients of controlled composite flight hours, capital, and input prices are positive and statistically different from zero. In general, all the first-order coefficients have the expected sign and their magnitudes are in line with those of previous studies. Shares in total costs are not substantially different from those obtained by CEG (2011) and Dempsey and Volta (2018): 32% for ATCOs, 22% for non-ATCO staff, 12% for non-staff operating inputs, and 34% for capital. The main difference between these studies is the share of capital in total costs, which is higher in our study. However, the CEG study (CEG, 2011) covers the period 2003–2010, so the difference with our estimate of the cost share of capital may reflect the postponement or cancellation of investment projects that took place during the economic recession that started in 2008. Dempsey and Volta (2018) assumed that capital is a variable input, and we can reject that assumption in our specification as we reject that
SFA results.

SFA: stochastic frontier analysis; ANSP: air navigation service provider; FAB: functional airspace block.
*p < 0.1; **p < 0.05; ***p < 0.01.
In addition to the frontier parameters, Table 3 also presents the coefficients of the variables that are related to the inefficiency term. We use a quadratic time trend, the (inverse of) the productivity of ATCOs, the size of the airspace controlled by the FAB, and the number of ANSPs integrating the FAB to explain the heterogeneity in the inefficiency term. We find a significant improvement in cost-effectiveness at a decreasing rate over time that is common across all ANSPs. We also find that ANSPs’ inefficiencies decrease as the productivity of ATCOs decreases. Another result is that ANSPs’ inefficiency tends to increase as the number of FAB members increases, and this inefficiency tends to decrease as the total size of the airspace controlled by the FAB decreases. We model the structure of the noise term as a function of the log of composite traffic hours and the three environmental variables: namely, the size (in logs) of the airspace controlled, the structural traffic complexity, and the traffic variability. We find that, in the case of the size of the controlled airspace, cost-effectiveness is not only lower when the airspace is larger but also more difficult to predict. In the case of structural traffic complexity, cost-effectiveness is lower when the traffic complexity is higher, but it is also more difficult to predict. In the case of increased traffic variability, we find no significant effect on cost-effectiveness, but do find a significant positive effect on the noise term.
Figure 2 presents the time series evolution of the decomposition of changes in cost-effectiveness at the FAB level into the eight components described in section “Estimation method.” Table 4 presents the estimated average annual percentage change of cost-effectiveness at the FAB level attributed to each effect. Figure 3 contains the dendrogram for a cluster analysis (using single-linkage clustering with the default Euclidean distance) of the nine FABs based on the estimated average annual contributions of the different driving forces included in Table 4. Below we enumerate a few features related to each of these estimated effects: Average ATM/CNS provision costs decrease for five of the nine FABs. The improvement in cost-effectiveness is especially high for Danube, BLUE MED, and SW FAB, with estimated average annual reductions of 3.76%, 2.34%, and 1.87%, respectively. The improvement in cost-effectiveness in UK-Ireland and NEFAB is more modest, with an annual rate of 0.35 for both cases. Average provision costs increase over time for the rest of the FABs, with average annual percentage rates of increase ranging from 0.22 (FAB CE) to 1.32 (DK-SE). The capital effect drives a substantial increase in average ATM/CNS provision costs for the Baltic FAB (at an average annual percent rate of 1.47) and a moderate increase for UK-Ireland and FAB CE (at average annual percent rates of 0.30 and 0.21, respectively). In the rest of the FABs, the capital effect contributes to improve the cost-effectiveness of FABs, with estimated average annual percentage reductions ranging from 1.96 (Danube) to 0.31 (BLUE MED). These effects respond to the fact that some FABs have important investments in capital, whereas in others the capital stock decreases. Input price effects have exerted a strong pressure to raise average ATM/CNS provision costs in all FABs. The price of ATCO hours has risen for most FABs, with the only exceptions being BLUE MED and SW FAB, where they decreased by 0.02% and 1.56%, respectively. For the other FABs, the increase in the price of ATCO hours ranged from 6.22% (Danube) to 0.87% (NEFAB). With regard to the price of non-ATCO staff, there have been increases in every FAB, with average annual rates of increase ranging from 6.54% (NEFAB) to 1.03% (SW FAB). The price of capital shows relatively high average annual rates of increase for all FABs, ranging from 9.38% (NEFAB) to 0.49% (UK-Ireland). The price of non-staff operating costs decreased at an average annual rate of approximately 1.5% for UK-Ireland and 0.5% for FABEC and DK-SE and increased at an average annual rate of approximately 0.5% for FAB CE and BLUE MED and 1% for SW FAB, Danube, NEFAB, and Baltic. Changes in environmental factors moderately reduce average ATM/CNS provision costs in all FABs except DK-SE, where changes in environmental factors jointly drive average provision costs to grow at an average of 0.04% annually. This is despite the fact that in many FABs, especially in Danube and FAB CE, there are important increases in traffic complexity. Note that traffic complexity does not have a significant effect on ANSPs’ costs, but does have a significant positive effect on ANSPs’ cost uncertainty. However, this effect is not captured by our cost decomposition. Technical change reduces average ATM/CNS provision costs in all FABs, at an average rate of 0.85% annually, although the time series decompositions show that this contribution seems to be stronger since 2011. While average costs decreased by 0% from 2006 to 2011, they have decreased by an average of about 1.5% since 2011. Efficiency changes are important drivers of reductions in average ATM/CNS provision costs in all FABs except FABEC and FAB CE, where efficiency changes drive estimated average provision costs to increase at an average annual rate of 0.43% and 0.42%, respectively. VREs significantly reduce average ATM/CNS provision costs for Danube, Baltic, FAB CE, and NEFAB, which have annual average rates of 1.83%, 1.55%, 0.84%, and 0.75%, respectively. For the other FABs, VREs contribute moderately to reduce average ATM/CNS provision costs. In the other FABs, the efficiency level increases by an average of 1.29%. Thus, the cost-effectiveness of most FABs improved by about 2% annually due to improvements in ANSPs’ technology and efficiency. The dendrogram represented in Figure 3 suggests the existence of four groups of FABs based on the nature of the driving forces behind their cost-effectiveness performance: (i) NEFAB, FABEC, FAB CE, and DK-SE; (ii) SW FAB, UK-Ireland, and BLUE MED; (iii) Baltic; and (iv) Danube. The first group shows a poor performance in cost-effectiveness over time, with technical, efficiency, and capital changes unable to compensate for the increase in average provision costs induced by increases in input prices. The second group shows a better performance in cost-effectiveness over time, with technical change, efficiency changes, and capital changes outweighing the effect of increases in input prices. In the Baltic and the Danube FABs, all of the driving forces apart from capital and input prices contribute to reducing average provision costs. However, in the former, the important capital stock investments produced in the period from 2006 to 2016 drive average provision costs upward, while in the latter, the reduction in the capital stock leads to important annual reduction rates in average provision costs.
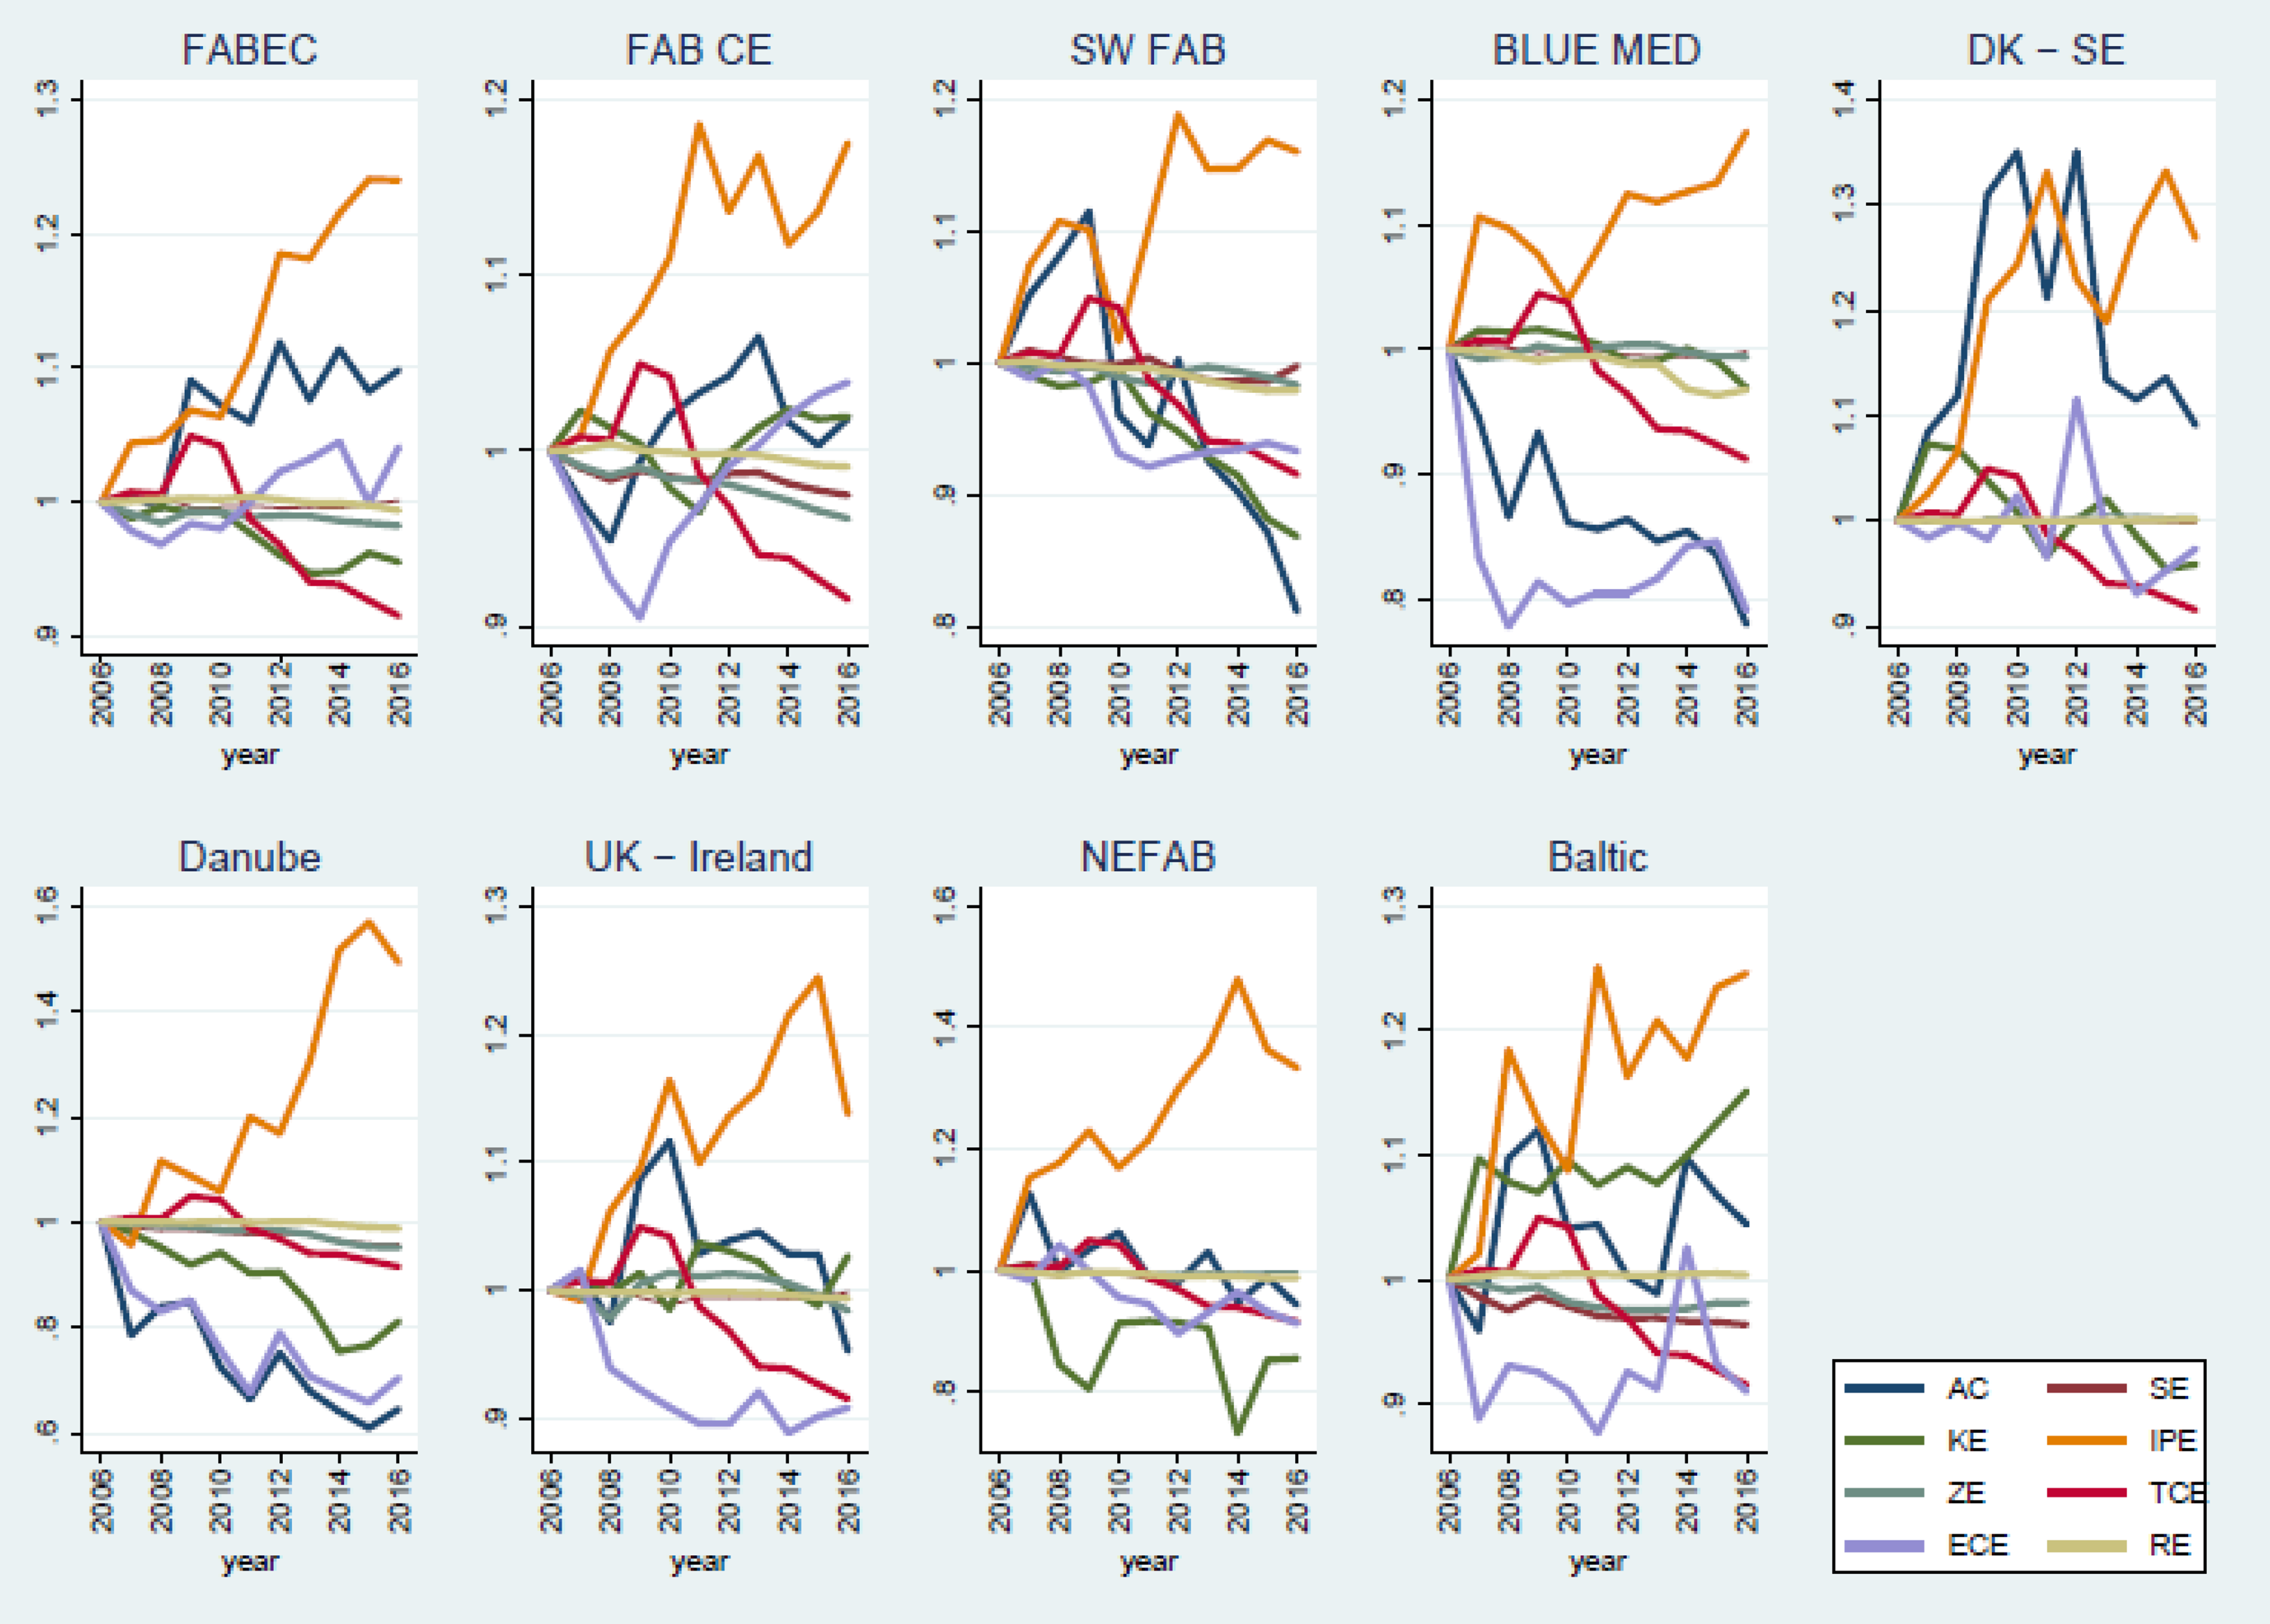
Time series decomposition of changes in cost-effectiveness at FAB level (2006−2016). FAB: functional airspace block.
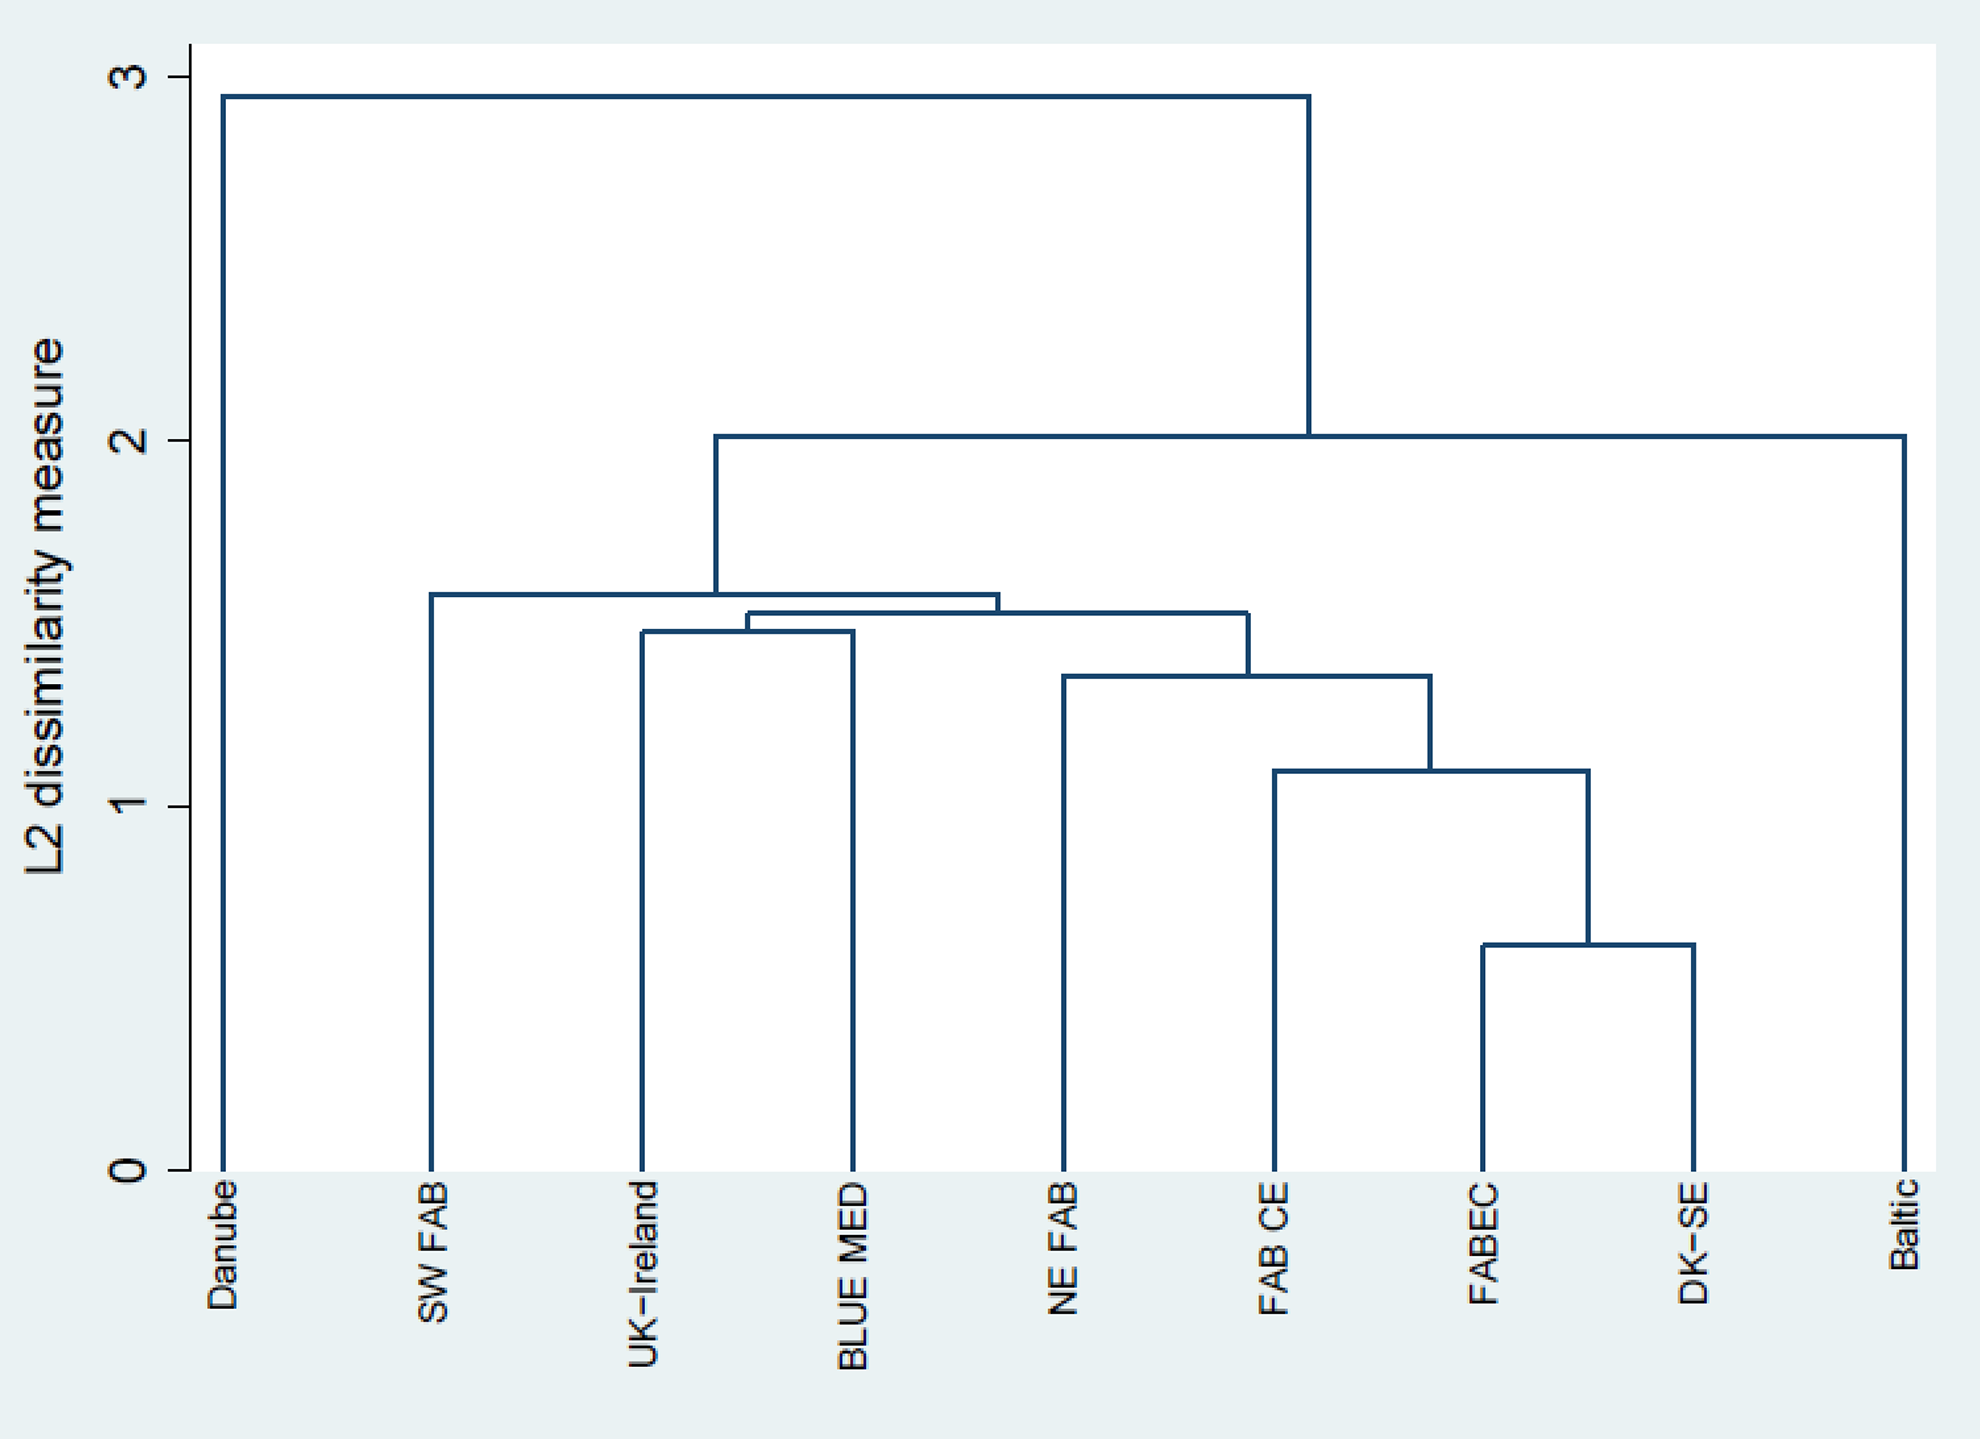
Dendrogram for FAB cluster analysis. FAB: functional airspace block.
Estimated average annual percent change of cost-effectiveness at FAB level attributed to each effect (2006−2016).
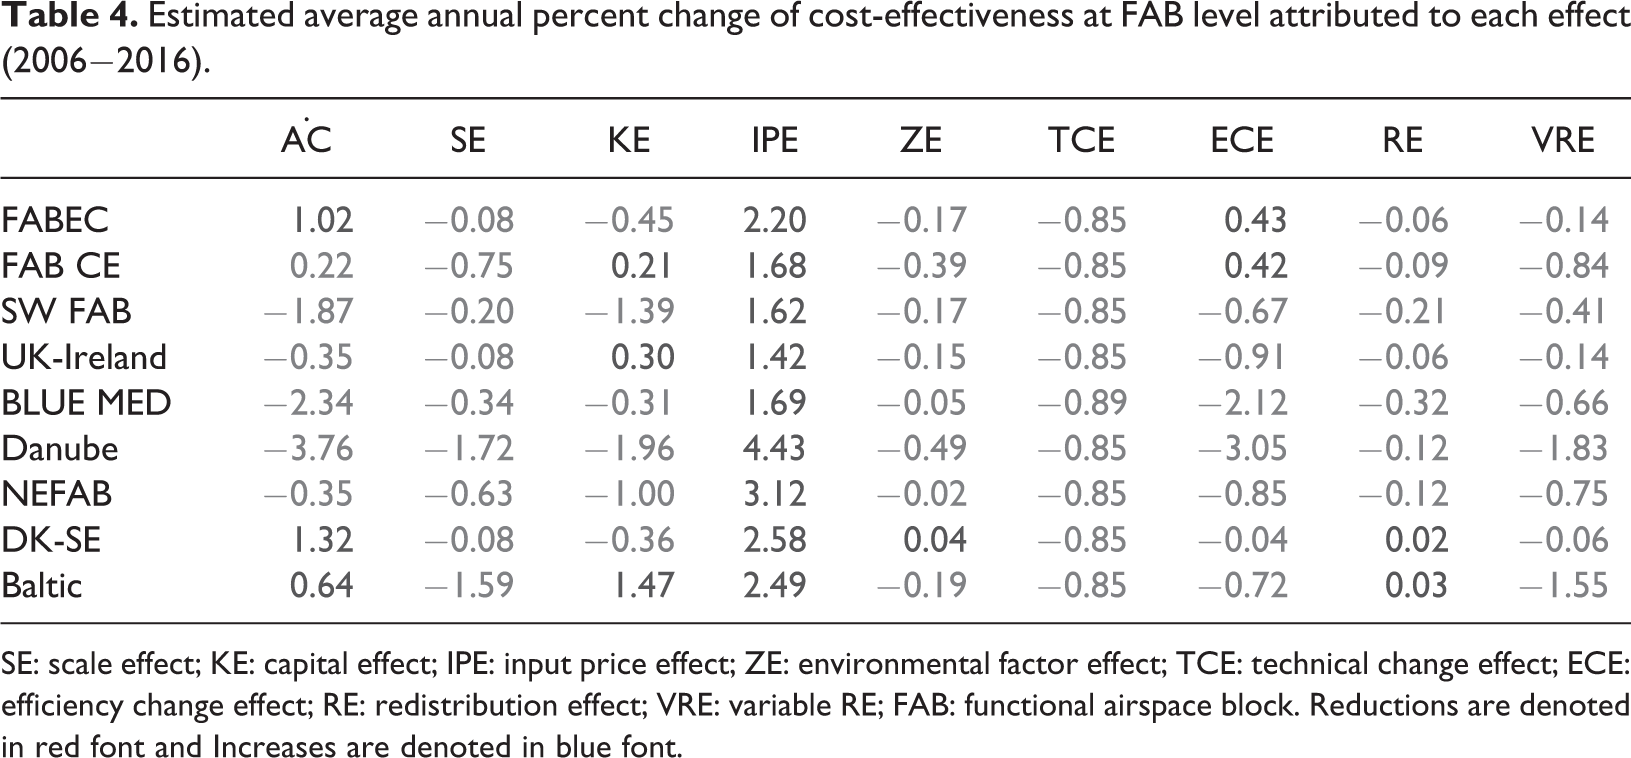
SE: scale effect; KE: capital effect; IPE: input price effect; ZE: environmental factor effect; TCE: technical change effect; ECE: efficiency change effect; RE: redistribution effect; VRE: variable RE; FAB: functional airspace block. Reductions are denoted in red font and Increases are denoted in blue font.
Conclusions
One of the main objectives of the SES initiative is to reduce cost inefficiencies that result from the fragmentation of European airspace. Thus, FABs are key factors in pursuing such an objective, as long as they are able to optimize and/or integrate the provision of air navigation services. In 1997, the Member States of EUROCONTROL jointly decided to establish an independent performance review system that would address all aspects of ATM. They also decided to study and promote measures for improving cost-effectiveness and efficiency in the field of air navigation. Since 2003, EUROCONTROL’s PRU produces annual reports that provide a detailed benchmarking of cost-effectiveness performance at the ANSP level, including a trend analysis of three main drivers (productivity, employment costs, and support costs). These reports examine both individual ANSPs and the Pan-European ATM/CNS system as a whole. We have used the same database as that used for those benchmarking reports, but instead of focusing on individual ANSPs and just three drivers, we have proposed a way to analyze cost-effectiveness that allows us to deal with air navigation service provision at an FAB level with a richer decomposition of the changes into not just three but eight driving forces.
Based on this decomposition analysis, we have found that the nine FABs can be clustered into four groups. The first group, comprising NEFAB, FABEC, FAB CE, and DK-SE, is characterized by its inability to compensate the input price effect, which drives average costs upward, with improvements in efficiency. The second group, comprising SW FAB, UK-Ireland, and BLUE MED, is able to bring average costs down, thanks to the combination of efficiency and capital effects. The other two FABs, Baltic and Danube, are far from the other FABs and among themselves. Thus, having been able to reduce average costs through efficiency improvements and traffic REs, the Baltic FAB shows an overall increase in average provision costs due to the combined effect of capital and input prices that outweigh the other effects. In the Danube FAB, despite having the strongest input price effect in all FABs, the rest of the effects reinforces each other in reducing average costs; consequently, it shows the best performance of all the FABs, reducing average provision costs at an average annual percent rate of 3.76.
Another interesting result of our analysis is that the contribution of the technical effect to drive down average provision costs seems to be stronger since 2011. This may be interpreted as the effect of the deadline of the SES legislation for the FABs to be fully operational before December 2012. However, it could also be a sign of the end of the full cost recovery regime that was applied to most ANSPs until December 2011.
A third result that is worth taking into account is the traffic RE, which contributes significantly to reducing average provision costs in Danube, Baltic, FAB CE, and NEFAB, and is less significant for the rest of the FABs. It should be noted that if the FABs were to be effective tools in reducing inefficiencies, they should involve traffic redistribution actions between ANSPs facilitated by the implementation of cross-border sectorization and service provision. Therefore, estimated traffic RE for some FABs may be signaling the implementation of such measures.
Future directions include expanding the definition of cost-effectiveness from financial cost-effectiveness to economic cost-effectiveness, which means taking into account not only the direct costs linked with ATM/CNS provision but also the indirect costs (delays, additional flight time, and fuel burn) borne by airspace users. This extension of the analysis could shed light on the concern that some financial cost efficiency savings are accompanied by delay (and other indirect) costs.
Supplemental material
Supplemental Material, Annex - Analysis of cost-effectiveness in the provision of air navigation services at functional air blocks
Supplemental Material, Annex for Analysis of cost-effectiveness in the provision of air navigation services at functional air blocks by Alberto Ansuategi, Ibon Galarraga, Luis Orea and Thomas Standfuss in Competition and Regulation in Network Industries
Footnotes
Declaration of Conflicting Interests
The author(s) declared no potential conflicts of interest with respect to the research, authorship, and/or publication of this article.
Funding
The author(s) received no financial support for the research, authorship, and/or publication of this article.

Supplemental material
Supplemental material for this article is available online.
Notes
References
Supplementary Material
Please find the following supplemental material available below.
For Open Access articles published under a Creative Commons License, all supplemental material carries the same license as the article it is associated with.
For non-Open Access articles published, all supplemental material carries a non-exclusive license, and permission requests for re-use of supplemental material or any part of supplemental material shall be sent directly to the copyright owner as specified in the copyright notice associated with the article.
