
Abstract
Background:
Emergency departments (EDs) play an important role in health systems since they are the front line for patients with emergency medical conditions who frequently require diagnostic tests and timely treatment.
Objective:
To improve decision-making and accelerate processes in EDs, this study proposes predictive models for classifying patients according to whether or not they are likely to require a diagnostic test based on referral diagnosis, age, gender, triage category and type of arrival.
Method:
Retrospective data were categorised into four output patient groups: not requiring any diagnostic test (group A); requiring a radiology test (group B); requiring a laboratory test (group C); requiring both tests (group D). Multivariable logistic regression models were used, with the outcome classifications represented as a series of binary variables: test (1) or no test (0); in the case of group A, no test (1) or test (0).
Results:
For all models, age, triage category, type of arrival and referral diagnosis were significant predictors whereas gender was not. The main referral diagnosis with high model coefficients varied by designed output groups (groups A, B, C and D). The overall accuracies of the logistic regression models for groups A, B, C and D were, respectively, 74.11%, 73.07%, 82.47% and 85.79%. Specificity metrics were higher than the sensitivities for groups B, C and D, meaning that these models were better able to predict negative outcomes.
Implications:
These results provide guidance for ED triage staff, researchers and practitioners in making rapid decisions regarding patients’ diagnostic test requirements based on specified variables in the predictive models. This is critical in ED operations planning as it potentially decreases waiting times, while increasing patient satisfaction and operational performance.
Keywords
Introduction
An emergency department (ED) is a medical treatment unit responsible for providing medical and surgical care for patients presenting without prior appointment, either by their own means or via ambulance (Etu, 2018). Due to the unplanned nature of patient arrivals, EDs face overcrowding. This has become one of the biggest barriers preventing ED managers and practitioners from providing high-quality and timely medical care (Kobayashi et al., 2019; Linder and Woitok, 2020; Sarıyer et al., 2018). Because EDs provide a 24/7 service as the front line for patients presenting with a wide range of complaints, ED personnel (physicians, technicians, nursing, administration and security personnel) must be well prepared. In particular, to diagnose sometimes very complex ED cases, detailed investigations and diagnostic tests are required. However, ordering any type of diagnostic test increases the length of patient stay in ED, potentially causing bottlenecks in the already overcrowded environment. Therefore, it is crucial from a process planning perspective to identify which patients may require any type of diagnostic test at the point of triage. Time lost at this bottleneck can be minimised if patients can be classified on arrival as requiring diagnostic tests or not by staff responsible for triage, and if diagnostic test-related preparations can be completed before examination by an ED physician. This also accelerates and improves the accuracy of the ED physicians’ decision-making.
To efficiently classify arriving ED patients, it may be advantageous to generate information based on past raw data stored in hospital databases as electronic medical records. Here, the science of data mining is key. Data mining is a “process to locate non-obvious, unknown, and potential possible usable information from data” (Frawley et al., 1992) while Reinschmidt et al. (1999) described its goal as being “to extract effective, useful and unknown comprehensible information to serve as a foundation of decision-making for enterprises.” Thus, appropriate use of information generated by data mining can provide organisations with a sound basis for decision-making (Lin et al., 2010), with health systems being no exception.
The use of data mining techniques in health systems has received significant attention recently. Rather than the commonly used techniques of clustering (Lin et al., 2011; Resta et al., 2018) and association rule mining (Huang, 2013; Lee et al., 2013; Nahar et al., 2013), most research utilises classification techniques. There have been various approaches. By comparing the accuracies of different classification techniques, Hu et al. (2017) classified patients based on their return probabilities. Classification techniques have also been used to predict patient arrivals or admissions (Golmohammadi, 2016; Taşar and Sarıyer, 2018; Xu et al., 2013) and to model the occurrence conditions of different types of diseases in patients (Arslan et al., 2016; Safdari et al., 2018; Yeh et al., 2011). However, the majority of studies have classified patients based on length of stay (Chuang et al., 2018; Gül and Güneri, 2015; Hachesu et al., 2013; Pendharkar and Khurana, 2014; Rowan et al., 2007). This research suggests that data mining can be particularly applied in the medical field to improve decision-making, such as prognosis, diagnosis and treatment planning (Bellazzi and Zupan, 2008). Although the use of diagnostic tests is very important in treatment planning, to the best of our knowledge it has rarely been used as an output variable for data mining models. Instead, it has more frequently been treated as an input variable or predictor (Arslan et al., 2016; Golmohammadi, 2016; Gül and Güneri, 2015; Hachesu et al., 2013; Roy et al., 2019).
The aim of this research was to determine the likelihood that a patient presenting to an ED will need to have tests ordered, and whether triage staff could arrange for these tests to be carried out before the patient is seen by a physician. Results of such tests would then be available earlier to assist physicians to make decisions and potentially reduce waiting times in the ED. In this study, patients were classified by characteristics (gender, age, triage category, type of arrival, referral diagnosis) to determine whether they required a diagnostic test. Additionally, using two diagnostic test groups, radiology and laboratory, classification models were developed for four output groups: patients requiring no diagnostic test, any type of radiology test, any type of laboratory test and at least one type of radiology and laboratory tests. By addressing this gap in the literature, this study can contribute to ED-related research by defining diagnostic test requirements as an output, and generating models to serve as guides for ED triage staff, practitioners and researchers in making decisions on diagnostic test requests.
Method
Study design
This was a retrospective study to model the diagnostic test requirements of patients based on various inputs at a single ED. The local institutional review board approved the study.
Study setting and participants
The data were obtained from a large-scale urban training hospital in İzmir, Turkey. Since this hospital is located in a metropolitan district and is easily accessible due to its proximity to a metro station, its ED is extremely busy, with an average daily census of 900 patients. All patients registered to this ED during the study period of March–May 2017 were included in the study. Data for these patients were extracted from the hospital’s electronic data warehouse.
Data sources
The raw data were obtained from three databases. Patients arriving at this ED are registered by a triage staff, and the required demographic data are entered into the ED database as “Data of Arriving Patient.” The “laboratory database” includes data on patients receiving any type of laboratory investigation while the “radiology database” stores data on patients receiving any type of radiology investigation.
Variables
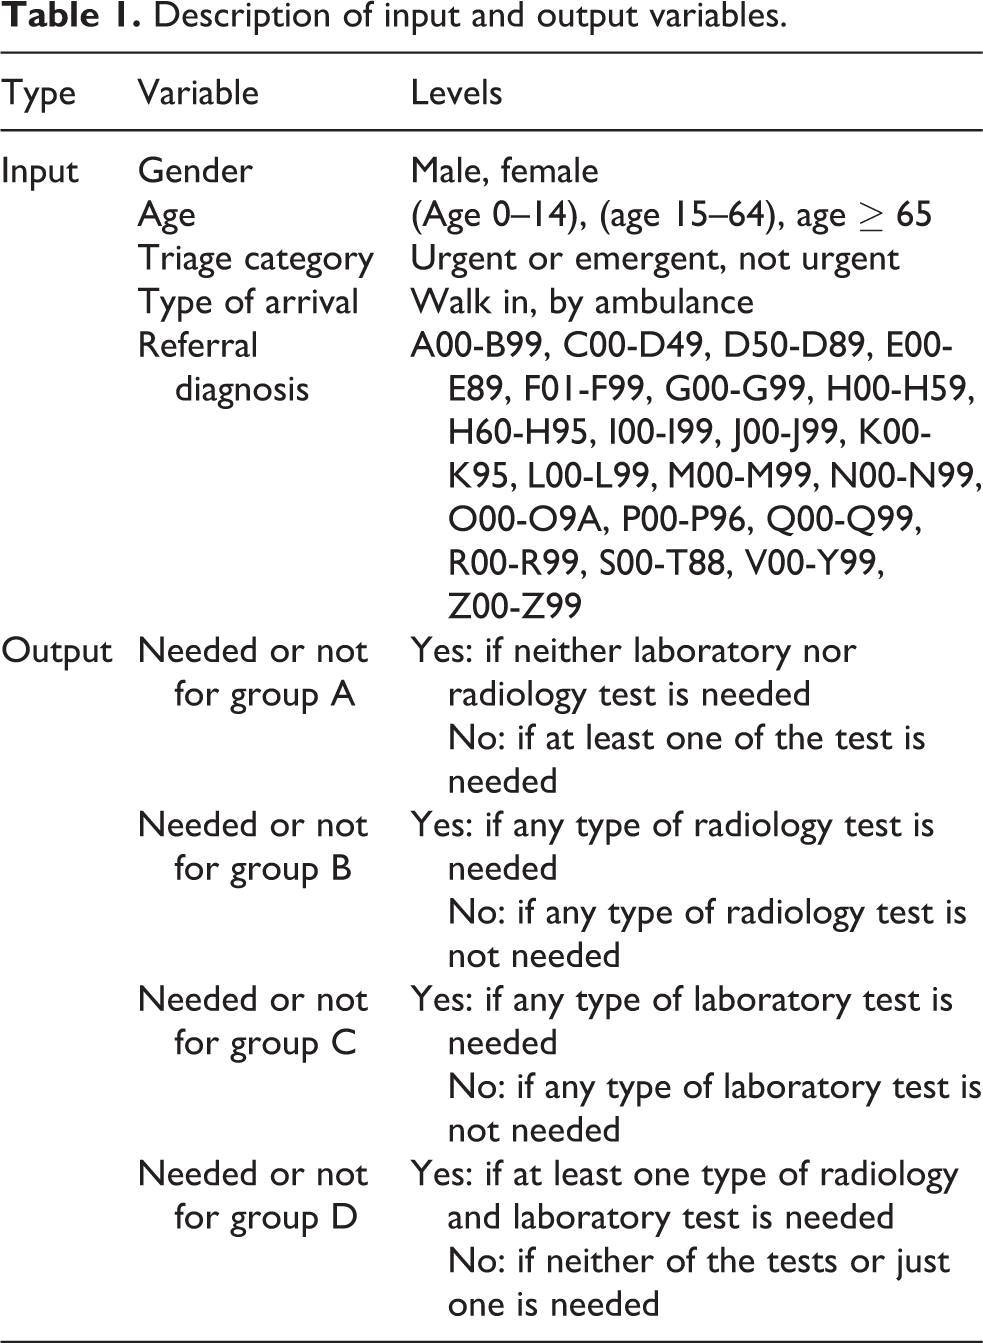
The input variables for this study were defined using the first database. This includes data on protocol ID (unique to patient), gender, age, triage category, type of arrival, referral diagnosis (assigned based on patient’s complaints and vital signs in accordance with International Classification of Diseases, 10th Version [ICD-10] codes) (World Health Organization, 2018), date of arrival, timestamps of arrival and departure, and final diagnosis. All these were used as input variables except for the timestamps since a time-based analysis was not within the scope of this study. Because the study aimed to improve decision-making and accelerate ED operations before patients are assigned a final diagnosis, the data on final diagnosis were also not considered. The output variables, obtained from the laboratory and radiology databases, were defined as nominal variables representing whether the test was needed. These two databases store the patient’s protocol ID, type of the examination and important timestamps. Many different types of tests were listed for both databases. Most of the laboratory tests were in the haemogram, biochemistry, enzyme, hormone or blood type categories while radiology tests included X-ray, tomography, ultrasound and magnetic resonance imaging. Based on how many tests from each group (laboratory and/or radiology) that the patients needed, they were assigned to one of the four groups according to the following four questions: Group A: Did the patient require neither laboratory nor radiology test? Group B: Did the patient require any type of radiology test? Group C: Did the patient require any type of laboratory test? Group D: Did the patient require at least one type of radiology and one type of laboratory test?
Data preprocessing
Any patient data with missing entries in input or output variables were excluded from the analysis. The percentage of missing entries was below 1%. All databases may repeat a protocol ID because a patient can have more than one referral diagnosis and may need different types of test (e.g. a patient requiring a haemogram test may also have a biochemistry test). Given the research design (i.e. the four output groups), these repeated entries for radiology and laboratory tests were not significant because, if a patient’s protocol ID was entered in either the radiology or laboratory database, the patient was classified as receiving a diagnostic test. Thus, these entries were removed from the radiology and laboratory databases. However, each entry was significant for the arriving patients’ database because differences in referral diagnoses could affect whether test is needed or not. Thus, these entries were used repetitively in the classification analysis with a different referral diagnosis entered while all other inputs remained the same.
In the first database, gender had two categories, and it was kept in this form in the analysis; however, the other input variables were transformed. In the raw data, age was continuous, but was converted into an ordinal scale based on the World Health Organization description. Triage level had seven different categories, which were combined into two levels based on the Emergency Severity Index description. Similarly, over 10 different categories of type of arrival were combined into two levels. Since referral diagnoses were entered based on ICD-10 groups, their form was “LXX.XX,” where L denotes different letters of the English alphabet and X denotes numbers from 0 to 9. According to ICD-10, these diagnoses can be combined into 21 levels. The output variable had two levels. The input and output variables and their levels are summarised in Table 1.
Description of input and output variables.
Statistical analysis
For each output group, multivariable binary logistic regression models were built to classify patients under any of two mutually exclusive and exhaustive outcomes (yes/no). This method models the posterior probability of a sample being classified in the positive class as a logistic function of the linear combination of input variables. This enables logistic regression to show which of the various factors being assessed has the strongest relationship with an output variable, and provides a measure of the magnitude of this potential influence. One superiority of logistic regression is adjustment for confounding variables (input variables that are related with both the output variable and other input variables). This prevents the measure of the influence of the input variable of interest being distorted by the effect of the confounder. Given n predictors, the logistic model predicts the natural logarithm of odds, defined as logit. Assuming the input or independent variables are shown respectively as
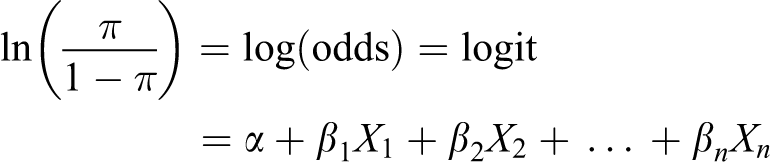
Hence:
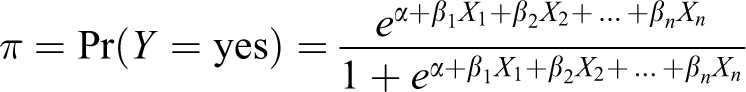
where
In the medical literature, logistic regression is frequently used to estimate the probability that a patient will have a specific outcome (presence/absence of disease, presence/absence of drugs or presence/absence of treatment) depending on characteristics thought to be associated with this outcome. In this study, this outcome was defined as receiving any type of laboratory and/or radiology examination.
Outcome measures
In the dataset, actual values of the output variable (either yes or no) were available. Logistic regression models were built to make predictions for all instances. To evaluate the performance of the models, matches between the actual and predicted values of the output variable were used. Four situations occurred based on the following matches/mismatches: True positive (TP): Actual and prediction values of the output variable are both “yes.” False positive (FP): While the actual value of the output variable is “no,” the model incorrectly predicts “yes.” True negative (TN): Actual and prediction values of the output variable are both “no.” False negative (FN): While the actual value of the output variable is “yes,” the model incorrectly predicts “no.”
Three performance evaluation metrics of sensitivity, specificity and accuracy were defined based on these four statistics as follows:


These three metrics were then used to evaluate the performance of the logistic regression models for the four patient groups. All of the steps defined in the Method section are summarised in Figure 1.
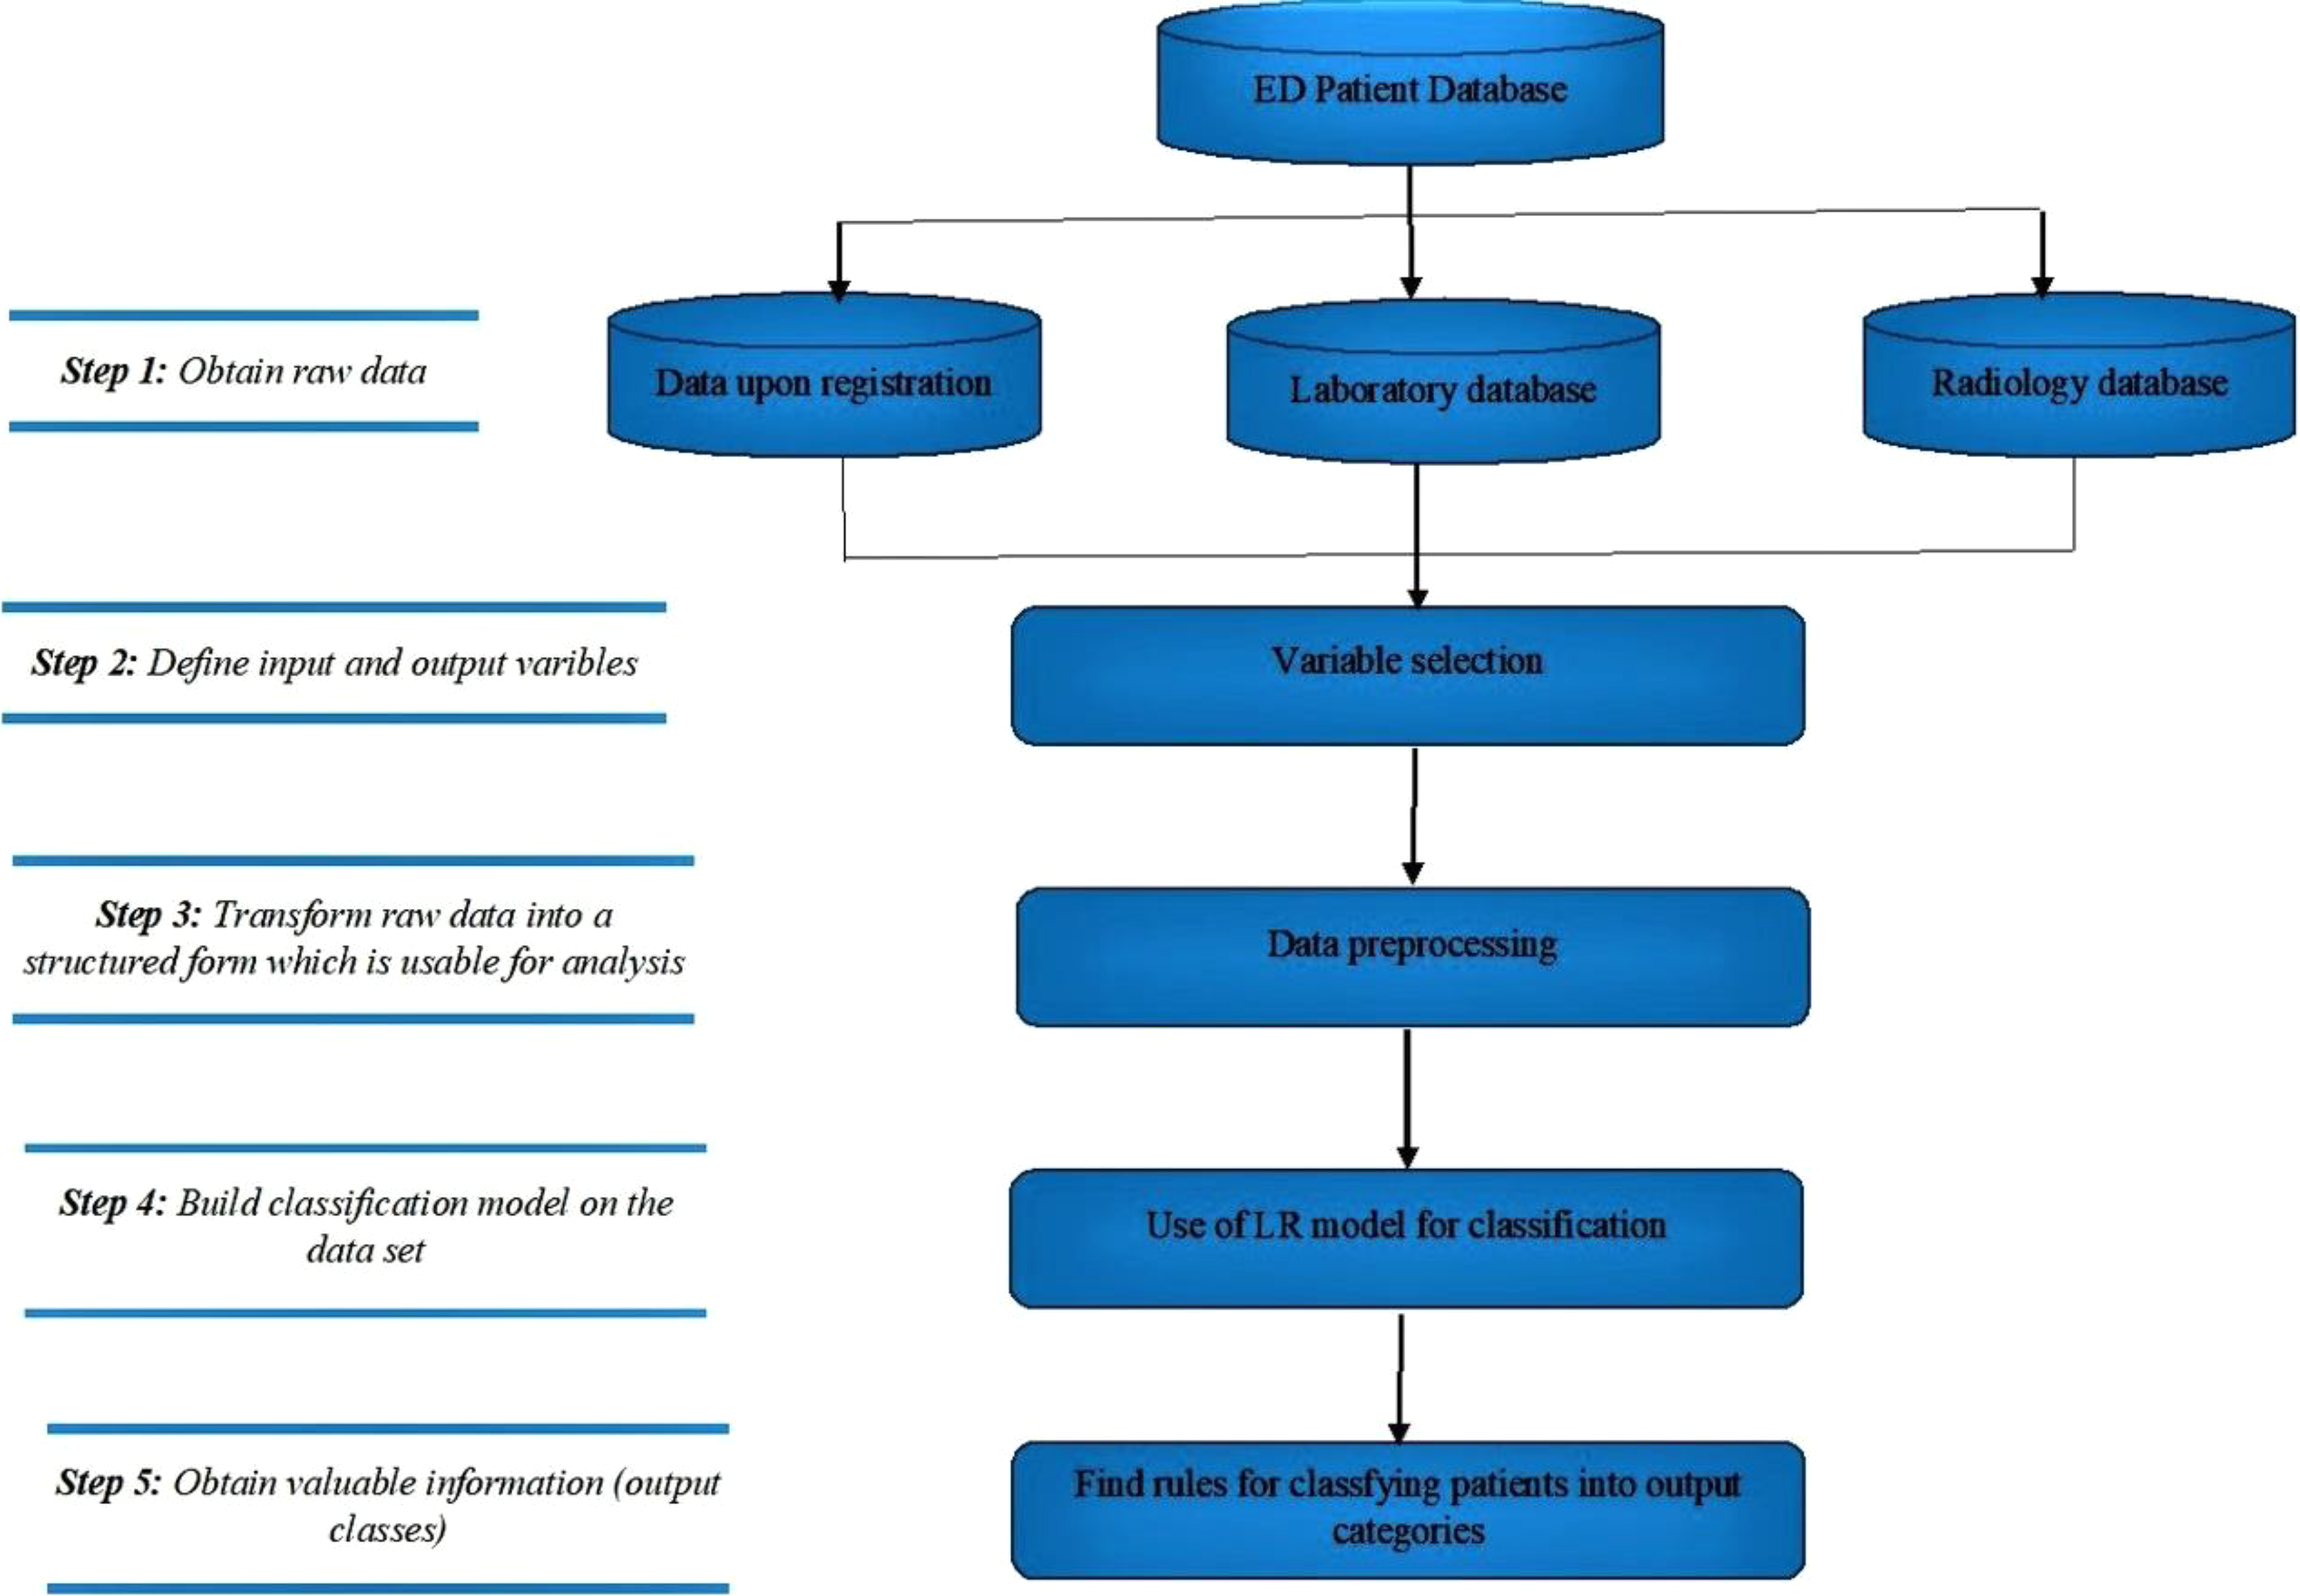
Data mining flow of the research. ED: emergency department; LR: logistic regression.
Results
Descriptive results
During the study period, 89,236 patients arrived at this ED, of whom 75,930 (85.09%) had a unique referral diagnosis. The remaining 13,306 patients (14.91%) had at least two different diagnostic codes, for example, J00-J99 and R00-R99 together. Since differences between these codes may affect the decision to order specific test types, each was given a separate entry for the classification models. Thus, for the classification analysis, the dataset included 107,746 instances. The frequency and percentage distributions of the input and output variables of the arriving patients are given in Table 2.
Patients’ frequency and percentage distributions based on input and output variables.
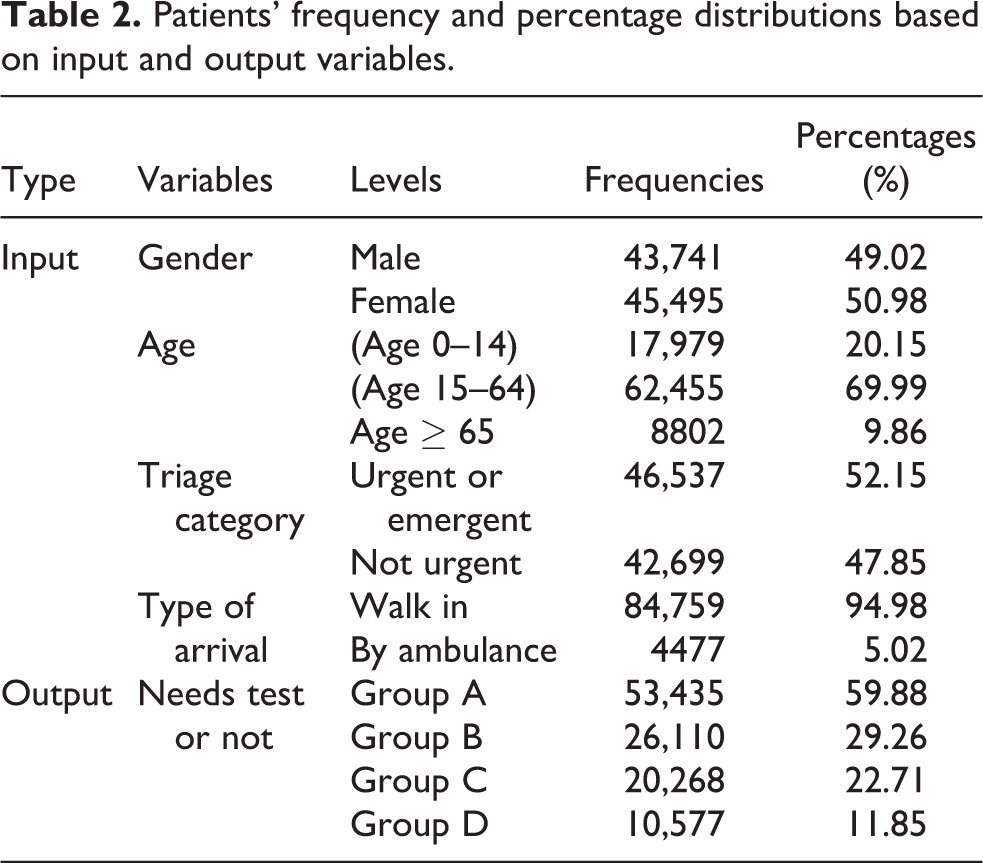
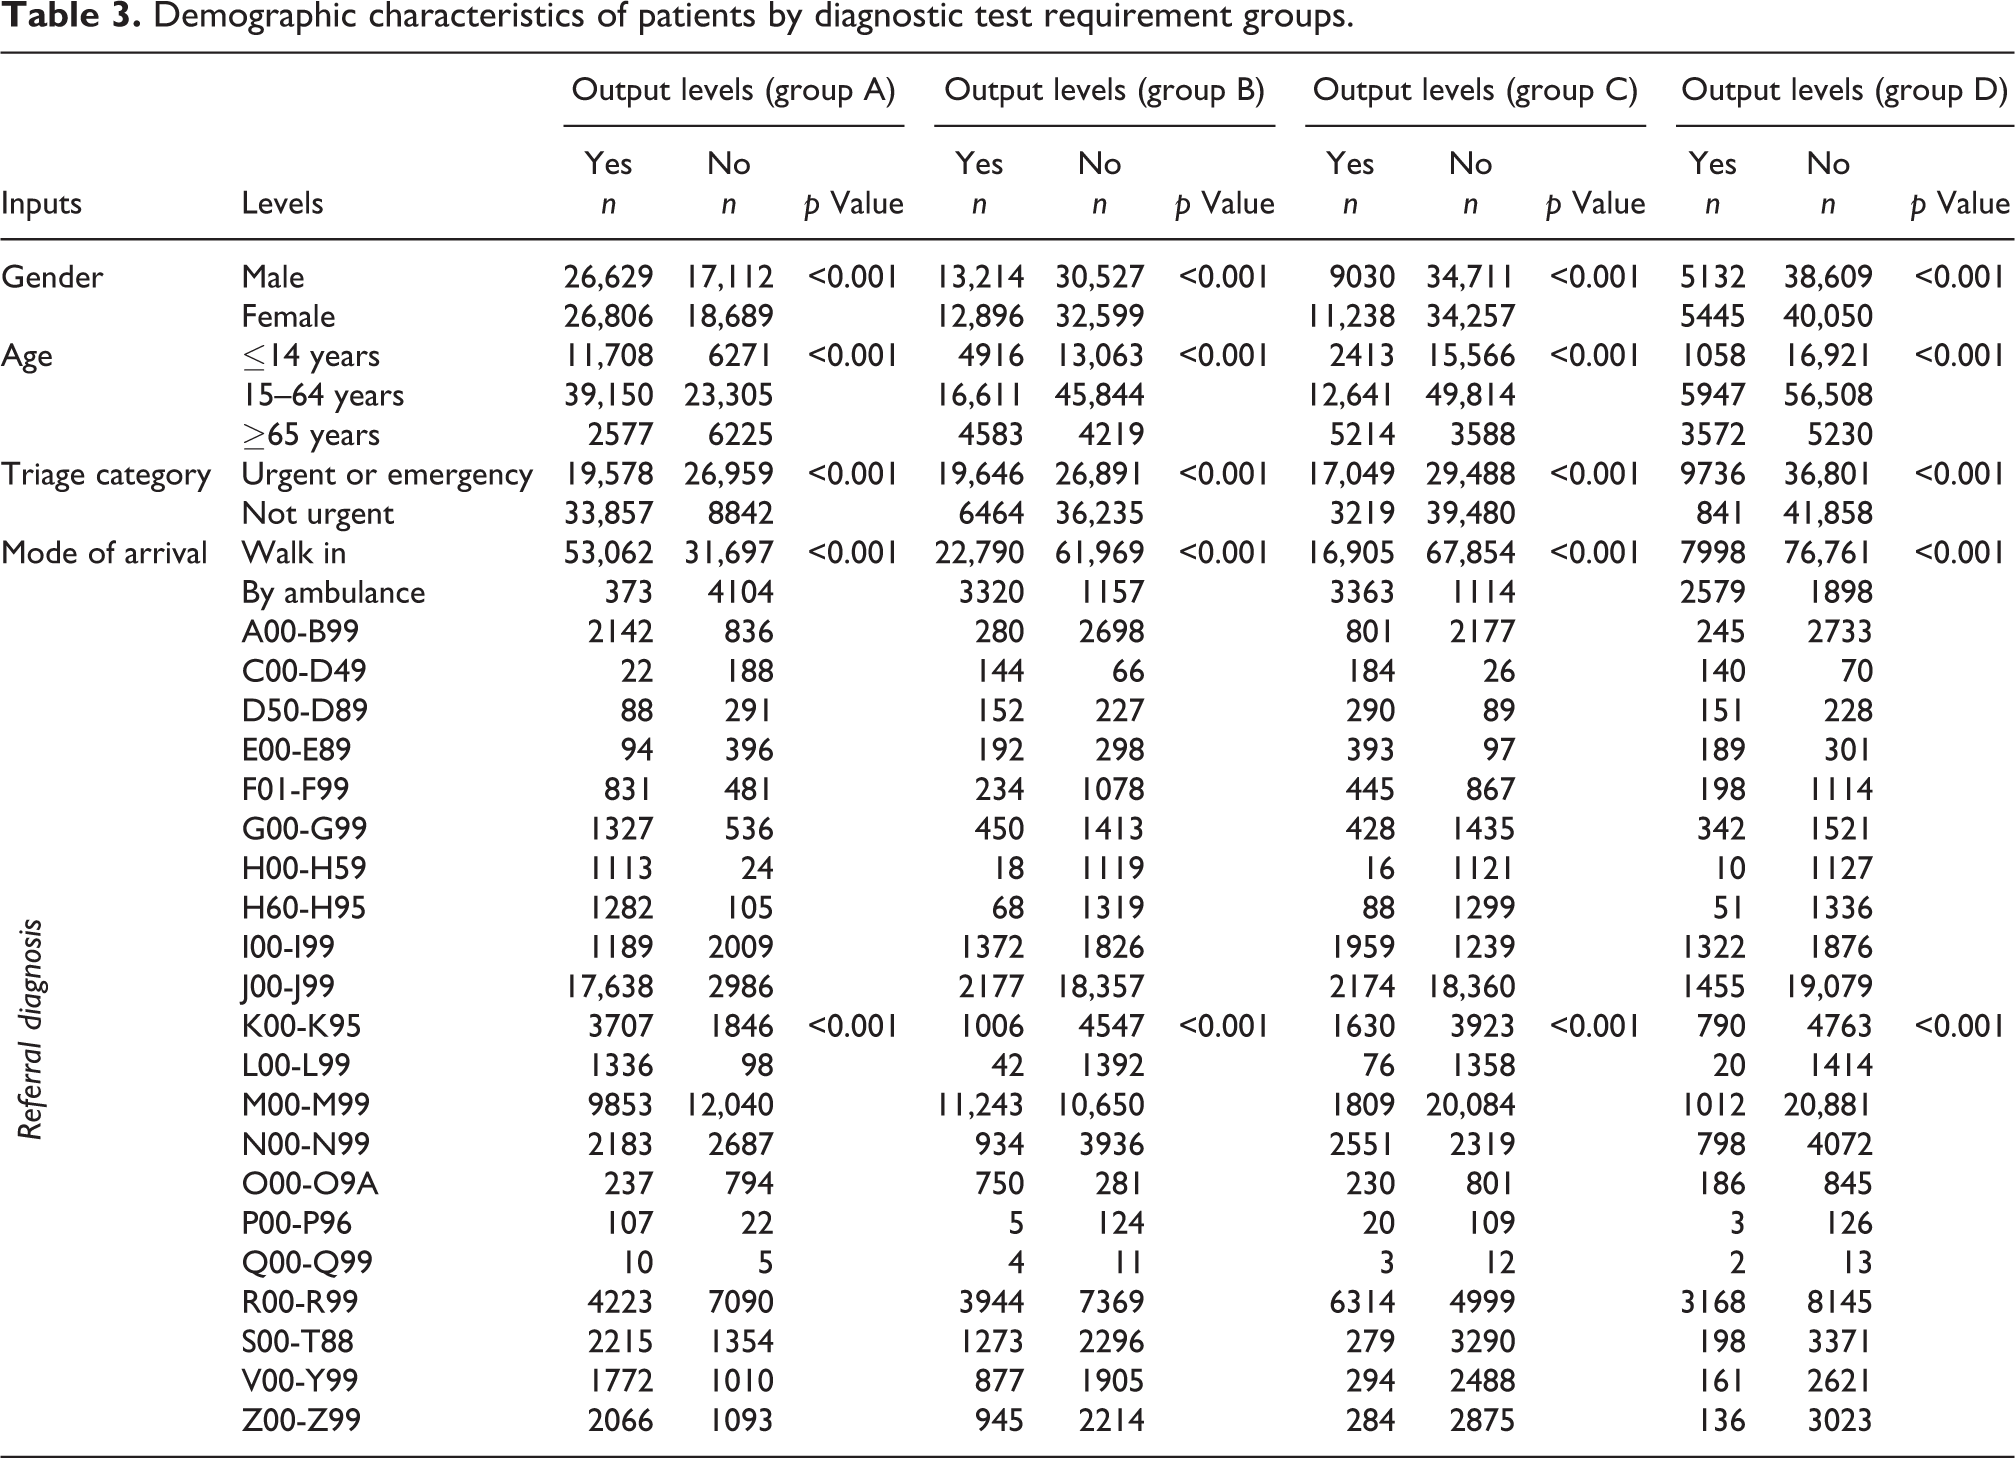
Table 2 shows that patients were evenly distributed across the levels for two input variables, gender and triage category. However, the frequency distributions differed markedly across levels for both age and type of arrival. Specifically, a majority of patients were between 15 and 64 years old and arrived by walking. Regarding the output groups, most of the arriving patients needed neither a laboratory or radiology test (group A). Of these, more needed some type of radiology test (group B) than some type of laboratory test (group C). Patients needing at least both a radiology and laboratory test (group D) formed the smallest group. Table 3 presents the characteristics of the study participants in terms of output groups. The correlation between the input variables and output groups were analysed using χ2 test. These results are also in Table 3. For each group, the results are interpreted in terms of the output level “yes” since this category mainly represents the output group definition. For all output groups, male–female frequencies were very close, with female frequencies being somewhat higher for groups A, C and D. However, for group B, the reverse was true. The frequency distribution for age differed significantly between groups in that the second age group, (age 15–64), had the highest frequencies in all groups. Elderly patients (
As Table 3 shows, most patients in group A were coded as not urgent in triage, whereas the majority of patients in the other three groups were coded as urgent or emergent, with the largest number in group D and the lowest in group B. This indicates that the requirement for some type of diagnostic test significantly increased for urgent or emergent patients. In addition, the ratio of urgent or emergent patients to non-urgent patients was higher for patients requiring laboratory tests than radiology tests. Type of arrival showed a similar pattern. That is, almost all group A patients arrived by walking whereas the proportion arriving by ambulance was markedly greater in the other groups. The ratio of those arriving by ambulance and walking was highest for group D and lowest for group B. This indicates that there were significantly more requests for diagnostic tests for patients arriving by an ambulance, who required laboratory tests more frequently than radiology tests. Table 3 additionally shows that some referral diagnosis codes (P00-P96, Q00-Q99) were rare while others (H00-H59, H60-H95, L00-L99) had low frequencies. Almost all these arriving patients were classified as group A, meaning that they required no diagnostic tests. In contrast, for other low-frequency codes (C00-D49, D50-D89, E00-E89, O00-O9A), patients were classified as B, C or D, meaning that they required at least one diagnostic test. More patients were coded as S00-T88, V00-Y99 or Z00-Z99 and most required some type of radiology test. Patients coded as I00-I99, N00-N99 or R00-R99 generally required at least one type of laboratory or radiology test, most often a laboratory test. Most patients coded M00-M99 required some type of radiology test whereas most coded J00-J99 required no tests. No significant group differences were found for A00-B99, F01-F99, G00-G99 and K00-K95, meaning that referral diagnosis alone was not an important predictor of requiring a diagnostic test for these patients. Finally, Table 3 shows that there were significant correlations between output groups and the input variables (gender, age, triage category, type of arrival, referral diagnosis). Thus, all these variables were included as input variables for the logistic regression models of each output group.
Demographic characteristics of patients by diagnostic test requirement groups.
Logistic regression model results
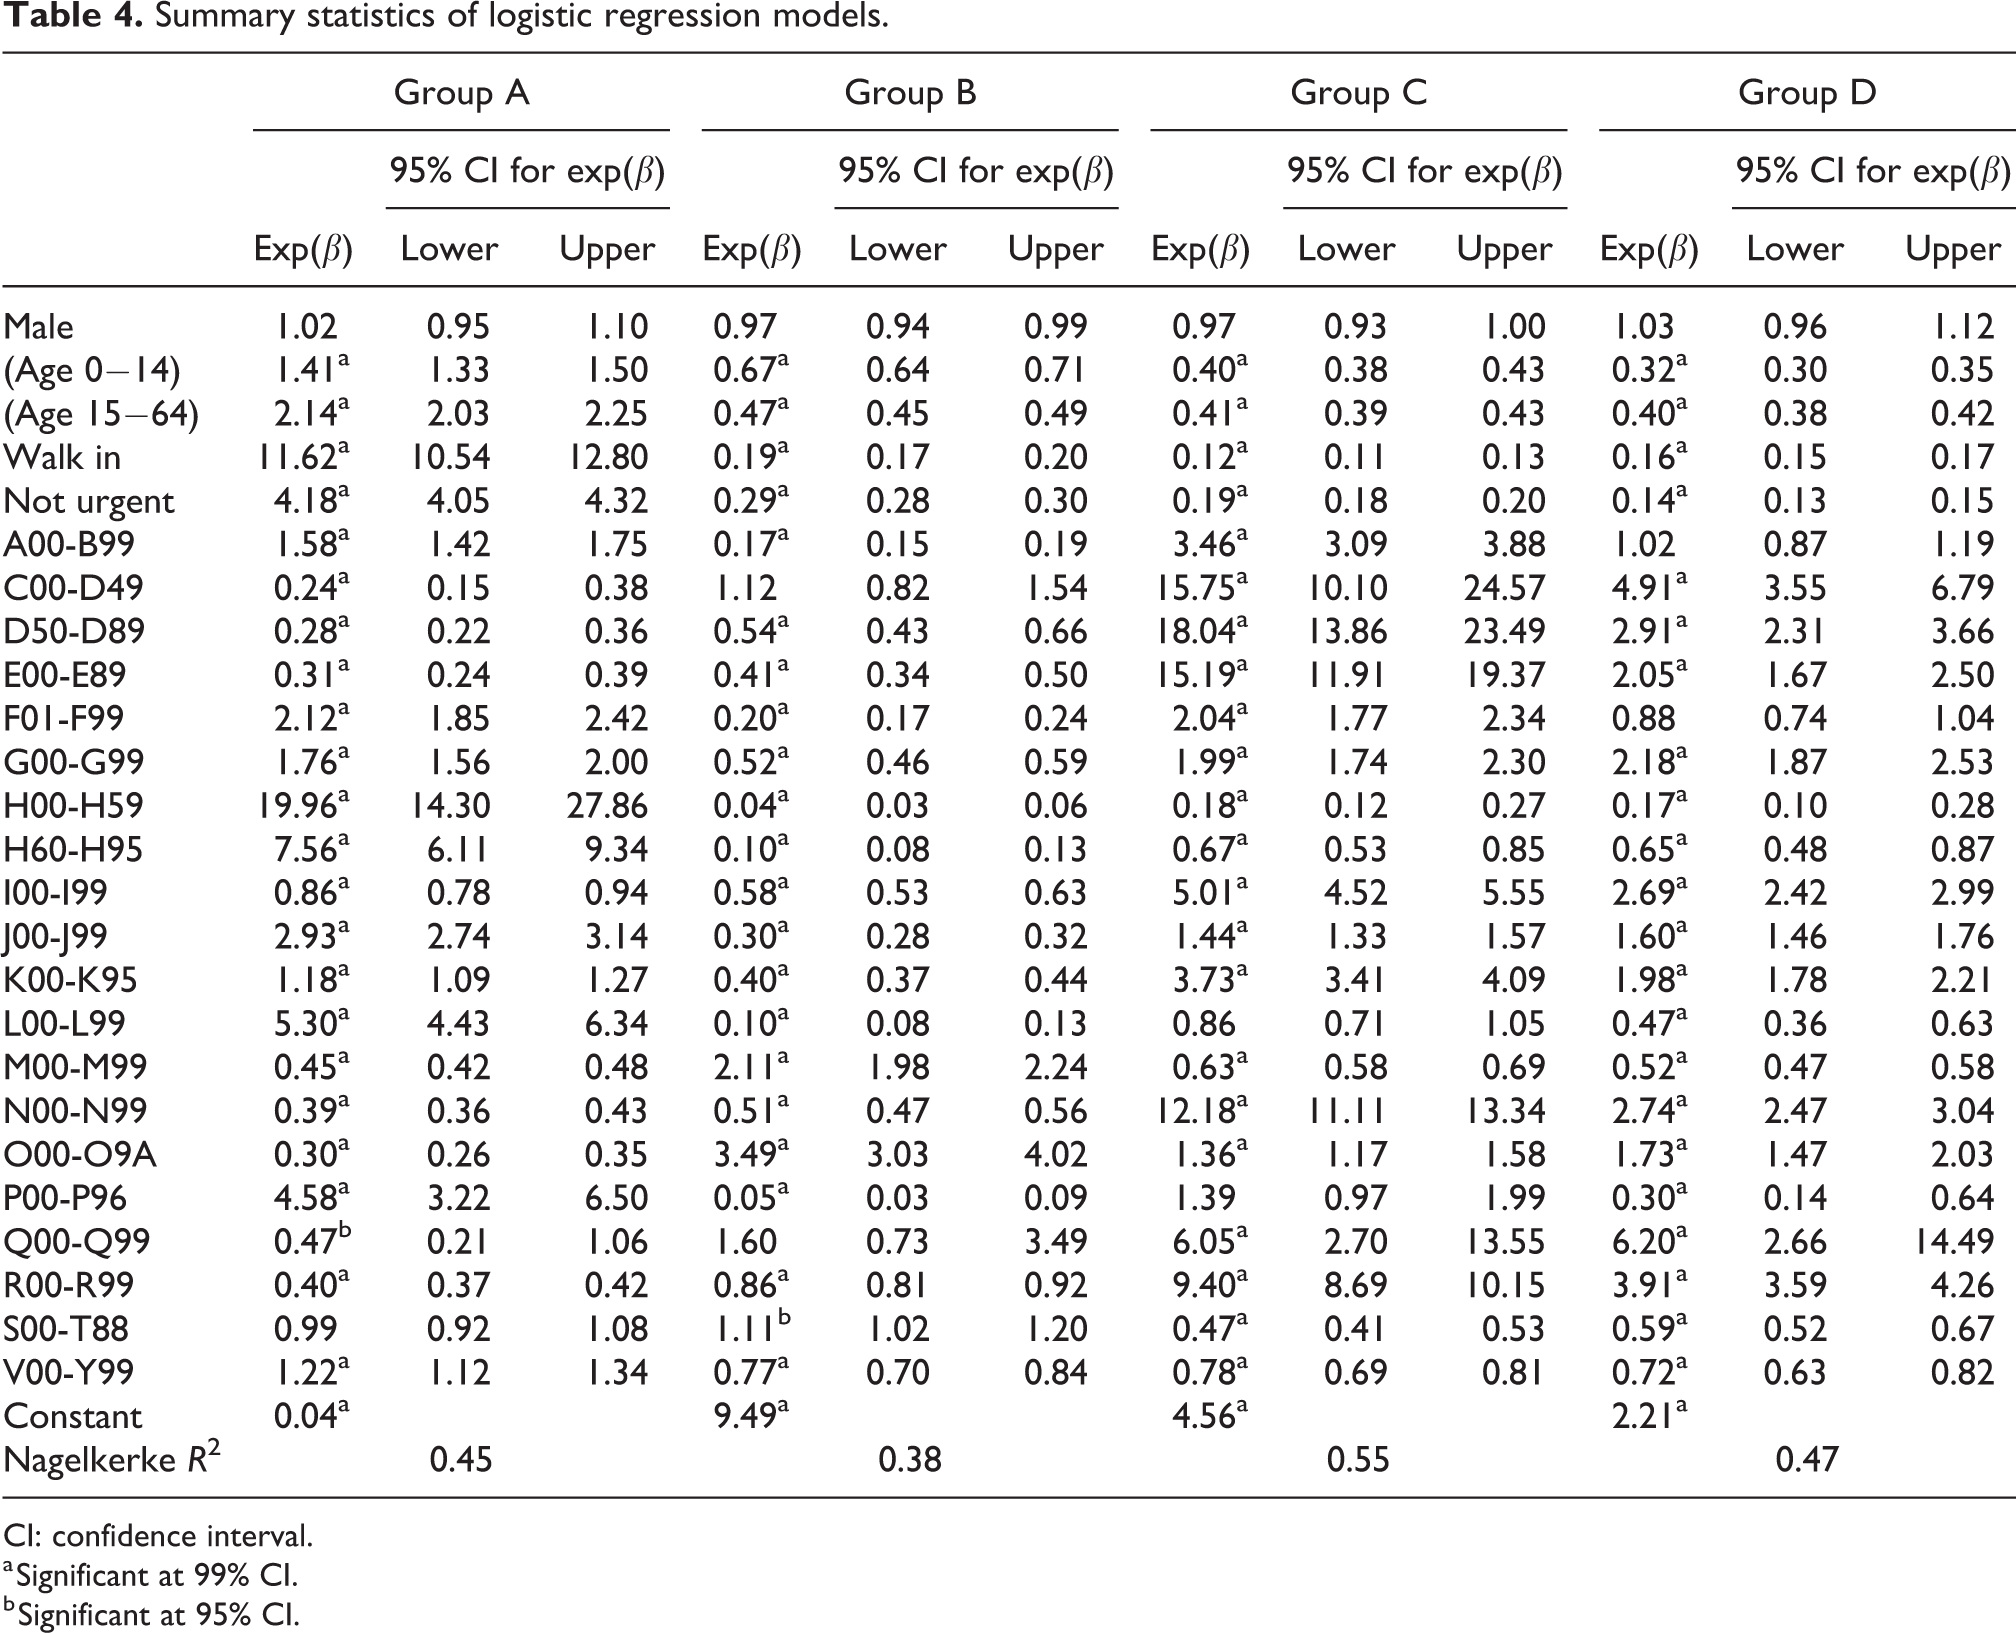
The predicted probabilities of the logistic regression models were obtained for membership of the yes levels for each output group. The last categories of the independent variables (female for gender,
Summary statistics of logistic regression models.
CI: confidence interval.
a Significant at 99% CI.
b Significant at 95% CI.
The following observations can be made based on Table 4. For each of the output groups, males and females had similar probabilities of inclusion in the “yes” categories; that is, exp(β) values were around 1 for A, B, C and D. In contrast, for output group A, participants in the first two age categories ((age 0–14), (age 15–64)) were more likely to be included in the “yes” category than the reference age group whereas the reverse was seen for B, C and D. Similar results held for type of arrival and triage category. While patients in the “walk in” and “not urgent” categories were more likely to be included in the “yes” level of output group A than those in the “arriving by ambulance” and “urgent and emergent” categories, the opposite trend held for output groups B, C and D. Turning to referral diagnosis categories, patients coded as H00-H59, H60-H95, J00-J99 or L00-L99 had significantly higher odds ratios than the reference categories for output group A. On the other hand, the odds ratios for patients coded as C00-D49, D50-D89, E00-E89, I00-I99, N00-N99, Q00-Q99 or R00-R99 were significantly higher in output groups C and D. Finally, the odds ratios for patients coded as M00-M99 or O00-O9A were significantly higher than for those in output group B.
The performance of the logistic regression models are shown in Figure 2. Figure 2 shows that the models were reasonably accurate for groups A (74.11%) and B (73.07%), but much more accurate for groups C (82.47%) and D (85.79%). That is, the logistic regression model performed best in classifying patients requiring both tests while also performing well in classifying patients as requiring no diagnostic test or requiring at least one radiology test. The model sensitivity was higher than its specificity for group A whereas the reverse was true for groups B, C and D. Thus, the model was better able to predict positive outcomes for group A and negative outcomes for the other groups. However, the sensitivity–specificity comparison of the models was consistent since, based on the model design, positive outcomes for group A represent patients who did not require any diagnostic test.
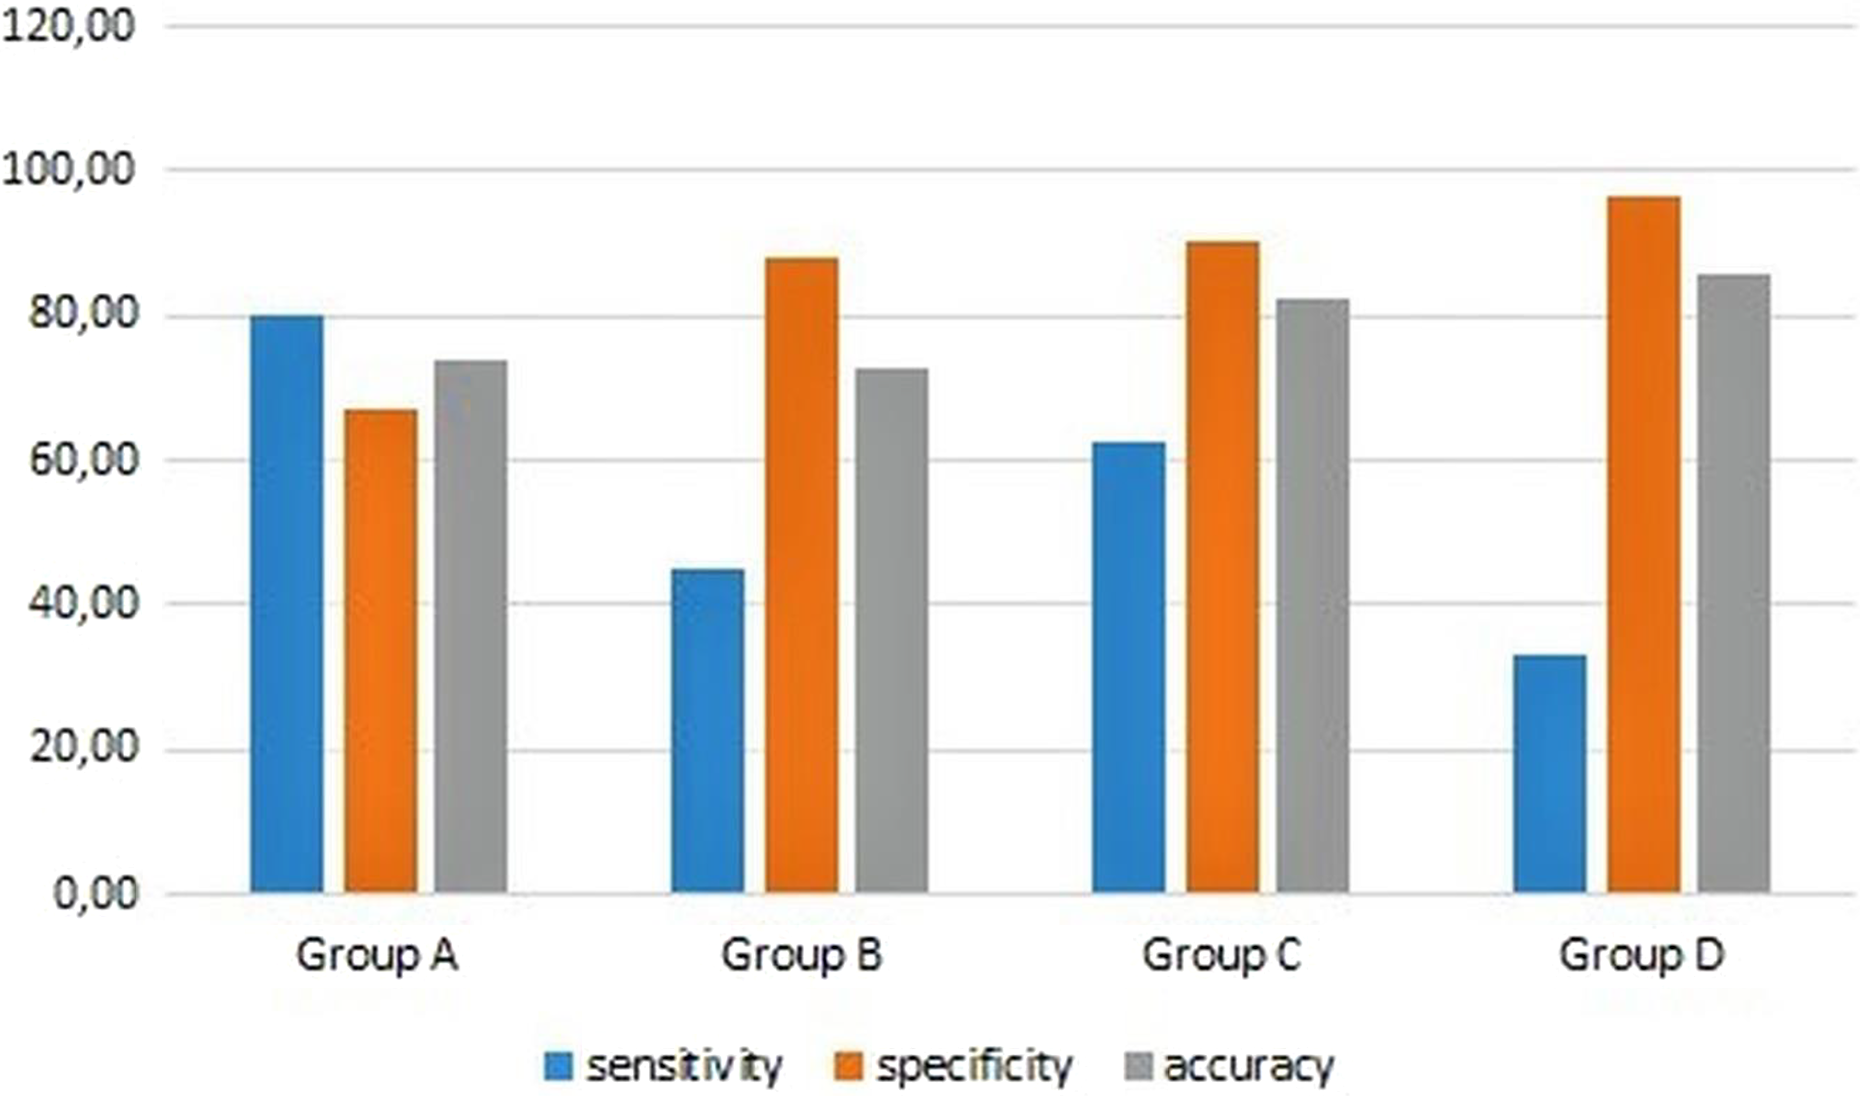
Logistic regression model performance for each output group.
Discussion
Interpretation of descriptive analyses
Regarding the frequency and percentage distributions, one interesting result concerns the influence of gender, specifically that there were more male than female patients in output group B. This could be because males are more likely to suffer traffic or occupational accidents (Sadeghi-Bazargani et al., 2018), which require X-ray, tomography or ultrasound tests. The distribution of patients by age level could be interpreted as follows. As age increases, the patient’s case becomes more critical and complex, which in turn increases diagnostic test requirements. The results for triage category and type of arrival can be interpreted together as indicating diagnostic test requirements markedly increase for patients who arrive by ambulance and are then triaged as urgent or emergent. There were also significant differences in the percentage distributions based on referral diagnosis codes. Overall, the descriptive analysis shows that these input variables significantly determined whether patients required a diagnostic test.
Discussion of logistic regression model results
Using a structured dataset, this study built logistic regression models for all four output groups. For output groups B, C and D, “yes” represented requiring a diagnostic test (radiology and/or laboratory). Thus, high odds ratios for the levels of the input variables were associated with an increased probability of requiring diagnostic tests for these output groups. Conversely, for group A, the output level “yes” represented patients who did not require any diagnostic tests. Therefore, the meaning of the model coefficients was reversed: higher ratios were associated with a lower likelihood of requiring diagnostic testing. Thus, based on the logistic regression model statistics summarised in Table 4, it was concluded that gender had no significant effect on the probability of requiring a diagnostic test whereas age, triage category and type of arrival were significant predictors. This result both supports this study’s descriptive results and confirms previous studies (Cheung et al., 2002; Izady and Worthington, 2012). The odds ratios for 21 ICD-10 codes representing the referral diagnoses of the ED patients are given in Table 4. This section interprets the model coefficients in comparison with existing laboratory and radiology testing guidelines and the research literature.
Various inferences can be drawn about the relationship between patient codes and output group. First, patients coded H00-H59, H60-H95, J00-J99 or L00-L99 generally required no diagnostic testing. For example, if a patient arrives in ED complaining of a sore throat, fever or asthenia, experienced coders assigned the ICD-10 code JXX.XX as the referral diagnosis. Subsequently, ED physicians can generally assign a final diagnosis of upper respiratory tract infection, J06.9, just from physical examination without any diagnostic testing (Gonzales et al., 2001). On the other hand, referral diagnosis codes C00-D49, D50-D89 and E00-E89 generally required laboratory tests or laboratory and radiology tests together (hence, the ratios of these diagnoses categories were higher in output groups C and D). Similarly, if a patient with a known history of diabetes mellitus arrives at ED unconscious and is assigned the referral code E16.X, physicians generally order both laboratory and radiology tests to determine the patient’s state of consciousness (Ben-Ami et al., 1999). Patients coded I00-I9, N00-N99 or R00-R99 generally required diagnostic testing, especially laboratory tests (hence, the ratios were high for output group C). For example, when a patient arrives at ED with chest pain, they are generally coded as R07.X. To determine whether the final diagnosis should be acute coronary syndrome or not, the ED physician then orders a cardiac enzyme, specifically a high-sensitivity troponin T laboratory tests on arrival, and repeated after 1 and 3 hours (Vigen et al., 2018). These few studies have been discussed to demonstrate how the model results of this study are in line with the research literature. However, many other studies could also be cited (e.g. Hot et al., 2007; Martin and Rossi, 1997; Schaefer, 2011; Shulman et al., 2012; Zuberbier and Maurer, 2007). While previous studies have offered laboratory and radiology testing guidelines, the present study contributes to the literature by offering a novel template model for the diagnostic testing requirements of ED patients by simultaneously considering both referral ICD-10 classifications and different types of demographic inputs, which may affect decisions about whether a patient requires a specific diagnostic test.
Limitations of the study
There are some limitations to the present work. First, the use of retrospective data from one hospital means that the descriptive results are context-specific and hence not generalisable. However, the logistic regression model results can be generalised because they are supported by existing research findings. Another limitation concerns the range of types of data stored in this hospital. If other potentially relevant data were available, such as patient and family medical history, type of drugs used, height and weight, and body mass index, they could be added as input variables. This might improve the performance of the classification model. Finally, the dataset had a “no dominant” structure because the frequencies of ordering any/both test types were low and much lower when requesting radiology or laboratory tests only. This creates an obstacle in using a multinominal logistic regression model with four mutually exclusive outcomes of no diagnostic test, radiology only, laboratory only and both.
Practical implication
Since time is critical in emergency situations (Sarıyer et al., 2017), models that can decrease time spent per patient are highly beneficial from the perspective of both individual patients and the social system. Thus, a model for classifying patients in terms of their diagnostic test requirements has many practical implications in planning ED operations. First, with this model, a triage staff can estimate a patient’s diagnostic test requirements and inform related personnel and units so that necessary preparations can be made before the physician’s examination, thereby saving valuable time. Secondly, the high volume and wide range of sometimes very complex cases that EDs deal with causes diagnostic difficulties for ED physicians. Specifically, it includes determining whether a patient with specific demographic characteristics requires a particular diagnostic test type. In such cases, this model can be used to improve decision-making by ED personnel because it is developed based solely on past experience in the ED. For instance, the model can propose a radiology test for a patient based on previous ED test selection decisions for patients with similar demographic characteristics. This can also improve ED budget planning by reducing costs from unnecessary use of resources (capacities, equipment, radiology/laboratory units, etc.). Finally, and perhaps most importantly, for medium- to long-term planning, the knowledge generated by this classification model can be integrated with population demographics (percentages based on age, gender, diagnosis and any other variables identified by future studies). This integration can guide the planning of various ED processes, such as facility design (laboratories, radiology units), capacity planning, stock management and quality management (improving services quality, decreasing waste of clinical resources).
Conclusion
This study proposed classification models based on logistic regression to empower decision-making and process planning in EDs by classifying patients according to their requirement for diagnostic tests. The structure of the logistic regression equations (model coefficients and input variables) reveal the role of particular characteristics in determining the need for diagnostic testing. In addition, by dividing the diagnostic tests into radiology or laboratory tests, the proposed models provide a guide to patient characteristics that predict requiring no tests, a radiology test, a laboratory test or both a radiology and laboratory test. The logistic regression models were reasonably accurate for each group (with respective values of 74.11%, 73.07%, 82.47% and 85.79%), and the models were generally better able to predict negative outcomes compared to positive ones (specificities were higher in most models). In the ED literature, requests for diagnostic tests have been frequently used as an input variable for the generated models. However, to the best of our knowledge, these tests have never been considered as an output factor. The models proposed in this study can thus contribute to the literature and are worthy of the attention of practitioners and researchers. Regarding future research directions, deeper insights may be gained by including different input factors to improve classification accuracy and sensitivity. This could include defining the output groups more specifically (i.e. analysing patients requiring particular tests, such as X-ray, tomography and ultrasound), rather than radiology in general or, similarly, analysing patients in terms of requests for specific laboratory tests, such as haemogram, biochemistry or blood type.
Footnotes
Acknowledgements
The authors acknowledge Dr İlker Kızıloğlu for his general support and Hüseyin Çelik for his technical support. For writing assistance, the authors acknowledge Lecturer Simon Mumford, who is the English coordinator of the School of Foreign Languages and Academic Writing Center of İzmir University of Economics, İzmir, Turkey.
Declaration of conflicting interests
The author(s) declared no potential conflicts of interest with respect to the research, authorship and/or publication of this article.
Funding
The author(s) received no financial support for the research, authorship and/or publication of this article.