






Abstract
In Australian Early Childhood Education (ECE), a culturally diverse workforce is recognised. However, little is known about how leadership shapes culturally inclusive workplaces. This cross-sectional study examined how ECE leaders promote diversity and inclusion, comparing culturally and linguistically diverse (CALD) and non-CALD directors. A national survey of centre-based service directors examined inclusive values, practices, and workplace outcomes. Descriptive and comparative analyses were conducted on 502 responses, with one-quarter identifying as CALD. While both groups of directors strongly endorsed cultural diversity, CALD directors reported lower levels of implementation of inclusive practices, indicating a gap between values and practice. They also reported more positive outcomes for CALD staff, including higher participation in further education and career advancement. These findings highlight the importance of diverse leadership and the need for organisational and sector-level strategies to reduce barriers and strengthen culturally inclusive practices in ECE settings.
Introduction
In recent years, the diversity of Australia’s early childhood education (ECE) workforce has received increasing attention in research and policy (Arndt & Bartholomaeus, 2022; Nuttall, Grieshaber, et al., 2022). In Australia, the ECE sector is nationally regulated under the National Quality Framework (NQF), with the Australian Children’s Education and Care Quality Authority (ACECQA) responsible for guiding policy, workforce development, and quality assurance. Within this policy context, the National Workforce Strategy: Shaping Our Future (ACECQA, 2021) outlines a 10-year agenda to attract, retain, and support a qualified and sustainable ECE workforce. Its accompanying Implementation and Evaluation Plan (ACECQA, 2022) explains how these goals will be operationalised and monitored across jurisdictions. These documents identify educator well-being, career development, and organisational support as essential for building and sustaining a high-quality workforce. They also highlight persistent challenges, including educator burnout, limited career progression, professional isolation, and high turnover rates. Together, these concerns underscore the importance of supportive leadership, strong workplace cultures, and equitable access to professional learning.
Despite these acknowledged priorities, limited national data exist on the experiences and career trajectories of culturally and linguistically diverse (CALD) educators and leaders in Australian ECE. CALD refers to individuals born overseas or with at least one parent born overseas, who do not have English as their first language and/or hold cultural or religious values distinct from mainstream and First Nations Indigenous communities (Gide et al., 2022). Although CALD educators contribute multilingual skills, cultural knowledge, and enhanced family engagement, little systematic information is available about their presence or experiences within the ECE workforce. While the triennial ECE National Workforce Census (NWC) provides data on categories such as qualifications, age, tenure, work hours, and professional development, it does not capture educators’ cultural or linguistic backgrounds, leaving a significant gap in understanding workforce diversity.
Workforce diversity is recognised within the National Workforce Strategy, particularly in Focus Area 2: Attraction and Retention. However, policy efforts have emphasised recruitment, with comparatively limited attention to educators’ post-entry experiences, including career development, workplace inclusion, and leadership pathways. This reflects a broader tendency to frame diversity as a supply issue rather than an organisational one, overlooking how workplace conditions and leadership practices shape retention and progression. The absence of CALD-specific data in national workforce policies and planning documents risks obscuring potential structural and cultural barriers that may shape CALD educators and leaders’ participation, recognition, and retention. These gaps reflect wider policy ambiguities around leadership and workforce diversity, with scholars noting that ECE policies often overlook diverse leadership identities and silence the structural supports required to enact inclusive leadership (White, 2023).
Culturally Inclusive Leadership in ECE
Leadership strongly influences organisational culture, relational trust, staff collaboration, and opportunities for professional growth (Garrett & Gibbs, 2025; Waniganayake et al., 2017). Inclusive leadership—characterised by respect, equitable participation, and responsiveness to difference—has been associated with improved well-being and professional outcomes (Lee et al., 2025). However, the literature often positions inclusive leadership as a set of desirable attributes, with less attention to how it is shaped by structural conditions, power relations, and leaders’ positionalities. Leadership is not culturally neutral (Nuttall, Henderson, et al., 2022; White, 2023). It emerges from leaders’ own values, identities, and sociocultural contexts (Gibbs & Press, 2023). What counts as inclusive, fair, or supportive can differ markedly between individuals, suggesting that directors’ cultural backgrounds may shape how they understand and enact inclusivity.
Culturally inclusive leadership in ECE involves acknowledging and celebrating cultural diversity, promoting transparent communication, fostering collaborative decision-making, and ensuring equitable access to professional opportunities. Equity-focused leadership emphasises treating staff equitably and fairly according to their individual needs—not simply equally—which helps to mitigate systemic barriers that may disproportionately affect CALD educators (Phillips, 2025). Such leadership fosters a sense of belonging and contributes to creating culturally safe environments for educators, children, and families (IPART, 2023). Yet, there remains limited empirical evidence demonstrating how these leadership principles are enacted in everyday organisational practices, particularly in relation to culturally diverse workforces. As the cultural diversity of the ECE workforce continues to grow (Arndt & Bartholomaeus, 2022), understanding how directors promote inclusive workforce practices has become increasingly important.
Conceptualising Inclusive Values, Practices, and Outcomes in ECE Leadership
Understanding cultural inclusiveness in ECE requires attention to leaders’ beliefs and values, organisational practices, and outcomes experienced by educators. This framing aligns with leadership research that conceptualises leadership as both a belief system and a socially situated practice, expressed through values, enacted practices, and organisational outcomes. Inclusive values shape how diversity is perceived within an organisation. Inclusive values shape how diversity is perceived within an organisation. Valuing cultural diversity can strengthen relationships with families, enhance pedagogical responsiveness, and enrich organisational learning (Nuttall, Henderson, et al., 2022; Qi & Campbell, 2022). However, culturally diverse workplaces also present challenges, including communication differences, power imbalances, and varied professional expectations requiring deliberate leadership to navigate (Waniganayake et al., 2017). Yet national policy provides limited guidance on culturally inclusive leadership (White, 2023), constraining implementation in practice.
Inclusive practices refer to organisational actions that support equity and recognition for staff, including professional development opportunities, transparent promotion processes, and equitable access to leadership opportunities. Organisational transparency, relational support, and fairness in decision-making influence educators’ well-being, sense of belonging, and retention (Garrett & Gibbs, 2025; Gibbs & Press, 2023). However, existing research often examines these practices separately, with limited attention to how values, practices, and outcomes interact.
Inclusion outcomes indicate whether inclusive values and practices translate into tangible improvements in CALD educators’ professional trajectories. Participation in further study, attainment of higher qualifications, and progression into leadership roles provide indicators of workplace inclusion and professional recognition. These outcomes align closely with national policy priorities to support and retain a diverse ECE workforce (ACECQA, 2021, 2022) and highlight whether CALD educators experience equitable opportunities for advancement (Gide et al., 2022).
Research Gap and Purpose of the Study
Taken together, inclusive values, practices, and outcomes a useful analytical framework for examining how ECE directors understand and enact cultural inclusiveness. Given the increasing cultural diversity of the Australian ECE workforce and evidence that inclusive leadership strengthens pedagogical practice and organisational learning (Nuttall, Grieshaber, et al., 2022; Qi & Campbell, 2022), directors’ cultural backgrounds may influence how inclusiveness is understood and enacted. Understanding how leadership in ECE supports or constrains culturally safe environments and how these dynamics influence CALD educators’ opportunities for recognition, progression, and participation is both timely and necessary.
Research Aim and Questions
This study sought to explore Australian ECE service directors’ culturally inclusive values and practices, along with the outcomes for CALD educators. A secondary aim was to explore whether directors’ cultural background shapes approaches to inclusive leadership. The study was guided by the following research question:
Do Directors from CALD and Non-CALD Cultural Backgrounds Differ in Their Reported
(1) valuing of cultural inclusiveness; (2) implementation of culturally inclusive workplace practices; and (3) support for positive outcomes for CALD employees?
Rather than assuming that cultural background determines inclusive leadership, the study sought to examine whether meaningful similarities or differences emerge in directors’ reported values, practices, and outcomes.
Methodology
The methodological approach was designed to explore ECE directors’ understandings of inclusive values, practices, and workplace outcomes and to enable comparison between CALD and non-CALD leaders. Ethics approval for this project was obtained from the Macquarie University Human Research Ethics Committee (Approval No: 520221079837039). Data were collected through a Lime Survey questionnaire completed by Directors working in Australian ECE services.
Survey Design
An online survey was developed to capture directors’ perspectives on culturally inclusive leadership. This study adopts a sociocultural perspective, understanding leadership as shaped by directors’ values, identities, and cultural contexts, and enacted through workplace relationships and organisational practices. From this perspective, inclusive leadership is not culturally neutral but is constructed within specific service contexts (Gibbs & Press, 2023; Nuttall, Henderson, et al., 2022). The survey focused on directors as key decision-makers whose values and practices influence workplace culture and inclusion outcomes. While responses were expected to provide an accurate account, self-reported data may be influenced by social desirability bias.
The survey aligned with three constructs articulated in the research questions: inclusive values, practices, and outcomes. These reflect the conceptual framing in which values (beliefs), practices (organisational actions), and outcomes (educators’ progression) are interconnected dimensions of culturally inclusive leadership.
The survey consisted of three main components: (1) Director characteristics, including cultural background, qualifications, and years of experience. (2) Culturally inclusive values and practices, assessed through Likert-scale items on workforce diversity, transparency, equity, and workforce investment. (3) Inclusion outcomes for CALD employees, specifically, support to enrol in and complete qualifications, and progression into roles of greater responsibility.
Open-ended questions were included across the three sections, inviting participants to describe additional strategies used to support CALD educators.
Recruitment and Data Collection
A purposive sampling approach was used to recruit centre directors from long day care (LDC) and preschool (PS) services. In the Australian ECE context, LDC services provide education and care for children from birth to school age, operating extended hours (e.g., 7:30 a.m–6:00 p.m) to support working families, while PS services offer educational programs for children in the year or two before school, usually operating between 9:00 a.m–3:00 p.m. Recruitment was limited to centre-based services to ensure comparability of leadership roles and organisational contexts for inclusive practice.
The survey was distributed by direct email to 11,021 ACECQA-registered LDC and PS services and shared through the head offices of three large service providers, inviting distribution of the survey internally. At the time of data collection (May 2023), the ACECQA National Register listed 17,278 ECE services, including 8,761 LDCs and 3,078 PSs (ACECQA Q1 2023 Snapshot). Due to time and resource constraints, only LDC and PS services with valid email addresses available on the ACECQA website were contacted.
A total of 502 directors responded (4.6% response rate). Although modest, this rate is comparable with other Australian national surveys (Park et al., 2025). Of the respondents, 330 worked in LDC (65.8%), 166 in PS (33.1%), three selected ‘other’, and another three did not specify their service type (1.1%).
Data Analysis
The collected data for this research were analysed using SPSS (version 29) following the stages outlined by Harrison (2020): • Data organisation involved cleaning the dataset by correcting typographic errors, removing blank entries, naming variables, and running preliminary frequency checks. • Data manipulation to create new variables, recoding variables (e.g., categorising years of tenure), and descriptive analysis (frequencies, means, and standard deviations). • Statistical analysis (chi-square and t-test) to compare CALD versus non-CALD responses. Significance levels are reported as: significant: p ≤ .05, marginal: p = .06 to p = .09; not significant (ns): p > .05. • Data visualisation to present the results in tables.
Open-ended responses were analysed using a descriptive qualitative approach guided by inductive analysis. Data were read multiple times to ensure familiarity, and initial codes were generated from participants’ accounts. These codes were iteratively grouped into broader themes (e.g., perceived benefits, challenges, and organisational practices), which were refined to capture patterns across the dataset. Illustrative quotes were selected to represent common perspectives, as well as divergent views where relevant, and were used to exemplify themes rather than support statistical findings. Given the exploratory design and limited scope of the measures, findings are interpreted cautiously and do not imply causality.
Findings
Demographic Data of Participating Directors
CALD and non-CALD Directors’ Qualifications and Experience
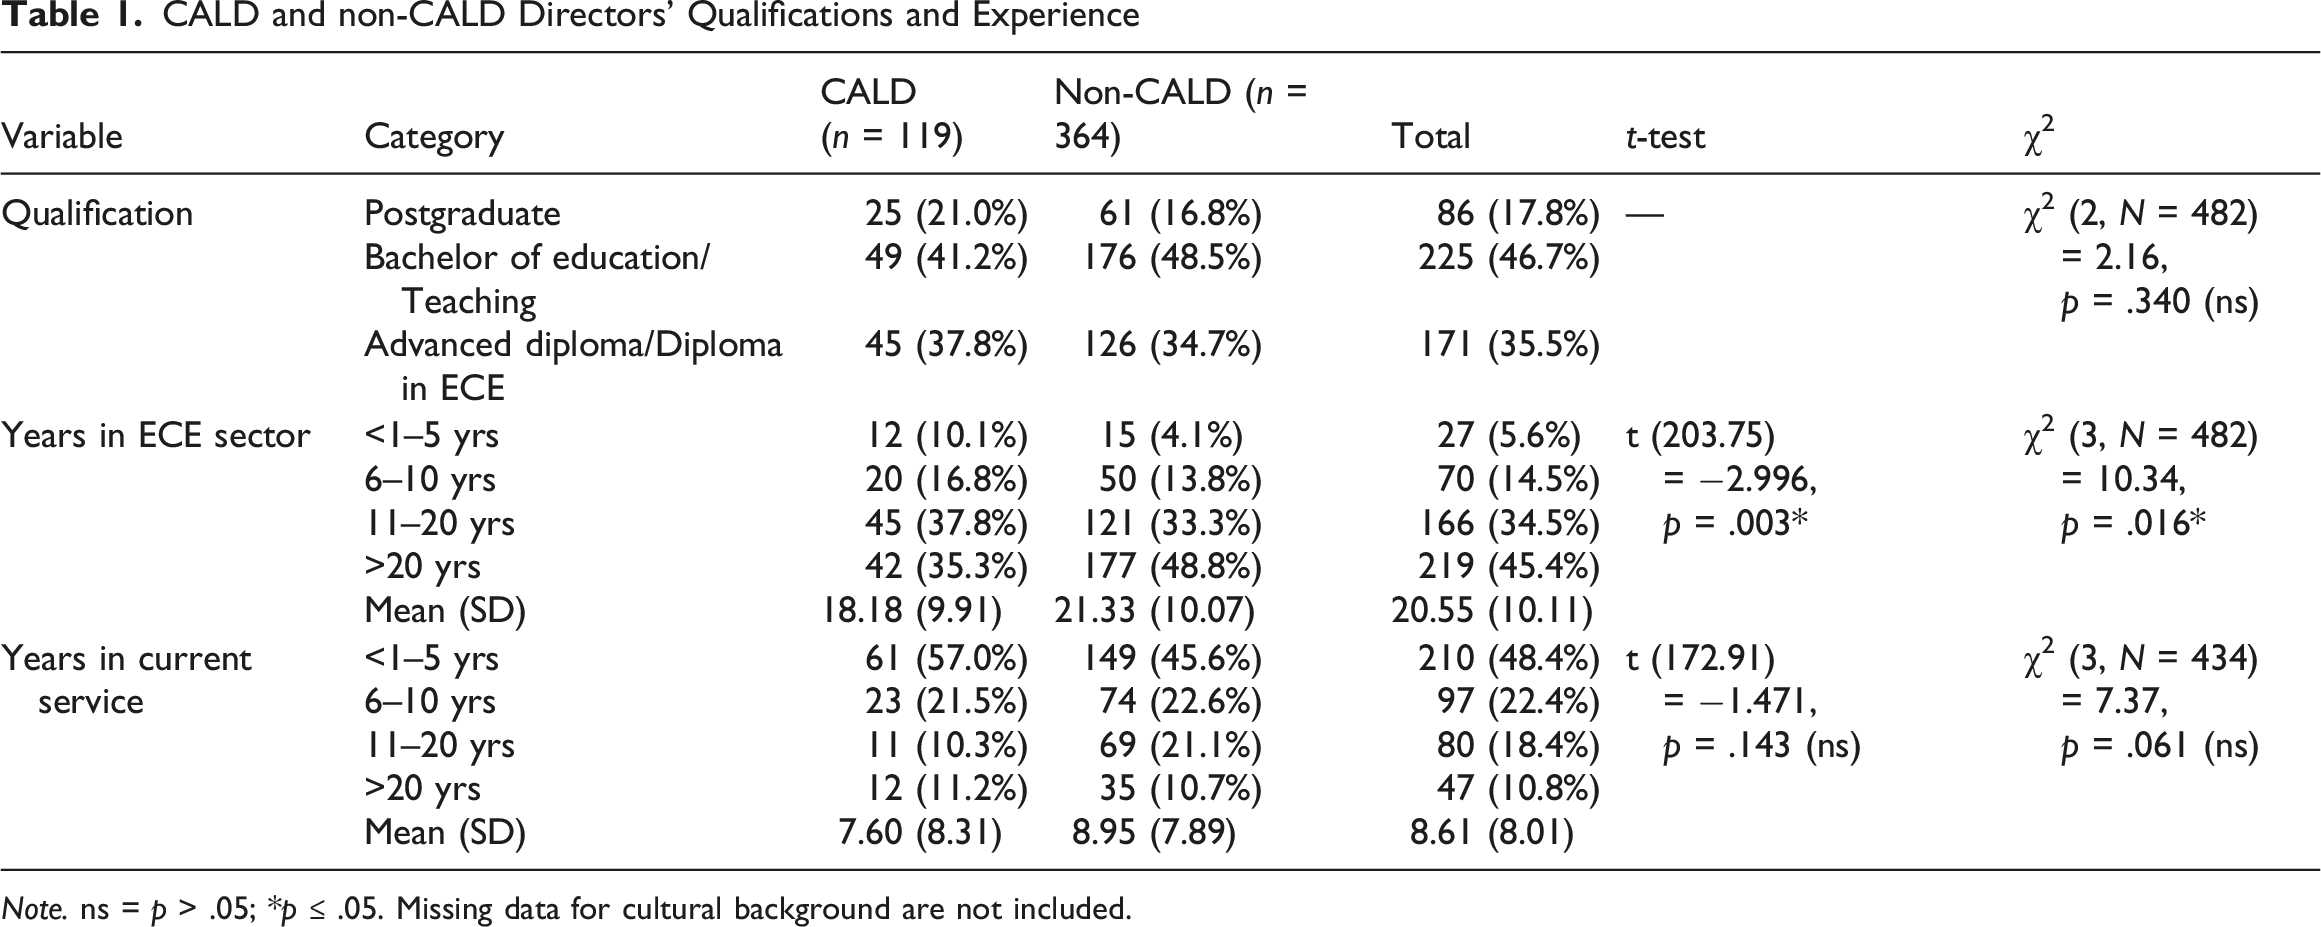
Note. ns = p > .05; *p ≤ .05. Missing data for cultural background are not included.
Qualifications
Comparative analysis for the 483 directors who provided both cultural background and qualification information showed that the distribution of educational qualifications for CALD and non-CALD directors was relatively similar; a chi-square test confirmed no significant difference between groups (χ2 (2) = 2.157, p = .340). A total of 86 (17.8%) directors reported holding a postgraduate degree, with similar proportions for CALD (21%) and non-CALD (16.8%) backgrounds. Directors with bachelor’s degrees represented the highest proportion (46.7%), with a slightly higher percentage for non-CALD directors (48.5%) compared to CALD directors (41.2%). Additionally, over one-third of directors (n = 171) had Advanced Diploma/Diploma qualifications, with a slightly higher percentage for CALD (37.8%) versus non-CALD directors (34.7%).
Years of Experience in the ECE Sector
Participants’ years of experience in the ECE sector ranged from 0.5 years to 48 years, M = 20.55 years (SD = 10.11). On average, CALD directors had fewer years of experience (M = 18.18; SD = 9.91) than non-CALD directors (M = 21.33; SD = 10.07) (t = −2.996 (203.75) p = .003). Directors’ overall experience in the ECE sector also differed across four categories (less than 1 year to 5 years, 6–10 years, 11–20 years, and over 20 years); (χ2 (3) = 10.335, p = .016). Notably, the percentage of CALD directors with less than 1 to 5 years of experience (10.1%) was more than double that of non-CALD directors (4.1%). And while the percentage of CALD directors with 6–10 (16.8%), and 11–20-years (37.8%) experience was similar to non-CALD directors (13.8% & 33.3%), only one-third (35.3%) of CALD directors had over 20 years of experience in the ECE sector compared to half of non-CALD directors (48.8%).
Years of Experience in the Current ECE Service
Directors’ years of experience in their current services ranged from 0.25 to 38 years. The mean tenure for the entire group was 8.61 years (SD = 8.01), with a slightly lower average for CALD directors (M = 7.30; SD = 8.31) than non-CALD directors (M = 8.95; SD = 7.89). The t-test comparison was not significant (t = −1.471 (172.91), p = .143), but the chi-square test indicated a marginal level of significance (χ2 (3) = 7.369, p = .061). More CALD directors (57.0%) had 1–5 years of experience compared to non-CALD directors (45.6%), and fewer CALD directors had 11-20 years’ experience (10.3%) than non-CALD directors (21.1%). Similar proportions of CALD and non-CALD directors reported 6–10 years (21.5% vs. 22.6%), and over 20 years of experience (11.2% vs. 10.7%).
Cultural Inclusiveness
Comparison of CALD and non-CALD Directors’ Views on Inclusive Values
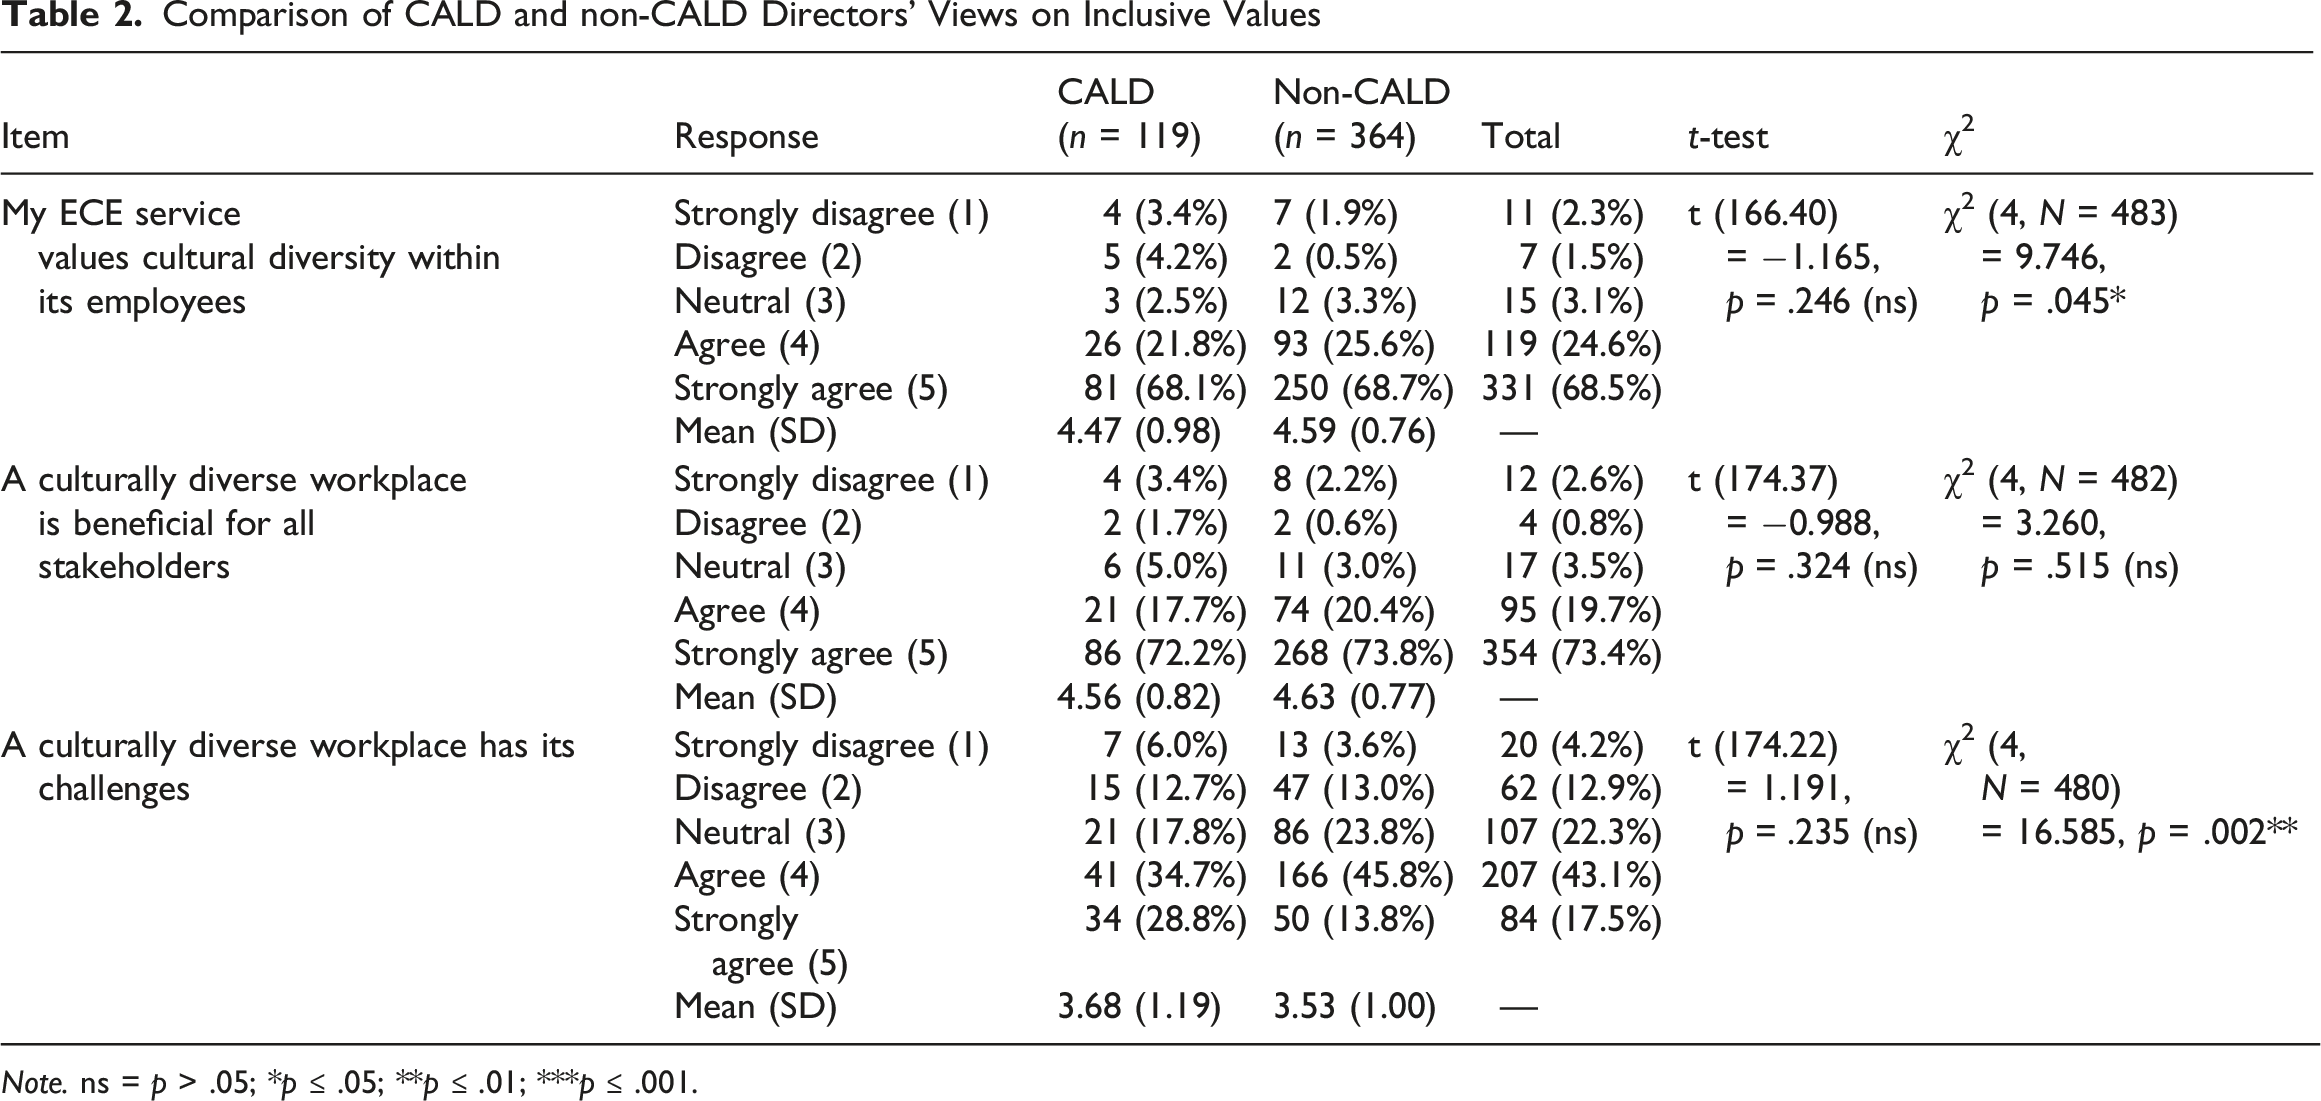
Note. ns = p > .05; *p ≤ .05; **p ≤ .01; ***p ≤ .001.
Comparison of CALD and non-CALD Directors’ Views on Inclusive Practices
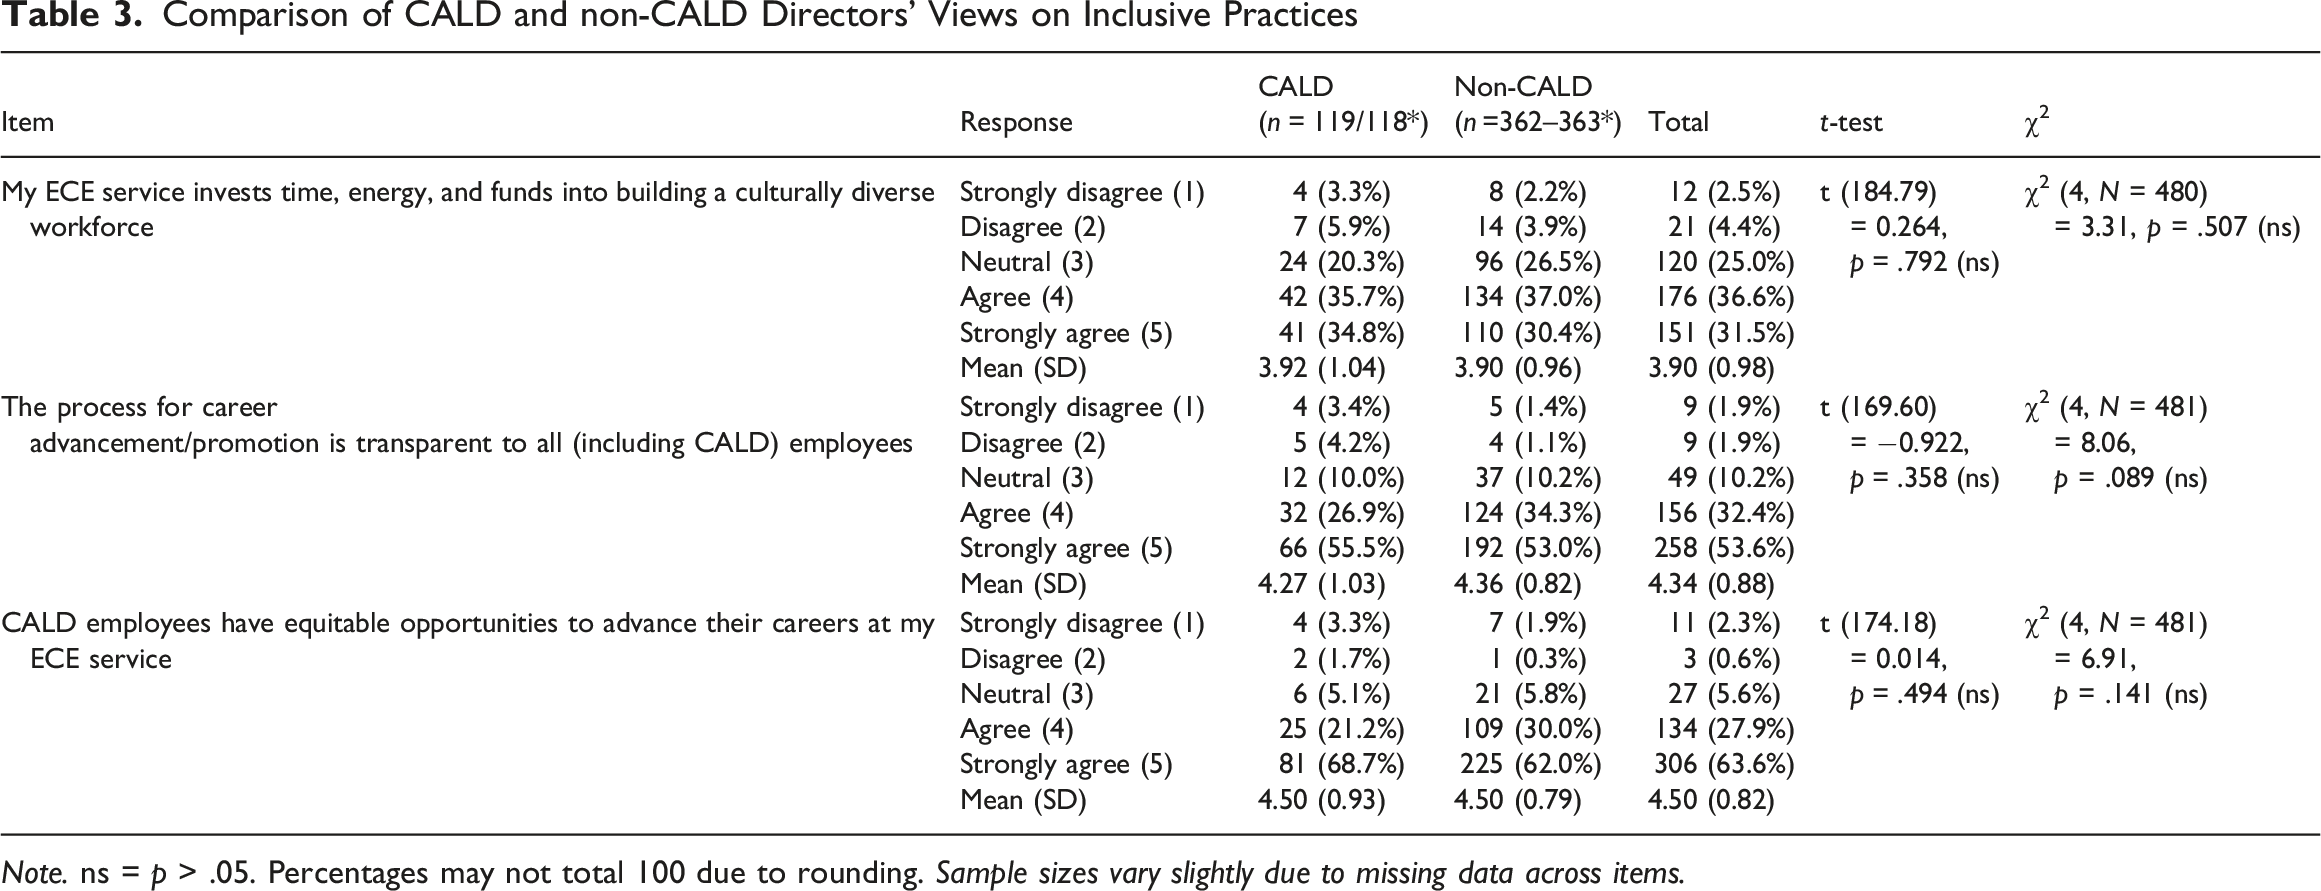
Note. ns = p > .05. Percentages may not total 100 due to rounding. Sample sizes vary slightly due to missing data across items.
Results for qualifications showed weak correlations across five statements, ranging from r = ‒.028 to r = .049, ps >.05 (ns). Only the statement, “A culturally diverse workforce is beneficial for all stakeholders,” achieved a significant correlation: r = .101, p = .025, indicating that more qualified directors were more likely to agree. Correlations for years of experience were also weak and non-significant (rs = .001 to .079, ps > .05), suggesting that the length of time directors had worked in the sector or at their current service did not show significant associations with how directors perceived or rated inclusive values and practices. Given these minimal associations, comparative analyses were conducted between CALD and non-CALD directors using t-test and chi-square analysis. Responses are illustrated by selected comments. Given the correlational nature of these analyses, the findings are interpreted as indicating associations rather than directional or causal relationships.
Inclusive Values
The results presented in Table 2 are summarised for each of the three inclusive value statements.
Value 1: My ECE Service Values Cultural Diversity Within its Employees
Ratings showed strong agreement with Value 1. Overall, 68.5% of directors selected a rating of 5 (strongly agree). The overall mean score was 4.56 (SD = .82), with similar scores for CALD directors (M = 4.47; SD = .98), and non-CALD directors (M = 4.59; SD = .76). The t-test showed no significant difference between these two groups (t = −1.165 (166.40), p = .246). High levels of agreement were evident among both CALD directors (68.1% strongly agreed and 21.8% agreed) and non-CALD directors (68.7% strongly agreed and 25.6% agreed).
Directors commonly described culturally diverse workplaces as environments where diversity was respected, celebrated, and visible in everyday interactions. For example, one non-CALD director noted that “educators can be heard greeting one another in their 1st language” (Rating 5), while a CALD director described how the service celebrated “family and community events” with children and families (Rating 5).
While overall mean scores did not differ between CALD and non-CALD directors, a significant difference emerged in the distribution of ratings (χ2 (4) = 9.746, p = .045), particularly at the lower end of the scale. A higher proportion of CALD directors strongly disagreed (3.4%) or disagreed (4.2%) compared with non-CALD directors (1.9% and 0.5%). One CALD director who strongly disagreed argued that management teams should include more CALD employees who could “understand, support, and hear staff from CALD,” and criticised promotion practices favouring “native-to-English and white power” (Rating 1).
Value 2: A Culturally Diverse Workplace is Beneficial for all Stakeholders
Results showed strong agreement with Value 2 as reported by 72.2% of CALD directors and 73.8% of non-CALD directors, while a further 17.7% and 19.7%, respectively, selected “agree.” The overall mean score was 4.61 (SD = .81). CALD directors (M = 4.54; SD = .93) had a slightly lower mean rating than non-CALD directors (M = 4.63; SD = .77), but the t-test revealed no significant difference between the two groups (t = −.988 (174.37), p = .324).
The participant directors commonly described culturally diverse teams as valuable assets that strengthened connections with children, families, and communities. For example, one non-CALD director stated that having educators from CALD backgrounds was “highly beneficial” because their “connectedness to culture and ability to share this with our community is invaluable” (Rating 5). Similarly, a CALD director described the diverse team as “one of our greatest assets” because staff were “a wealth of knowledge” and reflective of the wider community (Rating 5).
Value 3: A Culturally Diverse Workplace has its Challenges
Value 3 had an overall mean rating of 3.57 (SD = 1.05), with similar ratings for CALD (M = 3.68; SD = 1.19) and non-CALD directors (M = 3.53; SD = 1.00), t = 1.191 (174.22), p = .235. However, there were differences in the distribution of ratings between CALD and non-CALD directors (χ2 (4) = 16.585, p = .002). Notably, the percentage of CALD directors who selected “strongly agree” (28.8%) was more than double the percentage of non-CALD directors (13.8%). A higher proportion of non-CALD directors selected “agree” (45.8%) compared to CALD directors (34.7%). A notable proportion of directors selected a rating of ‘neutral’ (17.8% CALD and 23.8% non-CALD), indicating some uncertainty or ambivalence about diversity-related challenges. At the lower end of the scale, 6% of CALD directors selected “strongly disagree” and 12.7% “disagree”, compared to 3.6% and 13% of non-CALD directors, respectively.
Directors identified several challenges associated with culturally diverse workplaces, particularly in relation to workplace equity, communication, and training requirements. For example, one non-CALD director described perceived inequities in leadership structures, stating that “very often the upper tier of management is white, and there is an obvious bias and sometimes outright racism toward CALD educators” (Rating 2). Another non-CALD director highlighted language and qualification barriers experienced by CALD educators, explaining that “literacy levels in English are barriers for these staff” and that one employee was unable to complete the Certificate III requirements despite support from leadership due to cultural and language-related challenges (Rating 5).
Inclusive Practices
Results presented in Table 3 report on CALD and non-CALD directors’ level of agreement with practices that promote opportunities for a culturally diverse workforce.
Practice 1: My ECE Service Invests Time, Energy, and Funds Into Building a Culturally Diverse Workforce
A total of 480 directors (118 CALD; 362 non-CALD) rated this practice, with an overall mean of 3.90 (SD=.98). Mean ratings were similar for CALD (M= 3.92; SD= 1.04) and non-CALD directors (M= 3.90; SD=.96) (t=.264 (184.79), p=.792). The chi-square test also revealed no significant difference (χ2(4) = 3.309, p=.507). A substantial proportion of both CALD (70.5%) and non-CALD directors (67.4%) strongly agreed and agreed that their workplace invests in building a culturally diverse workforce. A small proportion disagreed (9.2% CALD; 6.1% non-CALD), while 20.3% of CALD directors and 26.5% of non-CALD directors selected a neutral rating, indicating uncertainty about their service’s commitment to promoting diversity.
Directors who rated this practice positively described deliberate efforts to recruit staff from diverse cultural backgrounds. One non-CALD director noted that “over the past year, we have employed six new staff, five of whom are from a CALD background” (Rating 4), while another explained that “the workforce should represent the community” and reported that half of their 12 employees were CALD (non-CALD director, Rating 4). In contrast, lower ratings reflected concerns about limited diversity within some services, with one CALD director stating that “out of the 24 staff, I, the director, am the only CALD employee” (Rating 2).
Practice 2: The Process for Career Advancement Promotion is Transparent to all Employees
A total of 481 directors (119 CALD and 362 non-CALD) rated this practice statement, with a high level of agreement (53.6% strongly agree, 32.4% agree) and an overall mean of 4.34 (SD = .88). CALD and non-CALD directors gave similar ratings (M = 4.27; SD = 1.03; M = 4.36; SD = .82; t = −922 (169.60), p = .358) indicating consensus on career advancement transparency. Some differences were apparent in the distribution of ratings, with a marginally significant chi-square test (χ2 (4) = 8.064, p = .089). While a similar proportion of CALD and non-CALD directors rated strongly agree (55.5% vs. 53%), more CALD directors disagreed (4.2%) or strongly disagreed (3.4%) with the statement than non-CALD directors (1.1% and 1.4%).
Qualitative responses from participating directors revealed some tensions between reported transparency and workplace practices. For example, one non-CALD director who strongly agreed with the statement explained that they did not “seek out” CALD employees, but instead employed staff based on “their merit and how they will fit into our organisation” (Rating 5). Although the comment referred to recruitment, it suggests that assumptions about organisational “fit” may still influence decision-making and advancement opportunities despite reported transparency.
Practice 3: CALD Employees Have Equitable Opportunities to Advance Their Careers at my ECE Service
Ratings from 481 directors (118 CALD, 363 non-CALD) showed a strong consensus, with 63.6% selecting strongly agree and an overall mean of 4.50 (SD = .82) for both groups. Ratings were similar for CALD (M = 4.50; SD = .93) and non-CALD directors (M = 4.50, SD = .78), t = .014, (174.18), p = .494, χ2 (4) = 6.906, p = .141), indicating that CALD employees have equal career advancement opportunities.
Despite this overall consensus, one CALD director who strongly disagreed with the statement highlighted perceived inequities in promotion practices within the ECE sector, stating that “CALD staff work harder than everyone to keep up with native-English speakers. In contrast, native English-speaking staff work smart, not hard at all, and get promoted easily with fewer recruitment procedures” (Rating 1). This comment suggests that some CALD directors perceive unequal expectations and barriers to advancement despite generally positive ratings.
Inclusion Outcomes
Comparison of ECE Services led by CALD and non-CALD Directors Across Three Inclusion Outcomes
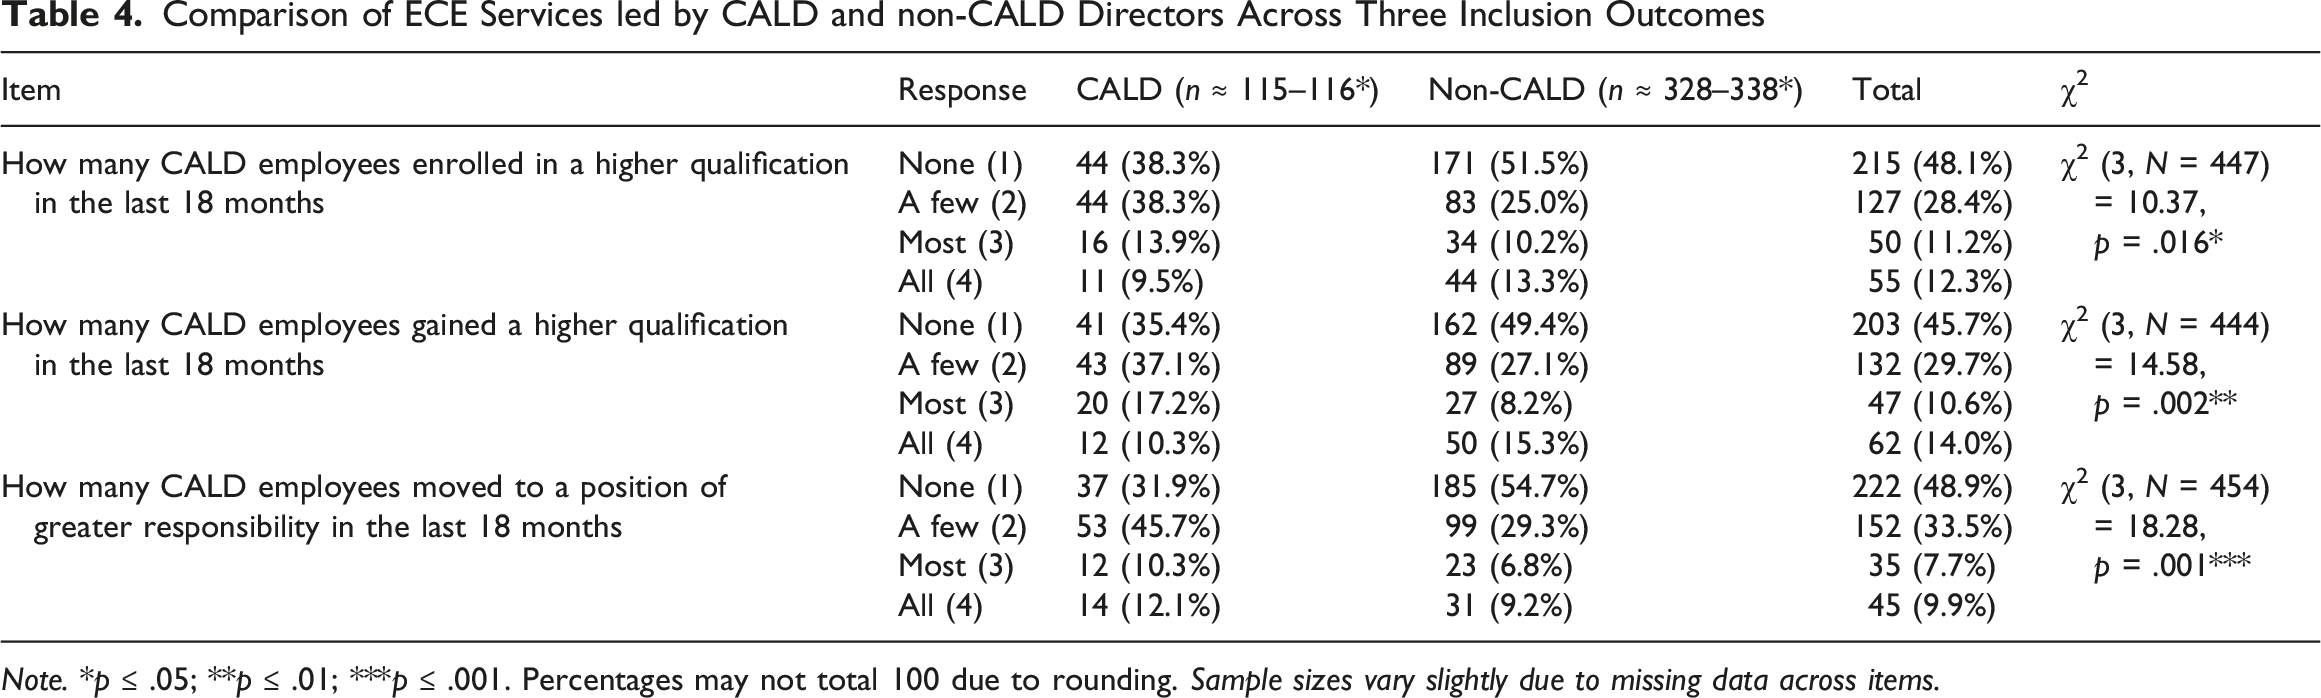
Note. *p ≤ .05; **p ≤ .01; ***p ≤ .001. Percentages may not total 100 due to rounding. Sample sizes vary slightly due to missing data across items.
Outcome 1: In the Past 18 Months, How Many of Your CALD Employees Have Been Supported to Enrol in a Higher Qualification Degree?
In total, 447 directors (115 CALD and 332 non-CALD) responded to this question. Results presented in Table 4 suggest an important difference in the proportion of CALD directors who selected ‘none’ (38.3%) compared with non-CALD directors (51.5%); (χ2 (3) = 10.37, p = .016).
Directors’ comments reflected both training-related barriers and differing levels of interest in further study among CALD employees. One non-CALD director argued that “many private training organisations do not support CALD students appropriately” and that “more support is needed to ensure that training organisations have CALD trainers.” In contrast, another non-CALD director reported that some “CALD team members have expressed a disinterest in gaining higher qualifications or attaining positions of higher responsibility.”
Outcome 2: In the Past 18 Months, How Many of Your CALD Employees Have Been Supported to Gain a Higher Qualification?
CALD directors reported lower proportions for “none” (35.4%) compared with non-CALD directors (49.4%). CALD directors also reported higher proportions than non-CALD directors for “most” (17.2% vs. 8.2%) and ‘a few’ (37.1% vs. 27.1%); χ2 (3) = 10.37, p = .016.
Directors’ comments highlighted the support required for CALD employees to complete qualifications, particularly in navigating academic demands and language-related barriers. One non-CALD director explained that they had “helped her with the last assignment” and “discussed the issue with TAFE due to language difficulties,” adding that “CALD people are very good workers, but are challenged with the required admin work.”
Other directors emphasised the persistence and investment needed to achieve positive outcomes. For example, one non-CALD director argued that “many private training organisations do not support CALD students appropriately” and that “more support is needed to ensure that training organisations have CALD trainers.” Similarly, a CALD director explained that “the preschool has paid for the majority of the study costs” to support two educators upgrading their qualifications, noting that “the results have been well worth it.”
Outcome 3: In the Past 18 Months, How Many of Your CALD Employees Have Been Supported to Move to a Position of Greater Responsibility?
A total of 454 directors (116 CALD and 338 non-CALD) answered this question. The significant chi-square test (χ2 (3) = 18.28, p = .001) highlighted the disparity in promotion opportunities for CALD employees. Again, ‘none’ was reported by a lower percentage (31.9%) of CALD directors than non-CALD directors (54.7%). One CALD director explained that “four educators were supported to gain their Diploma,” with three later promoted to second-in-charge positions and one CALD educator promoted to a team leader role.
Overall, the survey findings were consistent across all three inclusion outcomes, suggesting that services led by CALD directors reported stronger outcomes for CALD employees’ professional development and career advancement.
Discussion
This national study examined CALD and non-CALD directors’ values, practices, and inclusion outcomes in the Australian ECE workforce. The findings revealed similarities and distinctions in how culturally diverse leaders/leadership may shape inclusive workplace practices.
Approximately one quarter of respondents identified as CALD, consistent with previous research (Arndt & Bartholomaeus, 2022). CALD and non-CALD directors reported comparable qualifications, suggesting parity in formal preparation. However, CALD directors more commonly reported shorter time in the sector or current role, whereas non-CALD directors more frequently reported longer tenure. Although the survey did not explore reasons for these patterns, the findings may reflect broader workforce dynamics and warrant further investigation.
Both CALD and non-CALD directors strongly endorsed cultural diversity. However, differences emerged in perceptions of its implications. CALD directors were more likely than non-CALD directors to strongly agree that diversity presents challenges (Value 3), with significant differences across rating distributions. These findings align with research indicating that, although diversity is widely valued, challenges related to communication, workload, and cultural expectations can affect workplace implementation (Nuttall, Henderson, et al., 2022; White, 2023). The findings also reflect principles of culturally responsive leadership (Lee et al., 2025), suggesting that leaders with shared cultural or linguistic experiences may be more attuned to the needs of CALD staff.
The findings further suggest a gap between policy commitments to diversity and everyday practice. Although directors generally agreed that their services value diversity and promote equity, the high proportion of neutral responses indicates that inclusive practices are implemented inconsistently across settings. This aligns with research showing that inclusion is widely endorsed but unevenly enacted due to organisational culture, policy discourses, and leadership differences (Nuttall, Henderson, et al., 2022).
Variation was also evident in perceptions of fair promotion opportunities. Although most directors viewed promotion practices as equitable, CALD directors were slightly more likely to disagree, potentially reflecting greater awareness of barriers affecting CALD educators’ career progression. However, the survey design did not examine underlying organisational mechanisms.
The most notable differences between CALD and non-CALD leadership were evident in inclusion outcomes, including support for qualifications and promotion. Across all three outcomes, CALD educators were more likely to receive support in CALD-led services. These findings suggest that leaders with shared cultural, linguistic, or migrant experiences may be more responsive to the professional needs of CALD educators and more capable of identifying barriers to participation and advancement. Leadership diversity may therefore influence not only symbolic inclusion but also access to professional opportunities and workplace support.
These findings underscore the importance of culturally responsive leadership and support calls for greater CALD representation in leadership positions within the ECE sector (Lee et al., 2025). Together, the results suggest that increasing CALD representation in leadership may strengthen workforce inclusion and contribute to more equitable professional environments across Australian ECE services.
Limitations
The absence of comprehensive national data on the CALD composition of the ECE workforce limited benchmarking and assessment of sample representativeness. The low response rate (4.6%) may introduce non-response bias and constrain generalisability. Although the final sample (n = 502) included services across all states and territories and both LDC and PS settings, it may not fully represent the national workforce.
The exclusion of other service types, such as Family Day Care and Outside School Hours Care, further limits the applicability of findings. Reliance on self-reported measures may also introduce social desirability bias, although reporting outcomes as proportions of CALD staff provided more concrete indicators.
The survey captured a targeted subset of culturally inclusive leadership (values, practices, and outcomes), leaving areas such as belonging, recognition, discrimination, and equity underexplored. Future research should expand the conceptual scope of inclusiveness and include other service types. Mixed-methods approaches such as interviews, focus groups, or observations could also be used to triangulate findings and reduce reliance on self-reported data.
Conclusion
This study examined directors’ perspectives on inclusive values, practices, and outcomes in the Australian ECE workforce. While CALD and non-CALD directors generally valued cultural diversity and inclusive practice, CALD directors reported higher levels of support for CALD educators’ professional development and advancement, highlighting the role of culturally inclusive leadership. However, they also reported gaps between stated commitments and actual practice, greater diversity-related challenges, and shorter tenure, which suggest potential barriers to retention and progression. Although non-CALD directors recognised the value of diversity, the stronger outcomes in CALD-led services suggest shared cultural experiences may enhance inclusive practices. Despite its limitations, this study offers insights into leadership diversity and workforce inclusion in Australian ECE.
Policy implications include targeted initiatives to address language barriers, system navigation, and unconscious bias while recognising CALD educators’ cultural identities. Moving beyond pay parity toward equitable practices is essential. Overall, the findings highlight the importance of leadership diversity in shaping inclusive ECE workplaces and supporting CALD educators.
Footnotes
Acknowledgements
The authors gratefully acknowledge the early childhood education services and directors who generously participated in this study.

Ethical Considerations
Ethics approval for this research was granted by the Macquarie University Human Research Ethics Committee (Approval No. 520221079837039).
Consent to Participate
Informed consent was obtained from all participants.
Funding
The authors received no financial support for the research, authorship, and/or publication of this article.
Any Other Identifying Information
No additional identifying information related to the authors, their institutions, funders, or approval committees is included elsewhere in the manuscript to ensure anonymity during the peer review process.
Declaration of Conflicting Interests
The authors declared no potential conflicts of interest with respect to the research, authorship, and/or publication of this article.
Data Availability Statement
Due to the sensitive and potentially identifiable nature of the data, and the conditions of ethics approval, the datasets generated and analysed during this study are not publicly available