
Abstract
Unlike large companies that often have the means and resources for e-fulfillment process with automation, Small and Medium-sized Enterprises (SMEs) encounter challenges in fulfilling the massive orders as they rely on manual operation. While many existing researchers have explored e-fulfillment process enhancement solely, a lack of research regarding process synchronization. E-fulfillment processes are interconnected, suboptimal inventory management will lead to longer order-picking time, as warehouse workers might waste time looking for misplaced items. This has led to a growing shift toward a holistic approach that aims to synchronize e-fulfillment processes for better efficiency. This study introduces an Intelligent E-Fulfillment Synchronization Model (IEFSM). The novelty is Inbound-Inbound synchronization in e-fulfillment processes, through coordinated sequential optimization with closed-loop feedback. It employs Artificial Intelligence (AI) and Augmented Reality (AR) technology to improve the processes of product information preparation, inventory management, and order picking as a holistic framework. The proposed generate attractive product descriptions with the aid of AI. Statistical methods and rule-based calculations are adopted for pricing recommendations and inventory optimization. AR provides real-time support in order picking. A pilot case study demonstrates 88% operational time savings, 9% sales growth, 88% fewer unresolved shortages, 100% picking accuracy and 70% order picking time reduction.
Keywords
1. Introduction
The expansion of e-commerce worldwide has shifted consumer purchasing behavior from traditional stores to online shopping, primarily due to the convenience e-commerce provides.1,2 While e-commerce expansion has increased sales, it presents significant challenges for e-fulfillment centers that must handle growing order volumes and ensure timely delivery.3,4 Moreover, e-commerce orders often come in small lot sizes with unpredictable arrival patterns, further increasing the pressure of the e-fulfillment centers. 5 In most e-commerce operations, human workers still perform manual data entry, distribution planning, and warehouse scheduling, which remain labor-intensive and error-prone. 6
To enhance e-fulfillment efficiency, many emerging technologies are examined by researchers including Artificial Intelligence (AI), Machine Learning (ML), and Mixed Reality (XR). 7 However, previous research always focuses on optimizing e-fulfillment operations in isolation. This approach often overlooks the interconnections between different e-fulfillment processes. Overlooking these interconnections may impact performance across the entire fulfillment system. A more holistic approach is necessary to recognize the interconnected nature of e-fulfillment processes to increase efficiency. To resolve the inefficiencies caused by isolated decision-making, this study is grounded in the Total Fulfillment Management (TFM) paradigm, 8 a framework designed to break down the silos through end-to-end synchronization.
This research study helps in the synchronization of product information management, inventory management, and order picking. Businesses routinely rely on product information management to set the pricing and product description. Product information management according to customer preference could increase customer purchase intention which in turn increase product demand. Due to customer’s expectations for fast order delivery, e-fulfilment centre’s inventory must be capable of that. Thus, it is essential to manage inventory properly so that required item always remains available for order picking and assists in preventing stockout as well as overstock. When it comes to e-fulfillment processes, order picking is a labour-intensive and expensive task estimated to account for 55% of the total costs. 9 Furthermore, order picking influences delivery quality, thereby affecting overall customer satisfaction. As these three e-fulfillment processes are connected, the performance of one process would affect the next, thus a synchronization approach is crucial for enhancing the overall e-fulfillment performance. While the majority of previous studies have focus solely on enhancing the e-fulfilment process, a few recent studies have considered the synchronization among processes. Leung et al., 10 employed a combination of digital twin technology, ML algorithms, and the Internet of Things, to optimize order fulfillment and replenishment. Cordeau et al., 11 proposed a mathematical model as well as a simulation-based method to improve how storage spaces are assigned for products that human workers move using vehicles in warehouse aisles. These studies show the research potential to adapt the concepts of process synchronization in e-fulfillment context.
Unlike existing frameworks that primarily focus on aligning warehousing with downstream transportation (Inbound-Outbound synchronization), a critical research gap remains in the upstream “Inbound-Inbound” synchronization, specifically, the disconnect between commercial strategy and operational execution. To address this, this study extends the “Inbound-Inbound” alignment to synchronize the generation of product information directly with inventory storage and order picking. This approach ensures that the demand created by AI-enhanced descriptions is immediately matched by warehouse readiness, unifying demand generation and fulfillment into a single, responsive workflow.
This study focuses on the operation of manual warehouses in Hong Kong, where the operational landscape is dominated by Small and Medium-sized Enterprises (SMEs). These SMEs usually operate from a rented warehouse with limited space and tend to focus on flexibility over automation.
12
This study recognizes the challenges faced by SMEs, and it adopts a new path to study the coordination of product information customisation, inventory management, and order picking processes in e-fulfilment. This study promotes the synchronization strategies of the Intelligent E-Fulfillment Synchronization Model (IEFSM). The IEFSM employs AI and Augmented Reality (AR) technology to improve the processes of product information, inventory management, and order picking as a holistic framework. AI is utilized to provide recommendations for product descriptions and prices to manage product information in a better way which helps businesses to predict and manage customers.13,14 Additionally, AI assists in analyzing how the suggested description and pricing would impact the product demand. By strategically managing the inventory, overstocking or stockouts can be prevented with a more effective order picking process. The AR technology in IEFSM continues to assist the pickers in real-time, in conjunction with inventory optimum allocation, and minimization of picking error and picking time. In essence, this study offers three key contributions: 1. This research proposes the IEFSM model, a holistic approach to e-fulfillment that addresses the limitations of isolated process optimization. 2. It demonstrates how integrating AI and AR with statistical methods and rule-based calculations can enhance e-fulfillment processes synchronization through coordinated sequential optimization with closed-loop feedback, offering insights for engineering managers. 3. A pilot case study is conducted to demonstrate the potential impact of implementing the IEFSM model in a practical environment.
The remainder of this paper is organized as follows. The literature review on synchronization of e-fulfilment processes (such as product information management, inventory management optimization, and order-picking enhancement) is discussed in Section 2. The design of the proposed IEFSM that focuses on synchronizing the mentioned e-fulfilment processes is illustrated in Section 3. Section 4 features a case study to examine the performance of the IEFSM in practice, while result and findings derived from the case study are discussed in Section 5. Section 6 concludes with a summary of insights and implications.
2. Related literature
This section outlines the key challenges faced in the manual e-fulfillment process, with a focus on synchronization strategies for inventory management and order picking. The literature review covers product information management, inventory management optimization, and order picking streamlining. It also points out critical research gaps in the manual e-fulfillment warehouse.
A. Key components of e-fulfillment processes
The essential components of e-fulfillment include webpage quality, customization strategy, distribution strategy, last-mile delivery, and return management.15,16 An overview of e-fulfillment processes along with performance indicators is shown in Figure 1. The process starts with exploring the website, in which a user-friendly interface can offer effortless navigation to customer. A sufficient website design improves customer experience by providing easy access to product information, accompanied by smooth transactions, reasonable response time, and safe payment options.
17
Strategies for customisation include product descriptions, pricing, and recommendations that all algin with consumer interest.
18
Recent advances in metaverse e-commerce further leverage intelligent group recommendation systems that analyze collective user behaviors to deliver personalized suggestions, enhancing retail experiences and decision-making.
19
Distribution strategies help in determining how the products will be transported from the warehouse to the customers. There are several warehouse operations that include receiving goods, inventory management, picking and packing of an order.
5
Strategies that look to improve internal processes with the aim of reducing operational costs and increasing service levels. After the products have been picked and packed, the final stage is the last-mile delivery. This phase is the final part of the delivery to the consumer, along with transport management, freight, shipping, and logistics.
20
At this stage, it is significant that damage could happen due to poor packaging, rough handling of the goods, and the unfavourable nature of the environment. It is especially important in cold-chain logistics service which delivering temperature-sensitive goods that require special handling, like fresh produce, seafood, dairy, meat, pharmaceuticals, and vaccines.
21
Product returns will occur if products arrive in unacceptable condition, suggesting the need for effective return management.
22
A streamlined return process is vital to customer satisfaction and loyalty, which involves clear return policies, easy-to-follow return procedures, and quick processing of returned items. Overview of e-fulfillment processes.
While these components provide a comprehensive framework for e-fulfillment, a key limitation lies in their siloed optimization, where webpage and customization decisions often fail to synchronize with distribution operations like inventory and picking. This disconnect can lead to mismatched demand signals and operational bottlenecks, underscoring the need for integrated synchronization across stages to ensure real-time alignment between customer-facing strategies and warehouse execution.
B. Managing product information and the effect on demand forecasting
Pricing and personalized product descriptions are two significant components of product information management. Product descriptions express the core of a product, including what it is, how to use it, and why one should buy it. It creates awareness among consumer and provides an in-depth understanding of a product. Consumers are not likely to show interest or desire unless they understand products. This stalls any further engagement from happening. 23 Product descriptions enable customers to easily identify attractively priced options using familiar language and knowledge. This elevates their understanding of the products. 24 Personalized product descriptions dismantle barriers and forge a connection between sellers and buyers that amplifies the probability of favorable purchase outcomes. 25 Traditionally, engineering managers generate product descriptions based on their own expertise. Technological advancements have encouraged researchers to use AI. As a result, recent research has proposed AI-driven approaches to generate product descriptions, display products’ unique attributes, and guide customers toward informed purchasing decisions. 26 Novgorodov et al. 27 explore ML models to extract sentences from user reviews to generate product descriptions. This process begins with rule-based filtering with consideration of prior analysis, followed by a supervised approach that discerns suitable content to craft compelling product descriptions. Meanwhile, Nadamoto et al., 28 use deep learning to generate product descriptions for sofas based on data collected from 36 furniture e-commerce companies. This novel approach capitalizes on the information from these platforms and produces engaging product descriptions to captivate customer attention. Although AI has been widely used to improve product descriptions, few studies explore its effect on demand forecasting. For example, Chen et al. 29 develop an AI framework combining WaveNet neural networks and multiple regression to assess how product descriptions influence sales predictions. Using nearly 200,000 sales records from a cross-border e-commerce firm, they find that approximately 44% of the key descriptive phrases have a strong influence on forecasting outcomes, and incorporating these key phrases into forecasting models notably enhances prediction accuracy.
Other than personalized product descriptions, pricing strategies also contribute to product information management as they attract more customers to maximize sales revenue. Dynamic pricing models are frameworks that adjust the prices for products and services depending on market demand and consumer choices. Businesses can remain competitive and increase their profit through these models. Data analytics and ML are recently popular for developing such pricing strategies. Mamoudan et al. 30 present pricing strategies in a food supply chain that utilizes ML for data cleansing, normalization, and restructuring. To identify competitors’ prices, they use historical data and apply game theory model to determine optimal pricing activities. This helps companies make informed pricing decisions to enhance their competitiveness. Gayam et al. 31 studied reinforcement learning framework modifications on prices of products dynamically according to demand, competitor prices, customer behaviour and inventory levels. Few studies extend AI-based pricing research to examine how AI-driven price optimization influences demand forecasting. Lee et al. 32 develop an AI-driven framework that integrates price optimization with demand forecasting, where demand prediction accounts for various combinations of product price changes and employs machine learning methods to identify the best forecast for each product. Real-world transaction data demonstrate that the proposed AI system enhances pricing efficiency and overall profitability.
Studies show that AI-driven updates to product information can significantly improve demand forecasting accuracy. This enhanced forecasting provides valuable insights for optimizing inventory management to achieve optimal inventory and minimize overstocking or understocking. 33
C. Optimizing inventory management
Inventory management is an e-fulfilment process which looks at replenishing the inventory with regard to minimizing the cost of overstocking or stockout. 34 Running low on safety stock affects customer satisfaction as customers either face longer delivery time or the company fails to fulfill their demand. However, maintaining an excessive amount of stock may lead to incurring high storage costs. Moreover, inventory management would be disrupted by market manipulation, price increases, easier online purchasing, delayed deliveries, and supply shortages. 35 Practitioners have always managed the inventory in a traditional way based on their expertise, manual collection of data and analysis of the data. This methodology may lead to errors that make it tough to make the right decisions and understand inventory status in real-time. 36 To address these challenges, a need exists among businesses to change their inventory management strategies to more flexible and data-driven approaches that enhance their reaction to e-commerce market changes.
Qi et al. 37 explore a multi-period inventory replenishment problem, which is characterized by demand uncertainty and vendor lead time variability. Diverging from the conventional two-step Predict-Then-Optimize (PTO) framework, they propose a one-step end-to-end model. Such a model employs deep learning to directly generate suggested replenishment quantities from input features, eliminating unnecessary intermediate steps and streamlining the process. Rizqi, & Khairunisa 38 integrate the Min-Max method, a deterministic approach for determining inventory levels, with Monte Carlo simulation, a probabilistic technique for evaluating stockout and overstock occurrences. 39 Their findings indicate that the company successfully eliminated stockouts for one month, while overstock levels decreased by 0.42% compared to the actual system. Furthermore, Long et al. 40 proposed an intelligent decision support system that links pricing strategies with inventory control. Their model uses price as a control factor to optimize the inventory levels of perishable products under stochastic conditions, validating the necessity of synchronizing commercial decisions with inventory operations.
These studies highlight that the adoption of AI significantly enhances efficiency in inventory management, which would also effectively prevent order-picking inefficiencies, as these two processes are highly interconnected. Effective inventory management ensures optimal stock levels which directly supports picking efficiency by maintaining organized warehouse layouts, reducing search times for items, and minimizing travel distances for pickers. When inventory is accurately tracked and positioned based on demand patterns, order fulfillment becomes faster and less error-prone, as workers encounter fewer out-of-stock situations or misplaced goods that cause delays and rework.
D. Improving order picking
The pick order identifies what items, how many of each, and which location that the items should be extracted from. The order picker then moves to assigned storage locations to locate and pick the items required. This process contains the time of travel, time of search, and time of pick. 41 When orders are divided into different zones or batches, required items would first be sorted, consolidated, packed and then shipped which increases the time taken for picking. Efficient management of this process is very important so that the order-picking performance can be optimized to ensure fast deliveries to customers. Most studies optimize travel distance or picking time, with some addressing tardiness or task assignment fairness. 42 Increasingly, research leverages AI, ML, and XR technologies to enhance picking performance. Various enterprises are showing interest in such technologies to increase the efficiency and accuracy of the order-picking process.
Fang & An 43 developed an AR application specifically for human order picking in warehouses. The solution aims to guide workers while they perform picking tasks. To provide effective visual guidance tailored to the workplace, this solution reduces the time required to locate and identify products, leading to lower picking time. In addition to visual support through AR, other studies have focused on optimizing the routing of the picking. Masae et al. 39 consider optimizing picker routing in the Chevron warehouse. The authors propose an algorithm grounded by a dynamic programming procedure for optimal routing. This approach minimizes the costs associated with order picking. Similarly, Lesch et al. 44 investigated the interaction between storage assignment and order picking in mezzanine warehouses. By using multi-objective evolutionary algorithms, they demonstrated that optimizing these two processes jointly, rather than in isolation, improves operational efficiency metrics significantly.
Despite these technological advances, a major limitation is the lack of synchronization between processes of demand forecasting, inventory management, and picking operations. This disconnection will lead to suboptimal routes, misplaced items, or batching inefficiencies. Therefore, integrated systems are needed to synchronize pick orders with live inventory data and demand signals to enable dynamic routing and reduce overall fulfillment delays.
E. The need for synchronization in e-fulfillment process
Existing research enhances the e-fulfillment through the application of emerging technologies in specific e-fulfillment process, but the interconnections between processes are overlooked. 40 This gap highlights the need for a more integrated approach that considers how each e-fulfillment process interacts with each other. There has been a growing interest among researchers to integrate two or more processes into a synchronized approach within e-fulfillment. 45 For instance, Long et al. 40 combine the Particle Swarm Optimization (PSO) approach with the Hamilton–Jacobi–Bellman (HJB) equation to derive an optimal dynamic pricing strategy within specific constraints. The proposed methodologies use pricing strategies to enhance the accuracy and efficiency of inventory management. Ardjmand et al. 46 present a novel hybrid approach to combine Genetic Algorithms (GA), column generation, and Artificial Neural Networks (ANN) to address the makespan optimization problem in manual order picking. This innovative approach optimizes order batching, batch assignment, and picker routing to balance workload. The above two research have demonstrated the benefits of the synchronization of e-fulfillment processes. Research has also extended to the interface between warehousing and transportation (Inbound-Outbound synchronization). For instance, Shavaki & Jolai 47 proposed a rule-based heuristic to synchronize order batching with delivery planning, ensuring that internal picking schedules align with external transportation requirements.
However, this addresses only the downstream connection. A research gap remains in the upstream “Inbound-Inbound” synchronization, specifically, the disconnect between the demand generation (product information) and demand fulfillment (inventory and picking). Guided by the TFM paradigm, 8 this study addresses this gap by implementing “Inbound-Inbound” horizontal synchronization. This approach moves beyond isolated optimizations to integrate product information management with inventory management and order-picking workflows, creating a cohesive, synchronized system.
3. Methodology
This study is grounded in the TFM paradigm proposed by Leung (2025). 8 While Leung characterized the “Inbound-Inbound” synchronization as the coordination of physical warehouse tasks like receiving and put-away, this study extends the definition to bridge commercial strategy and execution. In this study, the “Inbound-Inbound” synchronization is extended to encompass the real-time alignment of upstream information inputs (product description and pricing) with internal warehouse operations (inventory and order picking). This unifies demand generation and demand fulfillment into a single and synchronized workflow.
To realize the “Inbound-Inbound” horizontal synchronization, the IEFSM consists of three interconnected modules. These modules bridge the gap between information management and physical execution.
A. Product description module
The module helps in making decision on product description and pricing. Information concerning the details of a product being sold on e-commerce websites. These descriptions can describe the features, specifications, and benefits of the product that can encourage a purchase. This research utilizes the Transformer model to produce recommendations about product descriptions. The Transformer architecture was selected over simpler sequential models, such as Recurrent Neural Networks (RNNs) or Long Short-Term Memory (LSTM) networks, due to its superior ability to handle long-range dependencies via the self-attention mechanism. 48 In the context of “Inbound-Inbound” synchronization, the goal is not merely to generate readable text, but to create persuasive, attribute-rich descriptions that effectively generate customer demand. RNNs often struggle to retain context over long sequences, leading to repetitive or generic descriptions that fail to convert interest into sales. By utilizing a Transformer, the model can process the Attribute (A), Knowledge (I), and Title (T) components in parallel, ensuring that critical marketing keywords are seamlessly integrated with factual product specifications. This high-quality “demand generation” is the prerequisite trigger for the subsequent inventory and picking synchronization.

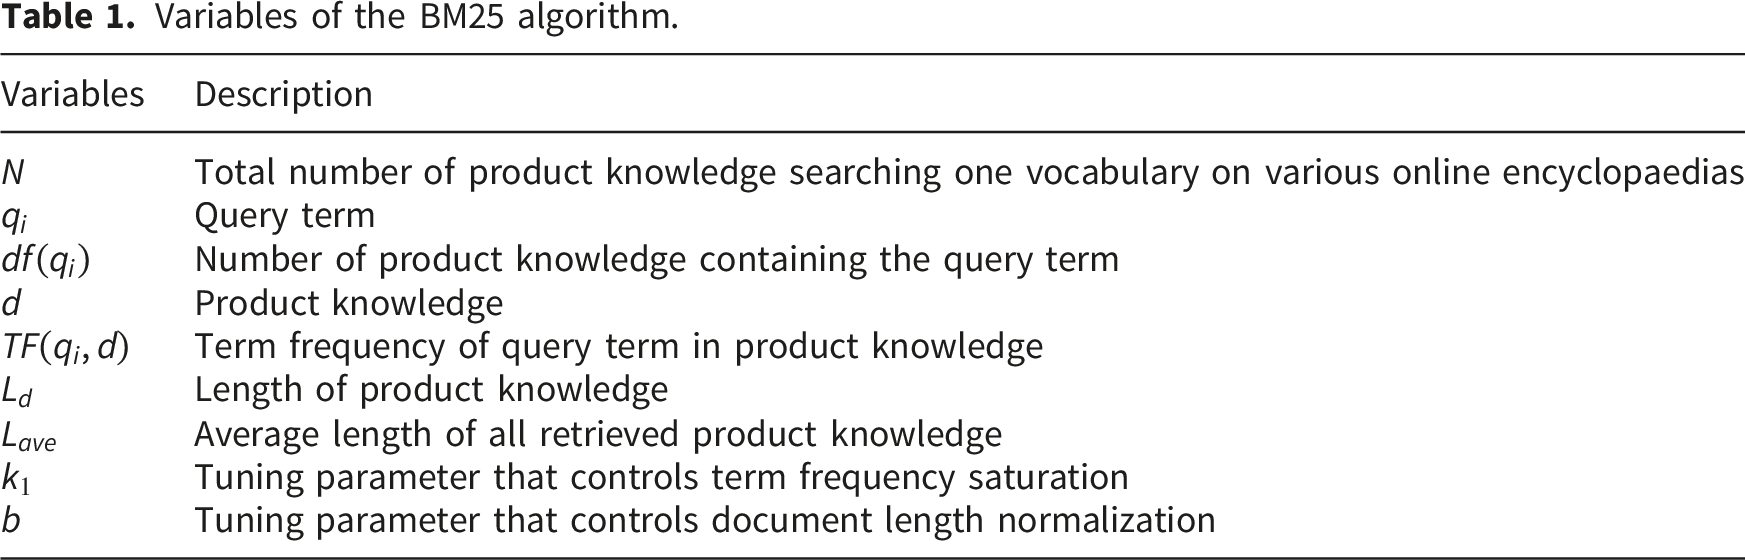
Variables of the BM25 algorithm.
Variables of BertTokenizer.
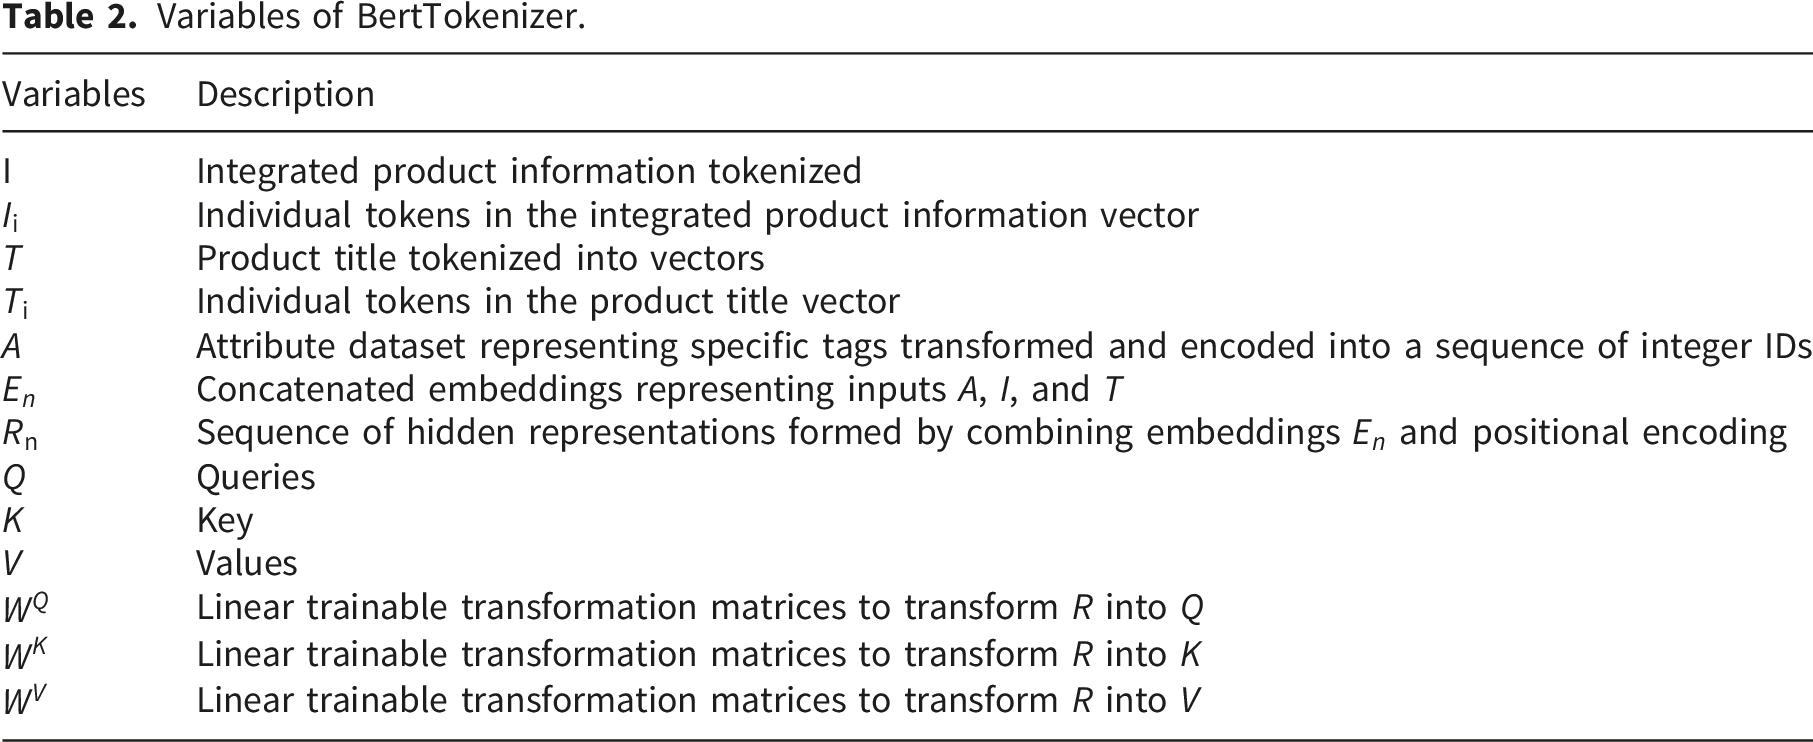
The product title’s dataset is tokenized into the vector using the BertTokenizer with Bert-Base-Chinese and is provided as part of the input to the encoder of the Transformer model denoted as T = (
Afterwards, Q, K, and V are split into multiple attention heads, denoted by 
Eq. (4) describes the Multi-Head Self-Attention mechanism, where 
The Multi-Head Self-Attention mechanism’s output, denoted as M, is subsequently supplied into the FFN. While Eqs. (2)–(4) represent the standard mathematical foundation of the Transformer, their application in this study is specifically operationalized to synchronize heterogeneous data inputs. In this specific context, the Multi-Head Self-Attention mechanism dynamically weighs the importance of the Attribute dataset (A) against the Integrated product information (I). For instance, the attention scores calculated in Eq. (3) determine whether a “luxury” tag (from A) should receive higher variance weights than a factual technical specification (from I) to maximize customer appeal. This configuration allows the IEFSM to convert raw upstream data into a finalized commercial output that effectively drives downstream inventory requirements.
According to Eq. (5), it consists of a non-linear activation function that is positioned between two linear transformations. 
B. Product pricing recommendation module
This module relies on statistical methods and operates as a rule-based decision support system. While algorithms are employed to scrape and analyze real-time competitor data and market trends to establish the baseline market price (
The balanced pricing strategy takes into account the cost of the product, profit margins, and commission rates from e-commerce platforms. It aims to ensure that the suggested price not only covers costs but also meets user-defined profit expectations. If the profit margin calculated by current price (
C. Inventory management recommendation module
Inventory management is intricately linked to the process of managing product information. The tailored product description and pricing recommendation can attract customers to purchase more. As demand rises, inventory management is essential in ensuring stock levels are sufficient to meet customer needs. This study proposes the use of statistical methods and rule-based calculations in suggesting the actions of inventory management, with consideration of demand forecast. Equation (8) employs exponential smoothing with sales velocity adjustment for demand forecasting. Here,
In the details process, a product is flagged as “low inventory” on platform I if its current inventory level 

It should be noted that the proposed replenishment strategy (Eq. 10–12) relies on simplifying assumptions designed specifically for the operational context of the case study SME. The model assumes a deterministic inventory transfer process between designated internal locations or affiliated platforms (e.g., from Warehouse B to Warehouse A). It does not currently account for simultaneous stockouts, stochastic lead times, or dynamic inventory routing across complex, multi-channel distribution networks. These constraints were adopted to ensure immediate, practical deployability within the existing IT infrastructure of SMEs.
Once a product is identified as low in inventory, the required restock quantity 
To fulfill the restock requirement, the available inventory on other platforms is checked for inventory transfer. The quantity transferred 
After transferring inventory, update the new inventory level 
D. AR-based order picking process module
As inventory levels change through the inventory management module, the order-picking process must adapt accordingly to ensure efficiency and accuracy in fulfilling customer orders. AR technologies, such as pick-by-vision systems, enhance the order-picking experience by providing visual cues and real-time information directly to pickers. This support allows workers to quickly locate items and understand their picking routes. The proposed architecture for the AR-based order-picking is illustrated in Figure 2. Proposed Architecture of AR-based order picking process.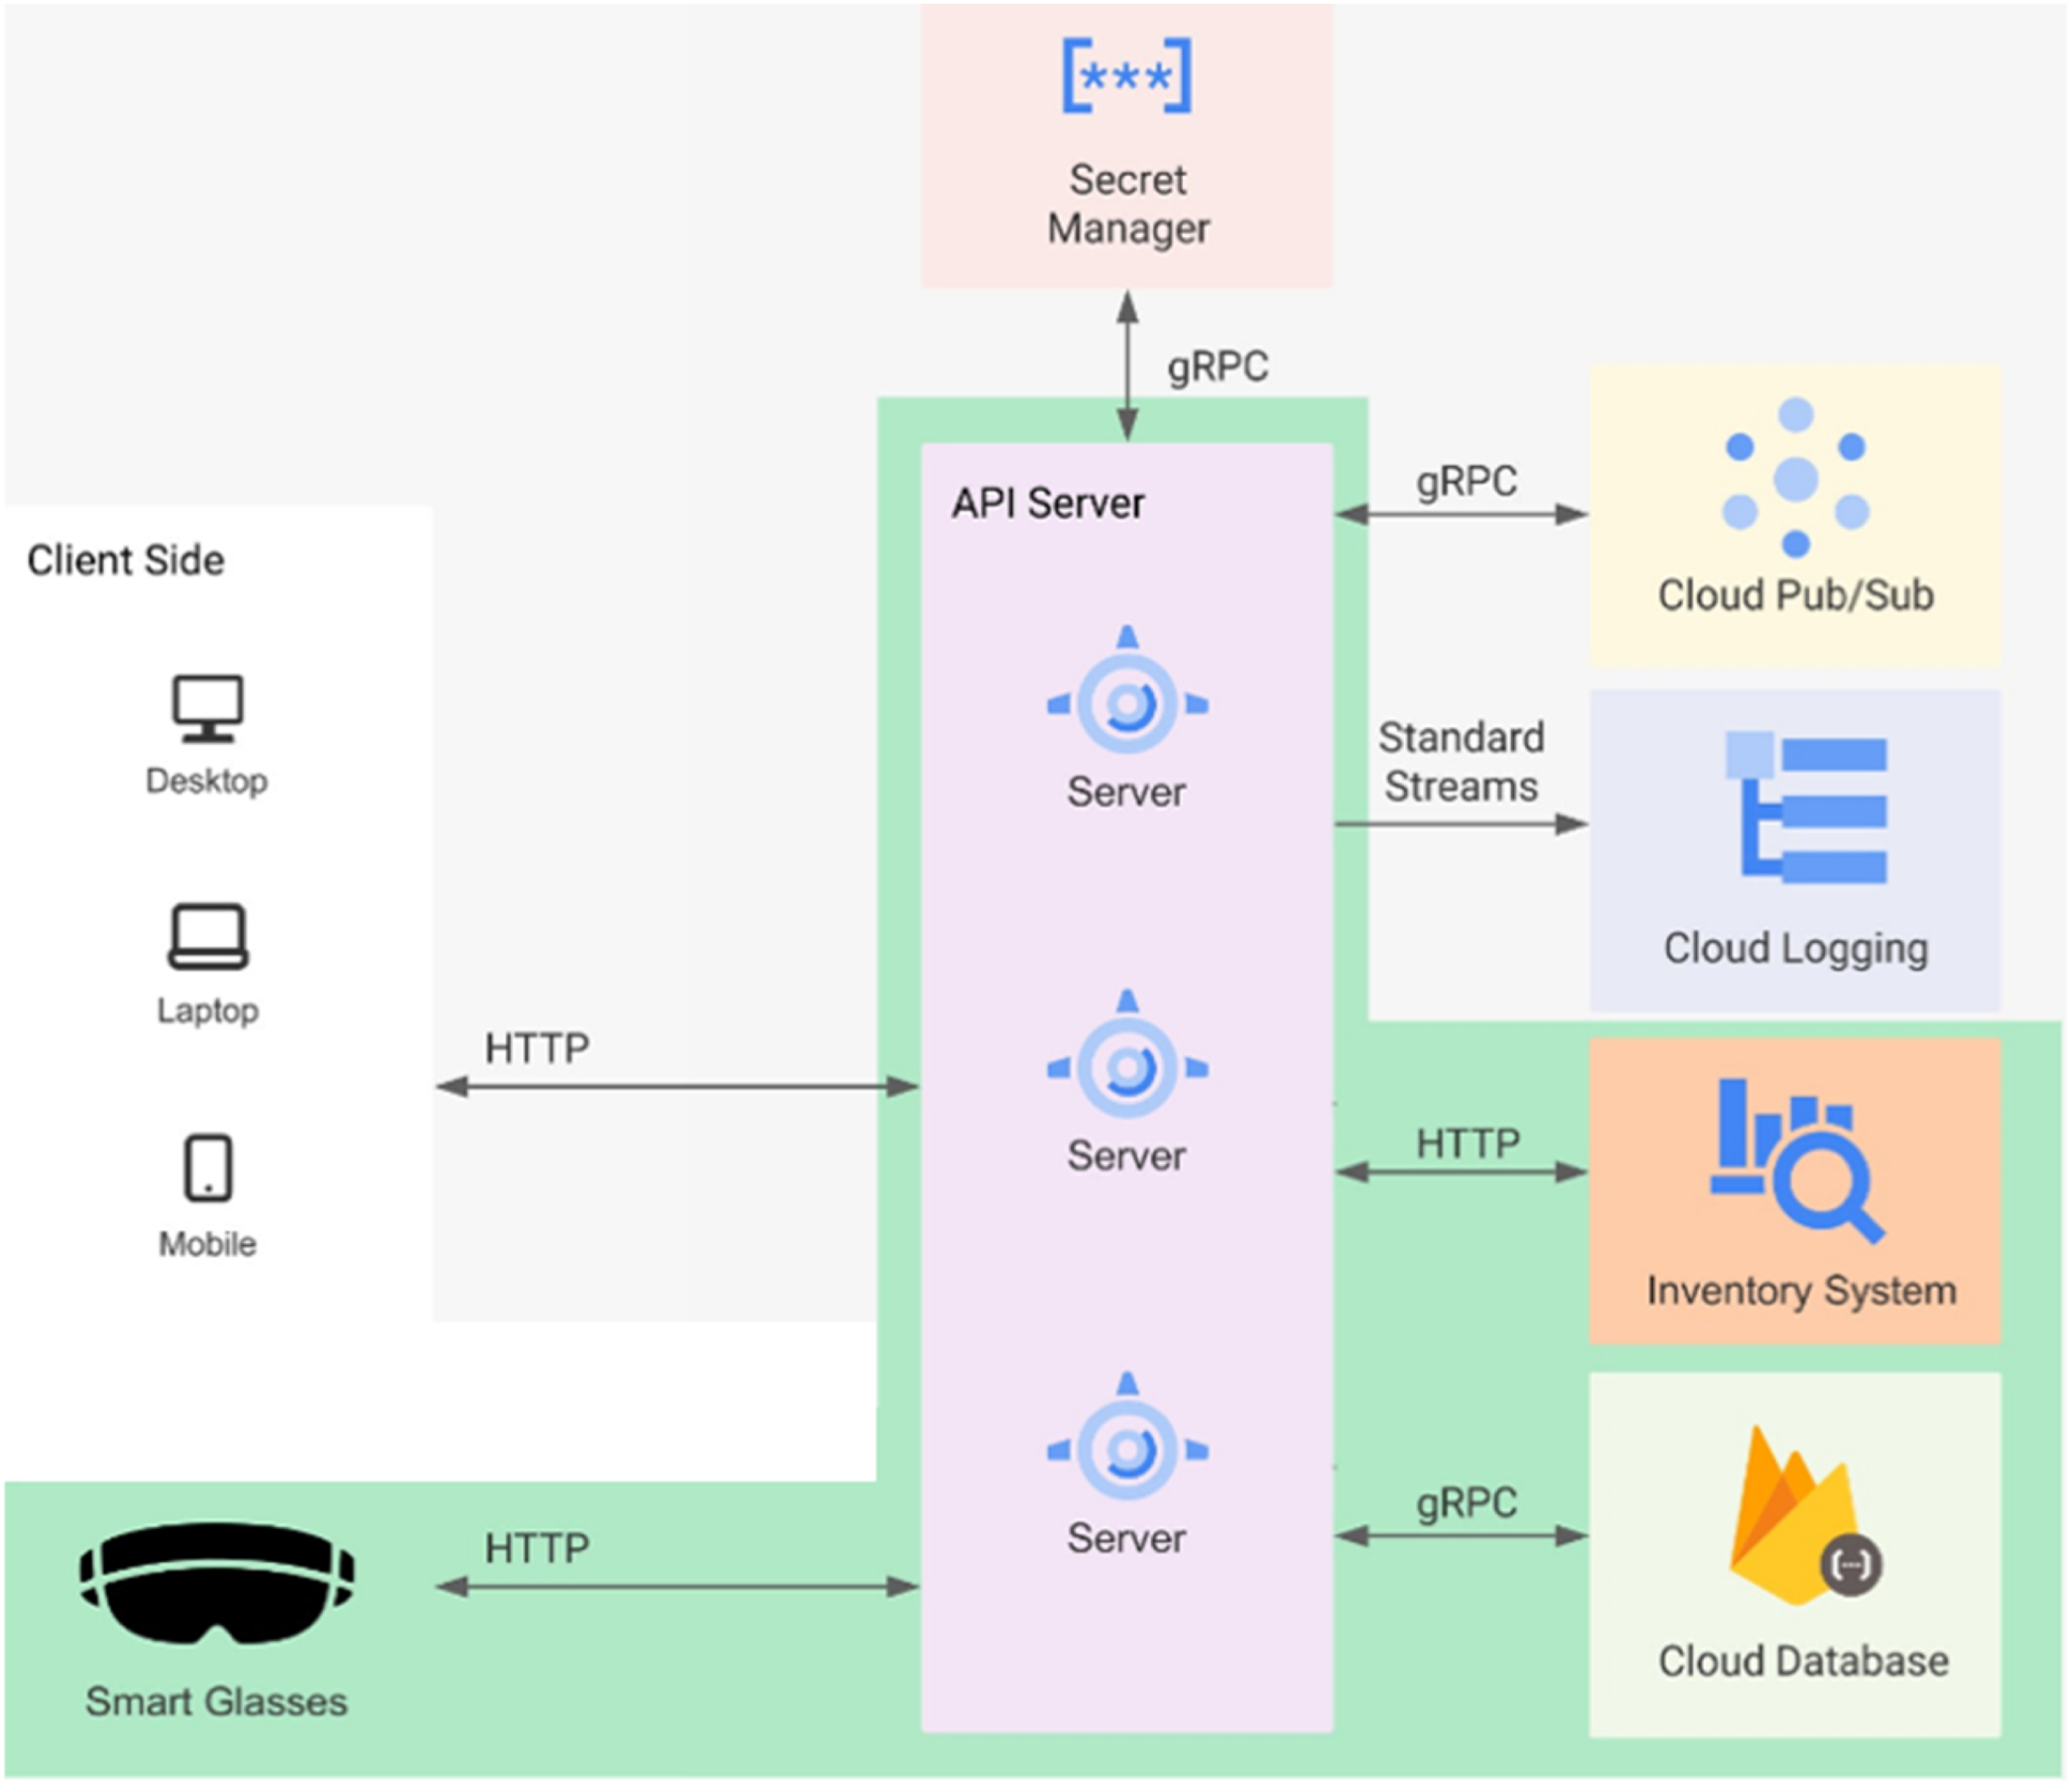
An order-picking request webpage has been created for back-office operators to issue requests to the warehouse directly. API servers facilitate data integration and synchronization within the module. Then, the servers extract detailed product data via the inventory system’s REST API port, including product SKU, product name, product storage location, and barcode. The product storage location is transformed into x coordinates and y coordinates using a map data structure. In this structure, x coordinates and y coordinates represent the pixel coordinates of digitalized floor plan. Subsequently, the product data and order details are integrated as non-assigned job and stored in the system database. The API servers would continuously fetch the records of non-assigned jobs by checking the status and assigning them to available operators for order picking. In detail, the job status is indicated by the “done” attribute in the JSON object, wherein 0 represents a non-assigned job, 1 suggests a job in progress, and 2 denotes a completed job.
The core of the module is an AR-based order-picking application for warehouse operators. The application assists operators in finding the designated shelves accurately by providing virtual guidance in the AR interface. Babylon.js renders a scaled virtual floor plan of the warehouse with unique coordinates designated to each shelf. The application will display a red point on the corresponding shelf coordinate previously transformed from the API server, indicating the product storage location. Additionally, a job list is created to present the details of order-picking requests, including product SKUs, titles, and quantities. Furthermore, QuaggaJS is utilized to scan product barcodes and extract them as strings via smart glasses’ camera. The extracted barcode is then compared with the barcode record stored in the inventory system for verification. If all items are correctly picked and scanned, the job status will be updated as completed in the system database, ensuring real-time data synchronisation of the inventory status. Figure 3 shows the Process Flowchart Diagram of the AR-based order-picking module, illustrating the sequential steps involved in its operation. Process flowchart diagram of AR-based order-picking module.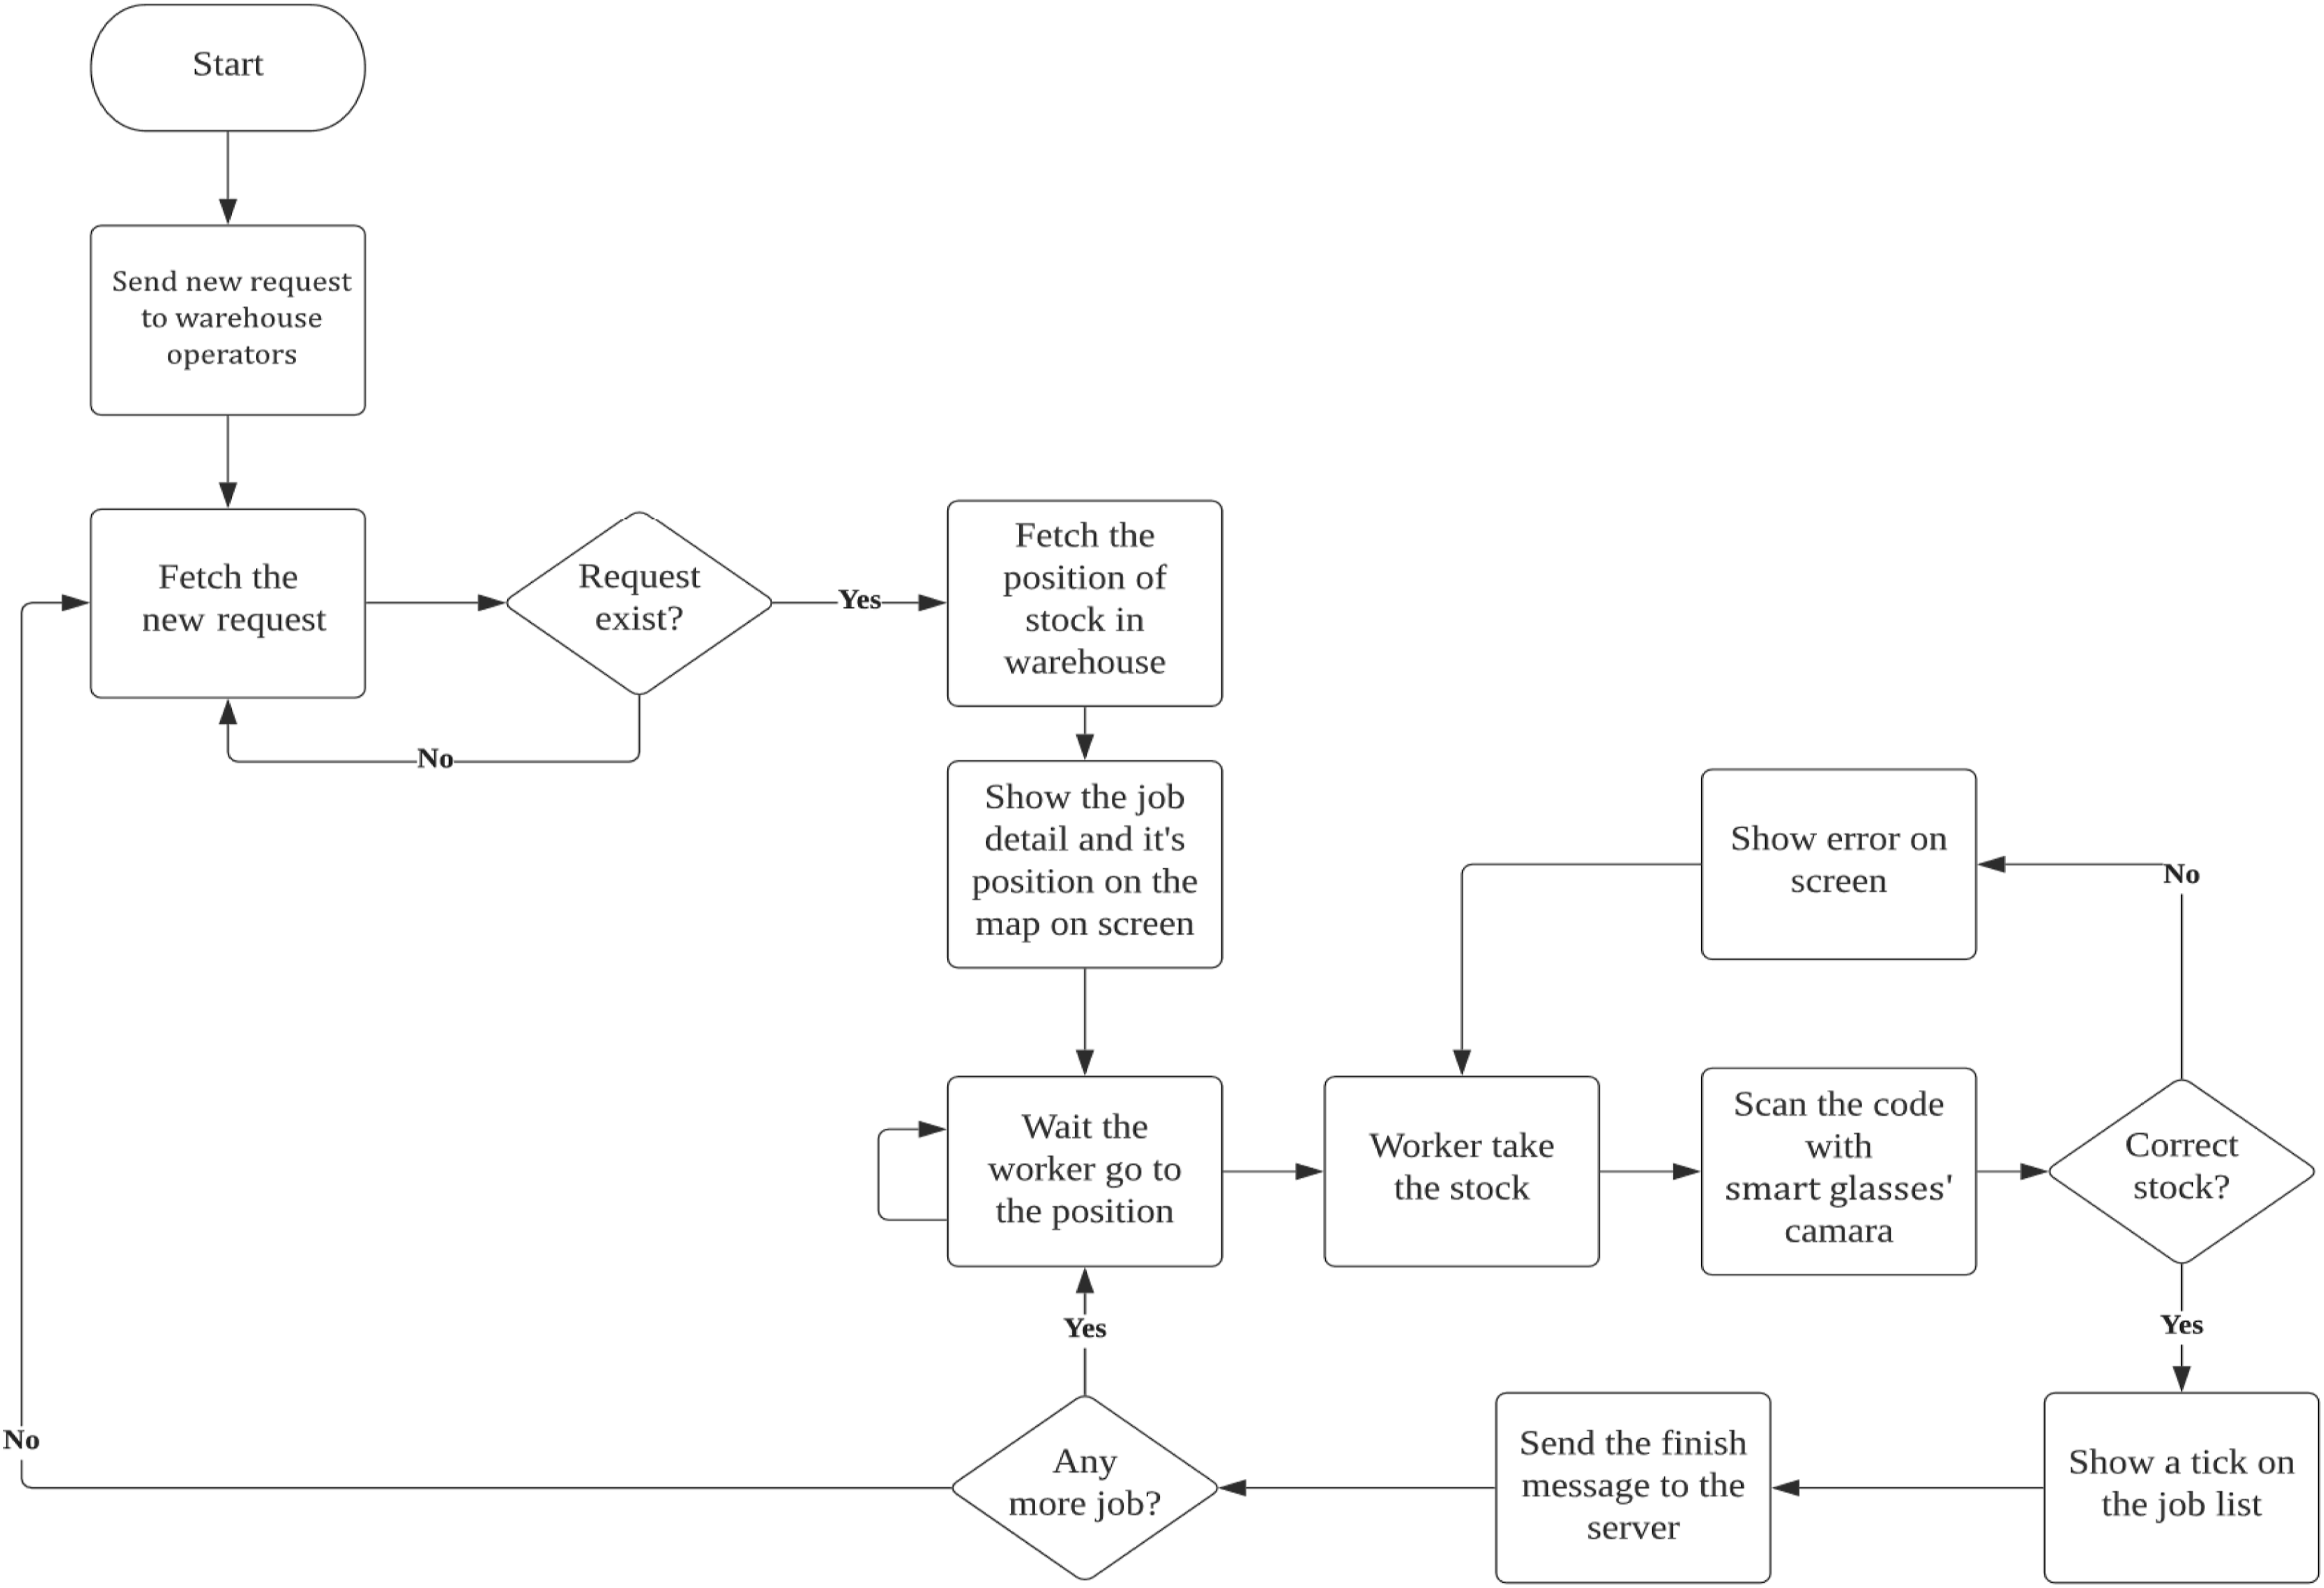
To facilitate synchronization with upstream modules, the AR system quantifies operational efficiency in real-time. For every product picked p, the system records the assignment timestamp (
This value is continuously compared against the Standard Picking Time (
E. Operational feedback section
The defining feature of the IEFSM is the “Inbound-Inbound” synchronization, where downstream execution metrics mathematically update upstream commercial strategies. To ensure synchronization across the modules, the IEFSM uses shared data dimensions, including product SKU, product title, category, price, sales volume, inventory level, storage location, and time stamps. These data are aligned across the product description, pricing recommendation, inventory management, and order-picking modules through a unified database structure. The product description module generates demand-related information, which supports pricing and inventory decisions; the inventory module updates stock availability using the same product identifiers and temporal records; and the AR-based order-picking module retrieves SKU and storage-location data to guide picking operations and update system status in real time. This shared data structure enables continuous information flow and closed-loop synchronization across the whole process. This also enable dynamic cost adjustment based on the picking efficiency.
The feedback from order picking to pricing is introduced as a capacity-management mechanism rather than a direct causal relation. When AR-supported picking data indicate excessive picking workload, longer picking time, or congestion in the warehouse, this suggests that demand may be approaching or exceeding fulfillment capacity. In such cases, pricing can be adjusted to moderate demand and relieve operational pressure, thereby maintaining service quality and improving overall e-fulfillment efficiency.
As defined in Section 3.2, the Balanced Pricing Strategy Eq. (7) relies on a cost variable (C). In this model, C is not static; it is an effective cost (
To ensure the economic rationality of the feedback mechanism, the sensitivity coefficient λ is not an arbitrary input, but is empirically defined as the Operational Cost Ratio. As established previously, order picking is a highly labor-intensive task that can account for up to 55% of total warehouse costs [7]. Therefore, λ represents the specific proportion of fulfillment labor costs relative to a product’s baseline cost
Variables of operational feedback loop.

4. Illustrative case scenario
This section presents a pilot case study conducted to evaluate the implementation of IEFSM. It took place in an SME e-fulfillment center in Hong Kong, with the consideration of pick-face optimization strategies based on. 49 The company’s back office and warehouse, which is 8 meters wide and 16 meters long, was successfully used for the case study. This facility has a capacity of over 900 types of products as vertical racking is adopted. The proposed IEFSM aims to improve the management of product information, facilitate better inventory management and enhance the order- picking process is to be studied herein. The IEFSM helps users understand the relationships between all the processes used in e-fulfillment. The entire process interconnectedly manages the workforce through cooperative and collaborative working which aims to increase use efficiency and customer satisfaction. To train the AI models for the product description, and to support pricing recommendation and inventory management modules, Robotic Process Automation (RPA) was employed to scrape data from three partner retail store websites serving the SME e-fulfillment center. Covering January 2023–December 2023 (12 months), the dataset includes product descriptions, sales records, inventory levels, and pricing data across product attributes (descriptions, categories), transaction records (sales volume, timestamps), and inventory levels (stock quantities). Raw JSON files from each retailer’s API/scraping were parsed and combined into a unified Excel workbook using product SKU as the primary key, with VLOOKUP functions merging sales/inventory timestamps across sources. Preprocessing involved duplicate removal via SKU+date, forward-fill imputation for missing inventory, and HKD price standardization. From 1,247,680 total records, stratified sampling by product category yielded 1,050,000 clean samples, split 85/15 into 892,500 training samples and 157,500 test samples, with 10% of training data (89,250 samples) reserved for validation across peak (Nov-Dec) and off-peak periods to prevent temporal overfitting.
A. Managing product information through product description and pricing recommendation
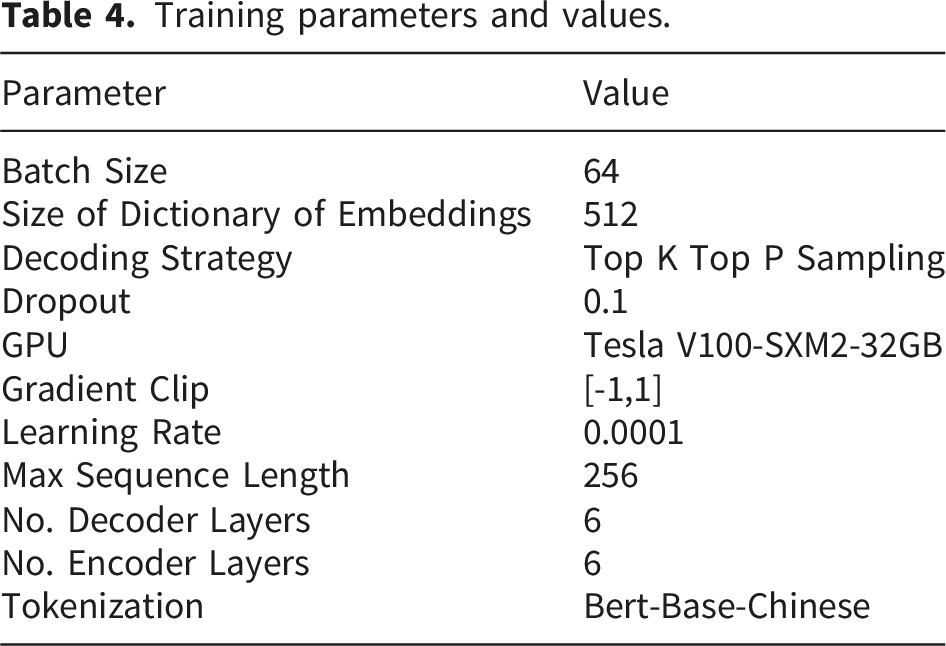
To generate tailored product description recommendations for specific products aimed at targeted customer groups, historical data encompassing product descriptions, keywords, search histories, and sales records were analyzed. Relevant product data were extracted based on the case company’s historical records, focusing on factors such as past sales volumes, pricing, discounts, description keywords, and user search behaviors to identify popular products with compelling descriptions. For training the product description generation model, the most current product data, specifically product titles and descriptions, were sourced from two prominent e-commerce platforms in Hong Kong. A comprehensive sample dataset comprising 2,161,191 entries was selected and subsequently divided into two sets for training and testing. The portion of this data used for training the proposed model is referred training dataset, while the test data is utilized to examine the functionality.
Training parameters and values.

Suggested Results of product description recommendations.
In order to make a pricing recommendation, the data of products was collected from two of the biggest e-commerce platforms. Product names, description, price and platform are taken into consideration. As depicted in Figure 5, the Japanese rice wine is offered at a price that is aggressive as well as balancing. The aggressive pricing strategy uses odd-even minimized pricing that readily attracts users to increase sales by decreasing the selling price. Conversely, the balanced strategy aims to achieve steady growth in sales and profits. Users can choose the pricing strategy that is suitable for their goals and particular situation. In this case, the user selects the balanced pricing strategy. The system evaluates the lowest current market price ( Results of product pricing recommendation.
B. Inventory management
Considering the expected increasing products demand due to improved product descriptions and pricing recommendations, inventory number should be optimal based on the demand change to prevent stockout or overstock. Therefore, statistical methods and rule-based calculations is adopted to calculate the expected inventory change in warehouse. Figure 6 provides an example of the decision support system used to transfer inventory between two warehouses to meet the expected rise in demand. The statistical methods and rule-based calculations model recommends relocating four units of Product E from Warehouse B to Warehouse A, the inventory balance for this transaction is calculated and displayed in the Inventory Balance field, which shows a value of 0, reflecting a valid transfer that maintains optimal stock levels across the warehouses. Inventory number adjustment results.
C. AR-based order picking process
As sales volume would rises based on enhanced product descriptions and pricing recommendations the need for a more efficient order picking process becomes more critical. Apart from the effectively managing inventory changes to ensure inventory level are readily for order picking, this study propose AR technology to enhance the picking process. The use of AR can provide real-time visibility into inventory location, enabling warehouse workers to quickly locate items and execute orders with greater precision. To develop the AR-based order picking process, the layout of the case company’s warehouse was measured and recorded using a Laser Distance Meter. This method facilitated accurate detection and measurement of warehouse space, enabling the mapping of real warehouse into AR-based application. Subsequently, inventory barcodes were recorded to database, thus pickers can scan the barcodes for products recognition with relevant data such as product IDs.
These smart specifications display the product details after scanning with the picking confirmation signal being saved in the corporate database. The product data has details of the SKU, the number of units needed, and where the product will be stored. In Figure 7, the order details on the tablet are transformed to instructions for AR view staff. In the beginning, workers get job assignments, which include the name of the product along with the required SKU and its quantity. The workers then view this information as an AR view on their HoloLens 2 devices. With AR support during the pick process, the pickers see visual instructions indicating where to locate the required product. The location of the required product is displayed over the warehouse map as a red point. After identifying, the pickers scan the barcodes of the product to finish up the picking. After the smart glass performs the key-in action, it will send an update request to the inventory system reflecting a decrease in picked quantities of the required products. A green checkmark will appear on the smart glass to show that the needed items have been picked successfully, allowing the picker to begin locating and picking the next products before transferring them to the outbound area to finish their job assignments. Order-picking Request Webpage and AR view instructions.
5. Result and discussion
A. Comparison between IEFSM and manual method
To evaluate the proposed IEFSM, it was deployed in the case study company’s warehouse descripted in section 4, for two months (January 2024 – February 2024). The test period processed 15,240 orders (average 255 orders/day) across 150 SKUs, compared to the baseline period (November-December 2023, same facility) with 12,780 orders (average 213 orders/day). External factors were controlled through matched periods (both post-holidays, no promotions) and identical operations (same facility/staffing). During this experimental period, a total of 30 product descriptions were generated, 150 SKUs were selected, 40 price checks and information updates were carried out for the products, and 10 replenishment checks were performed. All the operation are performed at an 8m×16m warehouse, with 5 pickers on peak hours (10AM-8PM).
Total sales and average operation time between manual and IEFSM.
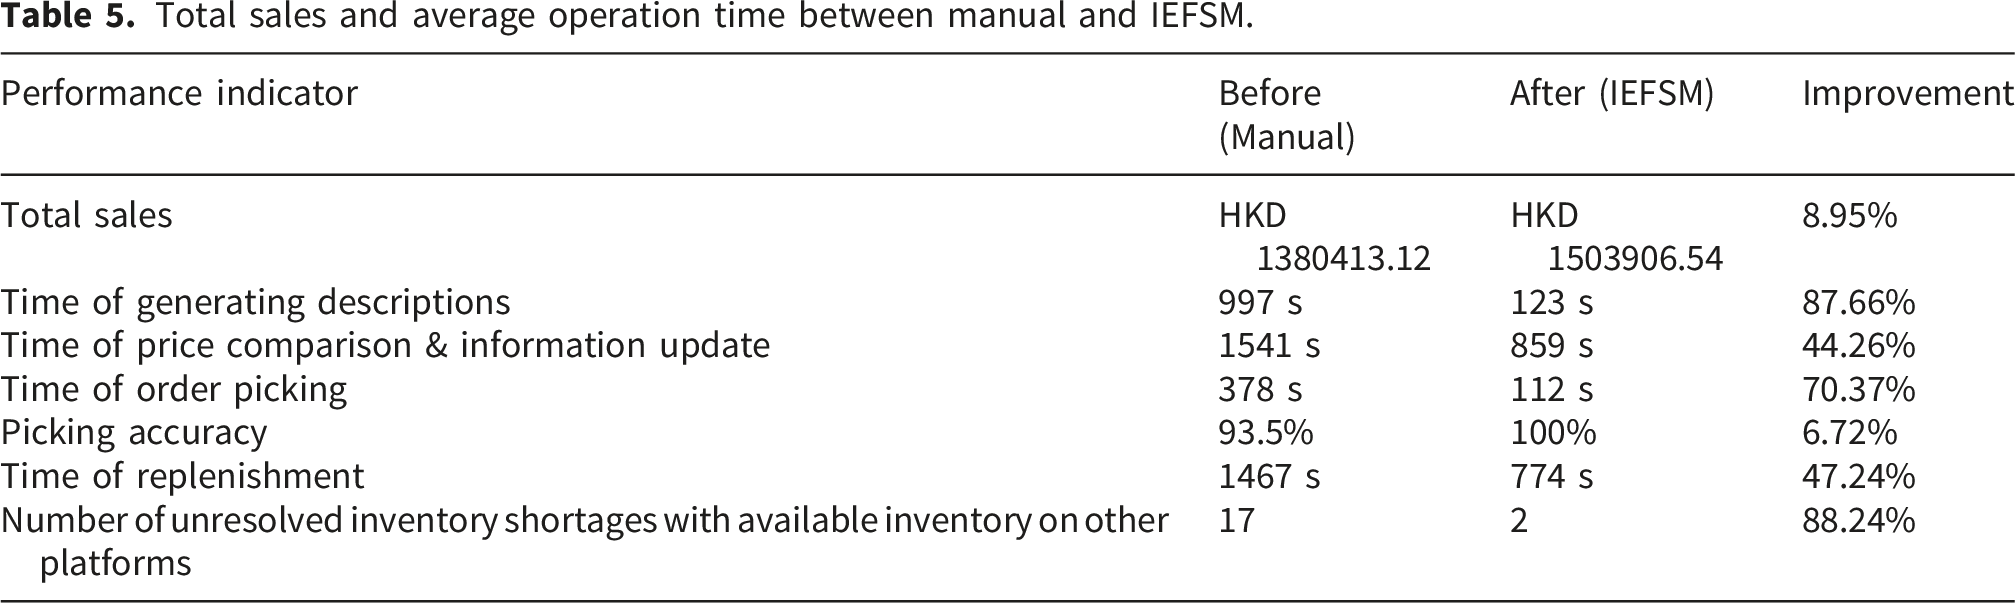
Utilizing AI for product description generation facilitates the use of trending phrases in the market. This application makes products more accessible to the target customers. The time taken to generate product descriptions process has improved by 87%. Also, when using statistical methods and rule-based calculations in managing product pricing shows a 44% improvement on the time spent on price and info updates. An AR-based order picking technique enhanced the efficiency of order picking. Accuracy of picking improved from 93.5% to 100% while time required for order picking was reduced by 70% This indicates that accuracy is aligned by IEFSM which assures low picking to customer compensation. The proposed model can reduce backorders caused by overselling or the sale of out-of-stock items when it comes to managing inventory. In particular, replenishment time has been reduced by 47% and instances of inventory shortages remaining unsolved while sufficient inventory exists on other platforms have reduced by 88%. Overall, IEFSM greatly enhances the operational efficiency of e-commerce SMEs by coordinating various operational processes in real time in e-fulfilment centres.
A paired t-test was conducted to compare description generation times across 30 products using manual (mean = 997 seconds, standard deviation = 156 seconds) versus IEFSM approaches (mean = 123 seconds, standard deviation = 28 seconds). The 95% confidence interval for the mean difference spanned 821-927 seconds, with x = 33.71 and p-value< 0.001, standard deviation of 142 seconds, and standard error of 25.9 seconds indicating high reliability. The large effect size (Cohen’s d = 6.15) confirms IEFSM’s substantial efficiency advantage.
For price comparison and information updates across 40 products, a paired t-test compared manual processing (mean = 1,541 seconds, standard deviation = 289 seconds) versus IEFSM (mean = 859 seconds, standard deviation = 167 seconds). The 95% confidence interval for the difference spanned 614-750 seconds, with t-statistic = 20.16 and p-value < 0.001, standard deviation of 214 seconds, and standard error of 33.8 seconds demonstrating result consistency. Effect size Cohen’s d = 3.19 confirms large practical improvements.
Order picking times for 150 stock keeping units were analysed via paired t-test, comparing manual averages (mean = 378 seconds, standard deviation = 67 seconds) to IEFSM (mean = 112 seconds, standard deviation = 19 seconds). The 95% confidence interval difference was 257-275 seconds, t-statistic = 58.18, p-value < 0.001, standard deviation 56 seconds, standard error 4.6 seconds showing high precision. Cohen’s d = 4.75 validates AR integration’s transformative impact.
Replenishment across 10 cycles showed paired t-test results of manual (mean = 1,467 seconds, standard deviation = 312 seconds) versus IEFSM (mean = 774 seconds, standard deviation = 145 seconds), 95% confidence interval difference 530-856 seconds, t-statistic = 9.61, p-value < 0.001, standard deviation 228 seconds, and standard error 72.1 seconds indicating reliable gains. Effect size Cohen’s d = 3.04 confirms substantial efficiency.
Figure 8a–(d) present boxplots for all four metrics, consistently showing lower medians, reduced interquartile ranges, and fewer outliers with IEFSM, visually confirming the statistical superiority across description generation, pricing, picking, and replenishment processes. Operational Time Comparison: Manual vs. IEFSM (Boxplots).
B. Sensitivity analysis
In this section, to assess how various modules of the IEFSM perform under different settings, three sets of sensitivity analysis have been performed to observe how these settings impact the observed performance indicators used in the comparison between IEFSM and the manual method. First, the amount of SKU and prices collected per SKU (i.e. Time of price comparison and update under different amount of SKU and number of prices collected per SKU.
Similarly, the number of pickers and order sizes have been chosen to assess the sensitivity of the AR-assisted order-picking module. Figure 10 shows the visual representation of the sensitivity analysis regarding the time of order pricking under different numbers of pickers and under different order sizes. The results have shown that the number of pickers is more impactful to the time of order picking than order sizes. This supports the current industrial practice of increasing pickers to improve order-picking efficiency.
52
Time of order picking under different numbers of pickers and order sizes.
Thirdly, the amount of buffer inventory and sales velocity have been chosen to assess the sensitivity of the inventory management module. Figure 11 presents the sensitivity analysis regarding the time of replenishment under different amounts of buffer inventory and sales velocity. The results have shown that the amount of buffer inventory has a greater impact on the time of replenishment than sales velocity, which supports the current industrial practice of focusing on safety stock to prevent stockouts and handle demand volatility,
53
leading to reduced time of replenishment. Time of replenishment under different amounts of buffer inventory and sales velocity.
6. Conclusions
A. Managerial implications
The increasing ease of online shopping has changed consumer purchasing behaviour, with an expectation of rapid delivery time to anywhere in the world, and small lot-size orders. In order to fulfil consumer expectation, the e-fulfilment centre is required to be very efficient in processing e-order, which can come at any point of time. Without the necessary investment, e-fulfillment centers, particularly manual warehouse operating SMEs, cannot operate with the same efficiency as they do for normal orders. In addition to facilitating customers’ purchasing, the rapid advancement of technology also enhances the capability of enterprises to improve operational efficiency. E-fulfillment processes have often been optimized solely and not with any connection between processes. It may cause inefficiency of e-fulfillment as a whole. This research seeks to examine the significance of process synchronization and the deployment of AI and AR in the processes of product information management, inventory management and order picking. The IEFSM system applies the power of artificial intelligence to analyze information on market and consumer buying behavior to develop product attributes and price recommendation tailored to each product. By using customer data, the product tagging and pricing adjustment will be more aligned with what the customer wants. Thus, making such products more attractive. Sales of products would be driven; such information is required for inventory management. Precise predictions regarding the quantity of inventories required to satisfy dynamic demand can be made. In other words, stock levels can be optimized to prevent stock out or overstock. Areas of inventory would be moved and would create inefficiency in the order picking process if the pickers wouldn’t take notice of this change. The proposed IEFSM structure will adopt AR technology that offers visual guidance to warehouse personnel to easily locate products quickly. The smart glass can display the product locations and picking priorities of required products directly in the workers. In this way, the errors associated with manual picking methods can be reduced. According to the study, engineering management professionals are encouraged to embrace integrated systems. This study offers useful and practical engineering management insights to ensure better operational efficiency in the fast-changing business of e-commerce.
B. Academic implications
Previous studies on engineering management always focused on enhancing operational efficiency through emerging technologies solely, the interconnection between e-fulfillment operation has often been overlooked. This study contributes to the field by providing empirical validation for the TFM paradigm within an SME context. 6 It demonstrates that horizontal synchronization, specifically the “Inbound-Inbound” alignment of product data, inventory, and picking, can be successfully achieved through accessible technologies like AI and AR, moving the TFM concept from theoretical framework to practical application.
The findings of this study provide a foundational framework for future work on process synchronization. Moreover, this research would encourage scholars to explore the synchronization further in other operation. In addition, this study highlights how emerging technologies, such as AI and AR, enhance e-fulfillment operations and facilitate this synchronization approach by providing decision support.
C. Study limitation and future work
The focus of this research is mainly on manual warehouse and considering the synchronization of e-fulfilment processes among managing product information, inventory management and order picking. Therefore, the findings of this study would be limited. Further work should explore the synchronization of other e-fulfillment processes, specifically extending into “Inbound-Outbound” and “Outbound-Outbound” synchronization including product delivery and returns management. Additionally, future research would include other types of warehouses, such as automated warehouses with Automated Guided Vehicles (AGV) or other robotics. Besides, this study adopts AI and AR technology to improve the mentioned e-fulfillment processes with synchronization initiatives. Future studies could investigate the use of other technologies like mixed reality or metaverse. Moreover, implementing IEFSM as a complete system in the case study prevents isolating the effects of individual components from their combined synchronization benefits. Without ablation studies, this research cannot separate improvements due to single technologies from those arising through their interactions. This represents a necessary trade-off between demonstrating overall system performance and pinpointing specific component contributions, particularly due to the lack of sensitivity analysis for individual modules like AR-assisted picking. Future work should use staged A/B testing to quantify both the specific AR technology impact and this important synchronization effect, which lies at the core of IEFSM’s value. Furthermore, this study is constrained by the use of observational data without controlled experimental design, which limits the ability to establish causal relationships. The absence of statistical assumption testing (e.g., normality) and multiple comparison corrections may also affect the robustness of the reported results. In addition, the dataset is derived from a single case company, which may limit the generalizability of the findings to other operational contexts, industries, or scales. Future research should incorporate controlled experiments, more rigorous statistical validation, and multi-site data collection to enhance the reliability and external validity of the results. Finally, due to privacy concerns of the case study company, core code, proprietary datasets, and implementation details cannot be publicly released. This limitation prevents full replication of the exact implementation.
Footnotes
Acknowledgements
The authors wish to thank the Innovation and Technology Fund of the Hong Kong Special Administrative Region (HKSAR) for supporting this project. This research was supported by the Research Matching Grant Scheme (RMGS) under the project: AI-driven One-stop Platform for enhancing Inventory Management through Big Data Analysis.
Funding
The authors disclosed receipt of the following financial support for the research, authorship, and/or publication of this article: The work was supported by Innovation and Technology Fund (Project Code: PRP/034/20FX) and University Grants Committee (Research Matching Grant Scheme (RMGS)) under the project: AI-driven One-stop Platform for enhancing Inventory Management through Big Data Analysis.
Declaration of conflicting interests
The authors declared no potential conflicts of interest with respect to the research, authorship, and/or publication of this article.
Appendix
Appendix A
Variable units table.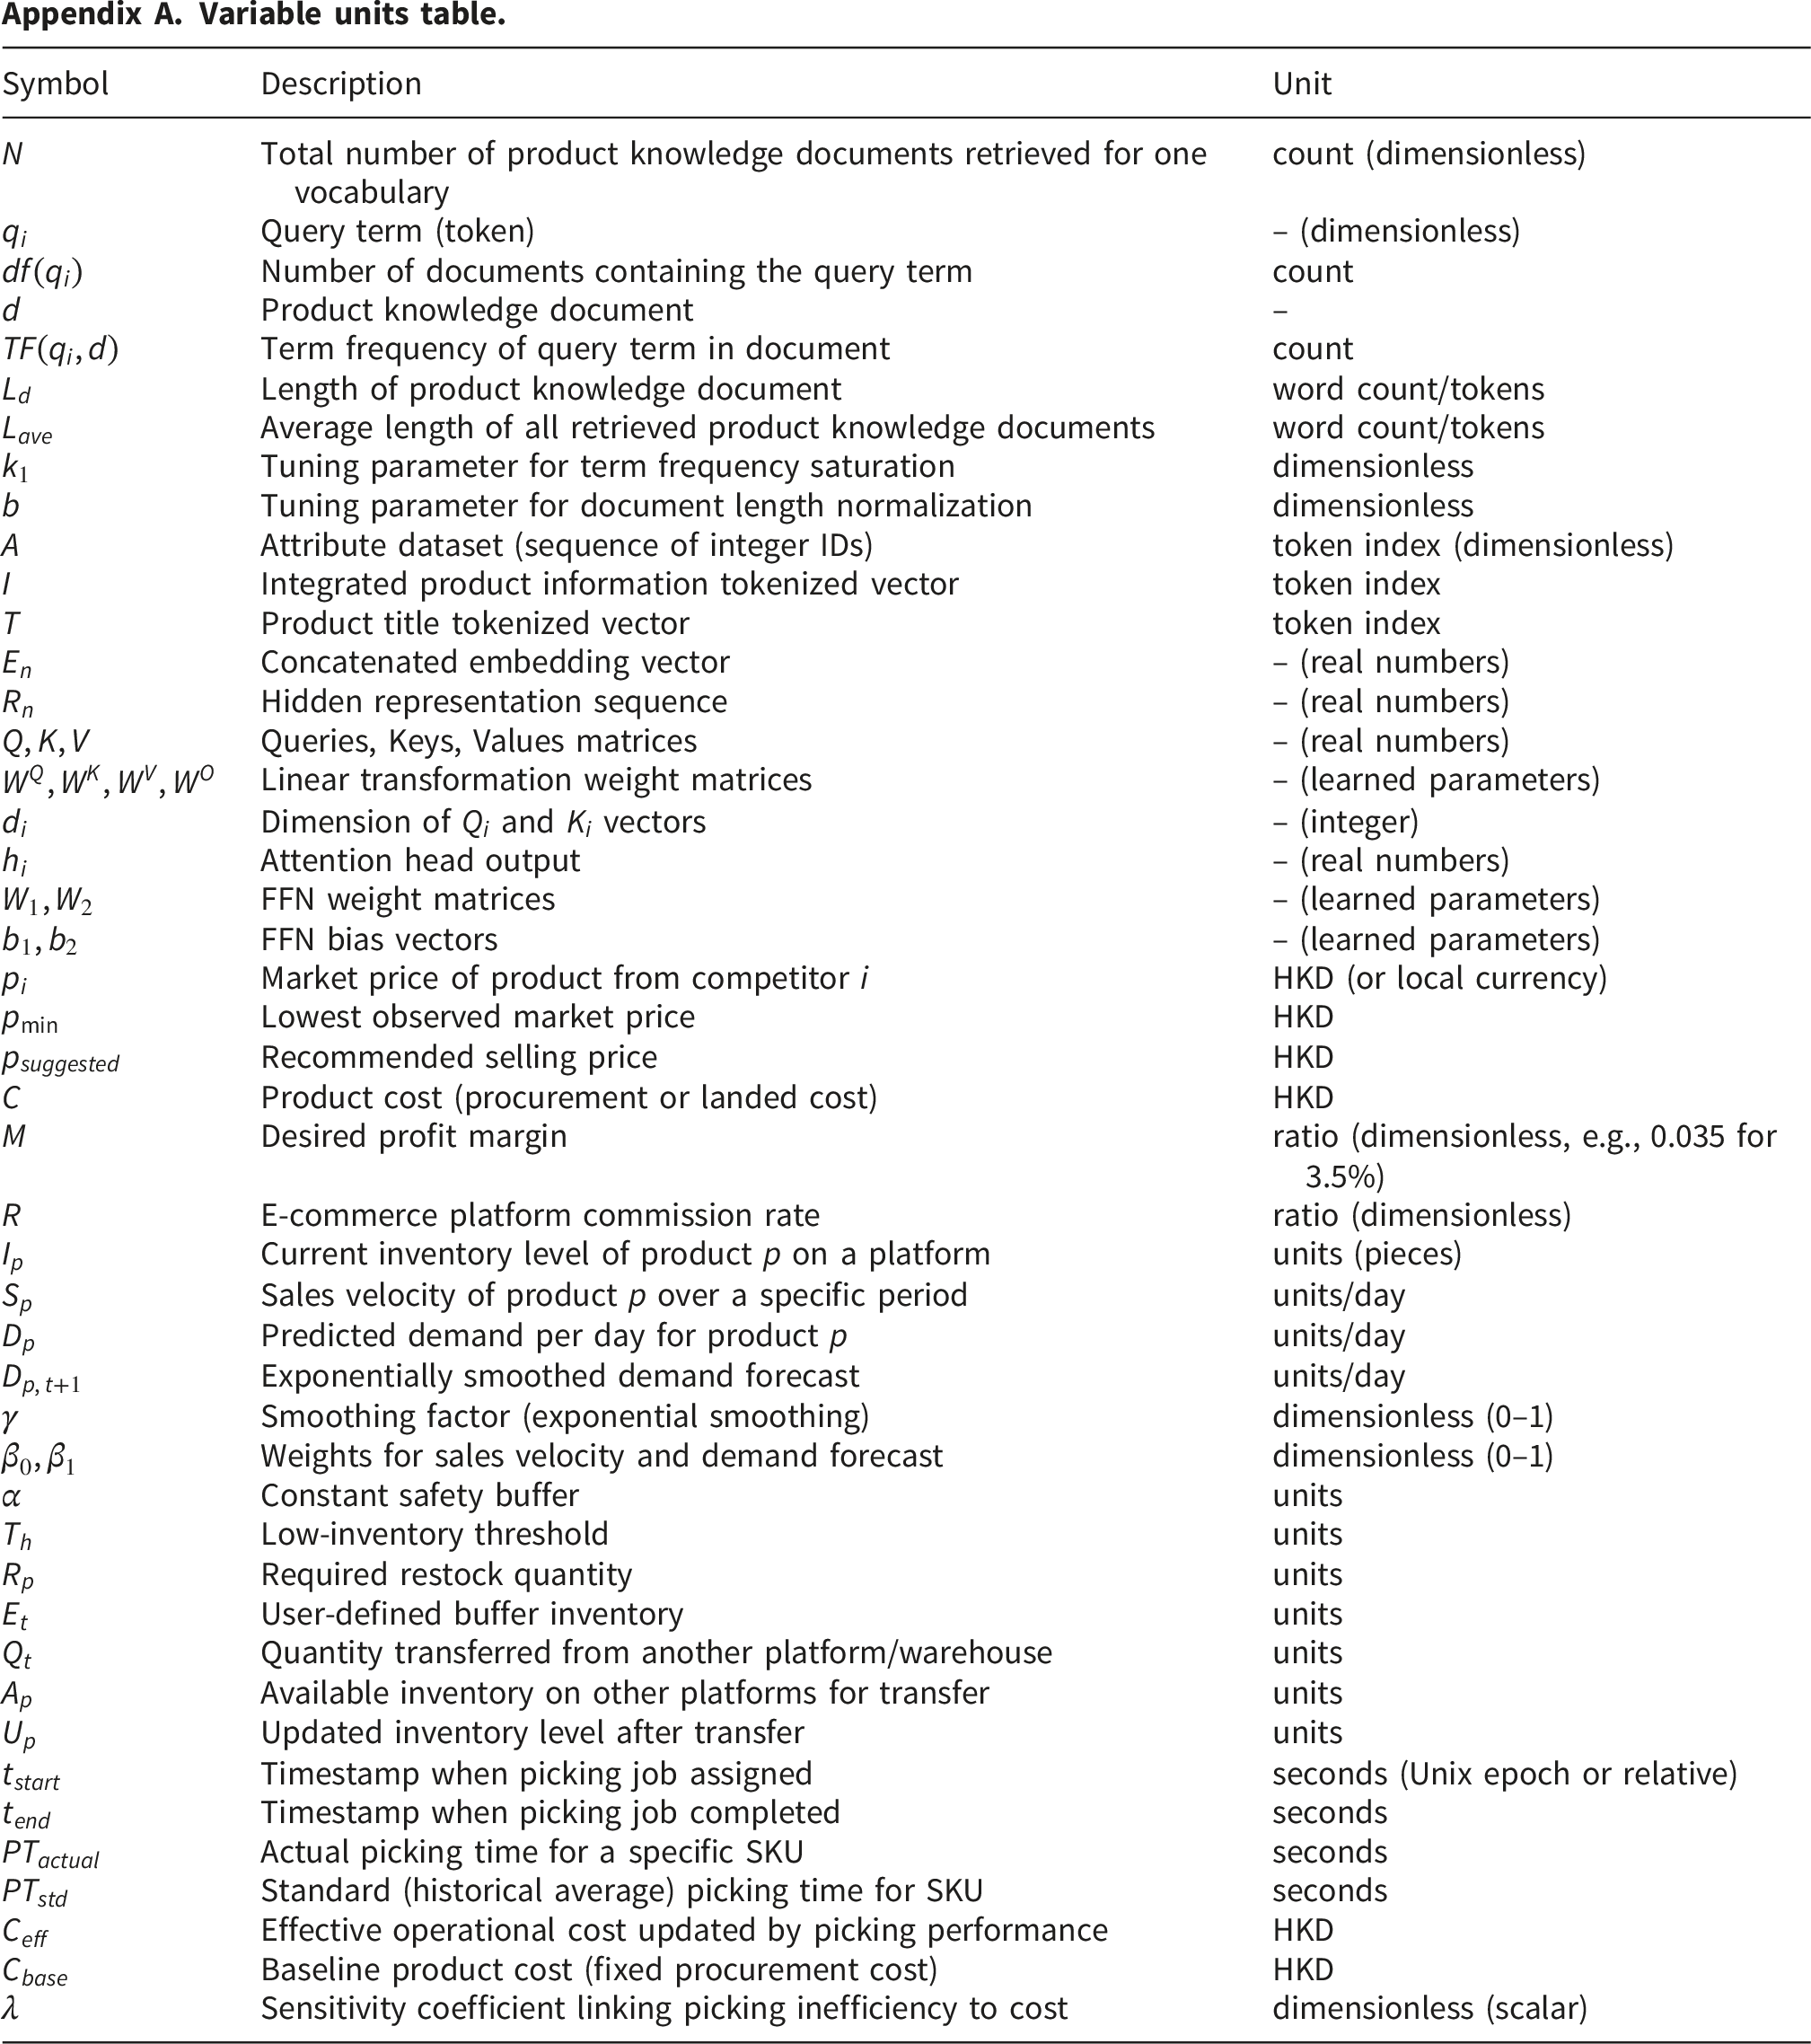
Symbol
Description
Unit
Total number of product knowledge documents retrieved for one vocabulary
count (dimensionless)
Query term (token)
– (dimensionless)
Number of documents containing the query term
count
Product knowledge document
–
Term frequency of query term in document
count
Length of product knowledge document
word count/tokens
Average length of all retrieved product knowledge documents
word count/tokens
Tuning parameter for term frequency saturation
dimensionless
Tuning parameter for document length normalization
dimensionless
Attribute dataset (sequence of integer IDs)
token index (dimensionless)
Integrated product information tokenized vector
token index
Product title tokenized vector
token index
Concatenated embedding vector
– (real numbers)
Hidden representation sequence
– (real numbers)
Queries, Keys, Values matrices
– (real numbers)
Linear transformation weight matrices
– (learned parameters)
Dimension of
and
vectors
– (integer)
Attention head output
– (real numbers)
FFN weight matrices
– (learned parameters)
FFN bias vectors
– (learned parameters)
Market price of product from competitor
HKD (or local currency)
Lowest observed market price
HKD
Recommended selling price
HKD
Product cost (procurement or landed cost)
HKD
Desired profit margin
ratio (dimensionless, e.g., 0.035 for 3.5%)
E-commerce platform commission rate
ratio (dimensionless)
Current inventory level of product
on a platform
units (pieces)
Sales velocity of product
over a specific period
units/day
Predicted demand per day for product
units/day
Exponentially smoothed demand forecast
units/day
Smoothing factor (exponential smoothing)
dimensionless (0–1)
Weights for sales velocity and demand forecast
dimensionless (0–1)
Constant safety buffer
units
Low-inventory threshold
units
Required restock quantity
units
User-defined buffer inventory
units
Quantity transferred from another platform/warehouse
units
Available inventory on other platforms for transfer
units
Updated inventory level after transfer
units
Timestamp when picking job assigned
seconds (Unix epoch or relative)
Timestamp when picking job completed
seconds
Actual picking time for a specific SKU
seconds
Standard (historical average) picking time for SKU
seconds
Effective operational cost updated by picking performance
HKD
Baseline product cost (fixed procurement cost)
HKD
Sensitivity coefficient linking picking inefficiency to cost
dimensionless (scalar)