
Abstract
The degree of utilization of Quick Response (QR) codes is sharply increasing due to the wide availability of smart devices. The primary purpose of the QR code is to ensure that an extensive message is fully transferred in a compact data format. Like any environment, security is an essential issue where QR codes are utilized. Such problems include the lack of signing information in a QR. This study aims to exploit the QR code hiding mechanism without spoiling the value of the code in the QR code while determining it using several machine learning algorithms. Consequently, several new QR image datasets are generated with varying sizes and variations to examine the classification of the proposed message-hiding scheme. This study used state-of-the-art models (VGG16, Xception) and a CNN-based model for QR code classification but only achieved 50% accuracy across four QR code dataset variants. Unsatisfied with these results, the study then employed the histogram feature density technique with various machine-learning (Logistic Regression (LR), Decision Tree (DT), and Random Forest (RF)) and deep learning (DL) models. The experimental results reveal that adapting the histogram density method in the proposed scheme for feature creation achieved an overall success rate of approximately 99.98%. Moreover, the study further aims to simulate single-layer QR codes from hackers’ perspective that pretends to look like two-layer QR code systems. As a result of this simulation study, the performance was tested using different classification algorithms. In most cases, except for one, the DL model performed better by attaining a success rate above 90%.
Introduction
QR code is a two-dimensional barcode that transmits complete and without-defect data to the other party. Since this type of code is standardized, the content of the code is the same in all media and devices. In other words, the user who wants to transmit data creates a QR code with the data value within the capacity of the code and sends it to the other party. The degree or data contained in this code is accessed on the receiving end.
Usually, a QR code is created from black patterns on a white background, but this is not always the case. Even if the originality of the code deteriorates to a certain extent (at varying rates according to the parameters of the code), it can be used with different background and pattern colors as long as it preserves the value. It has many usage areas, such as document verification, 1 presenting website link information for promotion, 2 and advertising various other details.
Generally, the primary purpose of the QR code detection method is to investigate whether the relevant image contains a QR code. Scientists exploited various methods, which can be divided into two groups: local features-based techniques and advanced feature extraction techniques such as convolutional neural networks (CNN). 3 For instance, authors in 4 used pixel similarity analysis with the help of filter matrices on the image. In, 5 researchers exploited local binary patterns to trace valuable features. Similarly, individuals in 6 utilized local gray pixel values as features by applying a median filter, binarization (converting to an image that only contains black and white pixels), and image expansion for better results. More local feature determination methods, such as scanner line features, Hough transformation, and statistical features, can be found in. 7
On the other hand, methods based on CNN are also employed extensively, such as authors in 8 proposed a CNN-based architecture to determine the number of layers. Unlike prior studies, authors in 9 exploited CNN architecture to eliminate the angular noise of the QR code. Researchers in 10 incorporated an advanced DL-based model called Darknet19 as a transfer learning approach. Faster-RCNN, one of the newer CNN architectures, was used in. 11 Another study 12 used a local feature detection method called histogram density, aiming to convert images to grayscale and use histogram density values as features. Usually, this method was used to identify QR-coded images.
The primary purpose of two-layer QR codes is to display QR codes with open and hidden messages in a single QR code image. In the remaining part, studies on classification processes made on QR codes created for various purposes are included. In, 13 the authors performed identification verification by exploiting regional and global features using three-dimensional QR code images. They tested the resistance of these generated QR codes against various method attacks (image analysis with different camera types, distance between image and camera, ambient light, etc.). In general, they observed a success rate of 96%.
In, 14 the goal is not to copy the QR code obtained by adding the created image so that the original value in the second layer is not copied in the first layer. They examined the datasets in two groups, scanning by scanner and mobile phone. They used a customized CNN model for feature determination and DL as a classification algorithm. According to the study, false QR code classes and their subclasses were created, and the reliability of two-layer QR codes was observed to be 98% and above. The researchers in 15 developed a noise removal-based multi-layer QR code classification system. Their classification process aims to correctly classify and increase the length of the message that QR codes can contain. For testing, they did not read the QR codes in the virtual environment but scanned with a mobile phone in printed form. As a result of the classification process, the performance is over 97%, and the capacity increase is between 10% and 56%.
In, 16 the researchers classified the image as a simple QR code or an information-hidden QR code image by scanning the digital and print media. Besides classification, they aimed to increase the size of the hidden message. Their study employed that while the QR code is hidden within the QR code, the aim is not to spoil the value of the public-level QR code but to perceive it as a standard QR code. They achieved a success rate is 100% in the digital environment and over 98% in the printed environment. In, 17 the researchers classified the original and fake data matrices in different environments (mobile environments, scanners, etc.). They first extracted features in the spatial and frequency domain and later applied Support Vector Machine and other DL methods to these global features for classification. The difference from the main work is that the fake QR code class is used instead of the two-level QR code. As observed in the literature, for multi-layer QR code classification, most studies examine QR codes generally of two-level. Rarely, three-layer 18 or more are studied. Scientists in, 19 emphasized that a fake file can be produced with a steganographic picture, thus the other party cannot understand. However, a man-in-the-middle attack may obtain the actual documents. They used machine learning methods such as CNN to determine whether the file was steganographic.
To the best of our knowledge, the prior works discussed in the literature do not address two-layer QR code detection. As modern two-layer QR codes contain images and hidden data in their layers, most of the advanced DL methods used previously fail to classify the codes and retrieve the data correctly. Therefore, this study contributes the following to the scientific research:
Created several new QR image datasets of varying sizes and variations for examining the classification capabilities of the proposed message-hiding scheme. For better evaluation, the study creates each image in a dataset with different scaling parameters, including version, scale, code mode, and error correction level. Exploits modern DL-based pre-trained models to classify QR codes as two-layer and single-layer codes Compared the performance of the simulated QR codes using various classification algorithms. Adapted the histogram density method for feature creation within the proposed scheme to impressively improve the overall success rate of approximately 99.98% in the experimental results. Conducted a simulation study from hackers’ perspective by simulating single-layer QR codes designed to mimic the appearance of two-layer QR code systems. Provides insight into how the histogram density method, along with machine learning techniques, can be leveraged for improved classification and security measures. The study contributes to understanding and enhancing QR code security by exploring message-hiding schemes and potential vulnerabilities.
The rest of the paper is structured as follows: Section 2 details the creation of a two-layer QR code dataset and elaborates on various machine learning and DL algorithms. In contrast, Section 3 outlines different test scenarios along with obtained results. Section 4 briefly discusses the obtained results whereas Section 5 concludes the study.
Materials and methods
This study creates a new dataset using four scaling parameters described in this section. Later, to obtain useful features, it exploits two feature extraction techniques, including CNN and histogram density. Once features are extracted, the study trains and tests three different machine learning (RF, DT, and LR) and a DL model (based on two hidden layers) to classify two-layer QR code images. Besides these, the scheme is then evaluated based on the attacker's activities (see Figure 1). The attacker understood that communication could not be done with a QR code with normal standards by looking at the histogram density values of the QR code images used in communication. From the attacker's point of view, the gray colors next to the black and white color values of different normal QR codes were used. Thus, he tried to produce similar QR codes using different methods so that the system would think that these were its own codes, and he wanted to keep the system busy. The system checks the codes produced as per its own algorithm according to the classification model. Tests are carried out to see if the codes produced by the attacker can be understood by these algorithms.
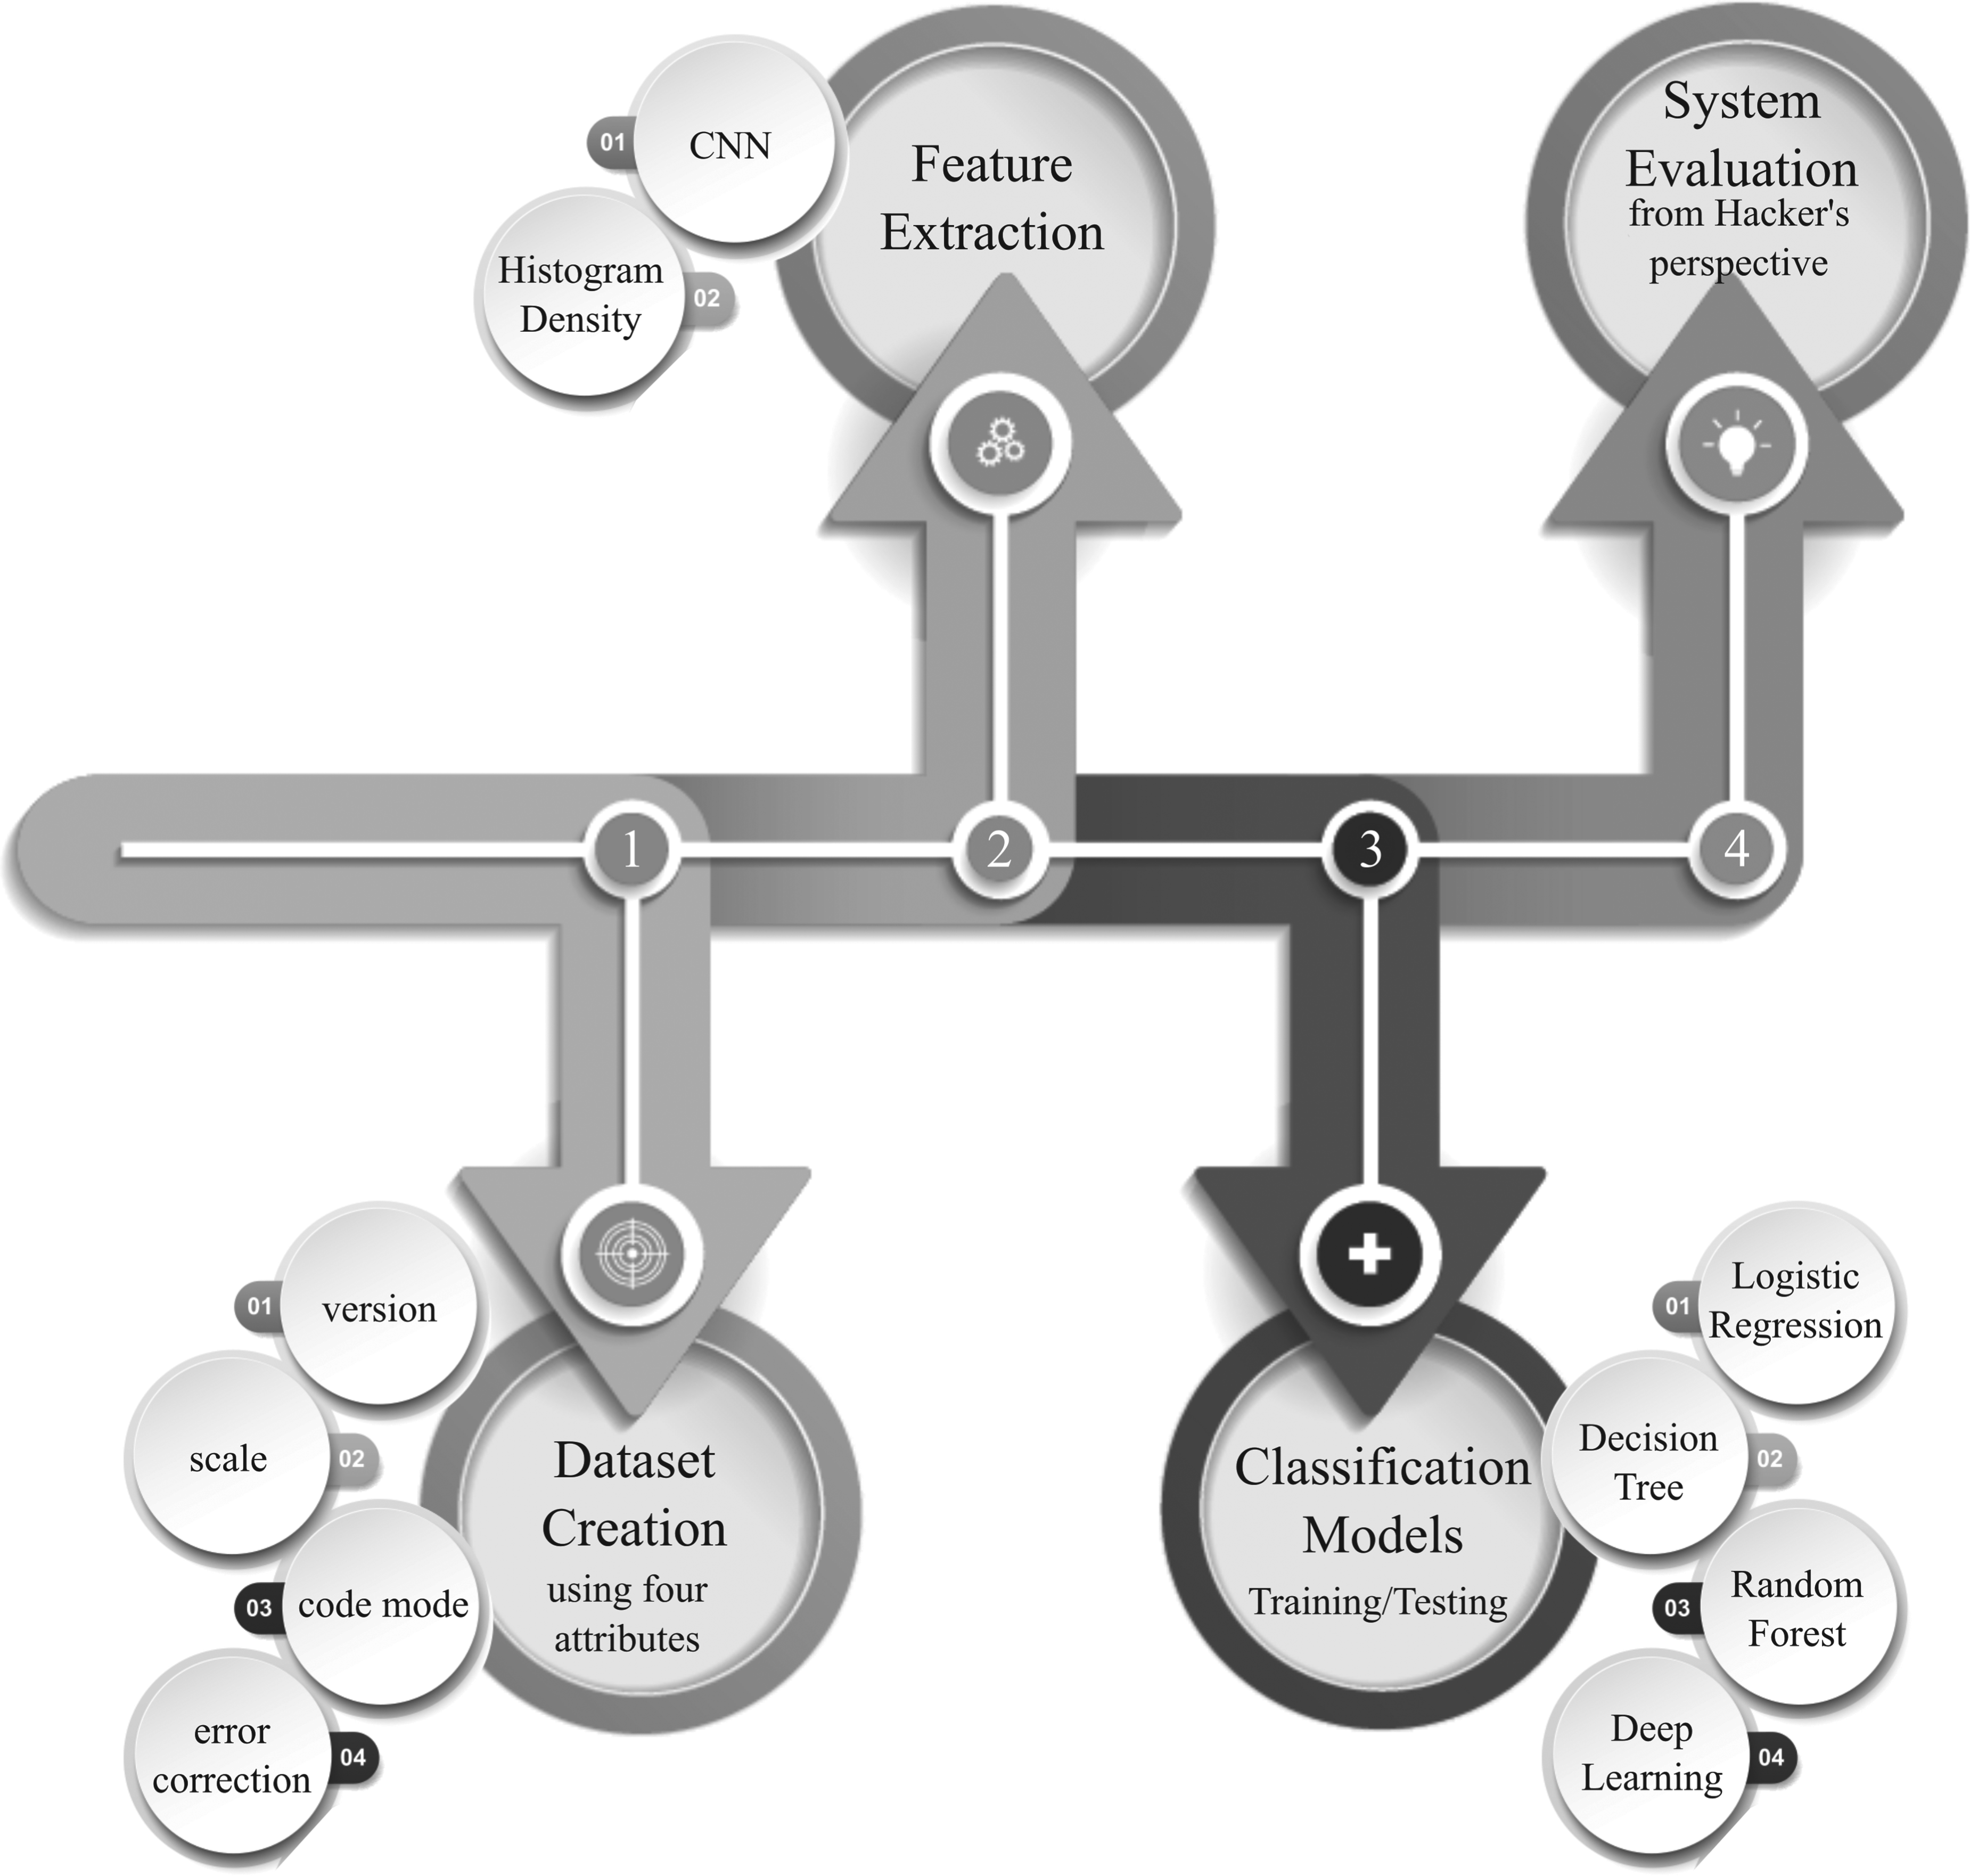
The workflow of the proposed scheme.
As an aside, a QR code containing the same data may look different depending on its generator by setting four scaling parameters, including version, scale, code mode, and error correction level. To examine the effect of four scaling attributes in QR code formation, a single scaling parametric value is changed at a time while keeping others fixed (default). The content contained in all QR codes to be examined in this section is “yildiz”.
The version parameter controls the standard size and width of the QR code, which ranges between 1 to 40. Figure 2 shows different versions of the QR code, all having the same content but different sizes and shapes. It is evident in Figure 2 that the standard size and width of the code increase as the version value of the QR code increases. Therefore, for higher efficiency, it is suggested to use the smallest possible version for fixed content, as the larger version value increases the size of the QR code which eventually results in high transmission time.
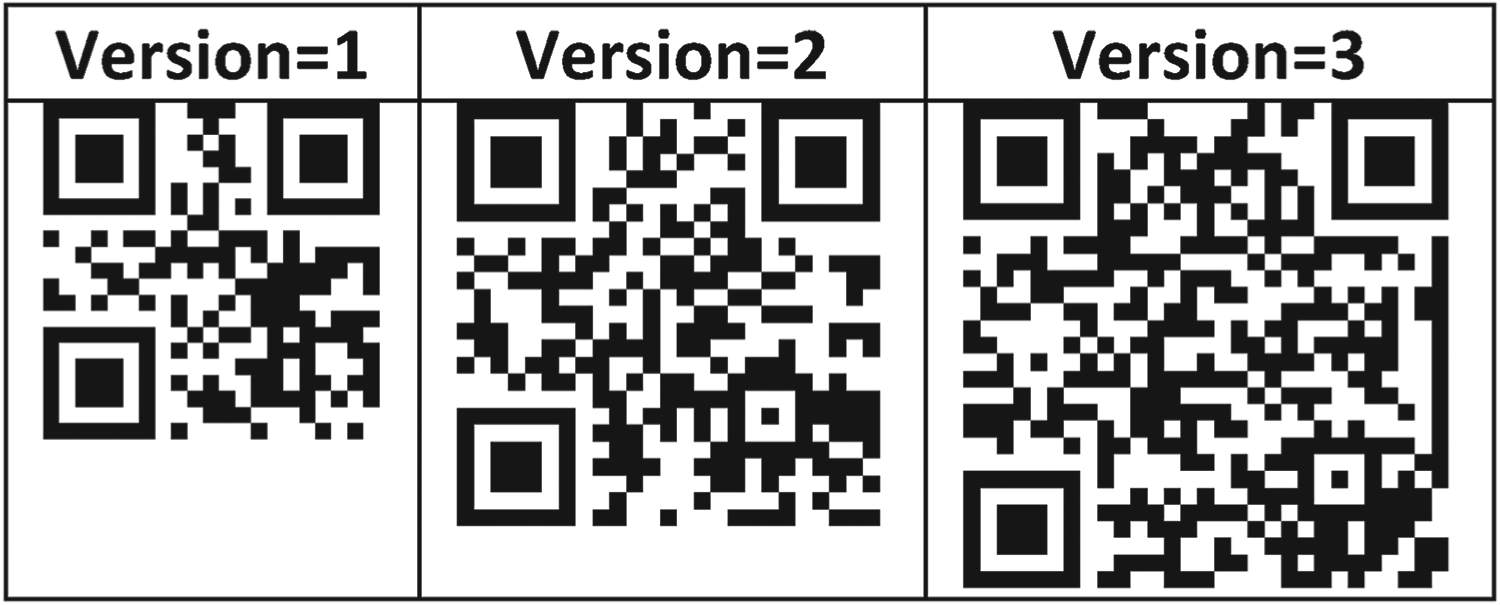
Samples of QR codes having the same content but different versions.
Figure 3 depicts the effect of the scale parameter in QR code formation. The contribution of the scale value makes the QR code appearance larger, like the version parameter, but it does not increase the capacity at scale, and shapes also remain unchanged. In the version, the character length of the content (value) it contains increases with an increase/change in the structure of the code.
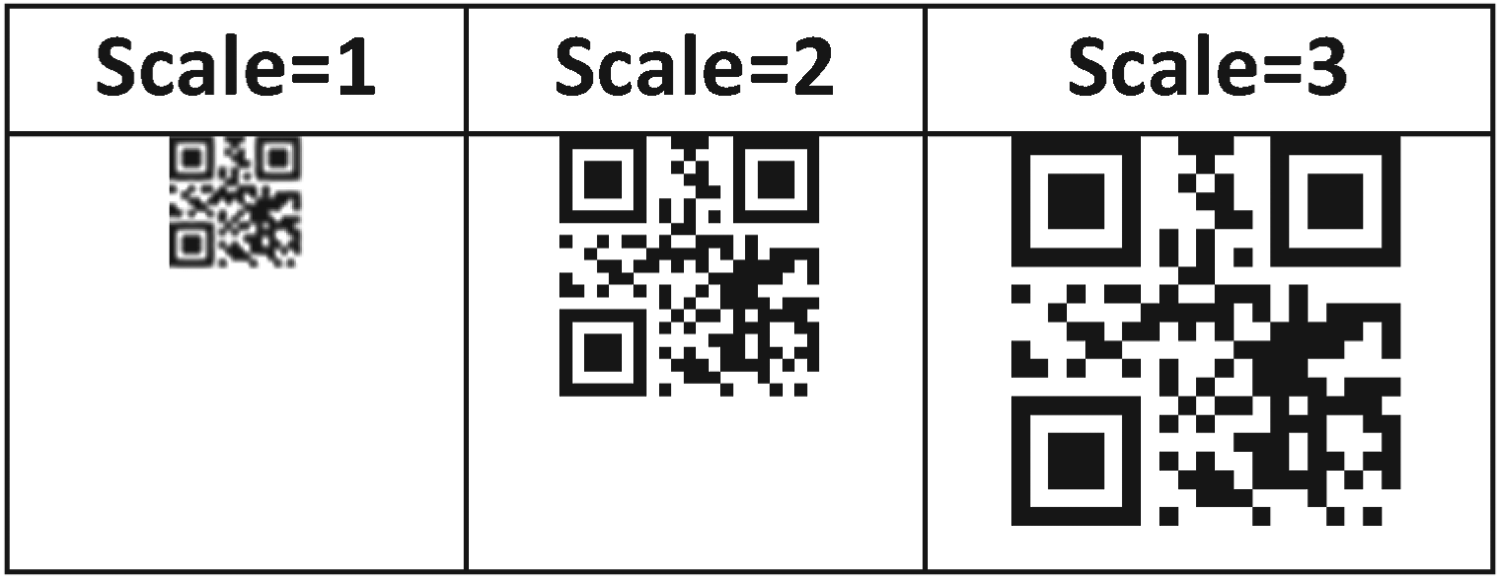
Samples of QR codes having the same content but different scales.
Figure 4 shows QR codes with different code mode parameters. When the mode is set to Alpha Numeric, Byte, or Numeric, the QR codes have different visual representations while code sizes remain the same. This may cause different values to be obtained by scanning via various QR code readers. To avoid this situation, it is considered better to use Alpha Numeric mode because of its default setting in widely used QR code readers.
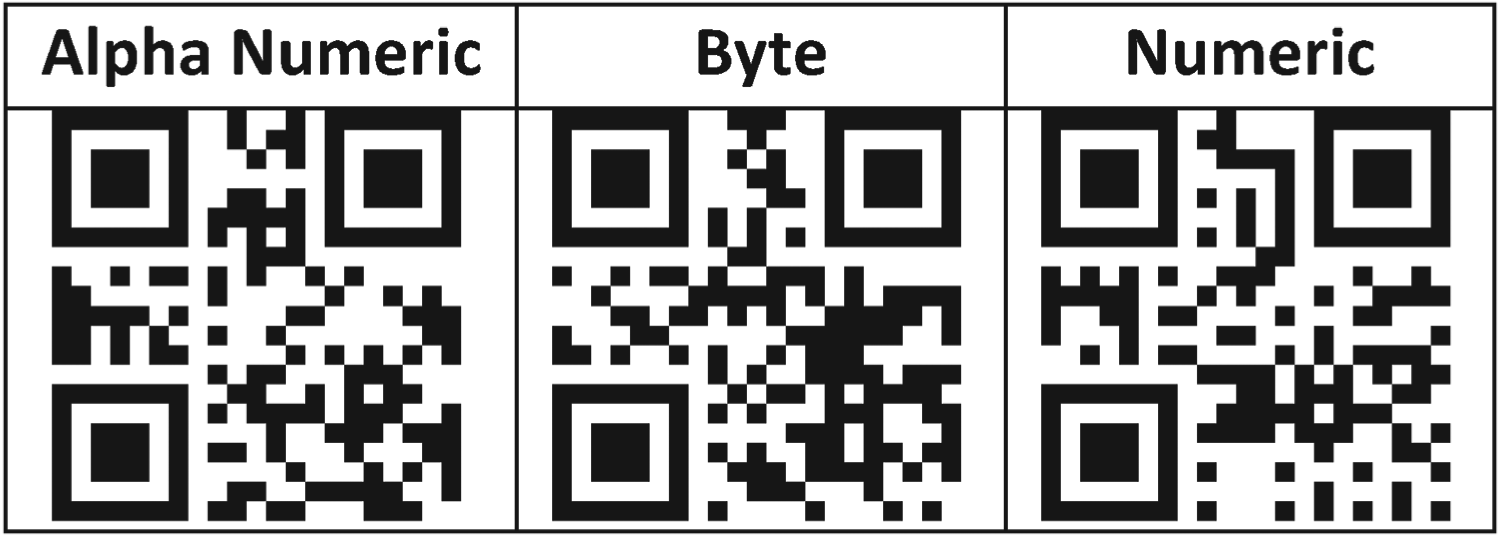
Samples of QR codes having the same content but different code modes.
Figure 5 illustrates four different error correction level parametric effects in QR code formation. Like others, it only changes the QR code's visual appearance, with each one adding different amounts of backup data depending on how much damage the QR code is expected to suffer in its intended environment and, hence, how much error correction may be required. The QR code becomes less dense as the error correction decreases from Level H to L even though it contains the same data/information (as a percentage: H = 30, Q = 25, M = 15, L = 7). A higher error correction level can make the QR code sustain more damage, but results in a larger number of columns and rows of modules required to store the original data plus the increasing amount of backup code words.
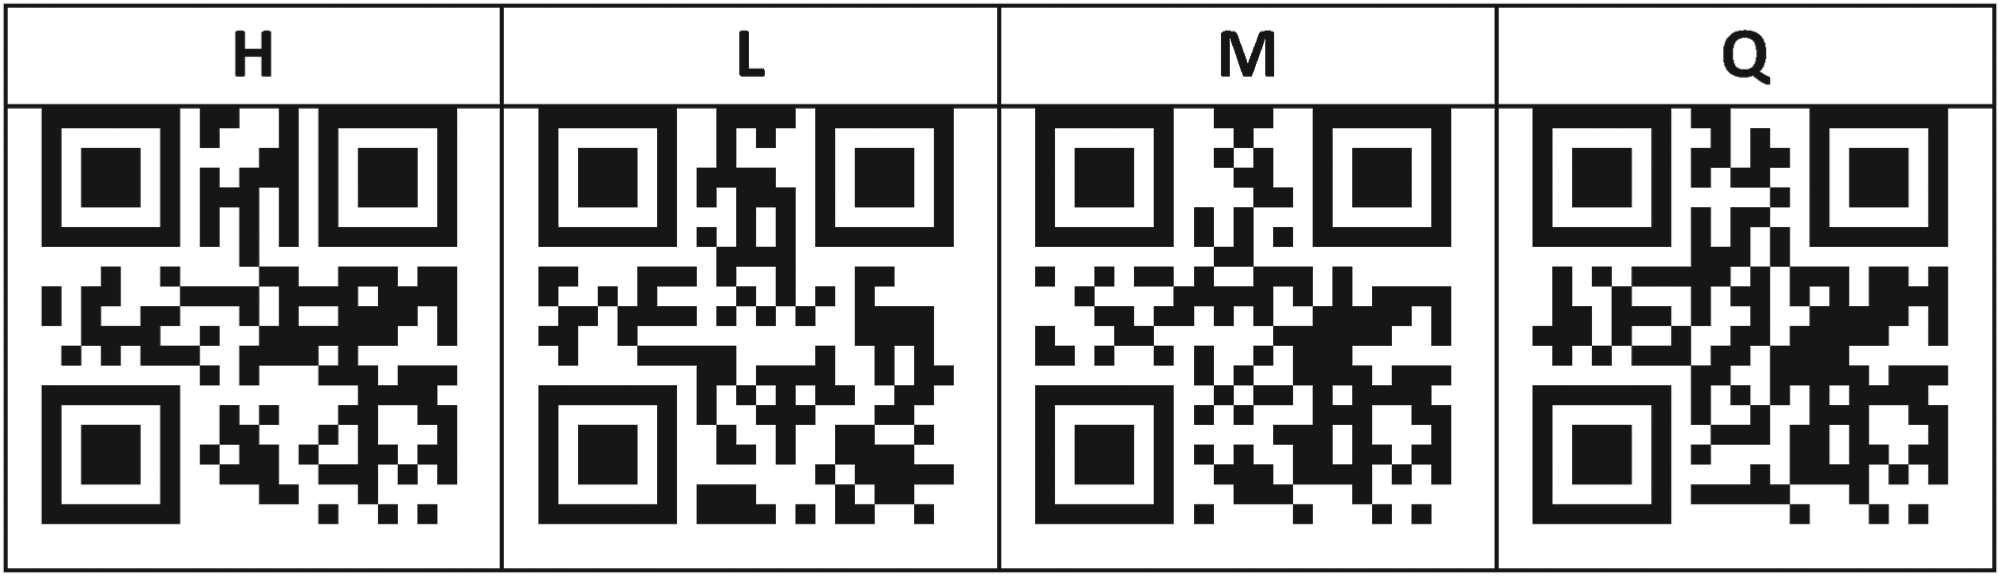
Samples of QR codes having the same content but different error correction levels.
Similar to image steganography, a two-layer QR code is a normal QR code that hides another QR code. In such QR codes, the upper layer contains public information. In contrast, the lower layer (hidden layer) encompasses content inaccessible by the standard QR code reader, such as the confidential information verification code. 20 It contains information that should not be obtained by anyone, such as a secret message6,21,22.
Figure 6 shows a sample of a two-layer QR code. The value (data) of the two-layer QR code is the same as that of a single-layer code. The reverse layer image shows the recovered QR code (hidden layer) contained in the two-level QR code, with preserved hidden layer value. Generally, QR codes are on a white background, but the reverse layer usually has a light gray background, which is generally not visible to users.
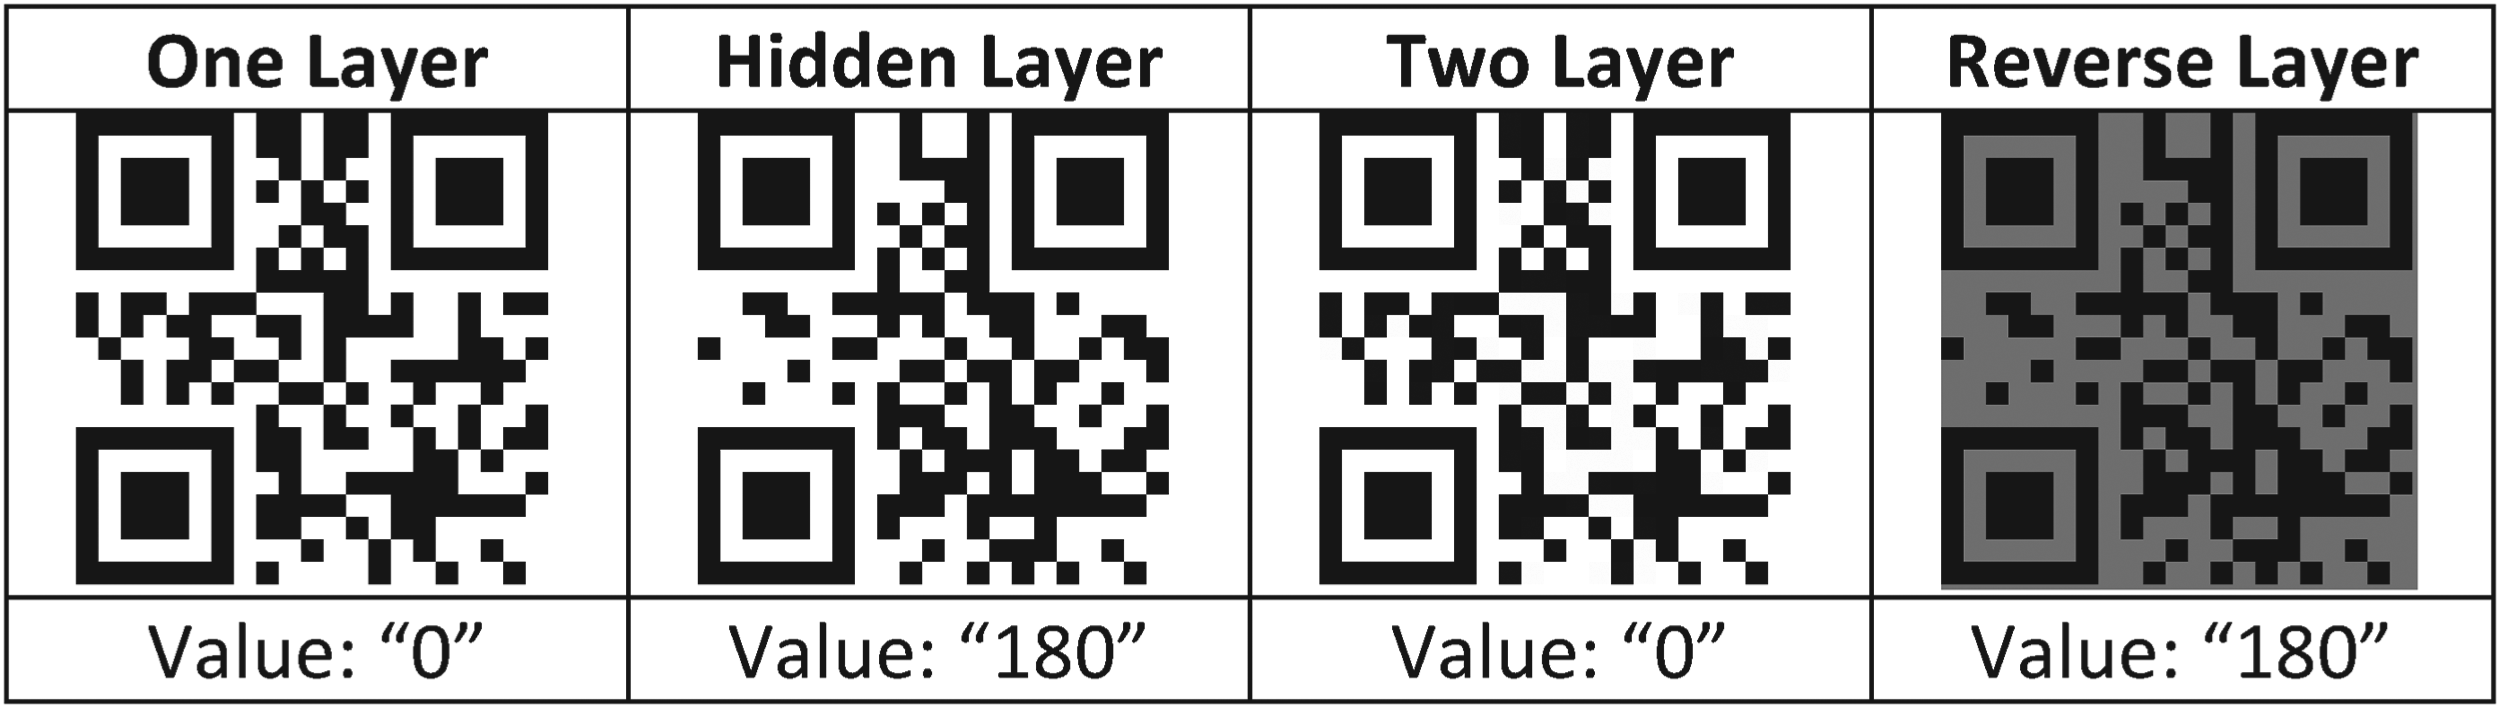
Example of two-level QR code creation for the data set.
The following steps are involved in the creation of a two-layer QR codes dataset:
QR codes with features are created according to the relevant data set rules (variable or fixed scale and version parameters) for the formation of the hidden (lower) and public (upper) layers. If the height and width dimensions of the QR codes as images are not equal, the height and width size of the image of the general QR code is equalized with the dimensions of the lower and upper ones. The hidden bit value is determined and set to 1 in the test processes. The shift bit value is calculated by subtracting the hidden bit value from 8. This value was used as 7 in the test. Visible and hidden mask values are calculated. The visible mask value 0XFF is found by shifting the hidden bit value 1 bit to the left, whereas the hidden mask value is found by shifting the 0XFF value with the shift of bit value, that is, by shifting 7 bits to the right. The operations in this section are repeated as the general QR image height and width dimensions. The corresponding bit of the visible and hidden image is read. For the red, green, and blue channels of the relevant pixel, the following operation occurs sequentially. The corresponding channel value of the visible bit value and the visible mask value are treated with il and (and). The corresponding channel value of the hidden bit value is shifted to the right by the shift bit and is subjected to the hidden mask and operation with this value. The last found value is added to the previously found values.
For this purpose, methods such as CNN and global and local feature extraction methods are used. The main purpose of CNN methods is to obtain important representation from the image under examination by utilizing various filters and using them as features. For initial analysis, ready models were exploited to the images, and the features were obtained rather than the customized CNN.
This study employed CNN-based pre-trained models since models such as VGG16 and Xception are ready and designed specifically for transfer learning (Figure 7, Figure 8). The VGG16 model 15 accepts pixel values of colored images as input and performs 3 × 3 convolution operations using several layers having 64, 128, 256, and 512 filters. Moreover, it performs 3 × 3 maximum pooling (extracting only the value with the highest pixel value of the region that the filter is interested in) and the ‘softmax’ function at the output. It is a model that aims to achieve value within the XCeption model 16 ; although operations are performed on various layers (but by returning some layer values in between), the operations are performed over one color channel, not 3 color channels.
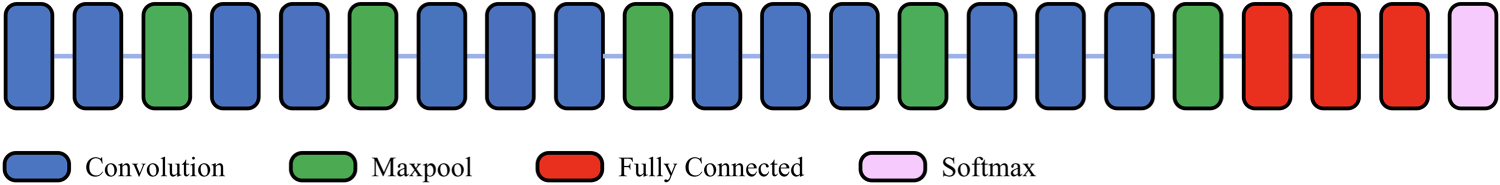
VGG16 model architecture. 23
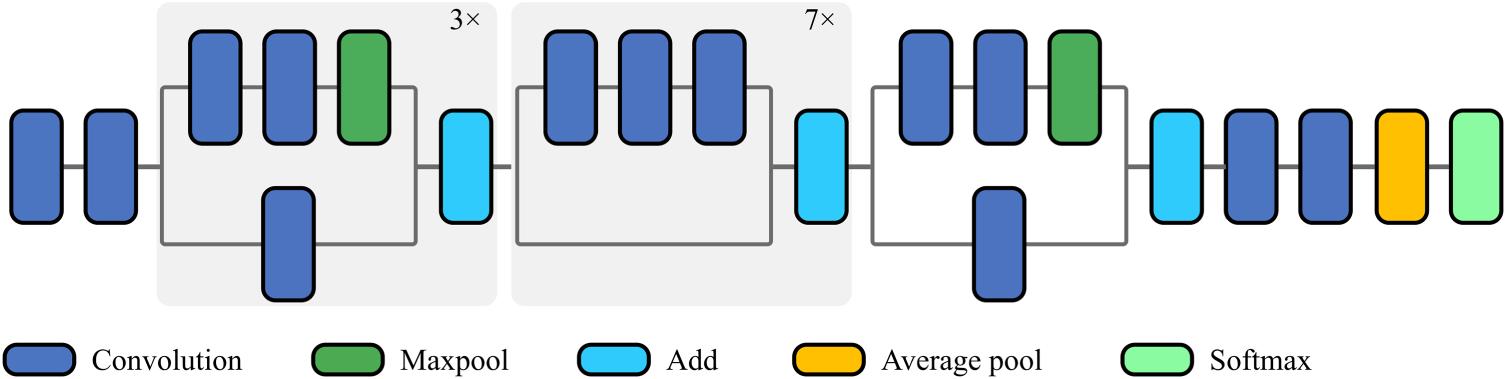
Xception model architecture. 23
In the histogram density feature extraction method, the histogram density values in the gray-scaled images are used as features. As a feature, the ratio of the number of pixels with each gray tone to the total number is used as a value. Thus, it provides 256 features for each image of varying sizes, as shown in Figure 9.
Example of histogram density feature extraction dataset.
The purpose of the classification process is to predict whether a QR code is 2-layer or 1-layer. For this, this study exploited various machine learning algorithms and DL approaches. The following section outlines the brief workings of these algorithms.
LR is an algorithm that aims to separate classes with a curve, as in linear regression. While linear regression uses a straight line for this curve, LR targets to draw a smoother curve between data points to separate classes using a logit function curve (S-shaped). An equation is produced as a model (see Figure 10). In this way, the created model can be integrated faster than other algorithms, as a model transfers in a different environment or by transmitting it to codes without transfer.
Logistic regression model example.
DT is a classification method that creates a model in the form of a tree structure consisting of decision nodes and leaf nodes according to features and targets. 24 The fundamental feature of DR is that a single tree can represent the created model. Thus, it can be expressed as a tree; therefore, at the test stage, the relevant tree nodes are traversed to determine the class of the test sample (see Figure 11). After several experiments and different combinations, for this study, the maximum depth of the DT is set to 10, with pruning activated, while the criterion is set to gain ratio. Moreover, it has a confidence of 0.1 with pre-pruning activated. The minimal gain and minimal leaf size are set to 0.01 and 2, respectively.
Decision tree model example.
RF resembles the DT algorithm in terms of the models it creates; however, it creates a multi-tree instead of a single tree (see Figure 12). RF is preferred, especially when the other model created with a single tree does not perform well for the problem at hand. For this study, we repeated experiments with various RF parameters. However, the RF that has 100 number of trees, a gain ratio criterion, and a depth of 10 with the confidence voting strategy performed best than other exploited RF models.
Random forest model example.
The DL algorithm is usually preferred more than other algorithms due to the increased processing power of computers. Generally, it is an artificial neural network with hidden layer(s). Its strength is that these hidden layers can vary and possess the desirable number of neurons to handle complex classification problems. For this study, various DL models were exploited. However, the model with two hidden layers, each with the size of 50 × 50, having a rectifier as an activation function and an automatic loss function, performed better than others. The suggested model is trained over 10 epochs.
Various parameters measure the classification result in the classification process. The most common of these is the truth value. Therefore, performance is analyzed in terms of accuracy against each class by dividing the correctly predicted samples by the total number of samples. Since the sample numbers of the classes examined in the article are equal, no other evaluation criterion is used.
This section mentions the steps for creating the test environment, which are generally shown below.
For this study, the following scenario was created regarding the attacker and the defender. Let an organization use two-layer QR code transmission in an insecure environment for message transmission. The attacker first works with machine learning to understand whether the QR code used by the system is original or steganographic. The defender does not want this situation to occur. In other words, the attacker wants the performance to be high, and the defender wants it to be low.
Experimental results for classification of layers based qr code
This section compares the classification results of two feature extraction techniques, including the CNN-based method and the histogram feature method. The experimented results of exploited classification models to distinguish the QR code based on the number of layers for all the four sub-datasets created with different parametric values are evaluated in terms of accuracy scale.
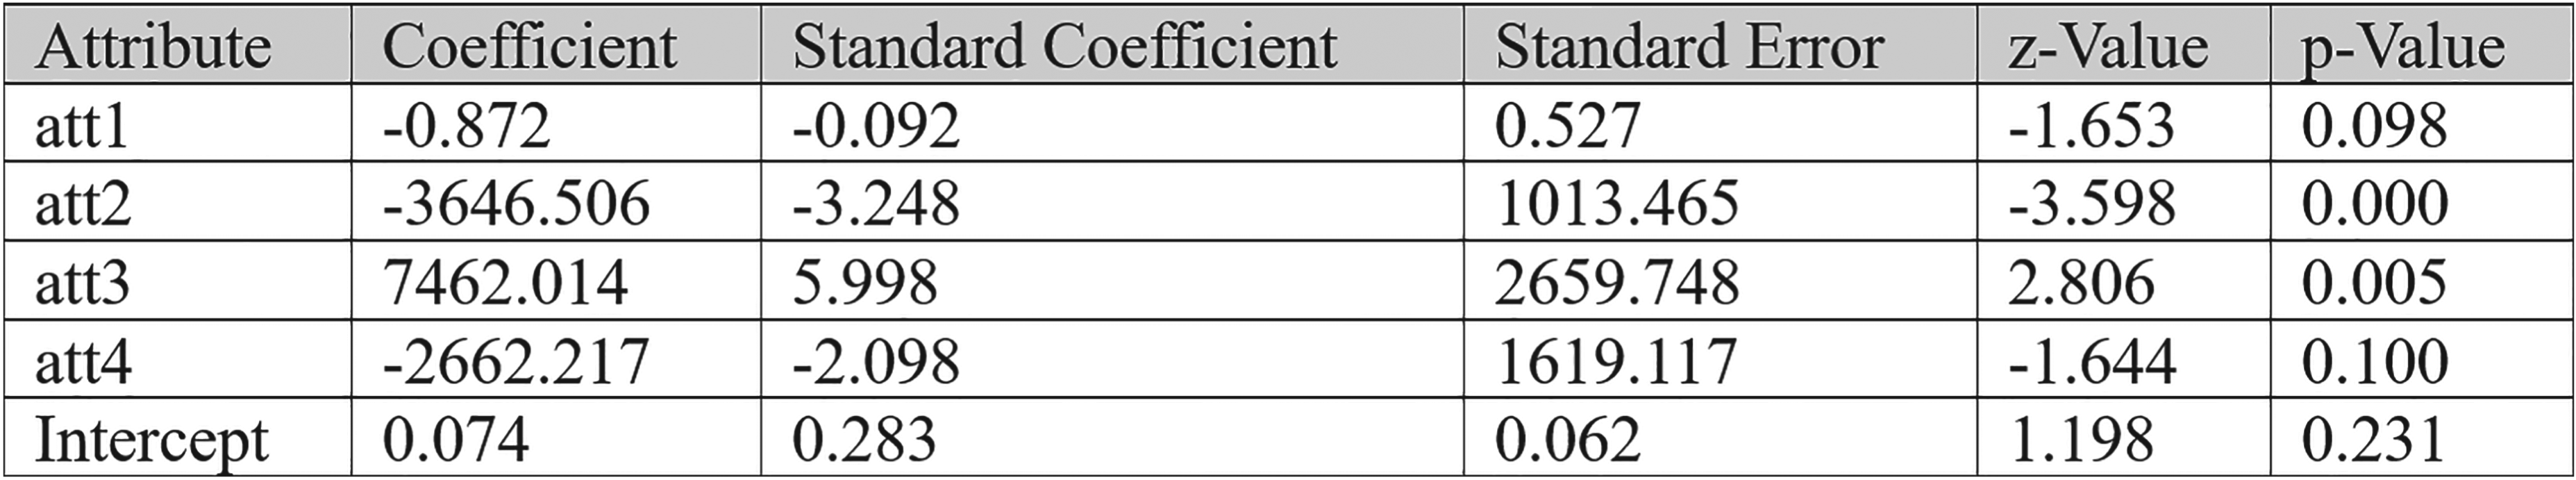
For QR code classification, this study first incorporated state-of-the-art models (VGG16 and Xception) along with a CNN-based model. Even though we exploited various combinations of CNN layers, we only succeeded in achieving an accuracy of 50% for all four different variants of QR code datasets. Table 1 shows the accuracy achieved by the CNN model for VGG16 and Xception nets. It is evident from Table 1 that the models achieved unsatisfactory results even when the dataset has an equal number of samples for each class. Thus, next, this study exploits the histogram feature density technique along with various machine learning classification algorithms to secure better results.
The performance comparison of several convolutional neural network-based state-of-the-art models to classify the QR codes.
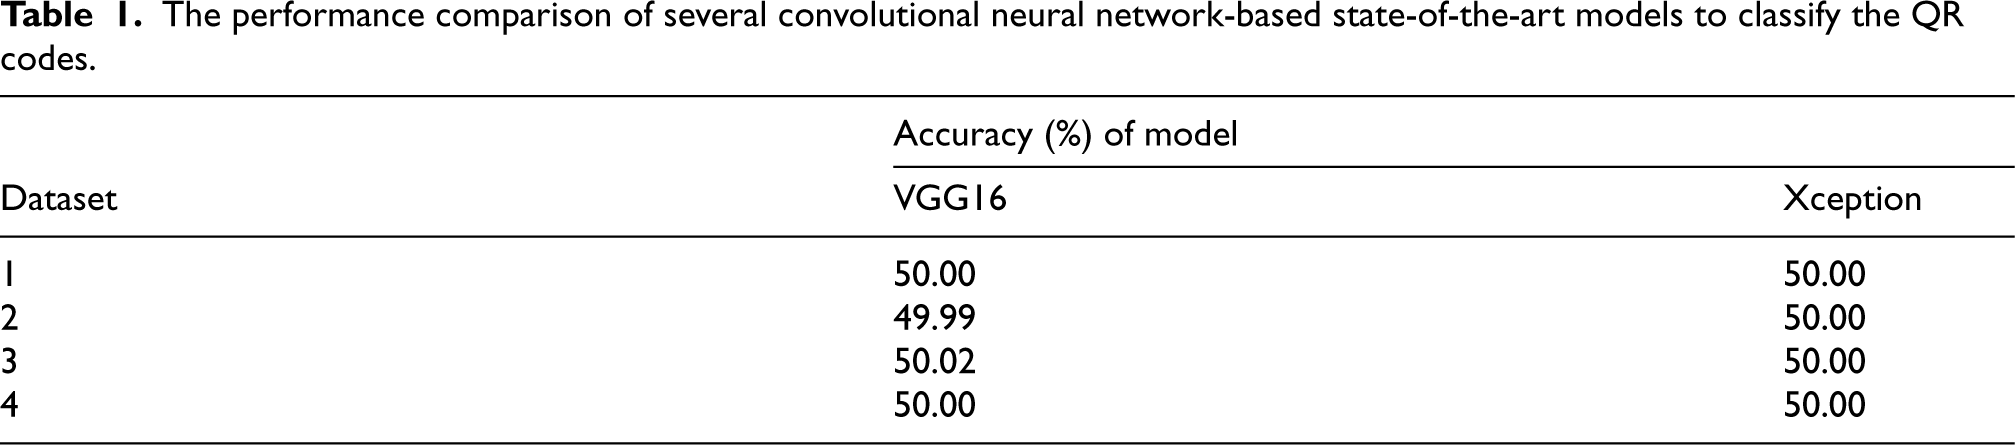
The performance comparison of several convolutional neural network-based state-of-the-art models to classify the QR codes.
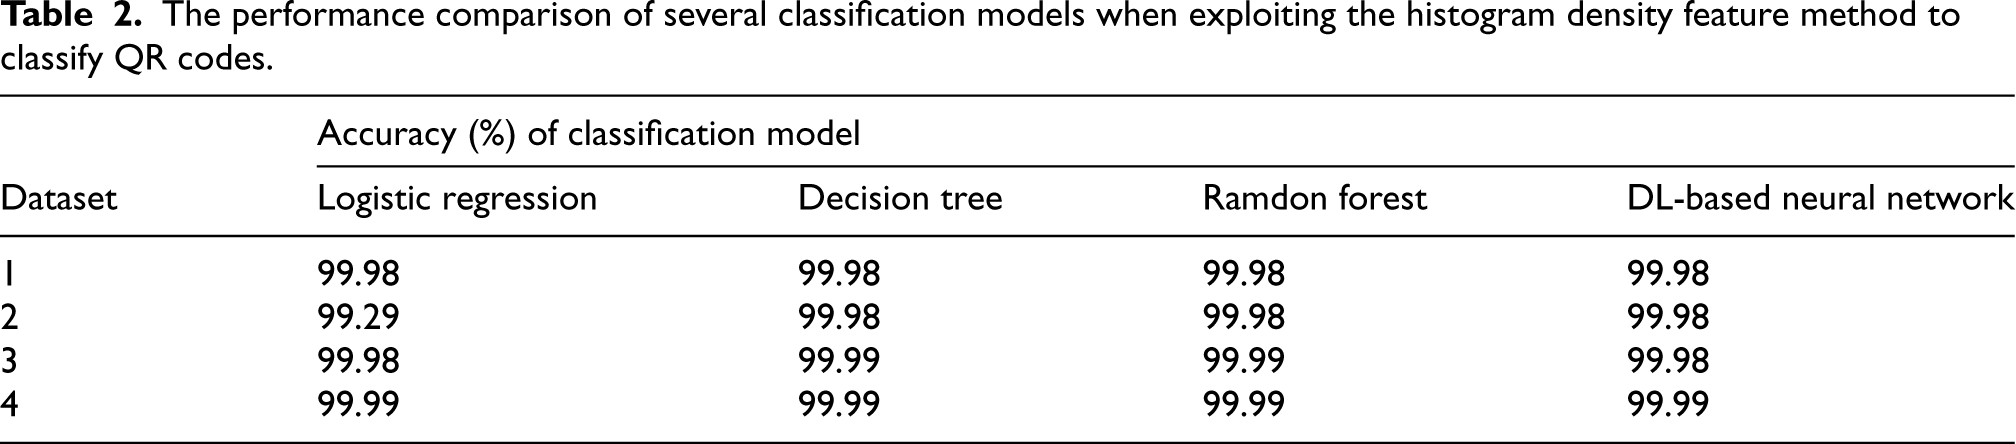
This study extends the experiments by utilizing the histogram feature extraction technique. These extracted features are later fed to LR, DT, RF, and DL-based neural network models. Table 2 outlines the performance of these four classification models when trained and tested over features extracted by the histogram density feature technique. It is notable from Table 2 that all suggested models performed well and attained an accuracy of 99.98% or above, except for LR, which secured 99.29% when trained with a second sub-dataset (QR codes with the same version value but with different scale values). In other words, in this case, the defender will be able to use the system's different classification algorithm for QR codes with different features or with the same feature that has completed the process for this condition. In the same situation, the attacker tried to produce a new version of QR codes to reduce the system's success. For a better understanding of the types of main and sub-datasets created, readers are encouraged to read Section 2.1 and the beginning of Section 3.
The performance comparison of several classification models when exploiting the histogram density feature method to classify QR codes.
When the tables are examined for the attacker and the defender, the attacker was successful with the histogram density feature extraction method. In other words, it understands that the transmitted code in all datasets is not the original (single-layer) QR code.
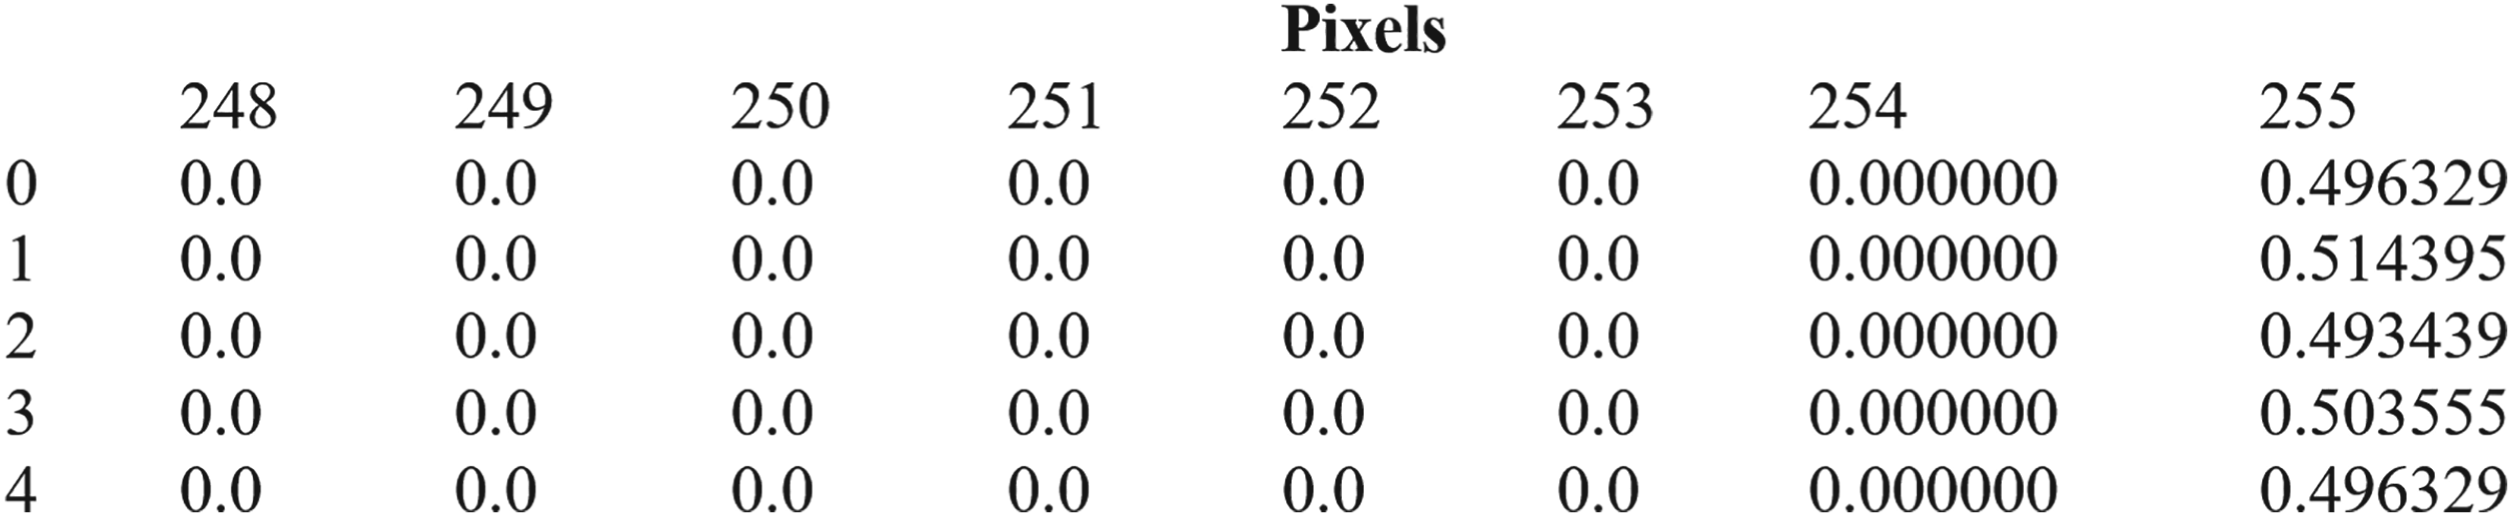
The attacker understood that the QR code used in the transmission (described in the previous section) was a special QR code. As the next step, the attacker examined the histogram intensity values of the original and system QR codes (see Figure 13). The attacker determined that single layers have only 0th and 255th gray intensity values, while bilayers have 0th, 1st, and 254th, 255th gray intensity values.
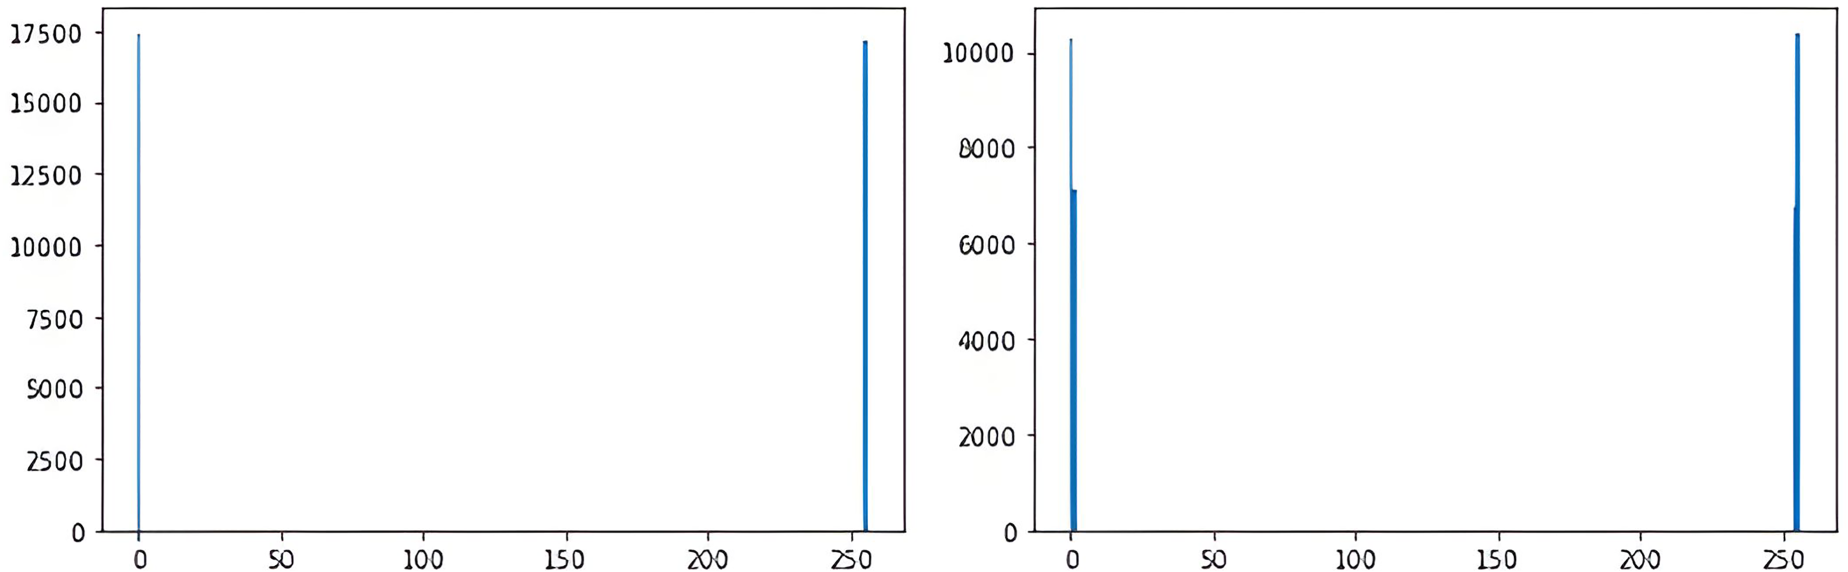
Example of single-layer (left) and two-layer (right) QR code histogram chart.
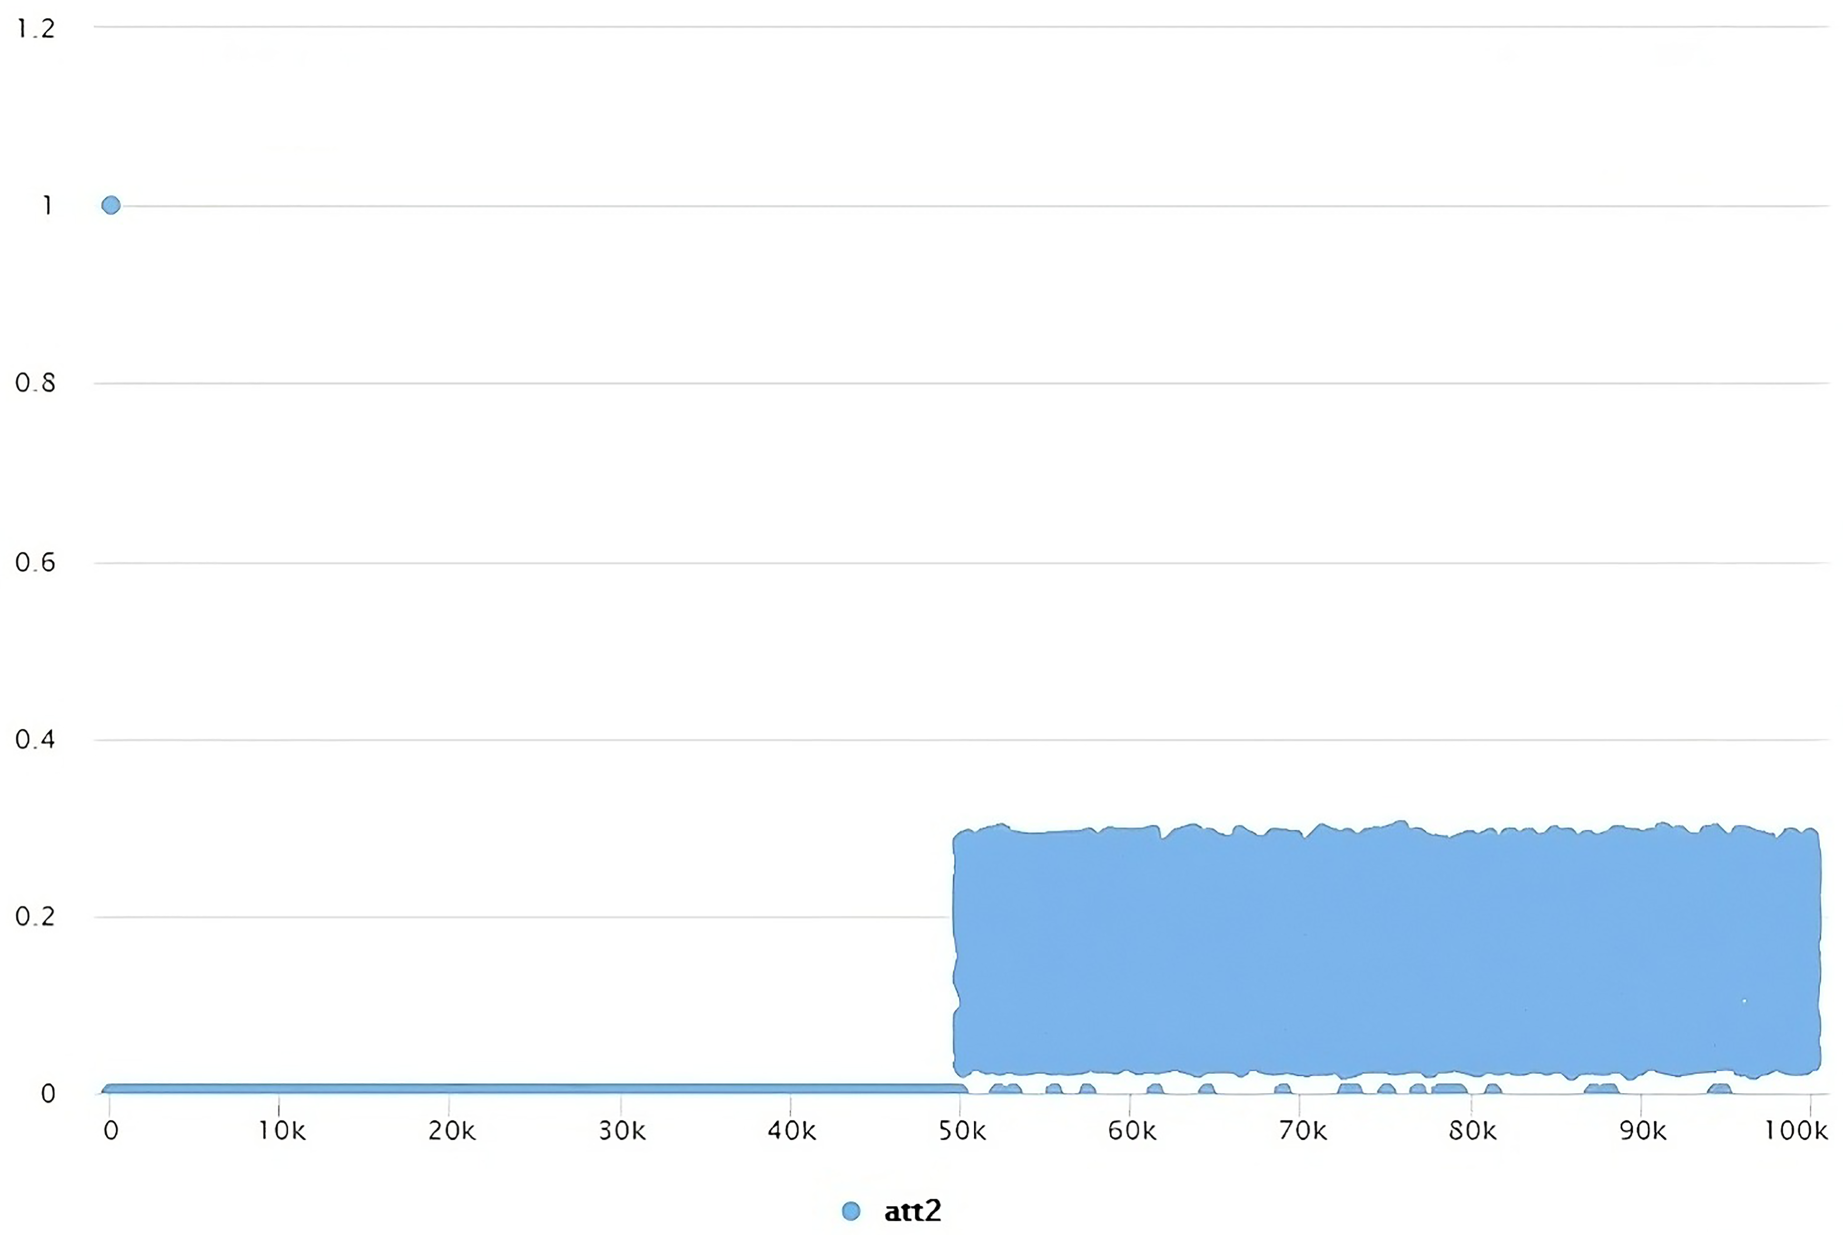
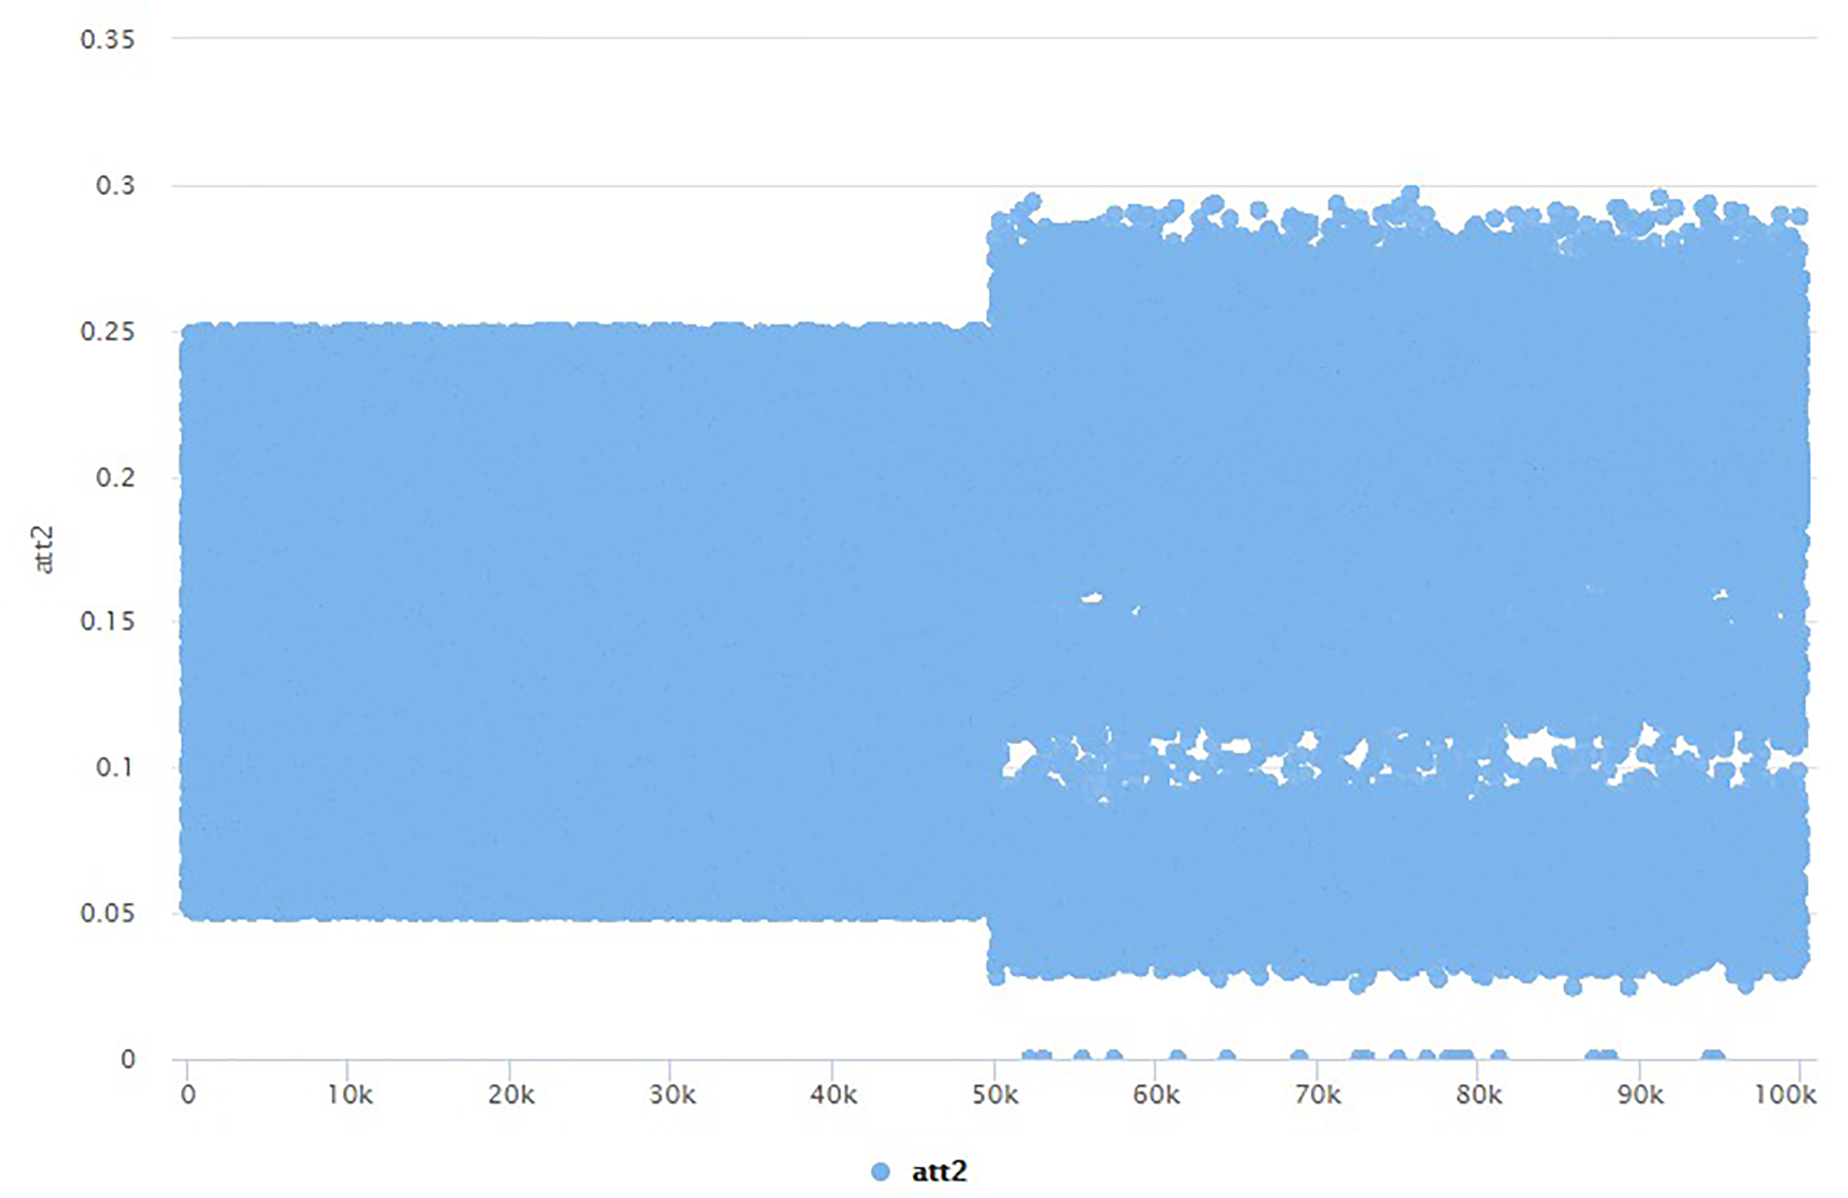
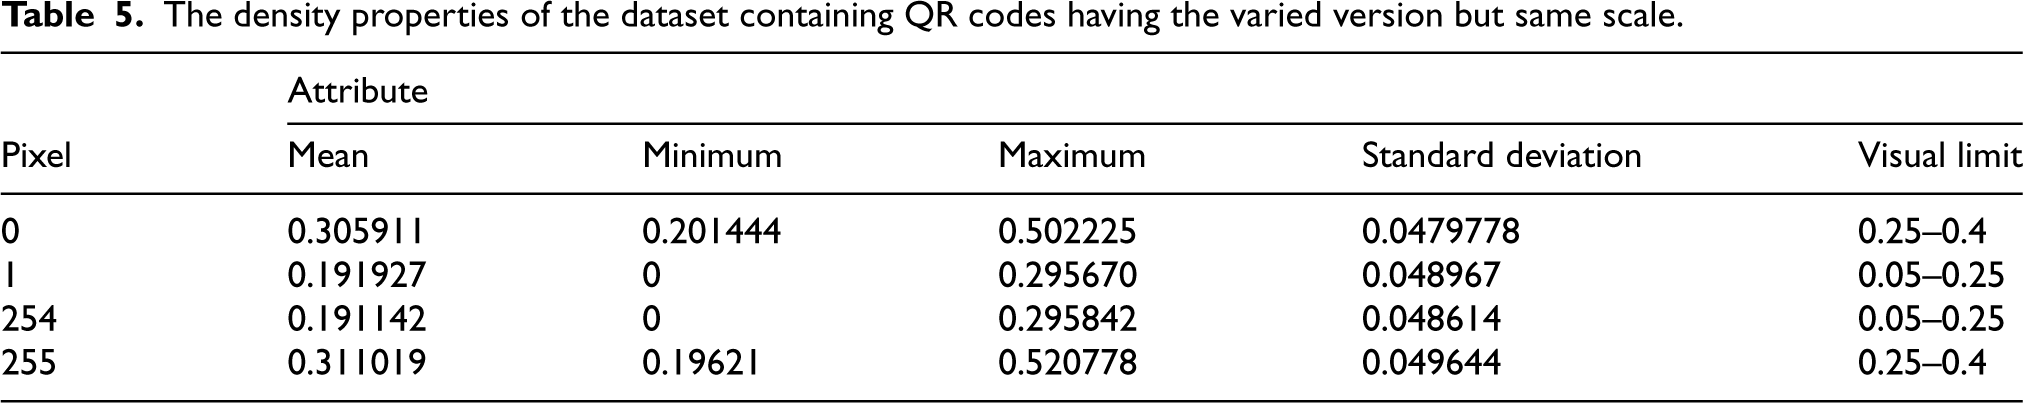
In the next step, the attacker wants to generate QR codes that are close to the type used by the system. For this, firstly, QR code strategies to be produced for the main four data sets have been determined so that the QR codes have the 1st and 256th gray levels. For this step, as an example, the distribution of the gray levels of the intensities of the QR codes used by the system, as in Figure 14, was examined. As listed in Tables 3 to 6, the arithmetic mean, minimum value, maximum value, standard deviation, and visual limit value of the intensity values were used as offensive examination parameters. The visual limit value and the limits where the values have observed high intensity were determined as the observation value. For example, this situation is determined as 0.05 and 0.25 in Figure 14. The parameter determination process has been determined for all main data sets specific to those sets. The main purpose of this step is to successfully generate the histogram density values of the fake system QR codes to be produced (see Figure 15).
For the first data set gray level density graph (left Side one layer–right Side two layer QR code).
For the first v5 data set gray level density graph (left Side one layer–right Side two layer QR code).
The density properties of the dataset containing QR codes having the same version and the same scale.

The density properties of the dataset containing QR codes having the same version but varied scale.
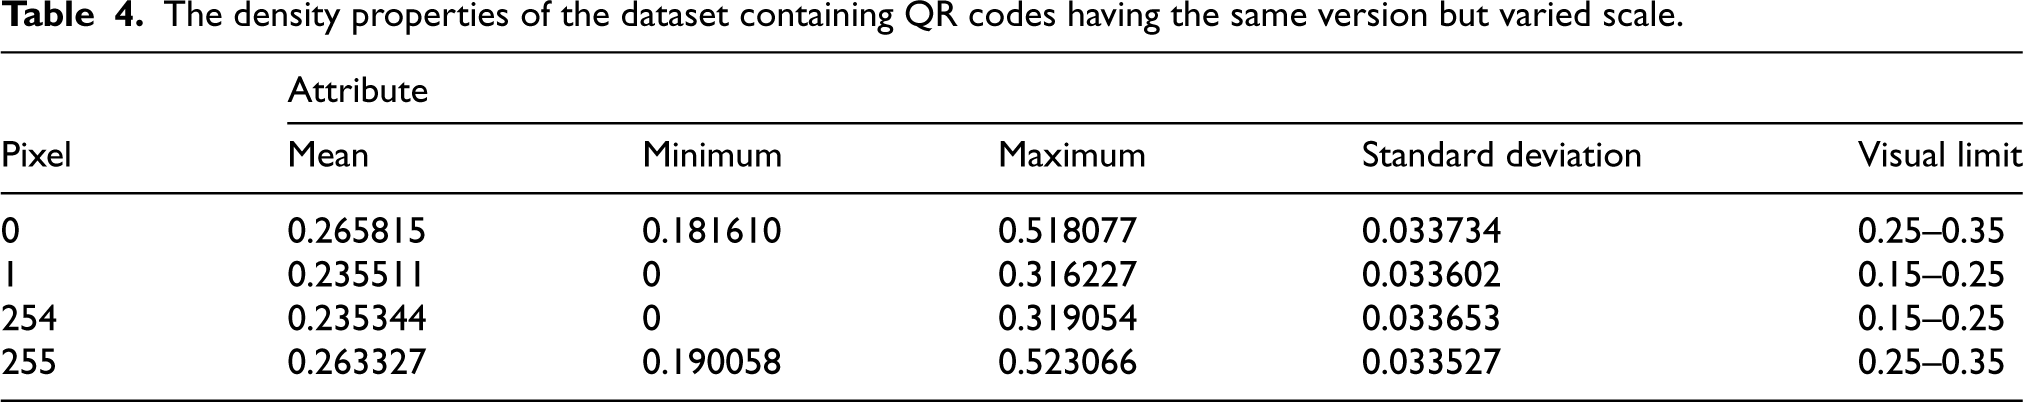
The density properties of the dataset containing QR codes having the varied version but same scale.
The density properties of the dataset containing QR codes having the varied version and varied scales.

In the next step, the attacker wanted to generate QR codes that would not be noticed in transmission by the above parameters. The attacker will create five datasets. The definitions of these data sets are as follows: The following explanation describes how to pass the value of the first attribute to the first two attributes. The exact process is done for the last attribute's value transfer to the last two attributes.
A random value is chosen from
The test results are explained as follows. In this section, the acceptable accuracy value is determined as 95% and above. Between 95% and 75%, the situation that needs improvement is accepted as six worse situations. For the attacker, the accuracy values in these tables are expected to be low (because it is not noticed by the system), while for the defender, these values are expected to be high (because the system notices it). Among these values, the value is used as the maximum distribution value for that sample in the value distribution.
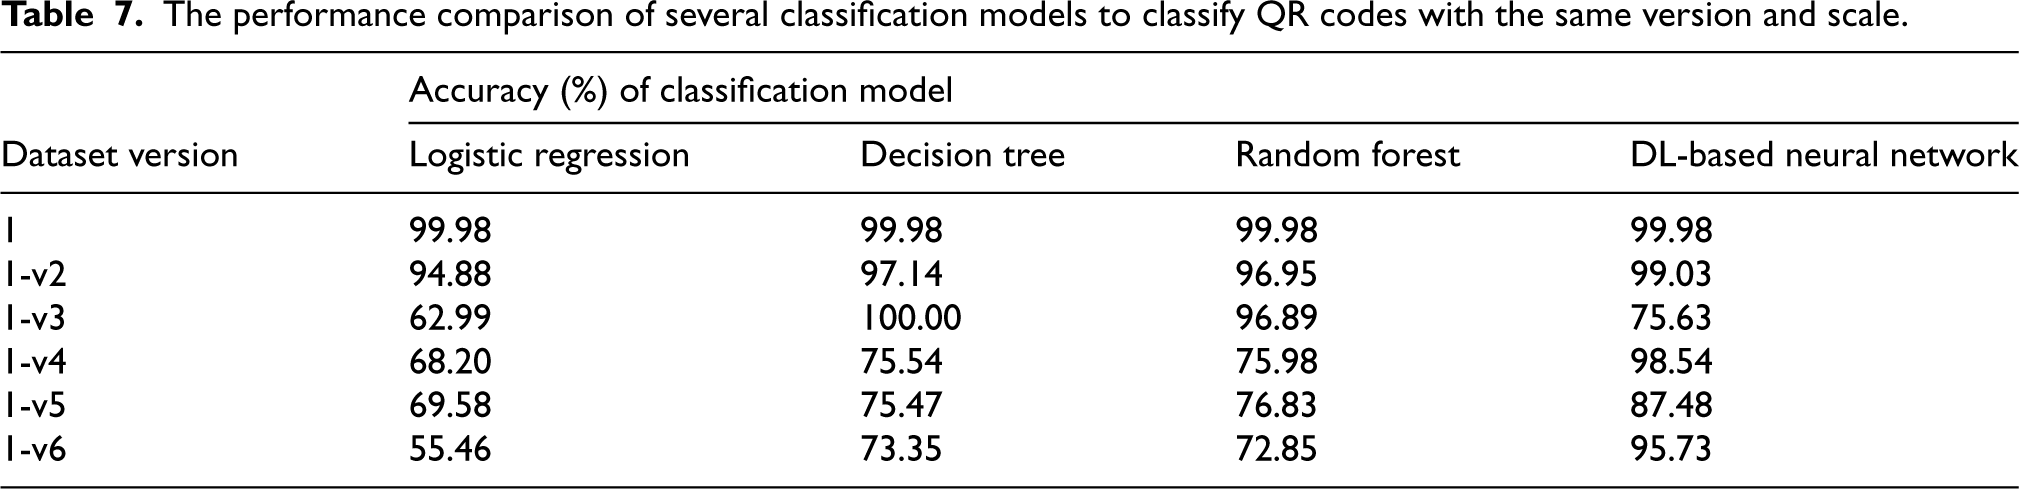
When Table 7 is examined, it is seen that the algorithm that performs best is DL. From the attacker's point of view, the v6 state has the best. In this case, only DL secured a good response, while LR performed worst. The success of the models produced by DT and RF is less than usable. LR has been observed to adapt worse to all versions. Because the sizes of both the upper and lower QR codes of the data sets in this table are equal. The fact that LR is the most suitable algorithm for linear problems has become a disadvantage in suitable attacks. DT and RF models can be used for v2 and v3 cases, however, not for other cases.
The performance comparison of several classification models to classify QR codes with the same version and scale.
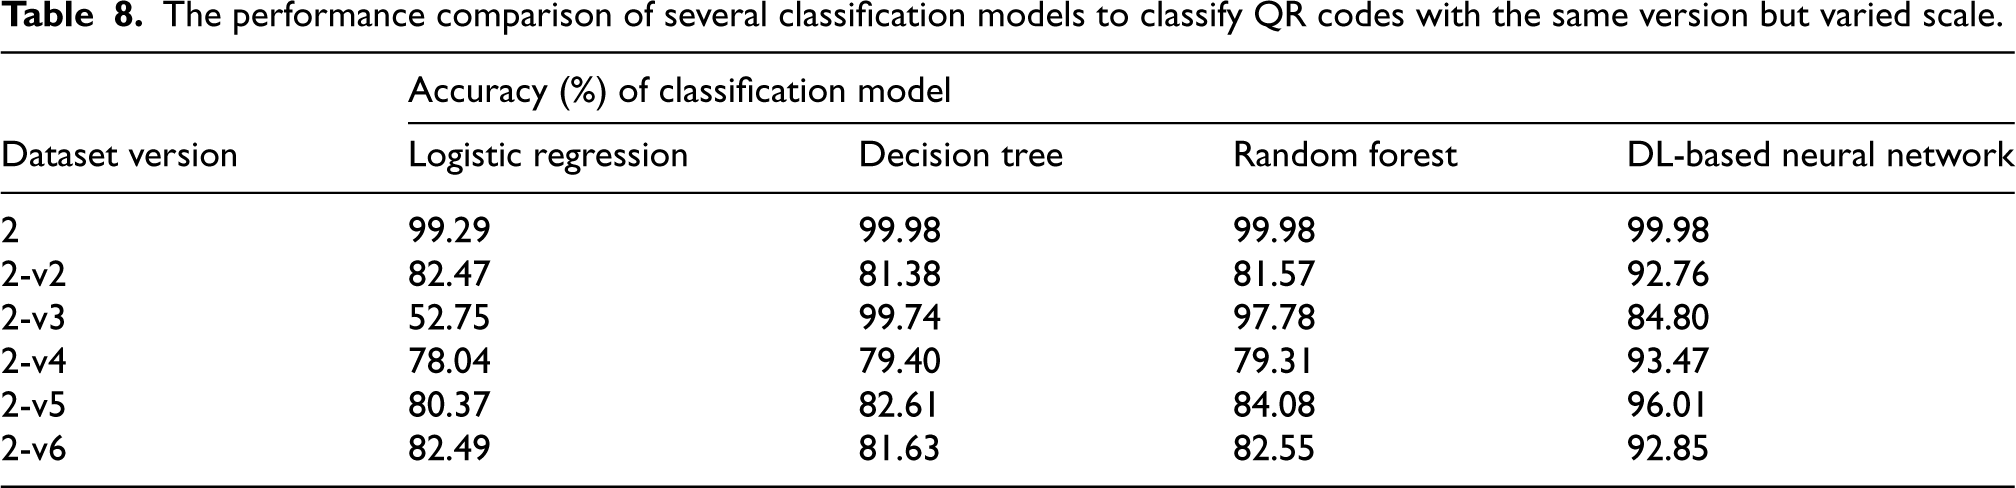
When Table 8 is examined, it is observed that LR performed better on this dataset (same version but variable scale) than the previously discussed dataset (same version, same scale). However, it still couldn’t outperform the other models and its performance even degraded for the v3 case (worst case). On the other hand, the DL-based model outperformed other models (LR, DT, RF) for all versions of the dataset (v2, v4, v5, and v6) by maintaining an accuracy of 92.76% or above, but it performed average for v3 dataset with an accuracy of 84.80% only. For v3, DT secured the best accuracy of 99.74%.
The performance comparison of several classification models to classify QR codes with the same version but varied scale.
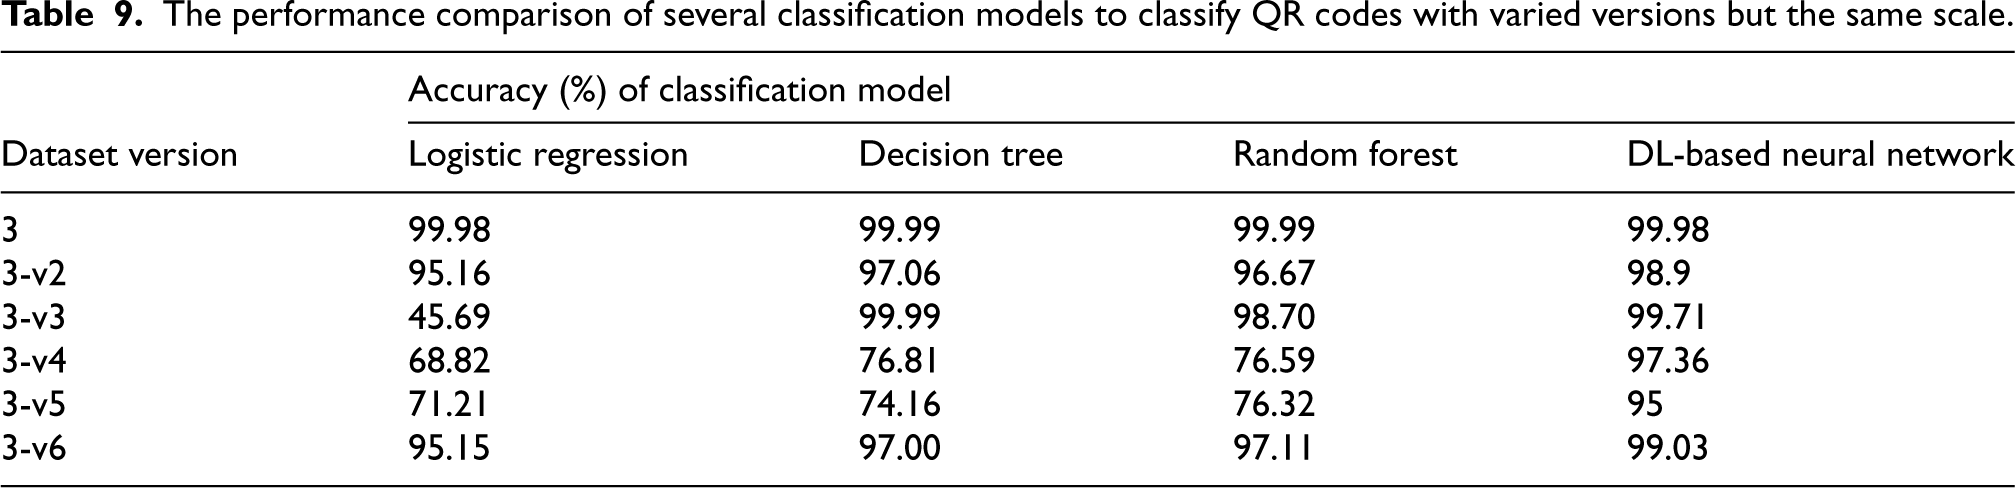
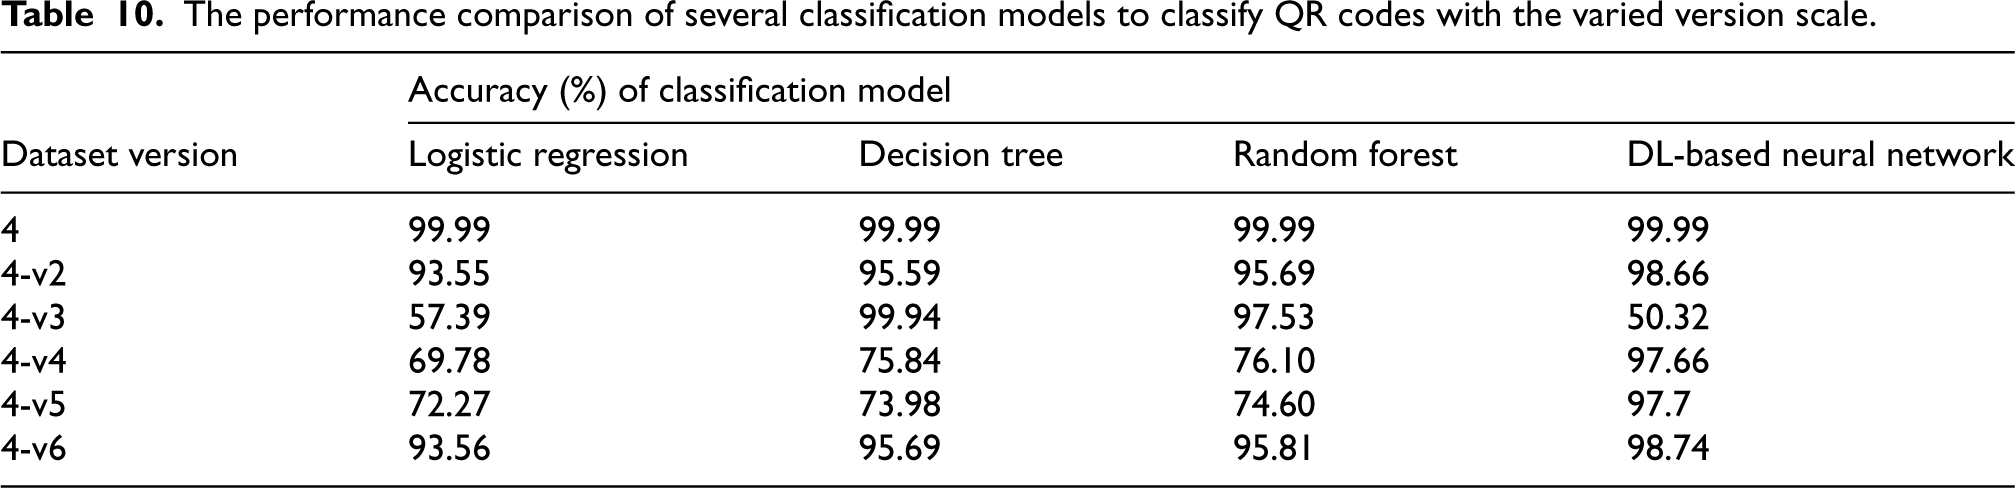
Similarly, Table 9 notes that the suggested DL-based model achieved the highest accuracies for all versions (v2, v3, v4, v5, and v6) of the dataset having QR codes with variable versions but the same scale. DL-based model attained a minimum accuracy of 95% for v5, while for other versions, the accuracies are better. For v5, other exploited models (LR, DT, and RF) hardly secured accuracies between 71% and 77%. For the dataset containing a QR code with variable version and variable scale, the performance of all models varies. For v3, DT outperformed other models, however, for other versions DL-based model performed well. Similarly Table 10 presents results with varied version scale.
The performance comparison of several classification models to classify QR codes with varied versions but the same scale.
The performance comparison of several classification models to classify QR codes with the varied version scale.
Of the data sets, v4 and v5 were observed as the most effective methods to reduce the attacker's classification accuracy. In other words, working with minimum and maximum values as a tabular or visual boundary has been the most aggressive method. As a result, a solution was found for the defender by changing to a better classification algorithm in each case.
It has been observed that the CNN feature generation method is not efficient in the classification of layer-based QR codes, while the histogram density feature extraction method is effective. In the histogram density feature extraction method, the suggested DL-based neural network model has the highest accuracy value in most of the cases. It is noted that the most defensive classification algorithm against sub-datasets in various versions is LR due to its more effectiveness against linear classification, and because the attack is linear simulation, its defense against attacks is lower. The results of the DT and RF algorithms are close to each other. Among them, a small amount of accuracy is generally in favor of RF. If the dimensions of the hidden and open QR codes are the same, the histogram density feature selection and DL model perform better than others.
The most general information extracted; The more similar the features of the QR codes to be examined, the more likely the attacker will achieve his goal. It is recommended to work with QR codes with variable features in the systems studied. The same results may not be obtained with the two-layer QR codes used by all the different systems obtained from this study. In other words, two-layer QR codes created with different algorithms can be successfully classified by the CNN method, or different results can be obtained.
Conclusion
In conclusion, the escalating utilization of QR codes propelled by the widespread availability of smart devices underscores the importance of exploring their security vulnerabilities. This study delved into the intricacies of QR code encryption and decryption, aiming to develop a message-hiding mechanism while preserving the code's integrity. Through the utilization of various machine learning algorithms and the creation of diverse QR image datasets, the efficacy of the proposed scheme was thoroughly assessed. Impressively, adapting the histogram density method with a DL model yielded a remarkable success rate of approximately 99.98%, showcasing the potential of this approach in fortifying QR code security. Additionally, the simulation of single-layer QR codes mimicking more complex systems provided valuable insights into potential vulnerabilities, with the DL model demonstrating notable effectiveness in classification tasks. These findings underscore the importance of continued research and innovation in securing QR code technology as it permeates various aspects of modern life. However, there is still a need for work to classify the QR code images with a single dataset that contains more versions of QR codes having different parametric values.
Footnotes
Funding
The authors received no financial support for the research, authorship, and/or publication of this article.
Declaration of conflicting interests
The authors declared no potential conflicts of interest with respect to the research, authorship, and/or publication of this article.
Dataset availability
The dataset will be provided on request.