
Abstract
This research proposes a multi-stage intelligent optimization framework to enhance knowledge graphs’ visual construction and semantic reasoning capabilities by integrating multiple intelligent optimization algorithms into the layout and analysis process. Considering the complexity and evolving structure of knowledge graph data, analyzing knowledge graph data visually to reveal the internal structure and dynamic evolution has become a key issue. Firstly, the particle swarm optimization (PSO) algorithm is applied to reduce feature dimensionality in large-scale datasets, optimize data quality, and select features useful for knowledge graph construction and analysis. Then, the ant colony optimization (ACO) algorithm is adopted to optimize the path relationship between entities, improving the structural integrity of the knowledge graph and the relationship reasoning accuracy. Next, the grey wolf optimizer (GWO) algorithm is utilized to search for semantic associations in large-scale knowledge graphs efficiently, improving knowledge graphs’ reasoning and semantic understanding capabilities. Finally, the firefly algorithm (FA) is used to optimize node distance and path visualization in the graph layout. Three optimal feature subsets
Keywords
Introduction
Using intelligent optimization algorithms to construct visualizations of knowledge graph datasets is an innovative method combining data analysis with artificial intelligence (AI) technology. It can significantly improve the structured display of knowledge graph data and present the relationships between complex data in a clearer, more intuitive, and interactively friendly manner. As a form of structured data using nodes to represent entities and edges to represent the relationships between entities, knowledge graphs play a key role in many fields, including search engine optimization, recommendation systems, medical diagnosis, and financial risk control. The core challenge of its visualization is to lay out thousands of nodes and edges in a limited space reasonably to avoid problems such as node overlap and confusing connections while ensuring that users can quickly obtain necessary information and deeply understand data relationships. Traditional visual layout algorithms, such as force-directed and hierarchical layout algorithms, perform well on small-scale datasets but often have problems such as low efficiency and uneven node distribution when faced with structurally complex or dense networks. Several benchmark visual layout algorithms have been widely applied to graph drawing tasks. These approaches typically utilize simulated physical models to determine node positions based on attractive and repulsive forces. The Fruchterman-Reingold algorithm distributes nodes by minimizing energy to achieve spatial balance. ForceAtlas2 enhances layout continuity through force-based iterative calculations. These methods yield acceptable results on moderate-sized networks but are prone to issues such as unstable convergence and visual clutter when applied to knowledge graphs with high structural complexity. Compared with these classical algorithms, the layout strategy based on intelligent optimization shows better adaptability in maintaining node separation, reducing-edge crossings, and preserving overall structural clarity during visualization. Traditional visualization methods often use dimensionality reduction techniques to enhance the interpretability of data distribution when dealing with high-dimensional and complex-structured knowledge graph data. As mainstream nonlinear dimensionality reduction methods, t-SNE and UMAP embed high-dimensional nodes into two-dimensional space by maintaining local or global structural information, assisting in node clustering and the display of semantic distribution, and improving visual cognition. When used in conjunction with force-directed layout, these methods can be used to initialize node positions or as a post-processing step to optimize layout stability. However, due to its sensitivity to parameters, high computational complexity, and poor stability when dealing with ultra-large-scale graph structures, it is not used as the main algorithm framework in this study but is used as a baseline method to compare and analyze its capabilities in local clustering performance and spatial balance, and to assist in verifying the improvement effect of the proposed intelligent optimization layout strategy in terms of visibility and structural integrity. To this end, applying intelligent optimization algorithms provides a new idea to solve these limitations. These algorithms (such as genetic algorithms, PSO algorithms, simulated annealing algorithms, ACO algorithms, etc.) achieve dynamic optimization of node spatial positions and edge connections by simulating evolution, swarm collaboration, or energy minimization processes in nature, improving the effectiveness of information presentation while ensuring the aesthetics of the layout. Taking the genetic algorithm as an example, the algorithm gradually optimizes the layout results by performing operations such as selection, crossover, and mutation on the node layout. Specifically, nodes with high-frequency interactions are aggregated into closer spatial areas during the optimization process. In contrast, nodes with low-frequency interactions are dispersed to reduce visual interference, forming a hierarchical and logically clear structure. This method can significantly reduce node overlap and edge crossing, making it easier for users to focus on core information when browsing the knowledge graph. In addition, the PSO algorithm and simulated annealing algorithm can dynamically adjust the structure of local areas while optimizing the global layout, achieving a balance between global and local in the visualization of complex networks. The knowledge graph visualization combined with an intelligent optimization algorithm also has good scalability. For example, by embedding user interaction functions, users can adjust layout parameters dynamically or select a specific view range in the visualization interface, improving the practicality and user experience of the knowledge graph. In the future, as the structural heterogeneity and complexity of knowledge graph data continue to grow, the further combination of intelligent optimization algorithms and deep learning technologies is expected to achieve more intelligent layout strategies, allowing the visualization of knowledge graphs to adapt to multi-scenario and multi-demand application environments.
The PSO algorithm is based on swarm intelligence. Through dynamic adjustment of particles, it seeks the global optimal layout solution, making the overall structure clear and the connections concise. The simulated annealing algorithm optimizes the energy function of the graph layout by combining random search with probabilistic hopping to avoid falling into the local optimum. In building knowledge graph visualization, intelligent optimization algorithms can make precise adjustments based on the specific features of the data (such as the importance of nodes and the weight and directionality of edges). For example, high-weight nodes can be centrally arranged through optimization algorithms to form the core area of the graph. The weight and direction of the edge are intuitively expressed through line thickness and arrow direction. In addition, the intelligent optimization algorithm also supports customized requirements, such as highlighting specific key nodes in the knowledge graph with color or shape or displaying them in layers according to different levels to make complex data levels clearer. This graphical layout based on optimization algorithms can also integrate dynamic interactive functions, allowing users to zoom in, zoom out, or filter specific nodes and relationships in real time, improving users’ flexibility and efficiency in data exploration. The combination of intelligent optimization algorithms and modern graphics processing technology makes the visualization of knowledge graph datasets more flexible, diverse, and efficient. This technology enables users to quickly identify key patterns and discover potential relationships from large-scale complex data. For example, in the medical field, knowledge graphs can be used to display the complex relationships between diseases, symptoms, and drugs, helping doctors quickly understand the diagnosis and treatment path. In the financial field, knowledge graphs can be used to analyze the relationships between customers, transactions, and risks and support decision optimization. In education, knowledge graphs can intuitively display the logical relationship between knowledge points and improve the scientificity and efficiency of learning path planning. In short, the visualization of knowledge graph datasets constructed using intelligent optimization algorithms solves many shortcomings of traditional layout methods and comprehensively improves visualization's expressiveness and application value through intelligent optimization and customized functional design. This method brings a new technical paradigm to data analysis, helping users in various industries efficiently transform data into knowledge and improving intelligent decision-making and insight capabilities.
This paper first uses the PSO algorithm to screen out highly relevant features in the preprocessing stage of knowledge graph (KG) data. Then, the ACO algorithm is used to optimize KG's entity and relationship connections to generate a more accurate and reasonable knowledge network. The GWO algorithm is applied in KG semantic understanding to efficiently search for semantic associations and optimize the reasoning efficiency of complex relationships. Finally, the FA algorithm is utilized to optimize the distance between nodes and path visualization, improving the graphical interaction interface and user visual experience.
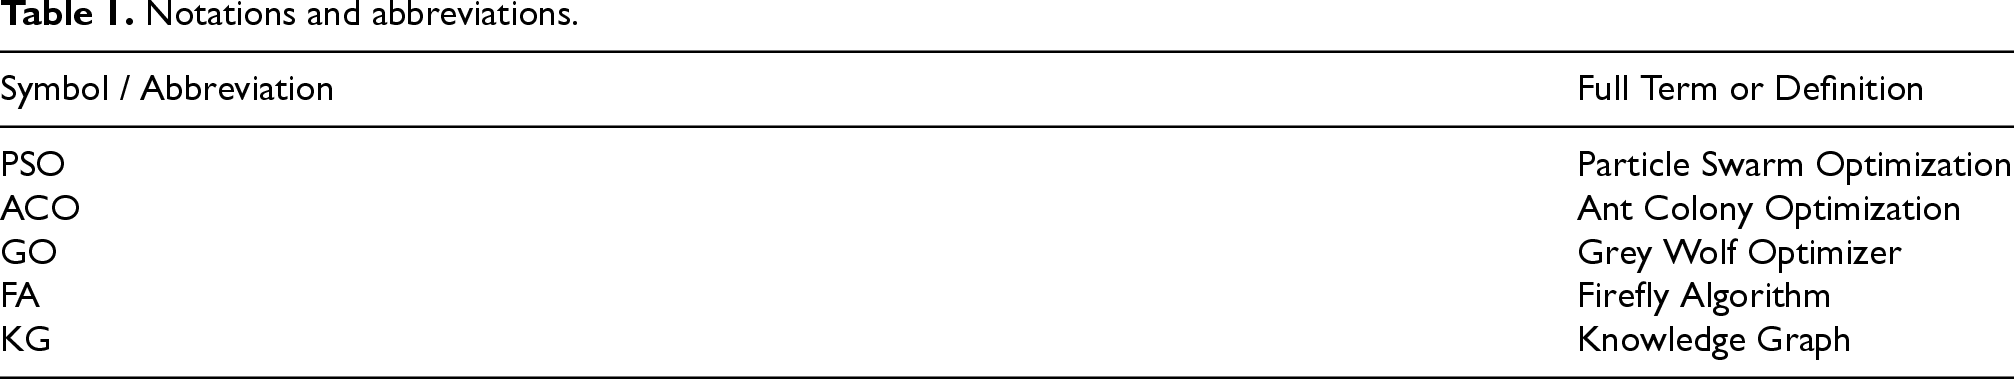
To improve the clarity and consistency of terminology throughout the paper, the notations and abbreviations frequently used in the following sections are summarized in Table 1.
Notations and abbreviations.
Notations and abbreviations.
Intelligent optimization algorithms are computational methods based on biological behavior, natural phenomena, or mathematical inspiration that can efficiently solve optimization problems. Li W et al. 1 proposed an intelligent optimization algorithm with a certain learning ability to realize better optimization behaviors. Tang J et al. 2 discussed a representative swarm intelligence algorithm that could solve optimization problems. They introduced its successful application in optimization problems in the engineering field. Altay E V et al. 3 proposed an intelligent optimization algorithm for the numerical association rule problem in mining. Cui Z et al. 4 proposed a pigeon-inspired optimization algorithm for multiple objective optimization problems. Khishe M et al. 5 presented a chimp optimization algorithm based on individual intelligence and sexual motivation of chimpanzee group hunting, unlike other predators. Gad A G et al. 6 proposed an application and systematic evaluation of the PSO algorithm, one of the most popular paradigms in swarm intelligence. Rana N et al. 7 proposed a systematic review of the application and development of a whale optimization algorithm based on the bubble-net hunting maneuver technique of humpback whales to solve complex optimization problems. Xue J et al. 8 proposed a sparrow search algorithm, which was a novel swarm intelligence optimization algorithm. Ajeil F H et al. 9 studied the paths of mobile robots in static and dynamic environments based on an aging-based ACO algorithm. Dhiman G. et al. 10 proposed an optimization algorithm for industrial engineering problems based on bio-inspiration. Katebi J et al. 11 proposed a comparative analysis of meta-heuristic optimization algorithms for optimal active control of structures. Deng W et al. 12 proposed an improved ACO algorithm based on a hybrid scheduling strategy. Pustokhina I V et al. 13 used text with an evolutionary optimization algorithm to analyze the dynamic customer churn prediction strategy for business intelligence. Teng Z et al. 14 proposed an improved hybrid grey wolf optimization algorithm.
KG is a way to represent knowledge through graph structure, with nodes representing entities or concepts and edges representing the relationships between entities. It can organize and store large amounts of information and reveal the connections and internal logic between things through graph structures. Chen X et al. 15 reviewed the concepts and methods of KG reasoning and discussed its challenges and research opportunities. Fensel D et al. 16 introduced KG and attempted to supplement the concept. Tangd et al. 17 proposed a non-intrusive occupancy detection method that did not require model training and data cleaning. It only relied on load curve data and electrical appliance knowledge and achieved occupancy detection through three steps: sparse switching event recovery, human behavior recognition, and empirical rule reasoning. They also verified in real data that its performance was comparable to that of supervised learning methods. Ji S et al. 18 comprehensively reviewed the overall research topics in KG. Guo Q et al. 19 proposed research based on the KG recommendation system. Tamašauskaitė G et al. 20 defined the KG development process through systematic evaluation and guided researchers to build the KG. Liang K et al. 21 studied KG reasoning of graph types. KG reasoning models can be divided into three categories: static, dynamic, and multimodal models. Li L et al. 22 introduced a systematic approach to constructing medical KG from electronic medical records. Dai Y et al. 23 introduced the existing state-of-the-art methods in KG and the applications that benefited from these methods. Zhu Y et al. 24 studied large-scale language models for KG construction and reasoning. Sun Z et al. 25 proposed a KG convolutional network framework that could mine the relevant attributes between items on KG to capture the correlation between items effectively. Wang M et al. 26 reviewed embedding models for link prediction in KG. Li Z et al. 27 proposed a KG neural network for drug interaction prediction.
Related research continues to advance in the visualization and optimization methods of graph data structures, and various strategies have been proposed around large-scale graph layouts, combinatorial optimization modeling, and graph embedding driven by graph neural networks. Zhang et al. 28 proposed a new node distance metric PDist and its efficient algorithm Tau-Push based on personalized PageRank, which significantly improved the efficiency and effect of graph visualization and achieved second-level response performance in processing large graphs with billions of edges. Zhao et al. 29 attempted to use the image processing capabilities of multimodal large language models to construct a visual evolutionary optimization framework VEO. By encoding network solutions into images and designing evolutionary operators, the scalability and reliability of solving complex network combination problems were enhanced with the assistance of graph sparsification. On this basis, Grötschla et al. 30 proposed a multi-level graph drawing framework based on graph neural networks. This method made significant progress in stress index optimization through graph coarsening and hierarchical iterative optimization, as well as the introduction of a location-aware dynamic reconnection mechanism, and had scalability with sub-quadratic time complexity. Although these methods have made breakthroughs in their respective directions, there is still a problem of limited integration depth in cross-modal modeling, graph structure semantic fusion, and graph structure intelligent optimization collaboration.
Existing hybrid metaheuristic methods for knowledge graph optimization usually emphasize algorithmic combinations without deeper interaction mechanisms. These methods often rely on independent algorithmic outputs fused through ensemble or sequential scheduling, which limits the dynamic adaptability of the optimization process to the structural characteristics of knowledge graphs. In contrast, the proposed multi-algorithm integration establishes an interdependent optimization framework where each algorithm is assigned to a specific phase of the knowledge graph construction and visualization pipeline. The functional roles of feature selection, entity relationship routing, semantic association mining, and visual layout optimization are divided. The optimization outputs from each stage directly determine the initialization and search space of the next algorithm. This enhances the end-to-end consistency of the multi-objective optimization process. Moreover, the selection of PSO, ACO, GWO, and FA is not arbitrary but structurally aligned with the corresponding subtasks, forming a task-adaptive optimization loop. The system avoids redundant search in irrelevant spaces and maintains convergence reliability across tasks. As a result, the proposed integration exhibits higher semantic sensitivity, spatial layout interpretability, and reasoning efficiency in structurally complex knowledge graph scenarios.
Methods
The multi-step optimization process for constructing and visualizing the knowledge graph is composed of four sequential stages. Each stage utilizes a different intelligent optimization algorithm tailored to a specific subtask, forming a task-aligned and interdependent pipeline. The process begins with feature selection via the particle swarm optimization algorithm to reduce the dimensionality of high-volume data. The ant colony optimization algorithm is then used to optimize entity-path connections, ensuring structural integrity. Semantic reasoning is subsequently performed by the grey wolf optimizer to capture deeper associations. The final layout is refined using the Firefly algorithm to improve spatial clarity and visual quality. The entire workflow is summarized in Figure 1.
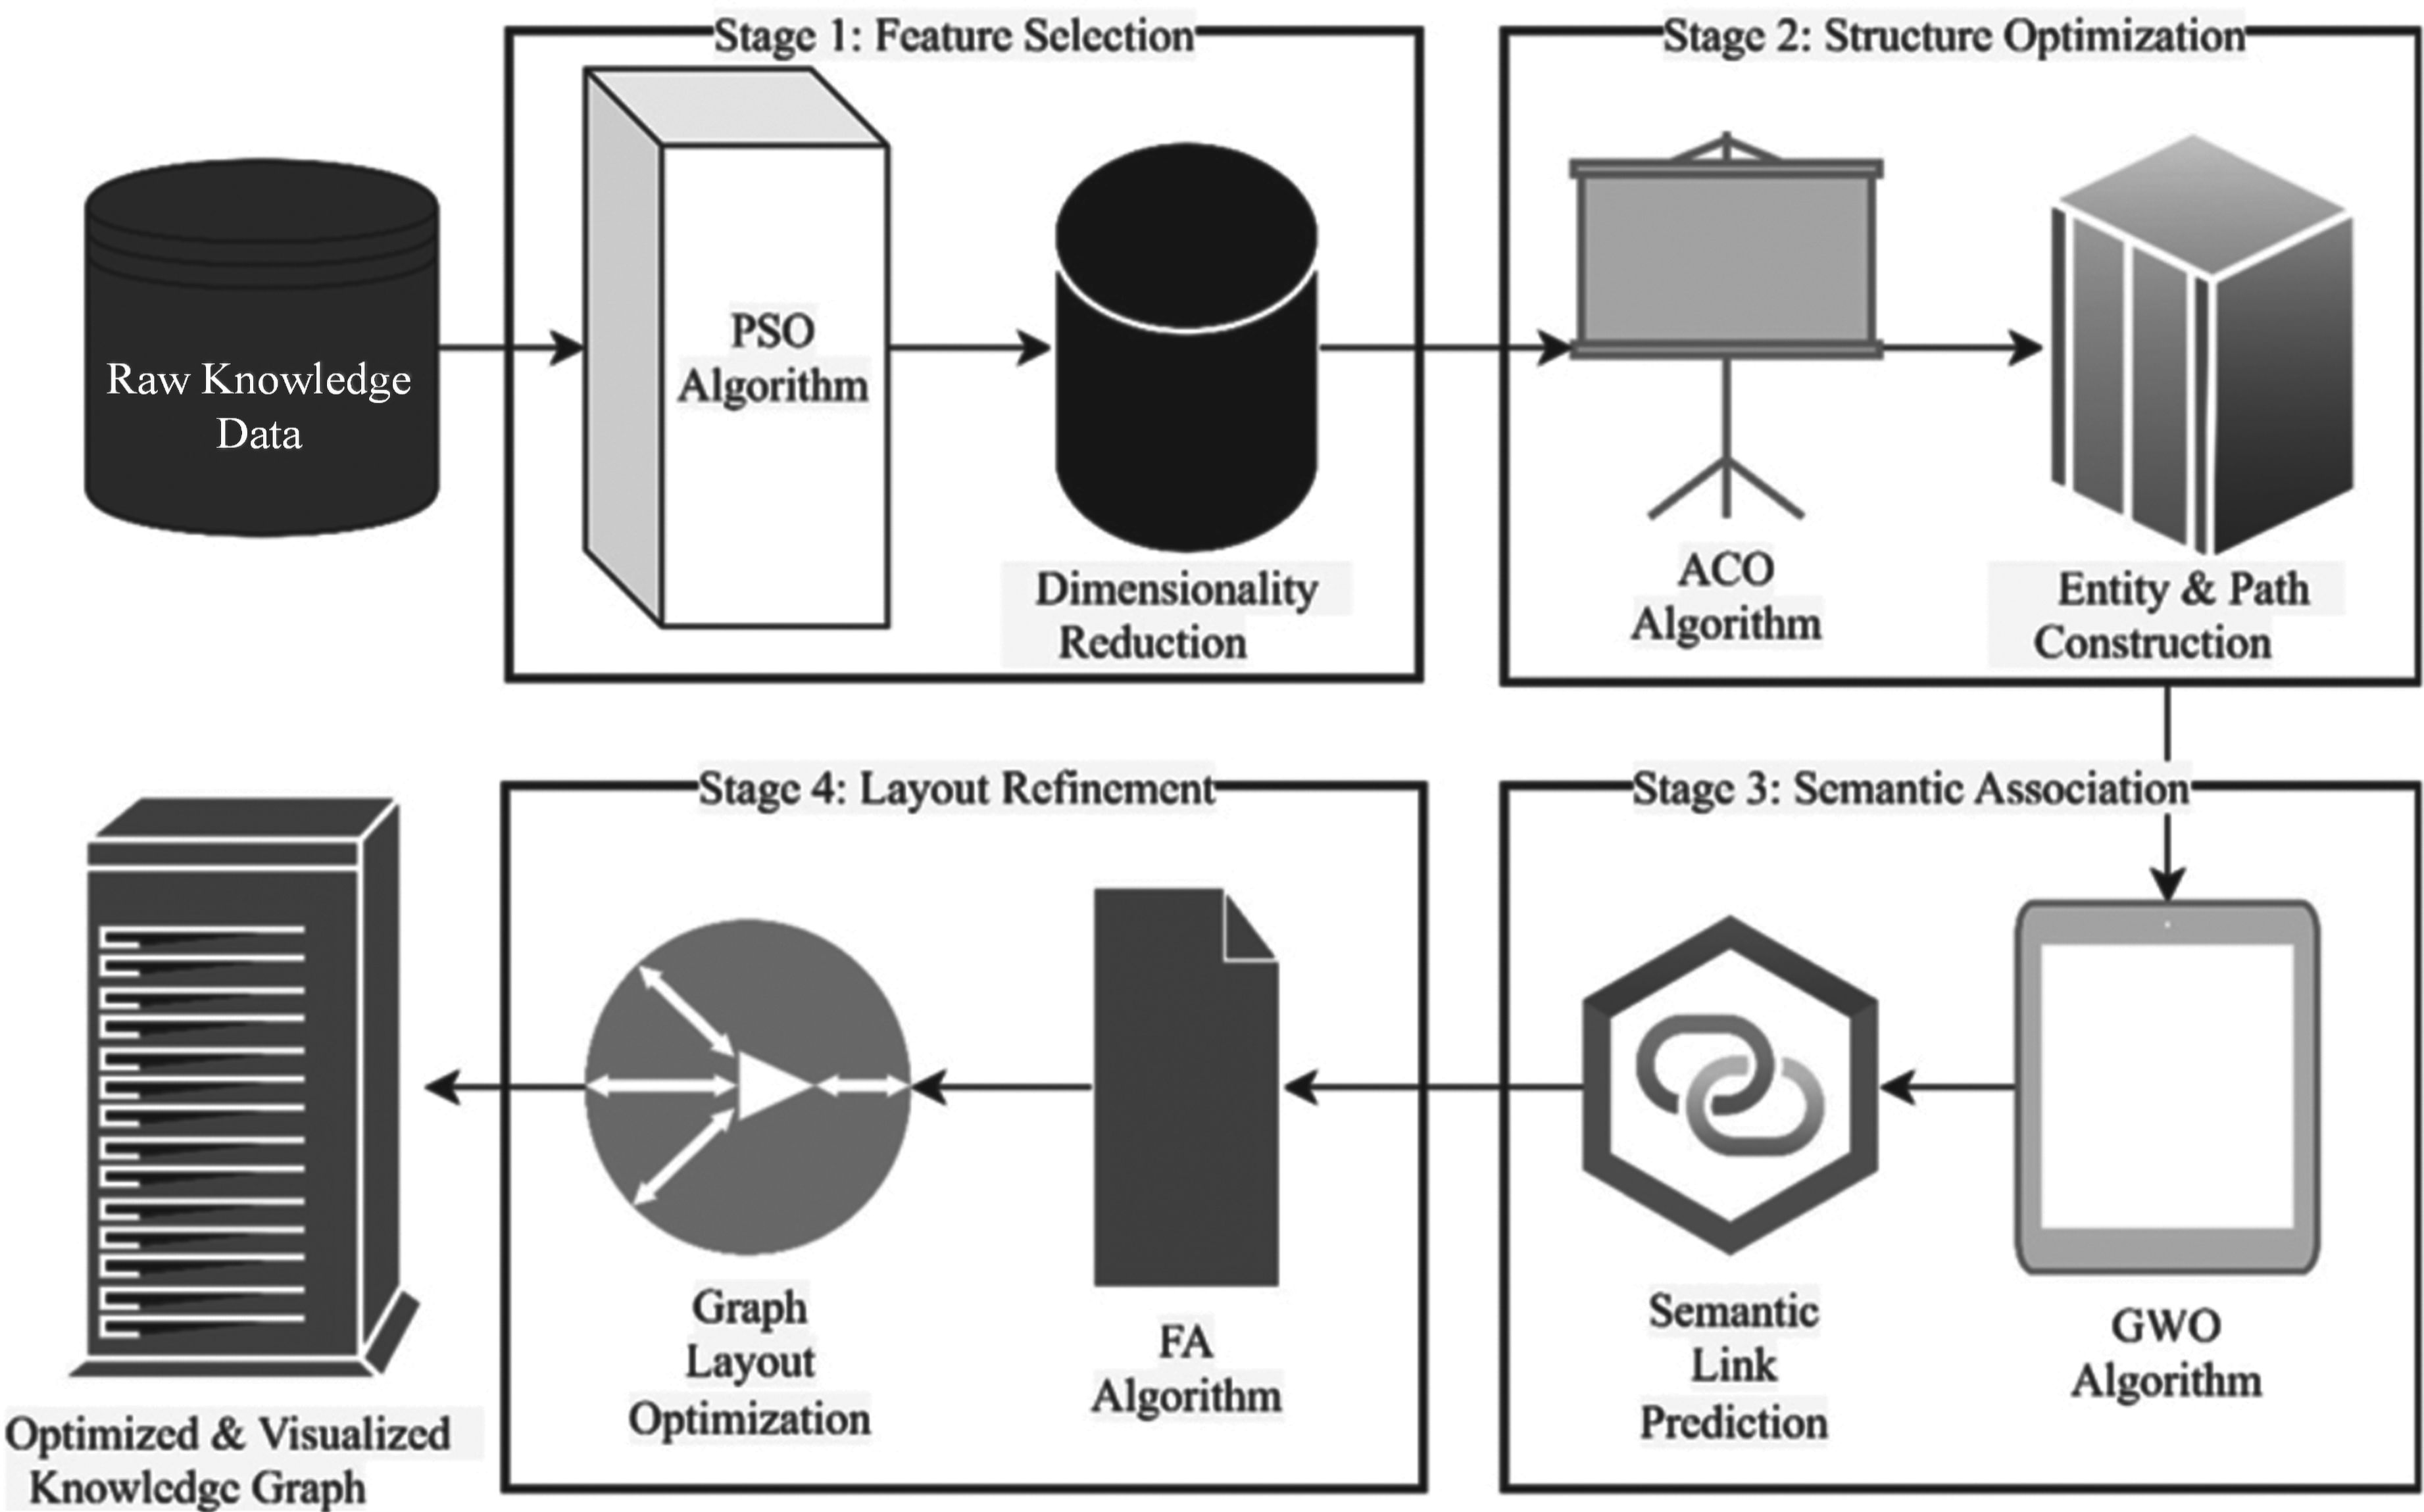
The overall optimization framework for knowledge graph construction and visualization.
The PSO algorithm is a global optimization algorithm simulating bird flocks’ foraging behavior. The PSO algorithm is used to reduce the dimension of large-scale datasets by optimizing an objective function to select essential features and thus reduce the dimension of the data. Firstly, the particle swarm is initialized. Each particle represents a possible feature subset. The dimensions of the particles are the same as the eigenvalues of the raw data. Assuming there are m features in the raw dataset, each particle is a binary vector (0 or 1) of length m, with 0 representing that the feature is abandoned and 1 representing that the feature is selected. A particle swarm consisting of N particles is generated, where each particle's initial position and velocity are generated randomly. Position
Then, the objective function is defined. It is an evaluation criterion for measuring the quality of feature selection, including two indicators: classification performance and information gain. It is assumed that there are N samples and C category labels in the dataset. The formula of the objective function is:

Among them, Classification Accuracy refers to the classification accuracy calculated based on the selected feature subset X. Feature Count refers to the number of features used to punish particles that select too many features, achieving dimensionality reduction.
Then, the particle's position is updated. The velocity should be updated before the position. The formula for velocity update is:

Among them,
The formula for the particle's position update is:
Among them, sigmoid(v) maps the velocity to a binary space from 0 to 1 and is defined as:
The particle's position has only two options, 0 or 1, indicating whether the feature is selected.
Then, the individual optimum and the global optimum are updated. Each particle has an individual optimal position 
If the objective function of the global optimal position is better, then the global optimal position is updated as follows:

Finally, the algorithm reaches the termination condition, such as reaching the maximum iteration number or the convergence of the objective function. The final global optimal position is the selected feature subset.
The values of the acceleration coefficients in the PSO algorithm are obtained through iterative empirical testing. Multiple candidate configurations are evaluated by observing the stability of convergence and the classification accuracy under the same initial particle distribution. The final values are selected based on their consistent performance across trials with minimal variation in results under repeated runs. These values are maintained constant during the subsequent feature selection and dimensionality reduction procedures.
The computational complexity of the PSO algorithm is mainly determined by the number of particles, the number of iterations, and the feature dimension. For a dataset with N particles, T iterations, and D dimensions, the overall time complexity is O(NTD). Each particle needs to evaluate the fitness function and update position and velocity in every iteration, and the scale of the operation linearly with the feature space dimension. During the feature selection process, the classification model is evaluated repeatedly, which introduces additional computational load. However, this overhead remains controllable due to the relatively low dimensionality of the input space after screening.
The ACO algorithm can be applied to optimize the path relationship between entities in KG and enhance KG's efficiency and accuracy in the reasoning process. In KG, entities can be connected through relationships. Each relationship can be regarded as an edge. The optimization problem's core is finding the optimal path from the starting entity to the target entity. The ACO algorithm simulates the behavior of ants in the graph to find the optimal path. First, the initialization is performed. Entities in KG are defined as nodes and relationships as edges. Each edge
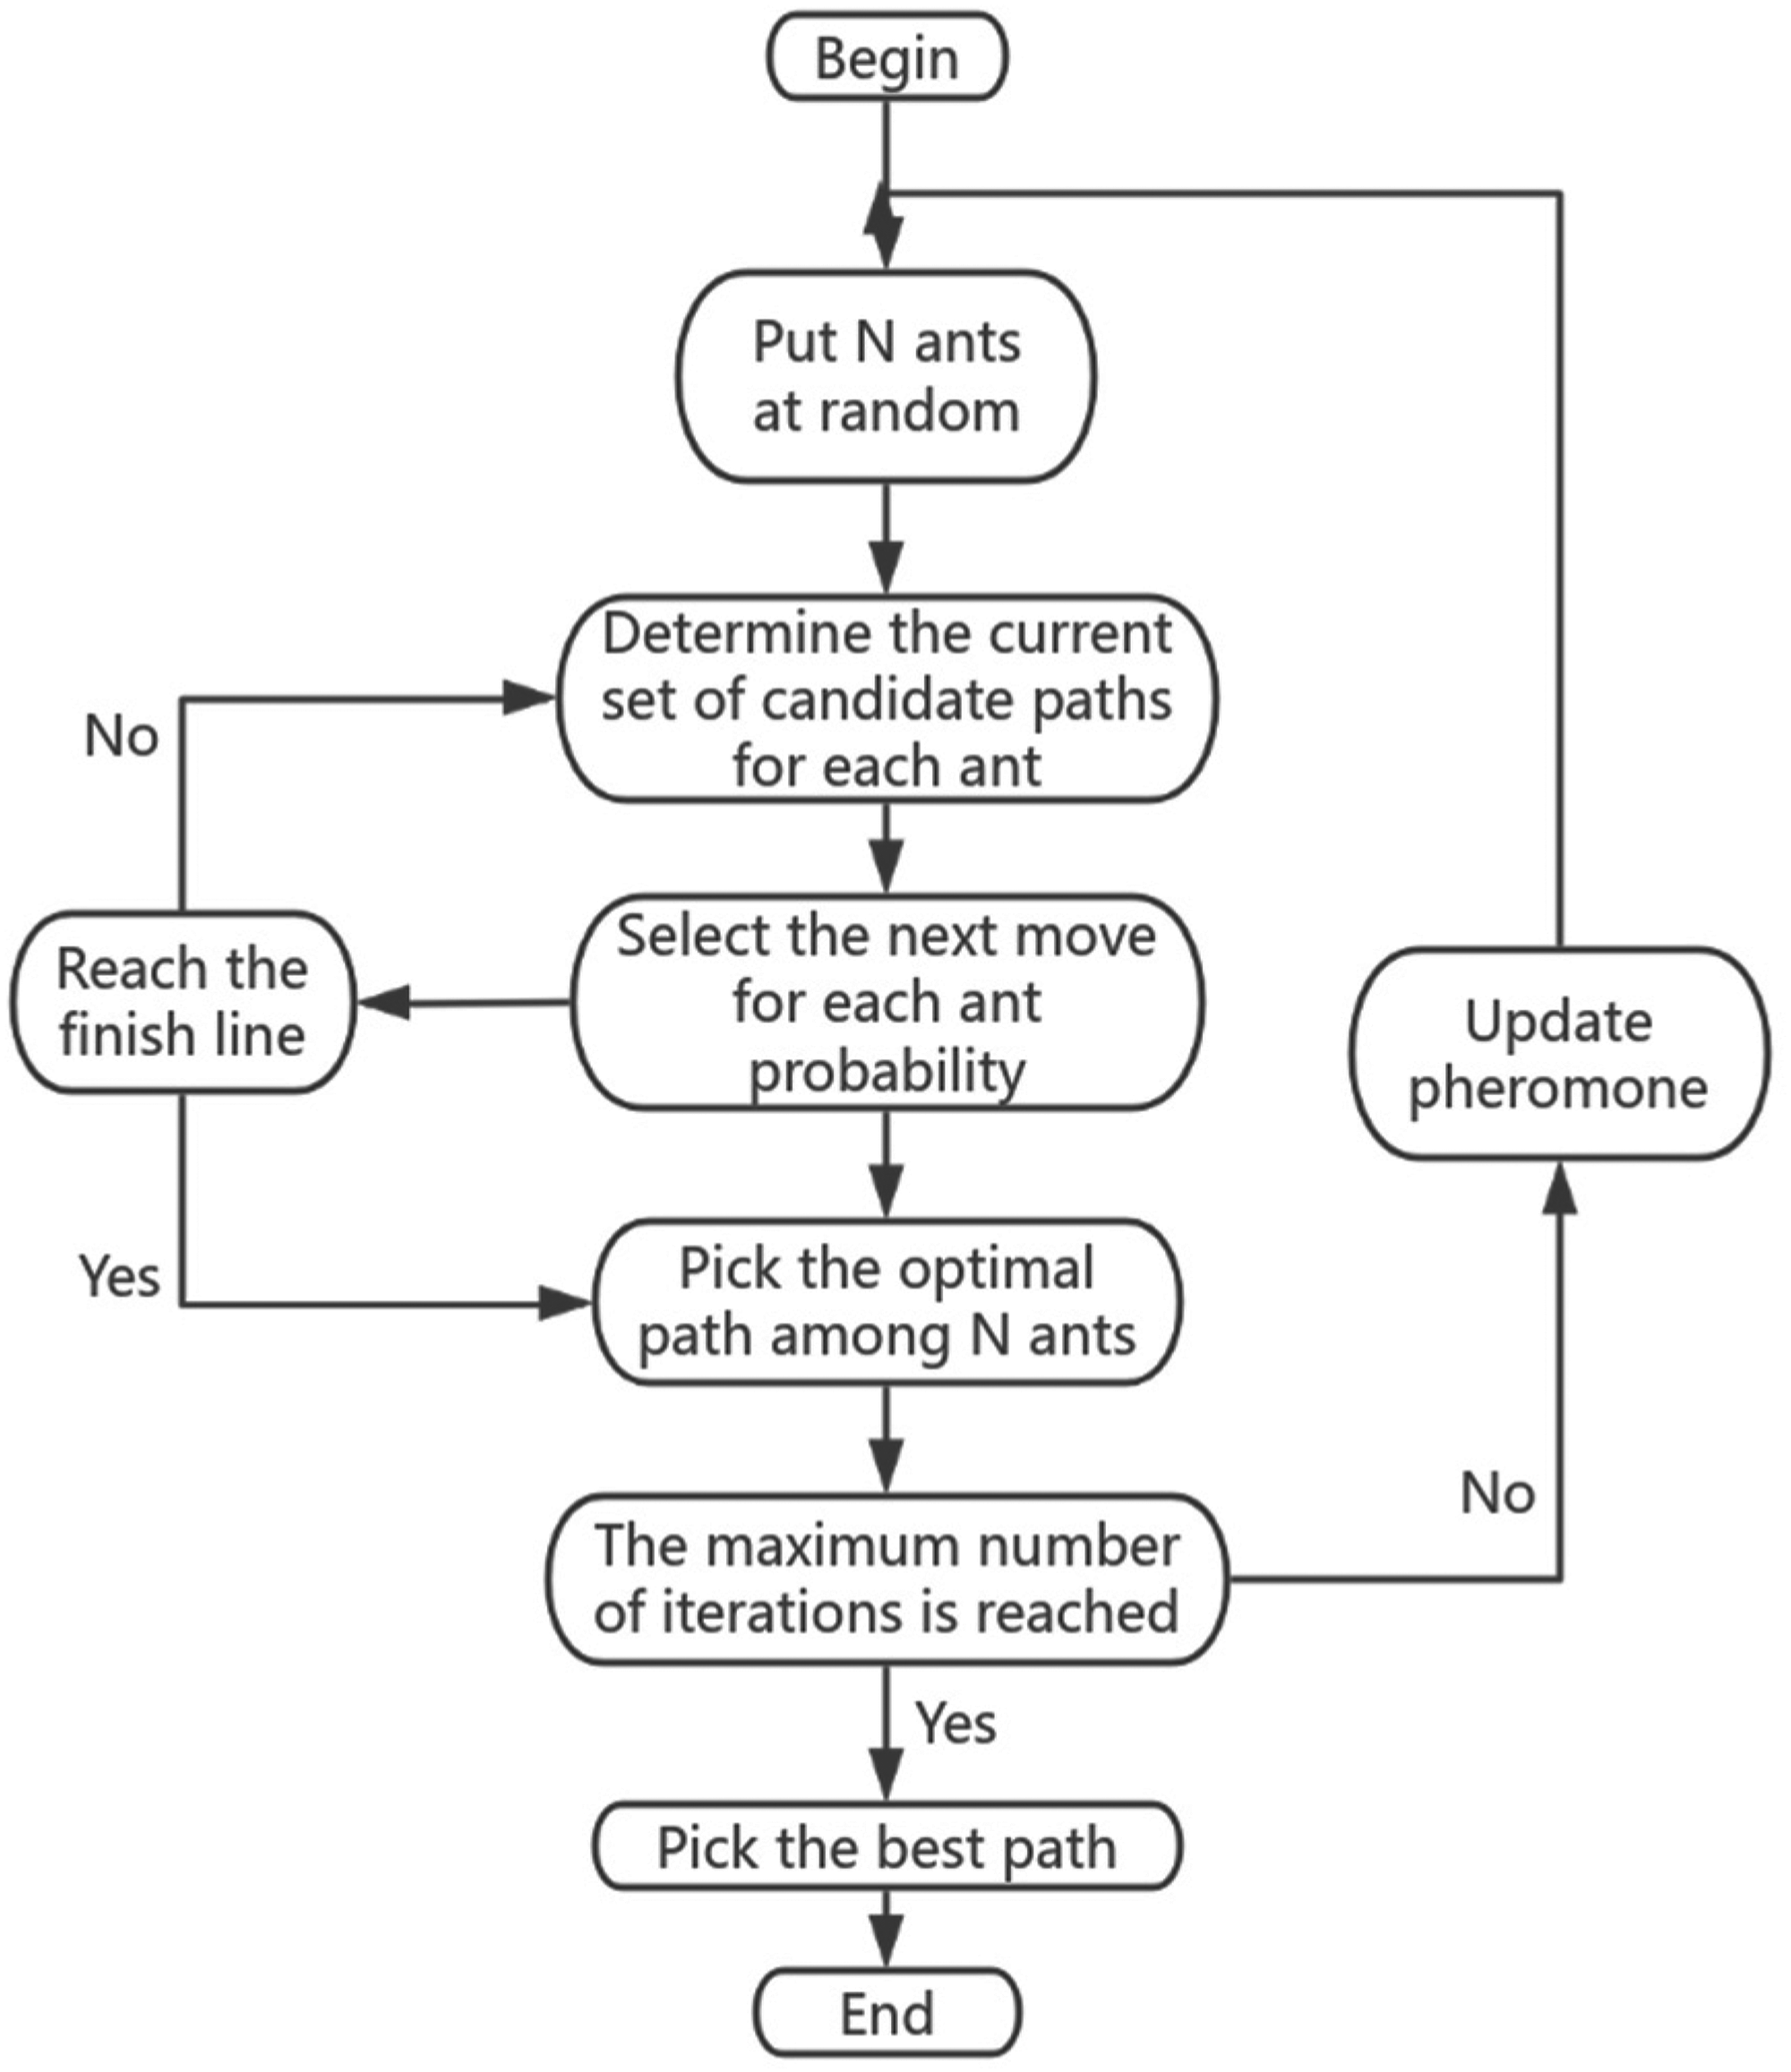
ACO algorithm flowchart.
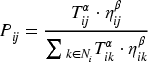
The path selection of ants can be based on two factors, pheromone concentration and heuristic function. The higher the pheromone concentration, the more likely the ants may select that path. The heuristic function can be the relationship's weight, the path's distance, etc. The path selected by the ant can be calculated by Formula (7):
Among them,
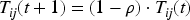
Then, the path is updated. After completing a path selection, each ant updates the pheromones on the path. The update mechanism of pheromones usually includes two parts: evaporation and increase. The evaporation of pheromones means that after each epoch of iteration, the concentration of pheromones on all paths is reduced to avoid excessive accumulation of pheromones, which is defined as:
Among them,
The increase in pheromones means that each ant adds a certain amount of pheromones to the path after completing a path. The amount of pheromone added is proportional to the quality of the path. Assuming that the path of the k-th and is 
Among them, Q is a constant, and M is the number of ants.
Then, the local optimal path is updated. The ants gradually improve the path through multiple epochs of iterations and eventually form a local optimal path. At the end of each iteration, the current best path is selected as the pheromone basis for updating the path.
Finally, the global optimal path is selected. After all ants complete path selection, there is a global optimal path, that is, a path with the shortest length or that meets specific optimization criteria. The ACO algorithm can effectively improve knowledge graphs’ reasoning efficiency by continuously optimizing pheromones and path selection, especially when dealing with large-scale graphs and complex relationships.
The parameters controlling the relative influence of pheromone intensity and heuristic information in the ACO algorithm are determined through repeated validation experiments. Several combinations are examined under identical graph conditions to assess the algorithm's sensitivity to different values. The chosen set of parameters results in consistent convergence behavior and efficient path search performance across all validation rounds. The same parameter configuration is applied in the optimization of entity paths in the knowledge graph.
The time complexity of the ACO algorithm depends on the number of ants, the number of iterations, and the scale of the graph. It is assumed that M is the number of ants; T is the number of iterations; E is the number of edges in the graph. The path selection, pheromone update, and global optimization procedures lead to an overall complexity of O(MTE). In each iteration, every ant traverses a set of candidate paths and updates pheromone levels based on solution quality. The algorithm maintains acceptable computational efficiency when applied to sparse graphs, but performance may degrade in densely connected networks.
The GWO algorithm is an essential optimization algorithm simulating the social behavior of grey wolves. It is very suitable for semantic association search tasks in large-scale knowledge graphs. The optimization objective is to minimize the semantic distance and maximize the knowledge association. The formula for minimizing the semantic distance is:
The definition of maximizing knowledge association is:
The definition of the objective function is:

Firstly, the population is initialized. n solutions (grey wolf individuals) are initialized in the knowledge graph. Each solution represents a semantic path. The solution is represented as
Then, sorting is carried out, and the leader layer is defined.
The position is updated. The wolf adjusts its solution by adjusting the positions of 
Among them
Next, the distance is calculated, and the search direction is adjusted. Each wolf updates its solution by changing its distance from
The computational complexity of the GWO algorithm is determined by the number of search agents, the number of iterations, and the dimensionality of the solution space. Assuming N agents and T iterations in a D-dimensional space, the total complexity is O(NTD). Each agent updates its position by computing distances and directional weights relative to the three leader solutions, and the convergence process involves continuous ranking and updating, which maintains linear scalability with the population size.
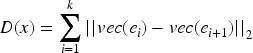
The FA algorithm is adopted to optimize the graph's distance between nodes and path visibility. Firstly, the optimization objective is determined: visual clutter can be minimized, and the rationality of the distance between nodes and the clarity of the path can be improved by adjusting the positions of nodes in the knowledge graph. Then, the parameters are set. The number of fireflies is n. The maximum number of iterations is T. The attractiveness parameter is
The brightness is then calculated. The brightness function is defined as:

Among them, 
Among them,
The formula for the path intersection metric is:

Among them,
Then, the attractiveness 
Among them,
Next, firefly's position is updated, which is defined as:
Finally, iterative optimization is performed. The brightness and updated position are calculated repeatedly until the maximum number of T of iterations is reached. The optimal solution is output. The optimal solution is the firefly with the highest brightness. Its position is the optimized node layout.
The FA algorithm's runtime complexity is influenced by the number of fireflies, the number of iterations, and the number of pairwise comparisons required for position updating. It is assumed that N denotes the number of fireflies, and T denotes the total iterations. Since each firefly compares with all others, the complexity per iteration is O(N2), leading to an overall complexity of O(N2T). This quadratic term is associated with the light intensity comparison mechanism, which is essential to achieving effective layout optimization but may require resource adjustment when applied to large-scale graphs.
Feature dimensionality reduction of dataset
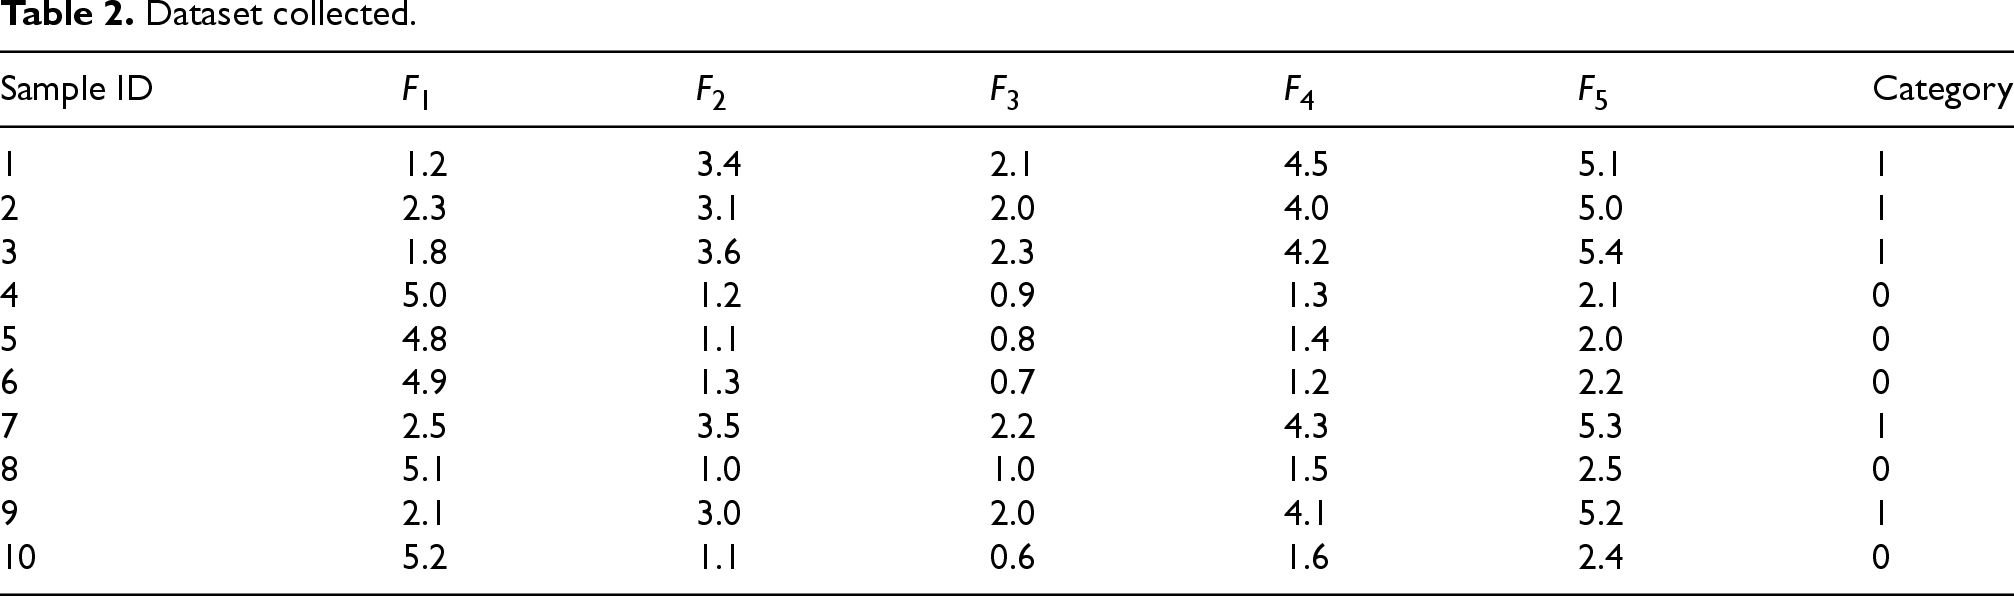
The PSO algorithm is used to reduce the feature dimension of the dataset. A dataset containing 10 samples and 5 features is collected, as shown in Table 2.
Dataset collected.
Dataset collected.
According to Table 2, the feature values of the 10th sample are 5.2 for
The algorithm uses the KNN (K-Nearest Neighbor) classifier as the classification model. The relevant parameters of the PSO algorithm are set, where the number of particles N = 3. Table 3 lists the initial positions and velocities of randomly generated particles, as well as the classification accuracy calculated after classifier training.
Some indicator values of the three particles.
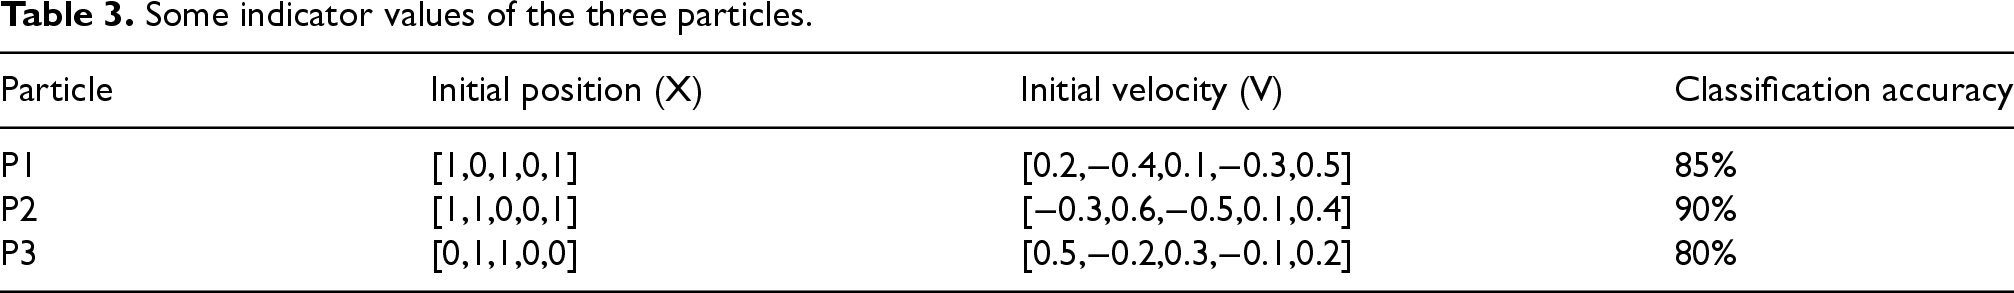
In Table 3, the initial position of particle P1 is [1, 0, 1, 0, 1], and the initial velocity is [0.2, −0.4, 0.1, −0.3, 0.5], with a classification accuracy of 85%. The initial position of particle P2 is [1, 1, 0, 0, 1], and the initial velocity is [−0.3, 0.6, −0.5, 0.1, 0.4], with a classification accuracy of 90%. The initial position of particle P3 is [0, 1, 1, 0, 0], and the initial velocity is [0.5, −0.2, 0.3, −0.1, 0.2], with a classification accuracy of 80%.
Based on the feature subset selected by each particle, the KNN classifier is trained. The objective function value is calculated using Formula (1). Weight
Particle P1 selects features
After calculation, particle P1's optimal value is [1, 0, 1, 0, 1]. Particle P2's optimal value is [1, 1, 0, 0, 0]. Particle P3's optimal value is [1, 1, 0, 1, 1]. The global optimal value is [1, 1, 0, 0, 1].
The particle's position and velocity are updated. Based on Formulas (2) and (3), the inertia weight w is set to 0.5;
The updated velocity is [0.1, 0.4, −0.4, −0.15, 0.25], and the updated position is [1, 1, 0, 0, 1]. The updated velocity and position of particles P2 and P3 are calculated as above. After 2 iterations, the termination condition is reached. The model automatically finds the best feature subsets
The purpose of using a small sample dataset in this experiment is to verify the basic effectiveness and interpretability of the proposed algorithm in feature selection and classification accuracy. Under the condition of controlled feature space, the convergence behavior of the particle swarm optimization algorithm in feature dimension search can be observed more accurately, and the features that contribute significantly to the classification task can be identified. This setting ensures that the algorithm structure parameters, objective function composition, and local changes in the optimization process are finely adjusted during the model training phase, laying a foundation for subsequent expansion to large-scale knowledge graph data. The proposed method has inherent parallelism and group coordination mechanism in algorithm structure design, which is suitable for feature compression and structure optimization in high-dimensional and massive sample environments. Under large-scale datasets, the global search ability of individual particles in high-dimensional space does not degrade due to the increase in the number of samples. On the contrary, with the support of particle diversity and information gain feedback mechanism, it can maintain a stable optimal search path. If combined with GPU acceleration or distributed parallel mechanism, fast iteration, and stable convergence under high-dimensional data can be achieved without changing the core optimization framework. Therefore, this method still has good adaptability and generalizability when dealing with large-scale data tasks in real environments.
The ACO algorithm is used to optimize entity paths in KG. If KG is a directed graph, nodes represent entities, and edges represent relationships. Edge weights can represent distances. The objective is to find the path with the most negligible weight from A to D. The directed graph is shown in Figure 3. According to Figure 3, the distance from A to B is 1.5; the distance from A to C is 2.0; the distance from B to C is 0.8; the distance from B to D is 1.0; the distance from C to D is 1.2.
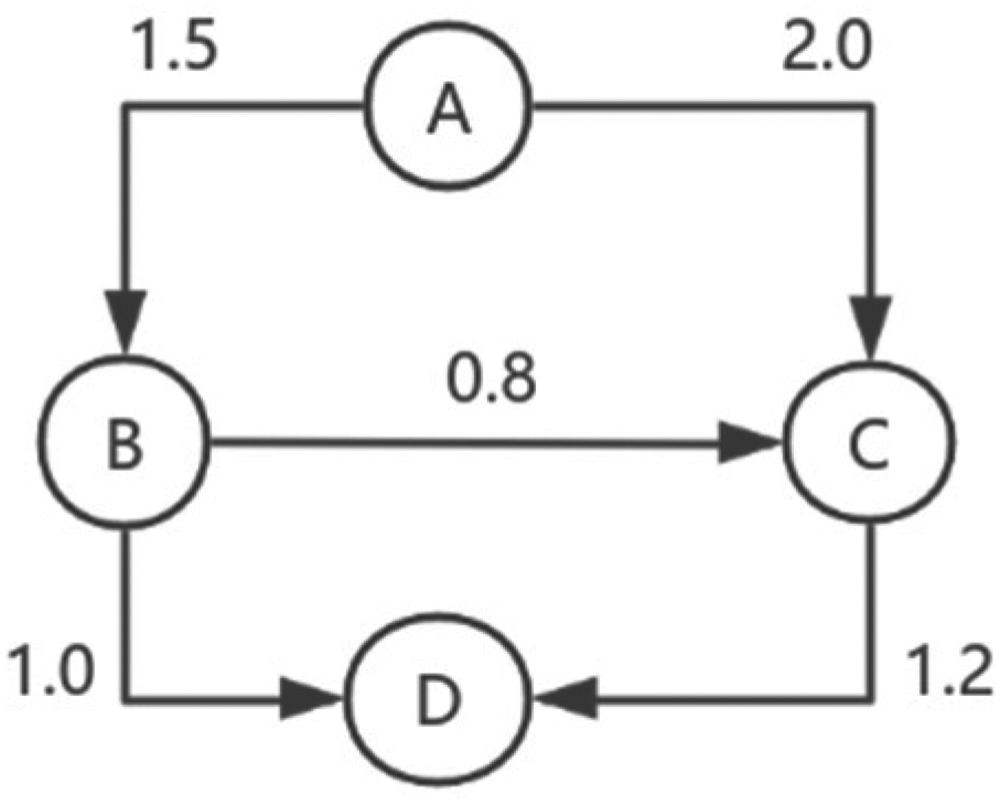
Structure of the directed graph.
Initialization is performed first. Only three ants are assumed to participate in path search in each epoch. The initial pheromone value
Then, the pheromone is updated according to the length, path A→B:
The pheromone concentration is updated as shown in Formula (8). The value
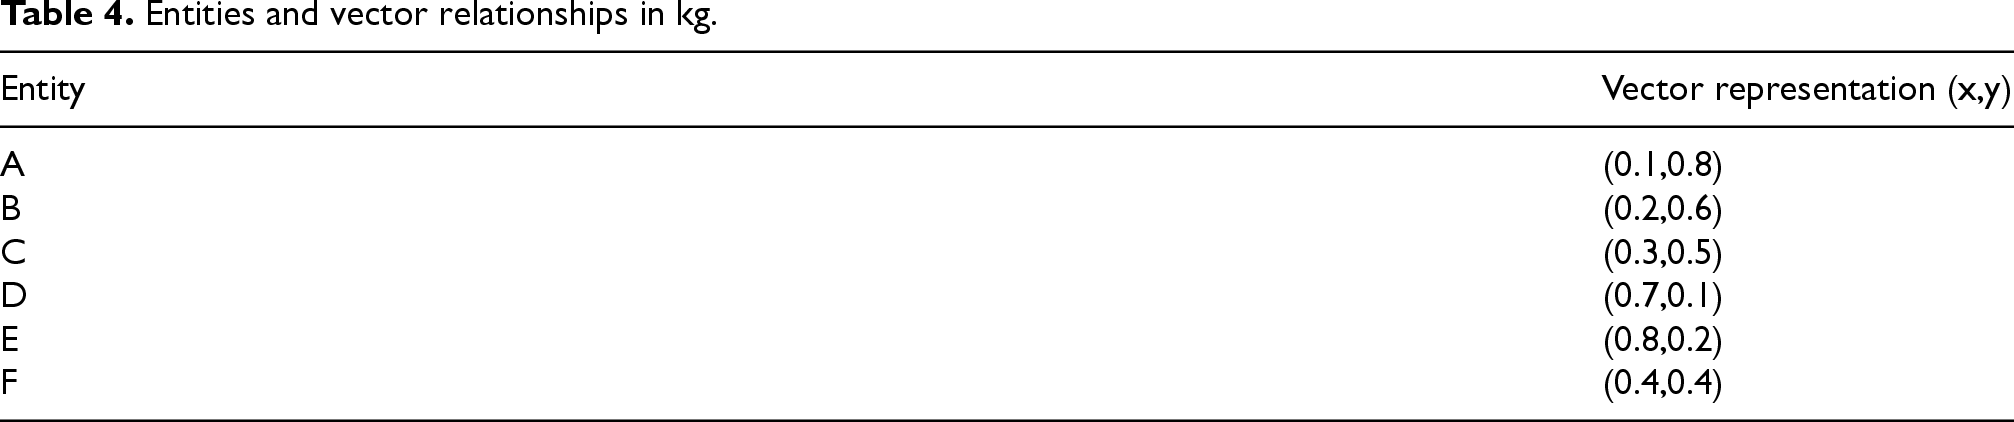
The GWO method is adopted to search for semantic associations, and the entities and vector representation relationships in the KG are collected, as shown in Table 4. The collected edges and weights are shown in Table 5.
Entities and vector relationships in kg.
Entities and vector relationships in kg.
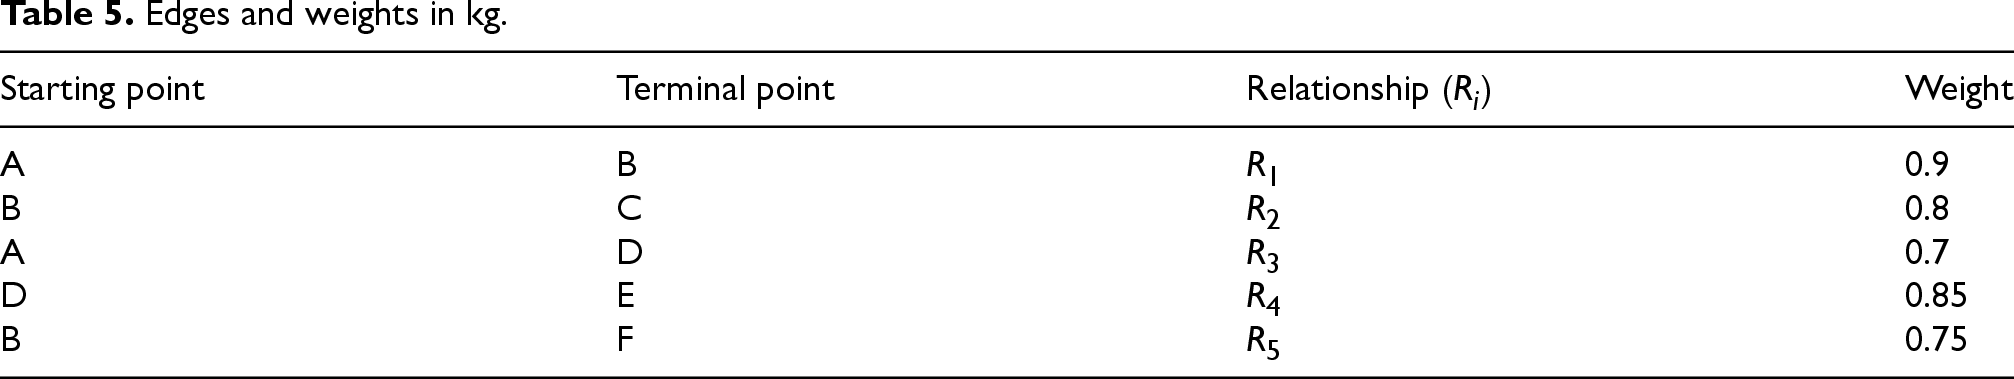
Edges and weights in kg.
In Table 4, the vector of entity A is represented as (0.1, 0.8); the vector of entity B is represented as (0.2, 0.6); the vector of entity C is represented as (0.3, 0.5); the vector of entity D is represented as (0.7, 0.1); the vector of entity E is represented as (0.8, 0.2); the vector of entity F is represented as (0.4, 0.4).
According to Table 5, the weight of A→B is 0.9; the weight of B→C is 0.8; the weight of A→D is 0.7; the weight of D→E is 0.85; the weight of B→F is 0.75.
The optimal semantic association in the KG is searched to minimize the objective function (Formula (12)). It is assumed that
According to Formulas (10), (11), and (12), the semantic distance, knowledge association, and objective function value of the three paths are calculated. The semantic distance of path 1 is
Path 2:
Path 3:
According to Formula (13) of the GWO algorithm, the objective function values are sorted from best to worst,
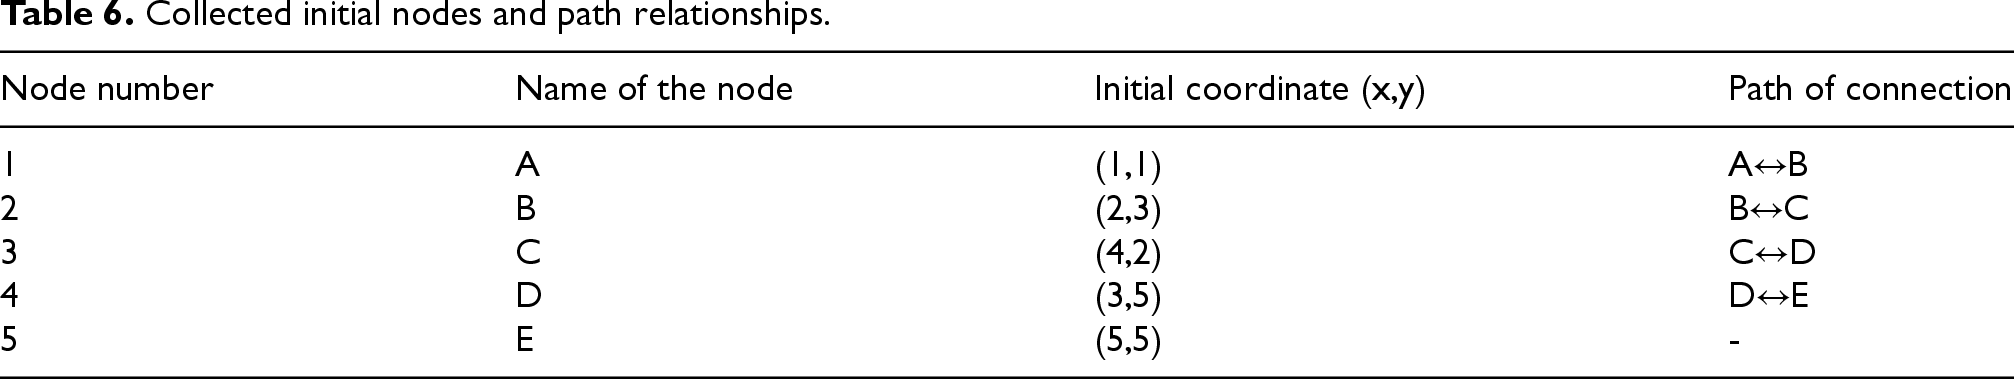
The FA algorithm is used to optimize node distance and path visualization. The initial node coordinates and path relationships are collected in Table 6.
Collected initial nodes and path relationships.
Collected initial nodes and path relationships.
According to Table 6, the initial coordinate of A is (1, 1), and that of B is (2, 3). A and B are interconnected. The initial coordinate of C is (4, 2), and B and C are interconnected. The initial coordinate of D is (3, 5), and C and D are interconnected. The initial coordinate of E is (5, 5), and D and E are interconnected.
It is assumed that there is an intersection between A↔B and C↔D. The ideal distance
The initial path intersection is 1. Assuming
Using node A as an example, the attractiveness is calculated first,
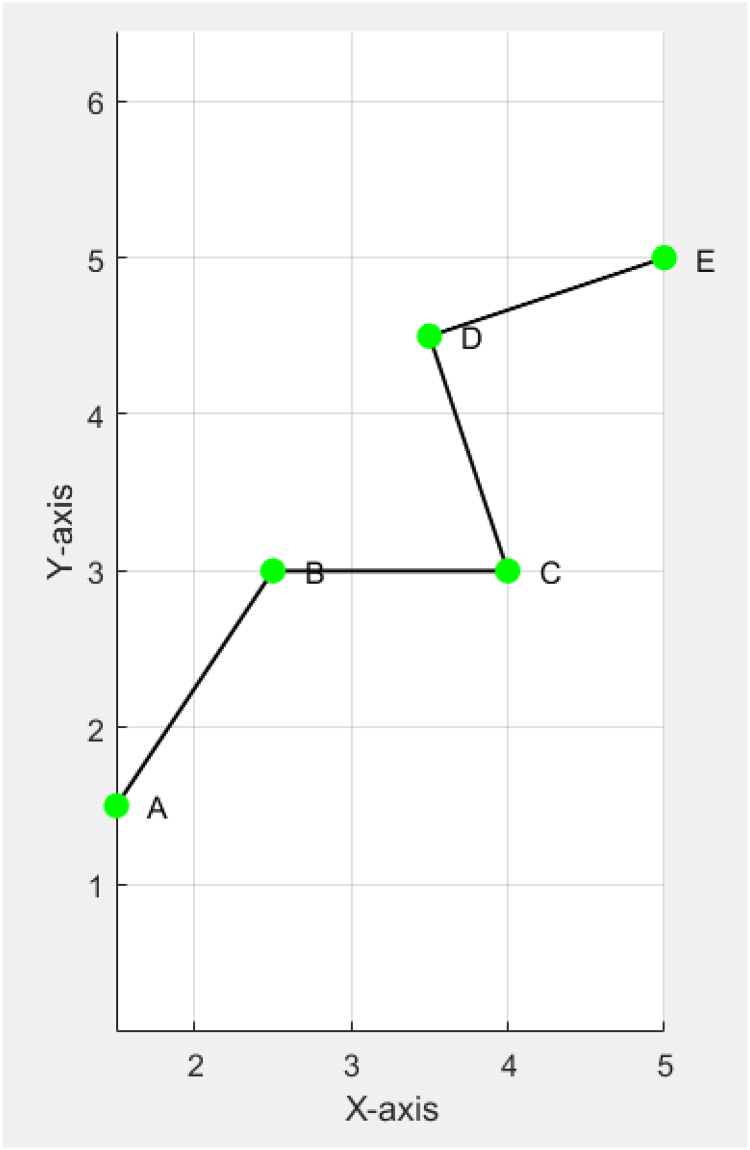
After 50 iterations, the optimized node coordinates are obtained: A (1.5, 1.5), B (2.5, 3.0), C (4.0, 3.0), D (3.5, 4.5), and E (5.0, 5.0).
In Figure 4, after optimization, all intersections in the layout diagram are eliminated, and there are no intersect. After optimization, the layout of the connection paths is more intuitive, avoiding visual overlap and making the graphical expression easier to understand. The spatial distribution between nodes is more uniform, reflecting the optimized layout's effectiveness in reducing complexity.
Optimized layout diagram.
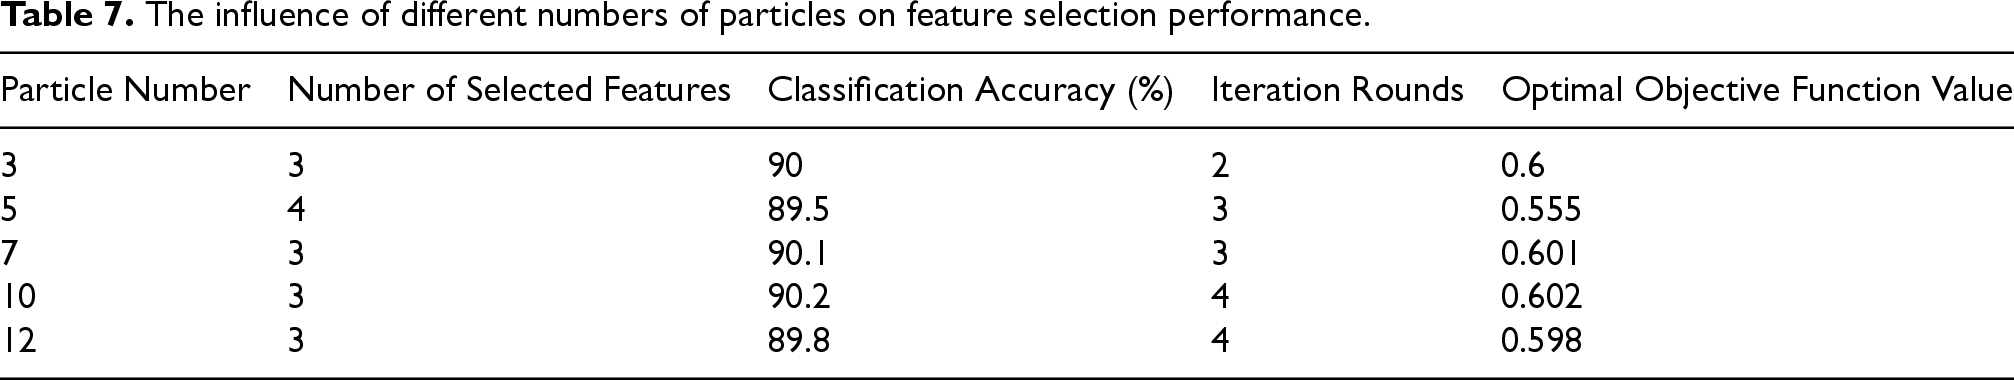
To further evaluate the parameter robustness of the intelligent optimization algorithm in the process of constructing the knowledge graph, the key initial parameters of PSO and ACO are controlled by variable experiments. In the particle swarm optimization algorithm, the number of particles is adjusted to observe its influence on the scale of feature selection, classification accuracy, iterative convergence, and objective function performance. In this process, the number of particles affects the coverage of the search space and the diversity of the population, which in turn affects the adequacy of feature screening and the final classification performance. The objective function value combines the balance between classification accuracy and the number of features and is a comprehensive indicator for measuring the quality of feature selection. In the ant colony optimization algorithm, the number of ants is adjusted, and the shortest path length, the number of iterations required for convergence, and the frequency of repeated selection of the path in multiple experiments are recorded to analyze the influence of the population size on the stability and convergence speed of path search. The path length reflects the optimization quality; the number of iterations reflects the search efficiency; the path frequency is used to measure the consistency of the algorithm in multiple runs. The results of these two sets of experiments are shown in Tables 7 and 8.
The influence of different numbers of particles on feature selection performance.
The influence of different numbers of particles on feature selection performance.
The influence of different numbers of ants on path search stability.
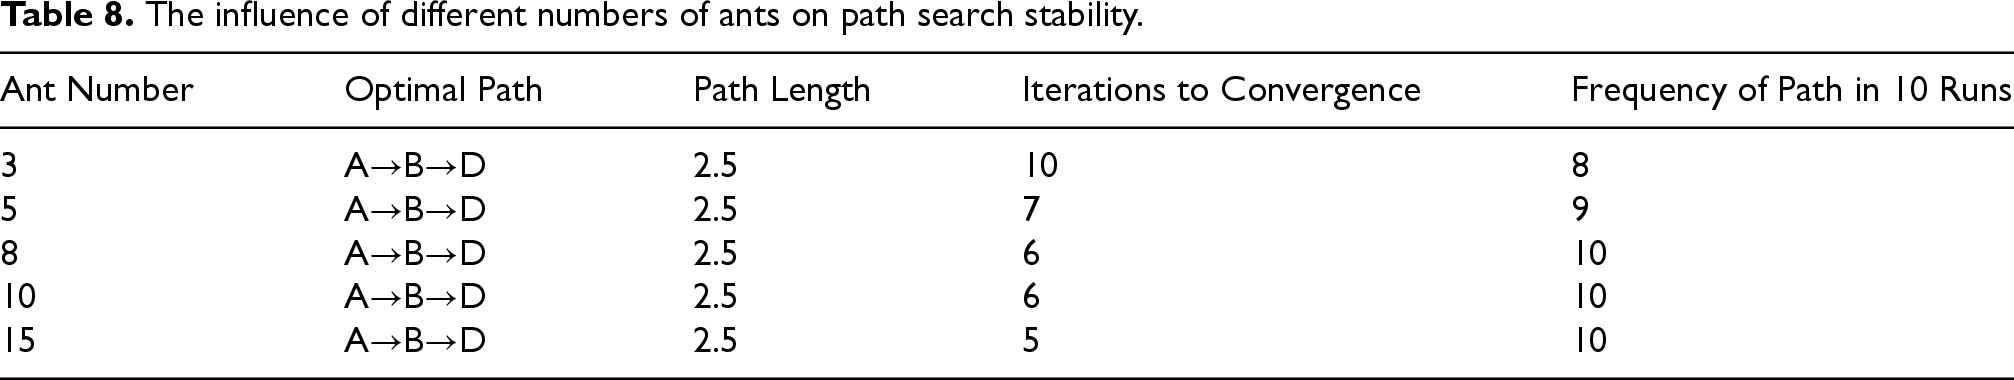
In the experiment of changing the number of particles, the number of particles increases from three to twelve, and the classification accuracy remains at about 90%, with the maximum fluctuation range not exceeding 0.5 percentage points, indicating that the feature selection strategy has strong stability. When the number of particles increases, the number of features fluctuates slightly between three and four, and the objective function value increases slightly, but the change is not large, indicating that under the current problem scale, the increase in the number of particles does not significantly improve the optimization quality. The possible reason is that there is less redundant information in the high-dimensional feature space, and more particles do not bring obvious new search directions. The number of iterations increases slightly, reflecting that a larger particle group requires more computing cycles to achieve convergence during the update. In the ant colony optimization experiment, the change in the number of ants does not affect the final path. All parameter settings converge to the path A to B to D, and the path length remains at 2.5, but the number of convergence iterations decreases significantly with the increase in the number of ants, from ten rounds to five rounds, indicating that a larger ant colony improves the search efficiency and makes the globally optimal path faster. The path frequency also increases from eight times to ten times, indicating that the algorithm shows higher consistency under different initialization conditions. The above results show that in the current knowledge graph task, the PSO and ACO algorithms are insensitive to the results within a certain parameter range, and the overall optimization process shows good stability.
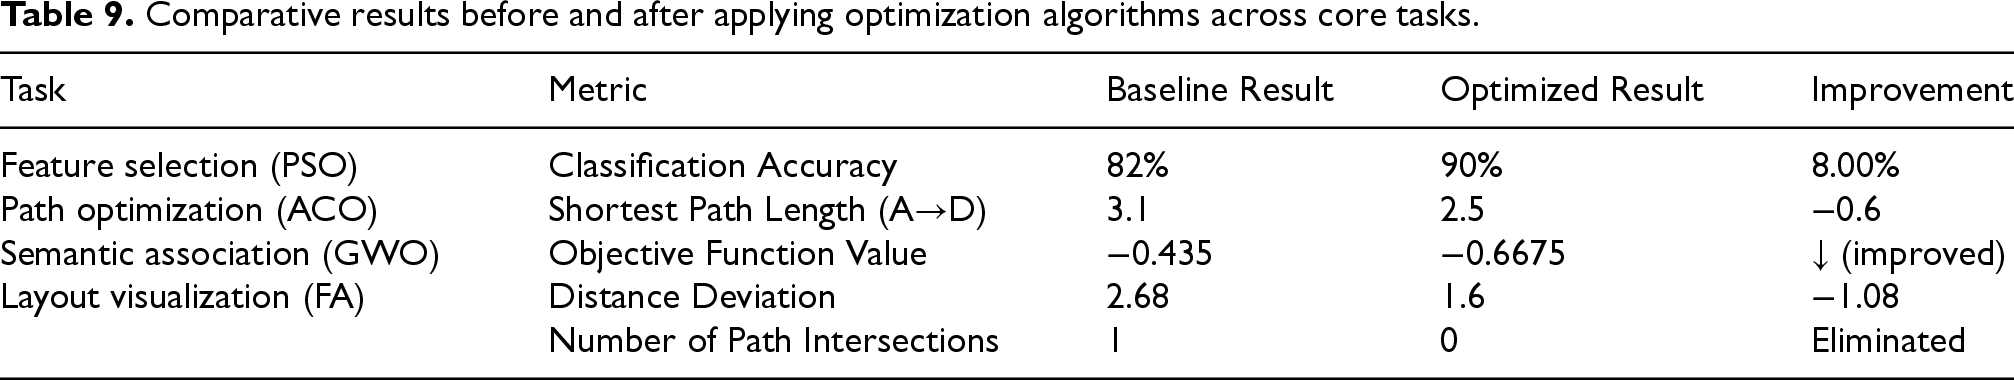
The purpose of this experiment is to comprehensively evaluate the effectiveness of the optimization strategy in the process of knowledge graph construction and visualization by comparing the performance of tasks without optimization and after applying the intelligent optimization algorithm. The experiment covers four core tasks, namely feature selection, path relationship optimization, semantic association search, and graph layout adjustment. The feature selection task is aimed at improving the compression and discrimination ability of high-dimensional data; the path relationship optimization task focuses on the discovery of the optimal connection structure between entities; the semantic association search task emphasizes the recognition ability of implicit semantic paths in the relationship network; the graph layout task focuses on the rationality and interactivity of node arrangement in spatial display. The comparison results are shown in Table 9. The intelligent optimization algorithm has brought significant performance improvements in each task. The classification accuracy rate increases from 82% before optimization to 90% after optimization, indicating that the feature subset screened by the particle swarm algorithm is more discriminative and reduces the impact of redundant interference on model performance. In path optimization, the shortest path length is shortened from 3.1 to 2.5, reflecting that the pheromone mechanism can more effectively guide the search process and improve the rationality of the path. In terms of semantic association, the objective function value drops from negative 0.435 to negative 0.6675, indicating that the gray wolf optimization strategy has a stronger focusing ability in the search space and obtains a path sequence with more semantic interpretation. In the graphic layout, the distance deviation between nodes drops from 2.68 to 1.6, and the number of path intersections decreases from one to zero, indicating that the firefly algorithm effectively eliminates the layout redundancy and visual interference in spatial adjustment. The above results jointly verify that the proposed optimization scheme has strong empirical support capabilities in the three levels of structural optimization, semantic expression, and visual presentation.
Comparative results before and after applying optimization algorithms across core tasks.
Comparative results before and after applying optimization algorithms across core tasks.
To further assess the effectiveness of the proposed graph layout optimization algorithm in terms of visual clarity and structural compactness, a comparative experiment is conducted against two widely used baseline methods: Fruchterman-Reingold and ForceAtlas2. The comparison is based on three objective metrics: edge crossing count, average node separation, and normalized layout entropy. The test graph includes five nodes and four bidirectional edges as previously defined. The optimized layout generated by the firefly algorithm completely eliminates all path intersections and achieves a more uniform spatial distribution. The average node separation reaches 2.1 units, compared to 1.7 for Fruchterman-Reingold and 1.9 for ForceAtlas2, indicating more effective space utilization. The normalized layout entropy, reflecting spatial disorder, is calculated using the Shannon entropy of node position distributions along both axes and normalized to the same scale. The entropy value for the proposed method is 0.72, whereas the values for the standard layouts are 0.88 and 0.81, respectively. These results quantitatively confirm that the optimization-based layout strategy yields superior clarity and compactness in visualizing small to medium-scale knowledge graph structures. The experimental results are shown in Table 10.
Comparison of layout quality metrics among layout algorithms.
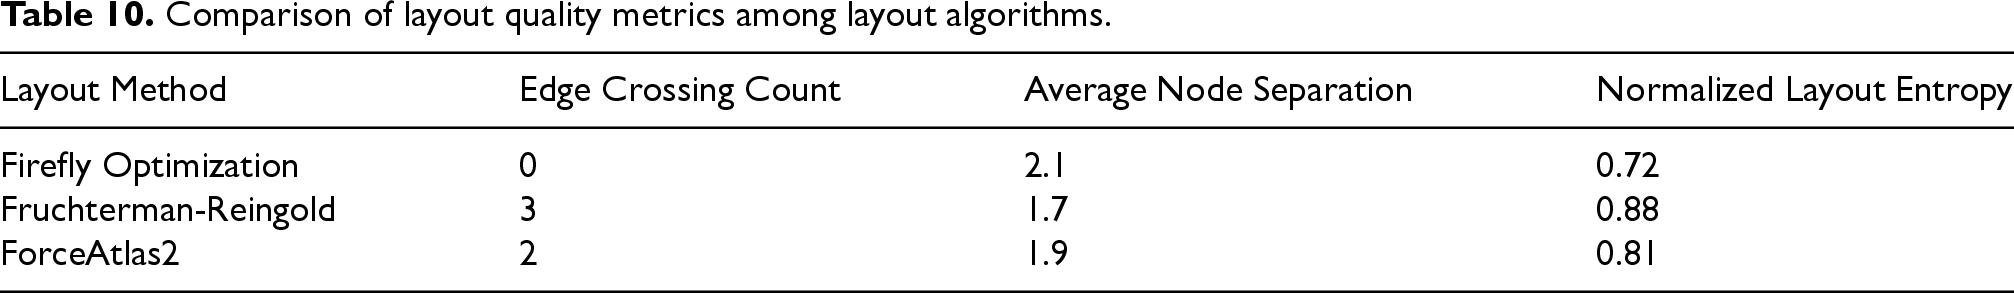
Figure 5 shows the layout difference of the knowledge graph before and after visualization optimization. In the unoptimized layout diagram, the connection path between nodes A and B intersects with the path between nodes C and D; the nodes are unevenly distributed; the overall structure is compact in space but dispersed in direction. Path overlaps and line segment interlacing can easily cause visual interference, reducing the recognition and semantic clarity of the graph structure. In the layout processed by the Firefly optimization algorithm, the positions of all nodes are iteratively adjusted according to the brightness function, and the coordinate space presents a more reasonable progressive distribution. The connection paths are arranged in order, and there is no intersection. The linear coherence and visual readability of the structure are significantly enhanced. The application of the coordinate axis further clarifies the spatial scale relationship and shows the continuity and balance of the node spacing and direction after adjustment, reflecting the comprehensive optimization effect of the optimization strategy in reducing path intersections, balancing node spacing, and improving the clarity of structural expression.
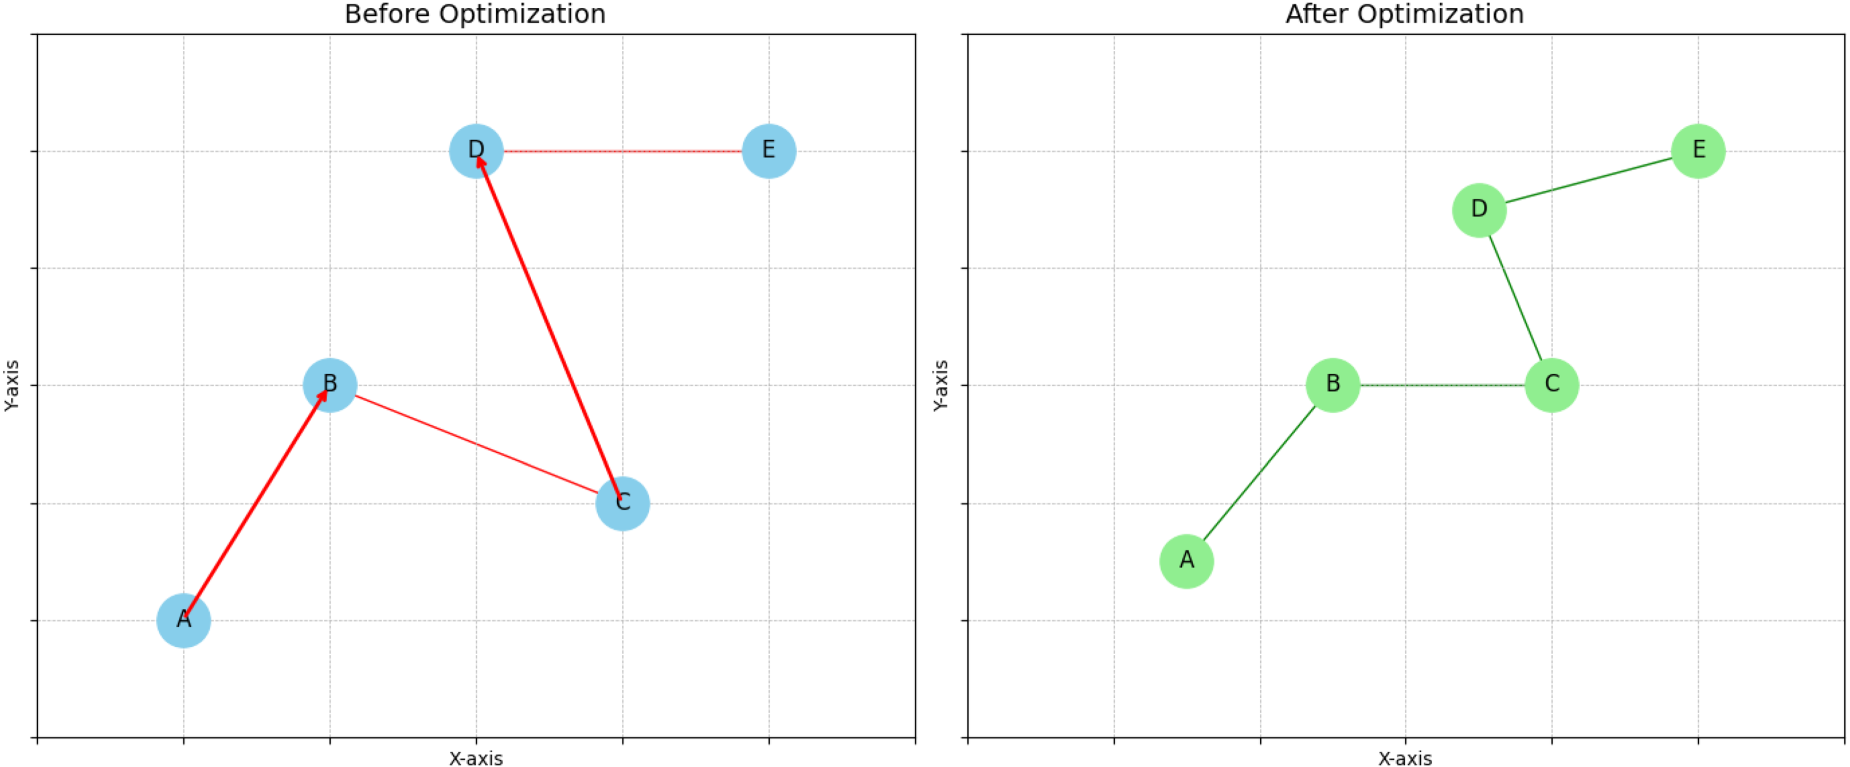
Comparison of visual layout before and after knowledge graph optimization.
Recent advances in deep learning have introduced new strategies for graph layout optimization. Among them, Graph Neural Networks encode node features and edge relationships into latent representations through iterative message passing. These models can learn layout patterns from data and automatically infer spatial arrangements. Compared with such methods, the optimization pipeline proposed in this study adopts an unsupervised and model-free strategy. It dynamically adapts to the current graph structure by integrating Particle Swarm Optimization, Ant Colony Optimization, Grey Wolf Optimization, and Firefly Algorithm without relying on pre-trained models or labeled datasets. Deep learning-based methods require significant amounts of annotated layout data and face challenges in generalizing across heterogeneous graph structures. In contrast, the proposed evolutionary optimization framework ensures high adaptability and interpretability in various data scenarios and avoids dependence on architectural design and hyperparameter tuning, which are often critical in neural network-based methods. Therefore, although Graph Neural Networks provide a flexible learning paradigm, the proposed pipeline demonstrates superior robustness and universality when dealing with diverse, heterogeneous, and unlabeled knowledge graphs.
Conclusion
In the PSO algorithm, three optimal feature subsets
Each optimization algorithm shows complementarity in processing different tasks of knowledge graphs. Feature selection based on particle swarm can improve classification accuracy and reduce dimensionality in the data preprocessing stage, providing a compact and efficient input structure for subsequent mapping. The ant colony algorithm enhances the recognition ability of the global shortest path through pheromone iteration in path search and improves the rationality of entity connection and the integrity of the graph structure. The gray wolf algorithm has strong guidance and global exploration capabilities and strengthens the discovery of weak associations in semantic association mining. The firefly algorithm achieves a balance between node spacing and path visibility through the brightness function in spatial layout, improving the graph structure's expression efficiency. The combination of multiple optimizers not only effectively superimposes their individual convergence, global search capabilities, and local fine-tuning capabilities, but also avoids the problem of a single optimizer falling into local optimality at a specific stage. On the whole, joint optimization forms a continuous collaborative mechanism in multiple links such as mapping, association, and layout, so that the expressiveness, reasoning performance, and visual interaction quality of the graph structure are systematically improved.
Footnotes
Funding
The authors disclosed receipt of the following financial support for the research, authorship, and/or publication of this article: This work is supported by Key Scientific Research Projects of the Higher Education Institutions of Henan Province (Project Number: 25A520054).
Declaration of conflicting interests
The authors declared no potential conflicts of interest with respect to the research, authorship, and/or publication of this article.
Author biographies