
Abstract
With increasing climate change urgency and regulatory pressures, corporations are expected to adopt transparent and efficient environmental accounting practices. In China, where industrialization often outpaces sustainability, there is a need for intelligent tools to align business performance with environmental responsibility. Despite the existence of environmental key performance indicators (KPIs), many organizations struggle with adopting suitable environmental accounting strategies due to a lack of data-driven frameworks. Traditional approaches often overlook the complexity and industry-specific nature of sustainability data, leading to poor decision-making. This research proposes EcoStratClass, a machine learning-based framework for classifying Chinese corporations into appropriate Environmental Accounting Strategy types based on sustainability performance. Using the Smart Sustainability & Environmental Accounting in Chinese Corporations (SSEC-ChiCorp) dataset, the methodology involves advanced data preprocessing, including attribute removal, target mean encoding, PCA for categorical reduction, ordinal mapping for audit frequency, and hybrid normalization techniques (Z-score, Min-Max, and Box-Cox). The Environmental Signature Score (ESS) quantifies overall sustainability impact, considering CO2 emissions, energy usage, recycling, and renewable resource consumption. Feature selection employs the Environmental Signature Learning (ESL) method, combining Mutual Information, Chi-Square, ANOVA F-test, Recursive Feature Elimination (RFE), and models like LightGBM, Random Forest, and SVM. The classification model uses a stacked ensemble of LightGBM, Random Forest, and SVM, with Logistic Regression as the meta-learner. SHAP values improve model explainability by highlighting influential attributes. With an accuracy of 92.87%, the model achieves strong performance in various metrics (macro precision, recall, F1 score). EcoStratClass offers a reliable, interpretable decision-support system to guide corporations in selecting effective environmental accounting strategies, promoting ESG-aligned sustainable development.
Keywords
Introduction
Environmental accounting has emerged as a critical discipline in the age of worldwide climate change and sustainability-driven governance. 1 With growing concern about ecological degradation, carbon emissions, and resource scarcity, there is a greater emphasis on incorporating environmental responsibility into corporate decision-making. 2 Governments, investors, and stakeholders are increasingly holding companies accountable for their environmental influence, driving up demand for transparent and structured environmental accounting tactics. In China, the difficulty is exacerbated by the quick pace of industrialization, which frequently overshadows sustainable practices, rendering environmental accountability an intricate but critical aspect of contemporary corporate governance. 3
In current years, the incorporation of technology, particularly data analytics and machine learning, has greatly sophisticated the area of environmental accounting. Tools have been created to track environmental performance indicators like carbon dioxide emissions, energy consumption, and waste management. Different environmental accounting frameworks have been proposed worldwide, ranging from process-based and cost-based accounting to more sophisticated tactics such as Strategic Environmental Management Accounting (SEMA) and Sustainability Performance Indicators (SPI). Machine learning is increasingly being investigated for pattern detection, decision support, and predictive analytics in sustainability contexts.4,5,6
Background
Despite the availability of environmental data and performance indicators, Chinese corporations frequently face difficulties in choosing and executing appropriate environmental accounting policies. Conventional classification methods are not adaptable to intricate, multidimensional datasets and do not account for industry-specific differences. Furthermore, the lack of explainable, data-driven frameworks impedes efficient tactical decision-making and regulatory compliance.
The purpose of this study is to develop and validate a machine learning-based framework capable of accurately categorizing Chinese corporations into suitable environmental accounting approach types using their sustainability performance. The goal is to offer corporations actionable and understandable insights that align their environmental practices with national and international sustainability goals.
A new algorithm named EcoStratClass is proposed, integrating sophisticated data preprocessing, Environmental Signature Score (ESS) computation, hybrid feature selection via Environmental Signature Learning (ESL), and a stacked ensemble classification model integrating LightGBM, Random Forest, SVM, and Logistic Regression. The model's interpretability is improved by SHAP analysis, and its performance is assessed utilizing standard multiclass classification metrics.
This study provides a scientifically rigorous and interpretable machine-learning framework that improves corporate environmental accountability. It offers a scalable approach to categorizing environmental accounting tactics, allowing policymakers, sustainability analysts, and corporations to make data-driven decisions. Finally, it improves the alignment between corporate behavior and global ESG (Environmental, Social, Governance) objectives, representing a step forward in incorporating artificial intelligence (AI) with sustainability science.
Literature review
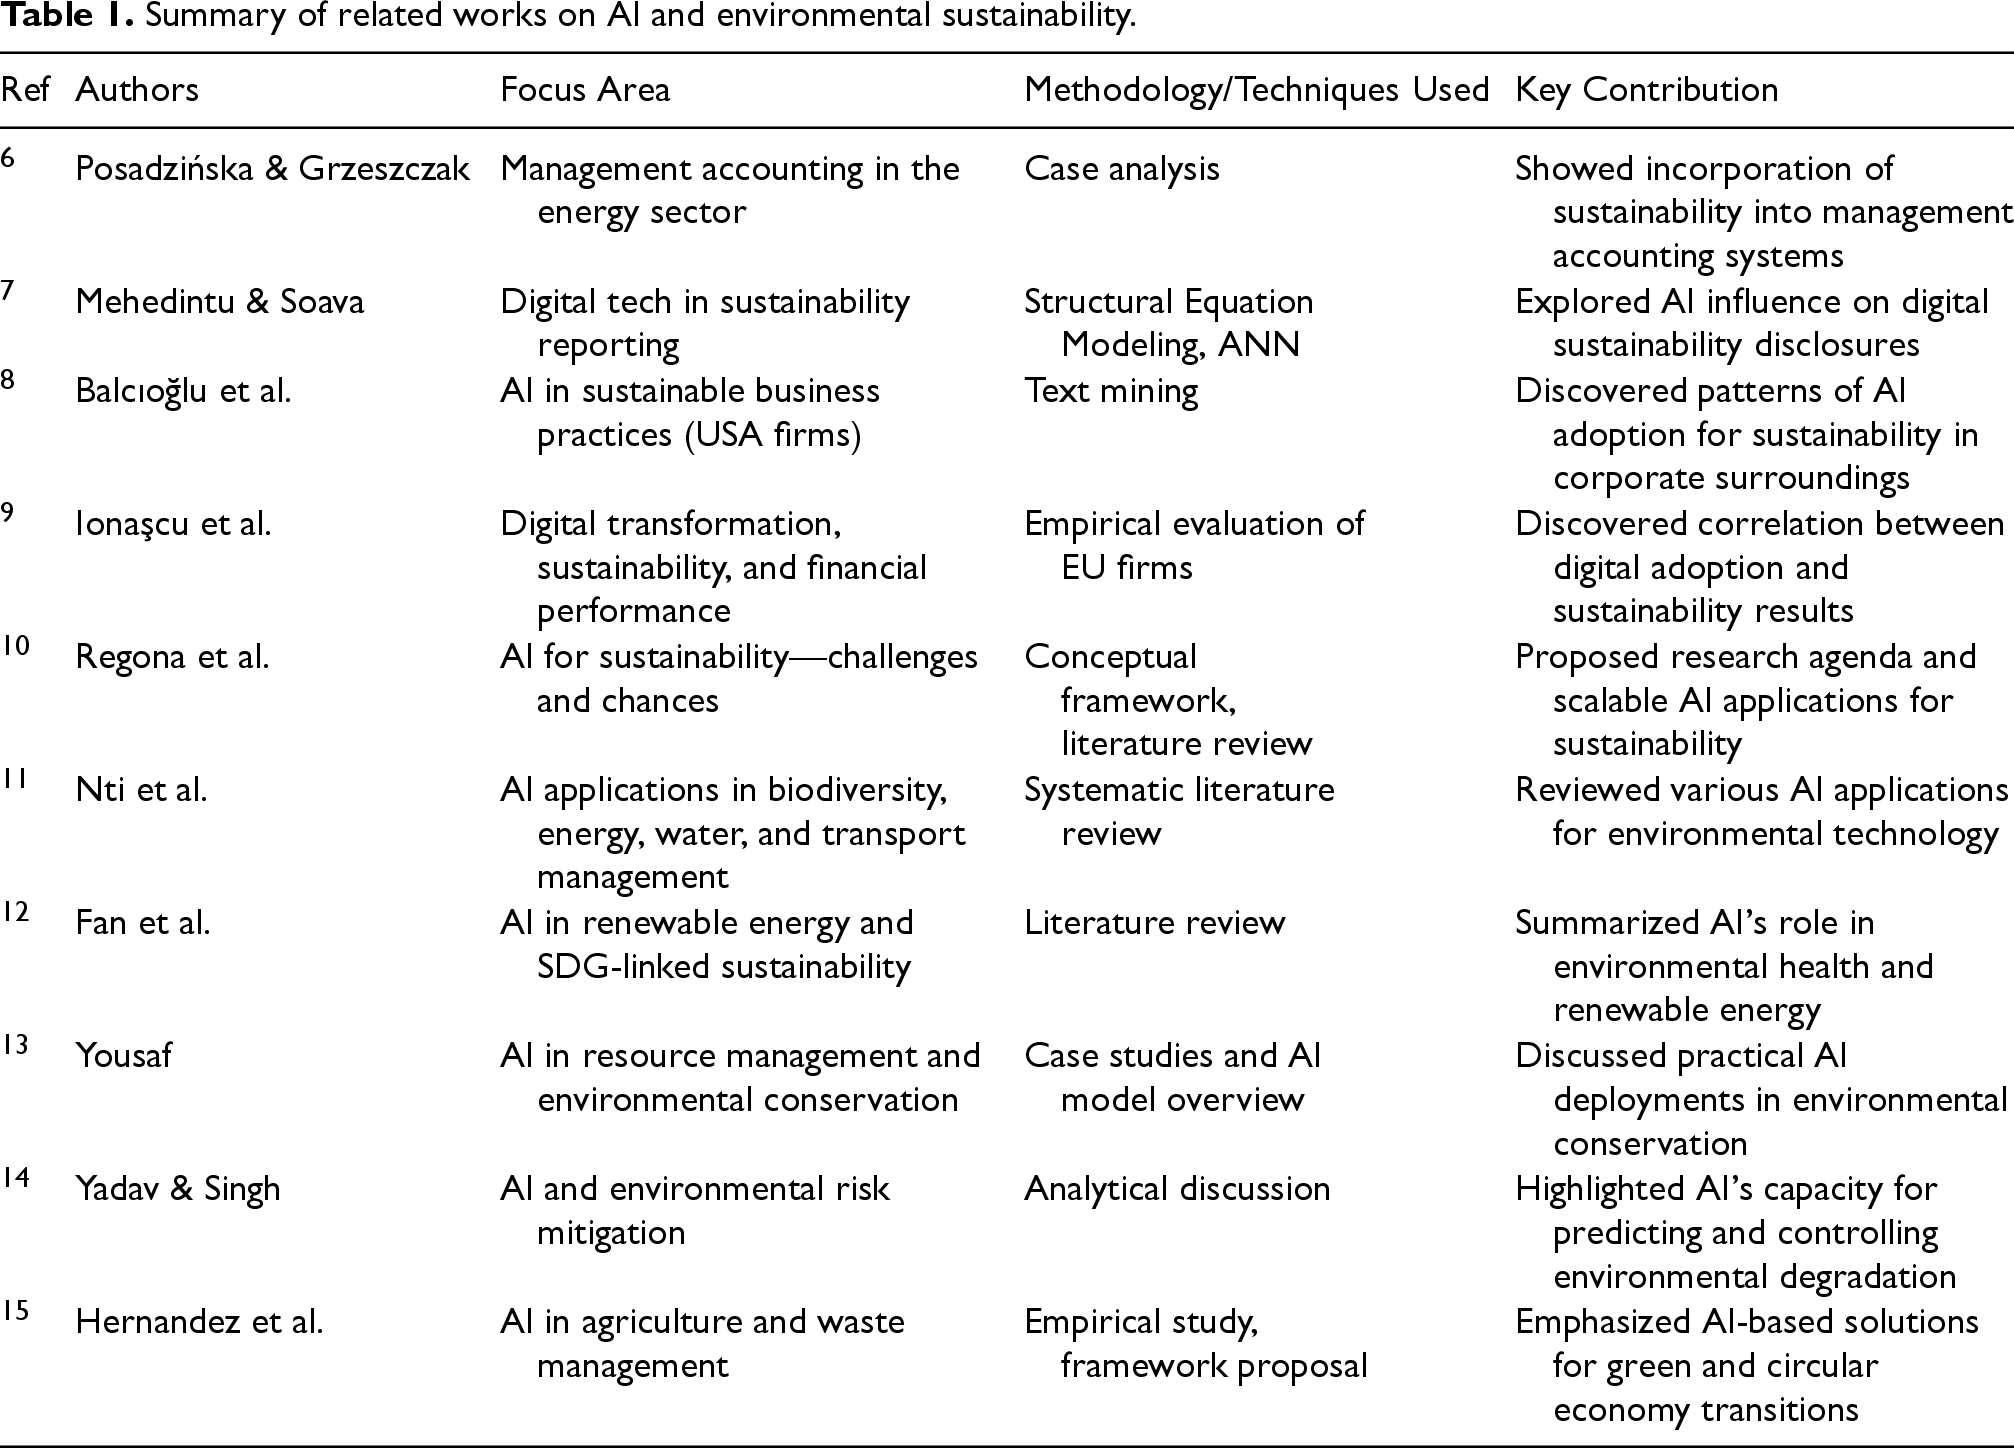
The intersection of sustainability, environmental accounting, and AI has sparked growing academic and industrial interest in the past few years. Researchers investigated how management accounting systems can help intelligent energy sector enterprises run more efficiently, with a focus on incorporating sustainability metrics into conventional financial models. Posadzińska and Grzeszczak 6 showed how management accounting can be strategically restructured to promote eco-conscious decision-making in energy-intensive industries. Similarly, Mehedintu and Soava 7 examined the impact of digital technologies on sustainability reporting, using structural equation modeling and artificial neural networks to reveal how AI tools can improve the dependability and precision of corporate sustainability disclosures.
In the wider context of AI incorporation in sustainable business practices, Balcıoğlu et al. 8 applied text mining to evaluate U.S. firms, uncovering patterns that recommend AI is becoming a critical enabler for embedding sustainability in corporate tactics. At a regional level, Ionaşcu et al. 9 analyzed European Union-listed companies and discovered that digital transformation positively correlates with both financial performance and sustainability results, reinforcing the role of technology in shaping responsible business behavior.
Nishant et al. 10 outlined an extensive agenda for AI-driven sustainability, highlighting both the difficulties and opportunities associated with using AI for sustainable development. Their work highlighted the importance of explainable and scalable AI frameworks that can adapt to a wide range of environmental data sets. Nti et al. 11 extended this direction by conducting a systematic review of how AI supports environmental sustainability across important sectors such as biodiversity, energy, water, and transportation management, highlighting the versatility of AI applications in environmental problem-solving.
Furthermore, Fan et al. 12 and Yousaf 13 reviewed the use of deep learning and AI in domains aligned with the Sustainable Development Goals (SDGs), with applications ranging from renewable energy efficiency to environmental health monitoring. Yadav and Singh 14 highlighted AI's ability to track, predict, and reduce environmental risks, thereby encouraging cleaner production and resource effectiveness. Furthermore, Hernandez et al. 15 investigated the role of AI in sustainable agriculture and waste management, presenting intelligent frameworks for attaining green growth and circular economy goals.
These studies emphasize the transformative potential of AI in promoting sustainability, but they also emphasize a persistent gap in AI-driven models designed for strategic environmental accounting decisions, especially in quickly creating economies such as China. Table 1 presents a summary of related works on AI and environmental sustainability.
Summary of related works on AI and environmental sustainability.
Summary of related works on AI and environmental sustainability.
This study's main contribution and novelty is the creation of EcoStratClass, a novel machine learning-based classification framework designed for selecting environmental accounting strategies in Chinese corporations. EcoStratClass introduces the ESS, a composite metric that quantifies sustainability impact through key indicators like CO2 emissions, energy consumption, recycling rates, and renewable resource utilization. The study proposes an advanced preprocessing pipeline that combines hybrid normalization (Z-score, Min-Max, Box-Cox), target mean encoding, ordinal mapping, and PCA to reduce dimensionality while ensuring optimal feature representation. The ESL feature selection method is a significant innovation because it combines multiple statistical filters (Mutual Information, Chi-Square, ANOVA F-test) and wrapper methods (RFE) with a majority voting mechanism enhanced by LightGBM, SVM, and Random Forest. For classification, a strong stacked ensemble model is used, along with Logistic Regression as a meta-learner, to achieve high accuracy and balanced class-wise performance. Furthermore, model interpretability is addressed through SHAP analysis, which emphasizes each feature's contribution, making the system both transparent and usable. These contributions help to advance the field by providing a context-sensitive, interpretable, and high-performance decision-support system for guiding ESG-aligned environmental accounting practices.
The EcoStratClass framework's development and evaluation are presented methodically in this study. It begins with a description of the SSEC-ChiCorp dataset, followed by data preprocessing using Sustainability Signature Engineering. Feature engineering introduces the ESS to measure sustainability performance, while ESL is proposed as a hybrid feature selection method. A stacked ensemble model handles the classification task for multi-class strategy prediction, while SHAP-based model explanation and visualization improve interpretability. Results and discussions provide performance metrics and comparative analysis before moving on to a wider discussion of the model's significance and concluding with key findings and next steps.
Methodology
This study proposes EcoStratClass, a machine learning-based classification framework, to efficiently predict the Environmental Accounting Strategy (EAS) used by contemporary corporations. The methodology employs a systematic pipeline that includes data preprocessing, feature engineering, feature selection, classification modeling, interpretability analysis, and evaluation. Each step is carefully designed to align with sustainability goals and the variety of environmental data utilized in corporate reporting.
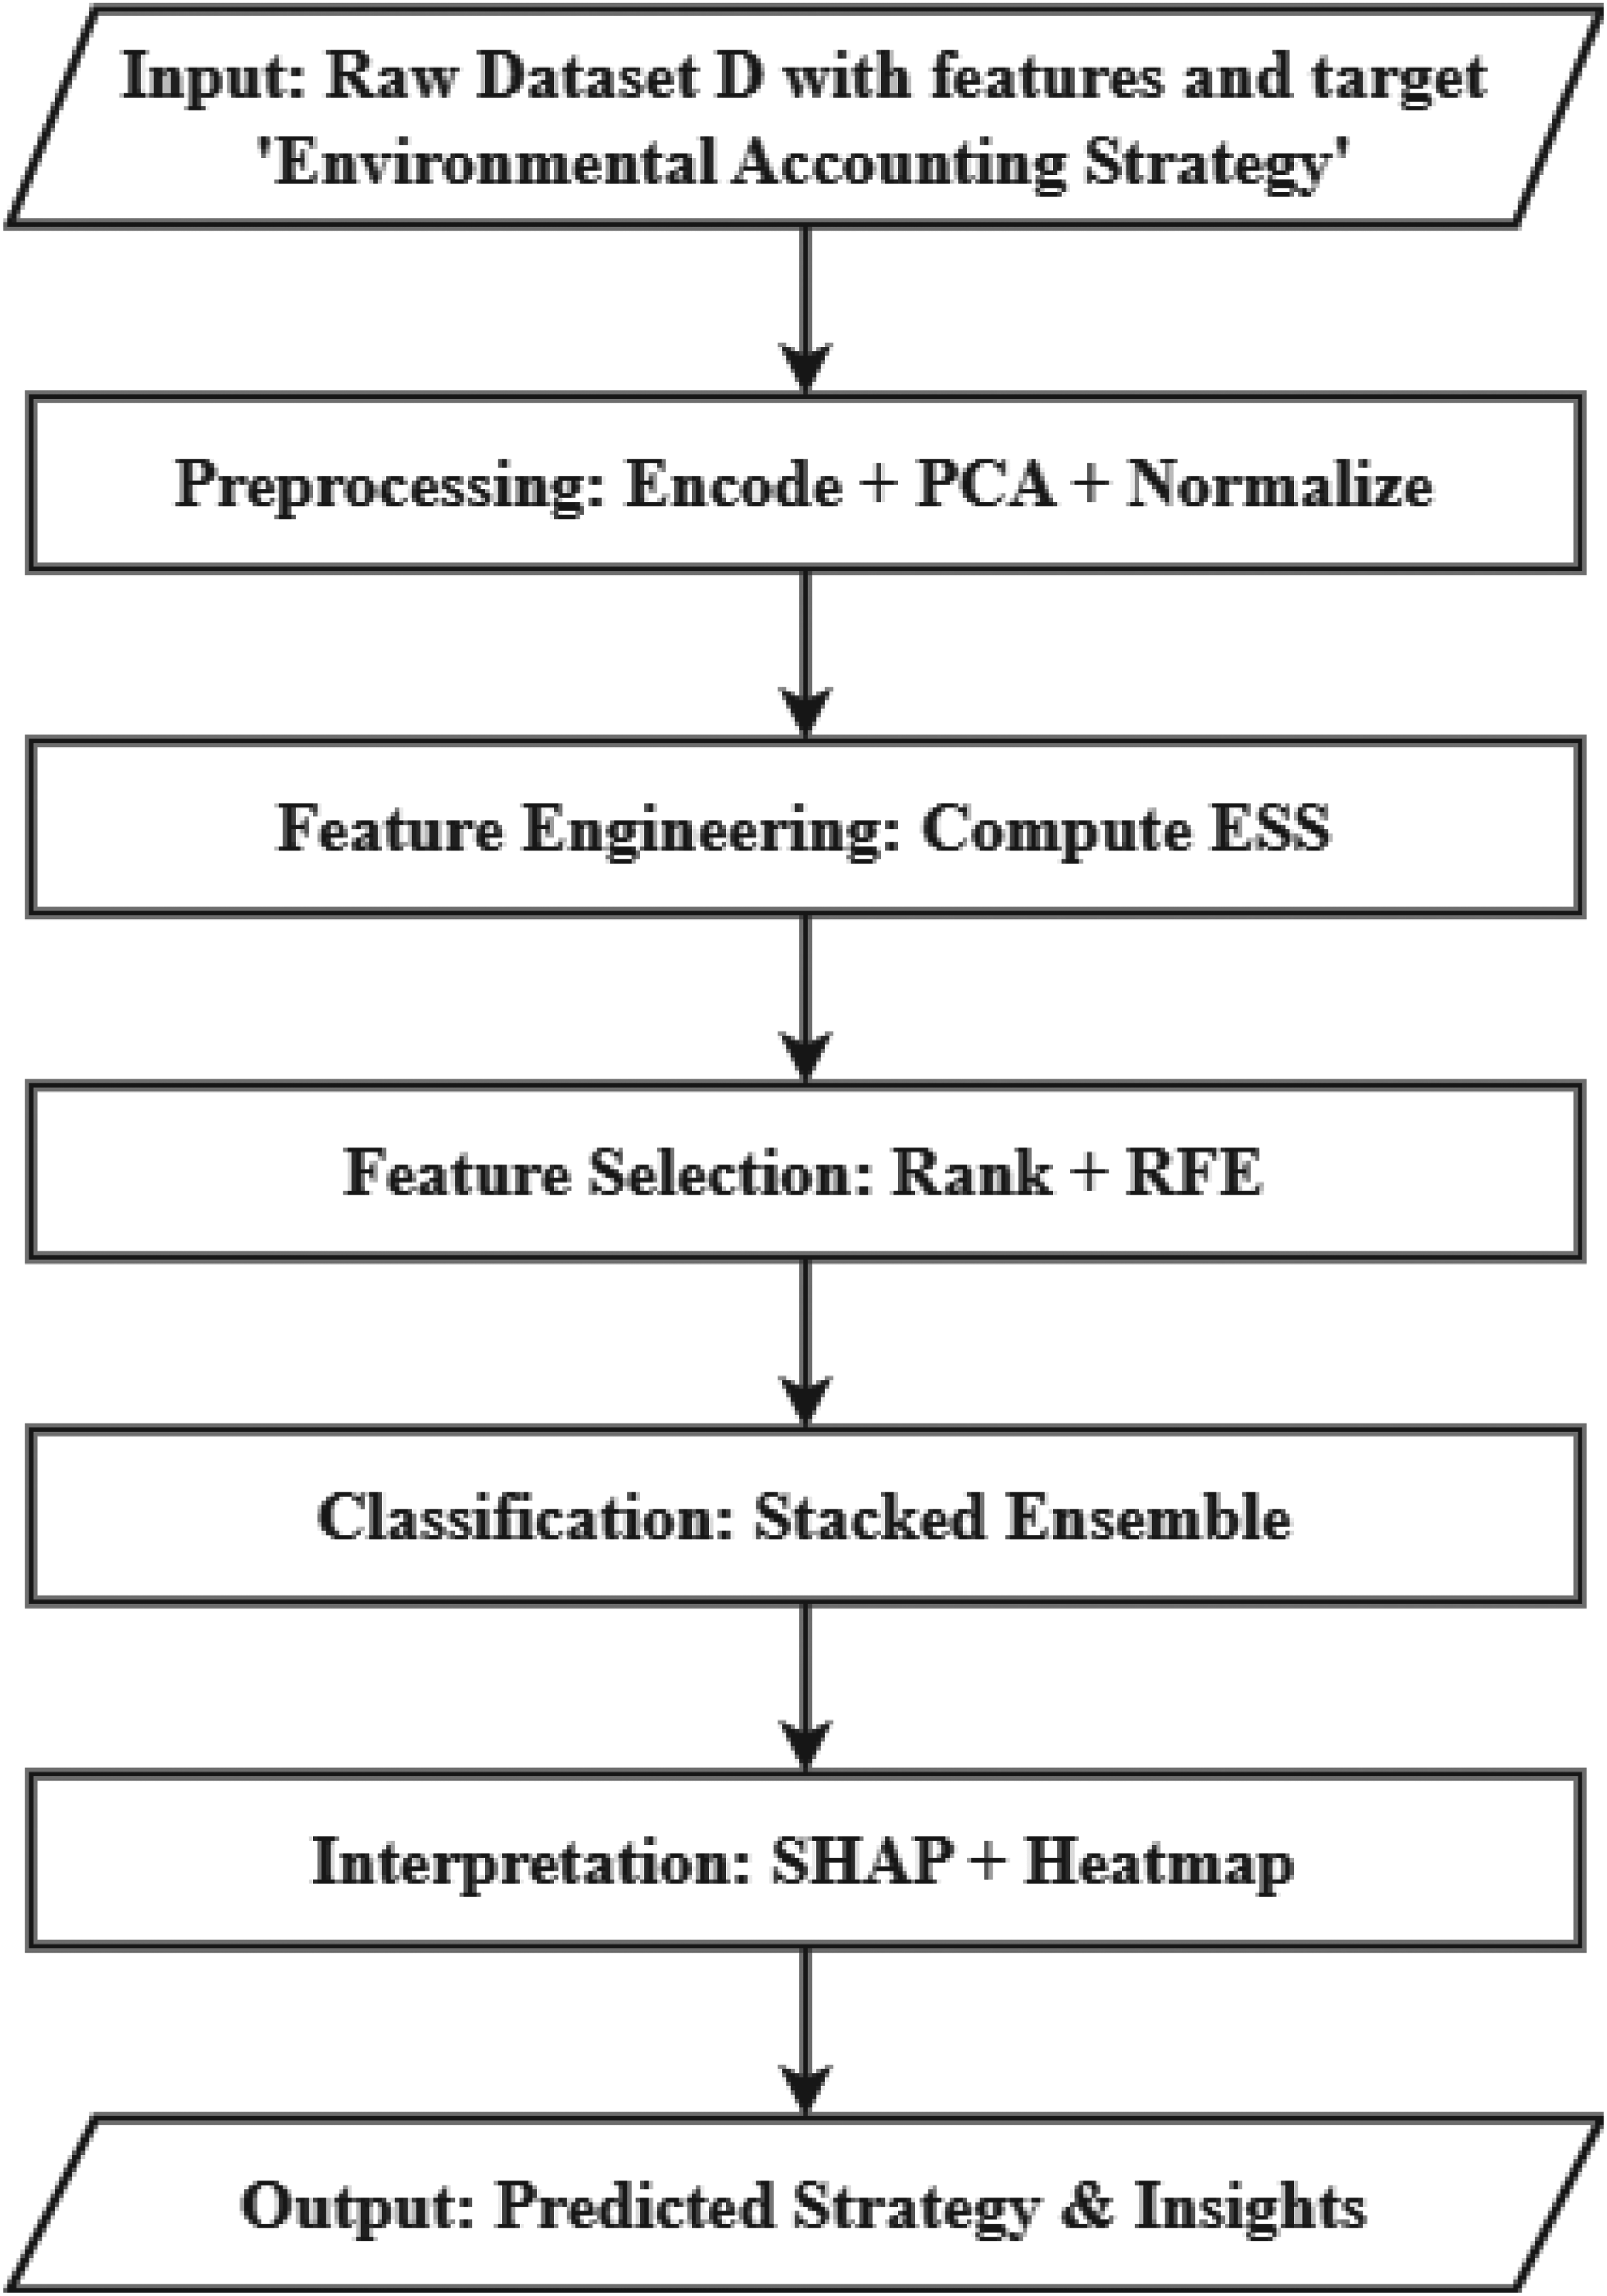
The proposed model, EcoStratClass recommends appropriate environmental accounting tactics for Chinese corporations depending on sustainability performance. The model starts with data preprocessing, which includes eliminating irrelevant identifiers, encoding categorical variables (for example, mapping audit frequency ordinally and utilizing target mean encoding for industry and region), utilizing PCA to reduce the dimensionality of encoded features, and executing hybrid normalization methods (Z-score, Min-Max, Box-Cox) for various numerical attributes. During feature engineering, an ESS is calculated by combining CO2 emissions, energy use, and waste with renewable and recycling efforts and added as a key feature. Feature selection is done using the ESL method, which combines Mutual Information, ANOVA F-test, Chi-Square, and Recursive Feature Elimination (RFE) with Random Forest, with the final set of features chosen by majority voting. For classification, the model employs a stacked ensemble approach that includes LightGBM, Random Forest, and SVM (RBF) as base learners, Logistic Regression as the meta-learner, and F1-score-based weighted voting to improve prediction for minority classes. Finally, model interpretation is accomplished using SHAP values, which provide insights into the most influential features via visual tools such as SHAP bar plots and sustainability fingerprint heatmaps, guaranteeing transparency and decision support in ESG-aligned tactic selection. Figure 1 shows the model diagram of this EcoStratClass model.
Ecostratclass model diagram.
The model starts with the raw dataset (SSEC-ChiCorp), which is preprocessed utilizing smart encoding methods such as target mean encoding and ordinal mapping, dimensionality reduction via PCA, and hybrid normalization with Z-score, Min-Max, and Box-Cox transformations. Feature engineering calculates the ESS, a composite metric that includes CO2 emissions, energy use, recycling, and renewable efforts. The ESL technique is used to choose features, which integrates Mutual Information, Chi-Square, ANOVA F-test, and RFE with several classifiers (LightGBM, RF, SVM), which are then voted on by the majority. The classification stage employs a stacked ensemble model with LightGBM, Random Forest, and SVM as base learners and Logistic Regression as meta-learner, with F1-score-weighted voting. SHAP values and heatmaps are used to discover key influential attributes and increase transparency. The final output includes both the predicted accounting tactic and actionable insights to help make ESG-aligned decisions.
This study utilizes a synthetic dataset called Smart Sustainability & Environmental Accounting in Chinese Corporations (SSEC-ChiCorp), which was created especially to simulate the realistic environmental and sustainability accounting profiles of various Chinese corporations. The dataset is not publicly available online and was created artificially for academic modeling, interpretability benchmarking, and experimental validation of machine learning-based tactic prediction in environmental accounting domains.
The dataset was created by combining realistic values derived from patterns observed in publicly disclosed Chinese corporate sustainability reports, energy audit summaries, and industrial environmental performance indicators, which were mainly sourced from government whitepapers and ESG-oriented corporate documentation. This paper modeled industry-specific ranges for CO2 emissions, energy consumption, and revenue figures based on reference values from Manufacturing, Agriculture, Pharmaceuticals, and Energy. Random Gaussian noise was used to simulate inter-company variability while retaining logical correlations. For instance, in energy-intensive industries, higher energy usage correlates with higher CO2 emissions and waste generation.
To simulate realistic environmental behaviors, domain-informed distributions were used. For example, Renewable Energy (%) and Recycling Rate (%) were calculated with higher values for sectors like Agriculture and Waste Management, indicating typical ESG alignment. Environmental Audit Frequency and Accounting Strategy (Target) were allocated using plausible environmental governance maturity, which is frequently related to company size, region, and sectoral awareness.
The dataset includes ten distinct corporations, each represented by 13 features that capture financial, environmental, and operational dimensions, as well as a labeled environmental accounting tactic category. The target variable is the “Environmental Accounting Strategy,” which is divided into four major methods:
Process-based Accounting Cost-based Accounting Strategic Environmental Management Accounting Sustainability Performance Indicators (SPI)
Environmental indicators comprise energy usage (kWh), water consumption (m3), CO2 emissions (tons), waste production (kg), and adoption metrics such as renewable energy (%) and recycling rate (%). The Region and Industry columns provide contextual metadata to account for geographical and sectoral impacts on sustainability performance.
The dataset's synthetic nature enables controlled experimentation while maintaining the structural intricacy and variability that characterize practical environmental data. This allows for reliable validation of the proposed classification models, feature importance evaluations, and interpretability visualizations, all while guaranteeing ethical use and not disclosing sensitive or proprietary data.
Data preprocessing: sustainability signature engineering
The preprocessing phase starts with improving the input dataset, which includes corporate environmental and operational data on revenue, energy usage, CO2 emissions, waste generation, and audit frequency. Non-informative identifiers, such as ID and Company Name, are excluded to reduce noise. Categorical features are managed utilizing a hybrid encoding strategy.
Specifically, the ordinal variable Environmental Audit Frequency is encoded numerically to reflect its regulatory significance which is shown in Eq. (1).
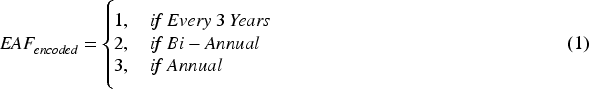
Additionally, categorical areas like Industry and Region are transformed using Target Mean Encoding, which uses environmental KPIs to uncover sustainability-driven patterns. To avoid multicollinearity and overfitting, the resulting high-dimensional encodings are decreased by utilizing Principal Component Analysis (PCA) to form latent sustainability vectors, as shown in Eq. (2).

Where:
X is the matrix of encoded features W is the PCA weight matrix Z is the lower-dimensional representation
For numeric data, a hybrid normalization method is employed. Skewed continuous features like revenue and CO2 emissions are standardized utilizing Z-score normalization which is demonstrated in Eq. (3).

Where,
x: The original value of the feature (a numerical observation). µ: The mean of the feature across all data points. σ: The standard deviation of the feature. z: The standardized score (z-score) of the feature.
Bounded attributes, like renewable energy percentage and recycling rate, are scaled utilizing Min-Max normalization which is demonstrated in Eq. (4).

Where,
x: The original value of the feature.
While exponential variables (e.g., waste and water utilization) undergo Box-Cox transformation to normalize their distribution which is demonstrated in Eq. (5).
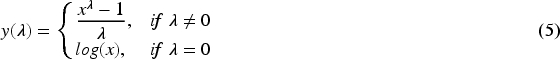
Where,
x: The original strictly positive value (Box-Cox requires x > 0). λ: The transformation parameter (estimated utilizing maximum likelihood). y(λ): The transformed value after performing the Box-Cox function.
This comprehensive preprocessing phase guarantees a harmonized feature space for efficient model learning.
To incorporate environmental influence into the learning procedure, a new composite metric called the Environmental Signature Score (ESS) is presented. The ESS is a weighted function of important environmental indicators, including CO2 emissions, energy utilization, and waste production, adjusted against the average renewable energy adoption and recycling rate. The mathematical definition is as follows:

This metric captures the net environmental burden concerning sustainable practices, providing a comprehensive view of corporate sustainability behavior. The ESS feature has been incorporated into the dataset to improve model interpretability and support nuanced classification.
The Environmental Signature Learning (ESL) method is used to effectively decrease the dimensionality of input data while maintaining essential predictive power. This approach begins by combining three well-known feature selection techniques—Mutual Information, the ANOVA F-test, and the Chi-Square Test—each chosen for its distinctive perspective on feature relevance. Mutual Information captures non-linear dependencies between attributes and the target variable; the ANOVA F-test assesses discriminative power by measuring variance between group means; and the Chi-Square Test assesses statistical independence between categorical attributes and the target class. The findings of these techniques are aggregated utilizing a majority voting mechanism, which enables a consensus-based detection of attributes that are consistently ranked as influential.
This initial pool of attributes is then improved using RFE with a Random Forest Classifier. RFE trains the model recursively, ranking features by significance and removing the least significant ones in subsequent iterations. The Random Forest's inherent feature significance capacities, combined with its resistance to overfitting, make it ideal for this task. The result is a compact yet highly informative set of attributes that not only enhances computational effectiveness but also enhances model transparency and interpretability—especially when dealing with environmental datasets where comprehending the impact of individual variables is as significant as precise prediction.
Classification model: multi-class strategy predictor
The EcoStratClass algorithm's central prediction mechanism is an advanced stacked ensemble model that was created specifically to manage multi-class classification tasks related to various environmental accounting tactics. This model architecture combines the advantages of three different base classifiers, LightGBM, Random Forest, and Support Vector Machine (SVM), with a radial basis function (RBF) kernel. Each of these learners is trained on the optimized feature set obtained in the ESL phase, enabling them to independently learn distinctive trends in the sustainability-related data.
After the base models have made their predictions, a Logistic Regression meta-learner is employed to combine these results into a final decision. This two-layer architecture enhances generalization while also reducing individual model biases. To improve accuracy, a weighted voting tactic is used, especially for underrepresented classes like SPI and SEMA. This scheme dynamically prioritizes base models with better performance in minority classes, tackling class imbalance issues. The result is a balanced, robust, and fair classification framework able to accurately predict diverse environmental accounting tactics across different corporate sustainability profiles.
Hyper-parameters were optimized by grid search: for LightGBM, num_leaves = 31, learning_rate = 0.05, n_estimators = 100; for Random Forest, n_estimators = 150, max_depth = 10, and max_features = ‘sqrt’; and for SVM, C = 1.0, gamma = ‘scale’. The Logistic Regression meta-learner utilized L2 regularization with C = 0.1. A stratified 5-fold cross-validation (CV) setup was utilized to ensure dependable model evaluation and preserve class distribution across folds. To evaluate statistical significance, we conducted paired t-tests and Wilcoxon signed-rank tests comparing EcoStratClass against baseline models across numerous performance metrics, proving that enhancements were statistically significant (p < 0.05), therefore validating the robustness and efficiency of the proposed model.
Model explanation and visualization
Interpretability is an important aspect of the EcoStratClass framework. SHAP (SHapley Additive ExPlanations) values are used to offer actionable insights into model decisions. SHAP values reveal how each feature contributes to the predicted result for individual instances. These insights are visualized using summary bar plots, displaying global feature significance across strategy classes.
Figure 2 depicts a SHAP summary bar plot with the top ten most influential features utilized by the EcoStratClass model to predict environmental accounting tactics. Each bar represents a feature's average SHAP value, which quantifies its overall impact on the model's output. CO2 Emissions, Energy Usage, and Waste Produced are the top features that influence classification decisions. Other notable features comprise Renewable Energy (%), Recycling Rate (%), and a composite ESS. This visual highlights the model's strong emphasis on sustainability indicators when determining a company's environmental tactic.
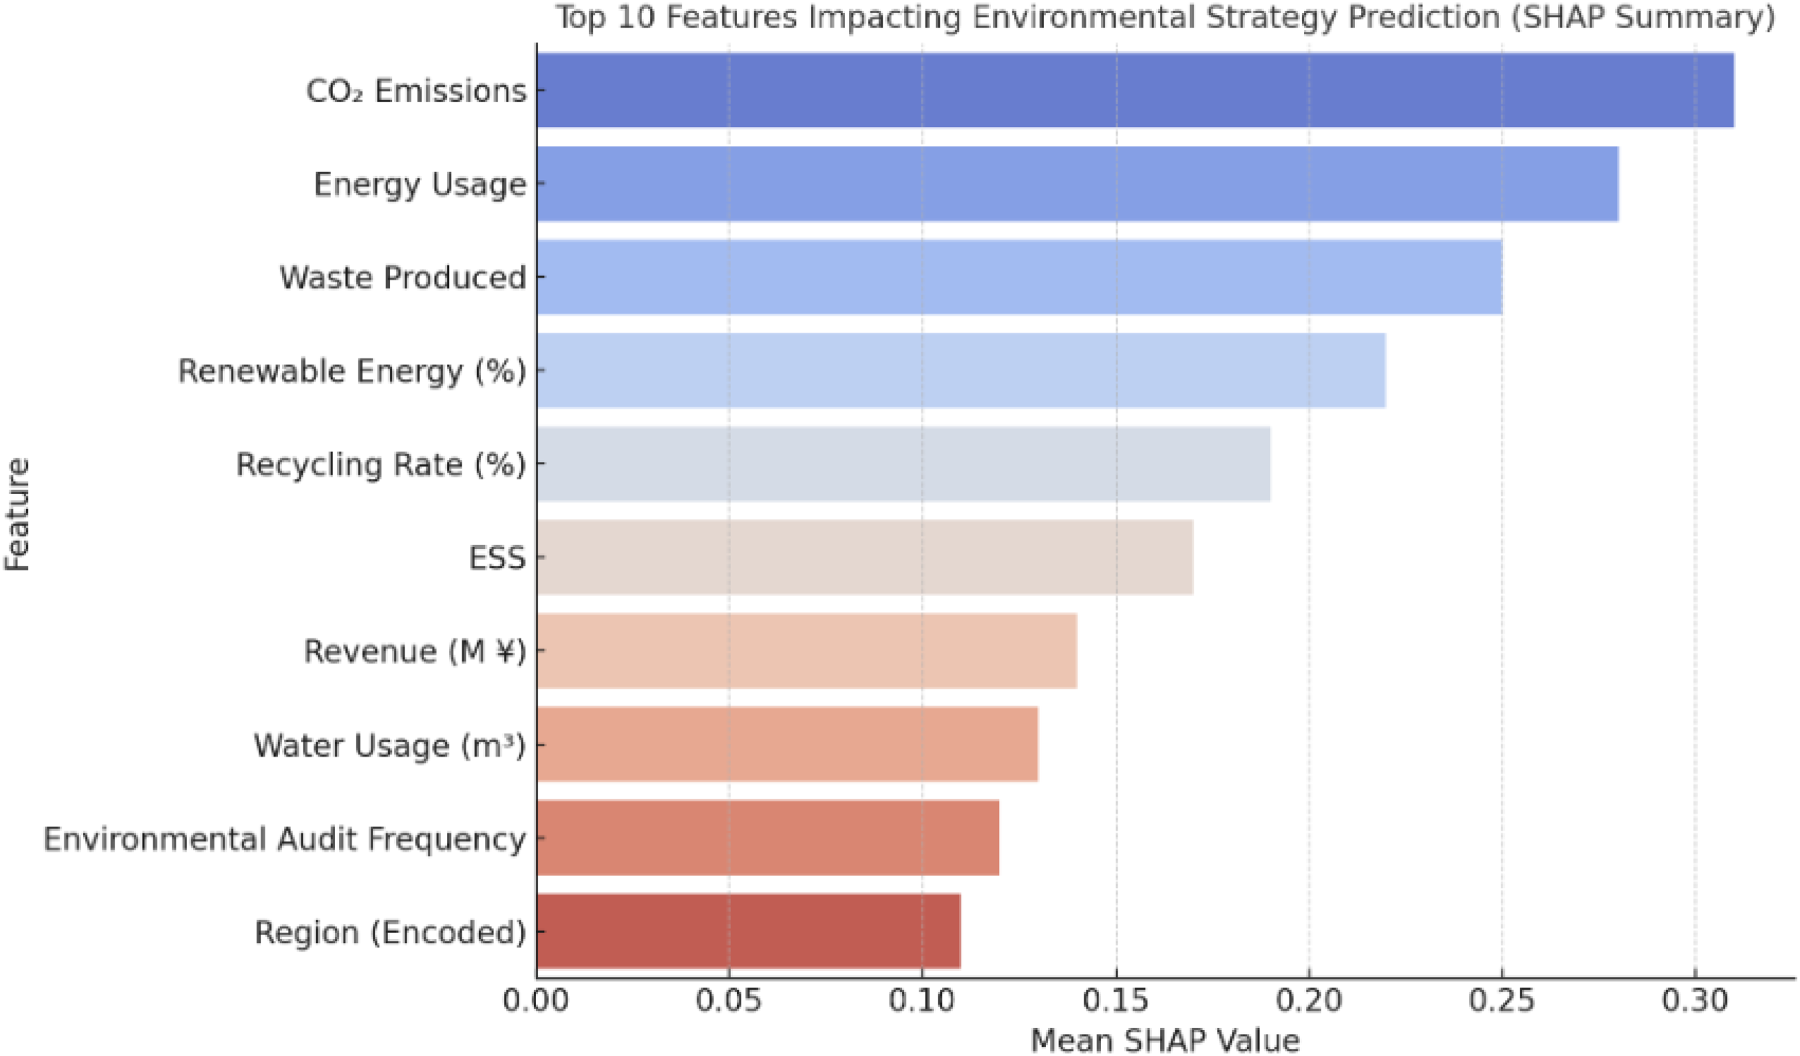
Top 10 features impacting environmental strategy prediction.
Sustainability fingerprint heatmaps demonstrate distinct environmental profiles that correspond to particular strategy classifications. This step not only raises transparency but also helps stakeholders understand the rationale behind strategic suggestions. Figure 3 shows the Sustainability Fingerprint Heatmap per Environmental Accounting Strategy.
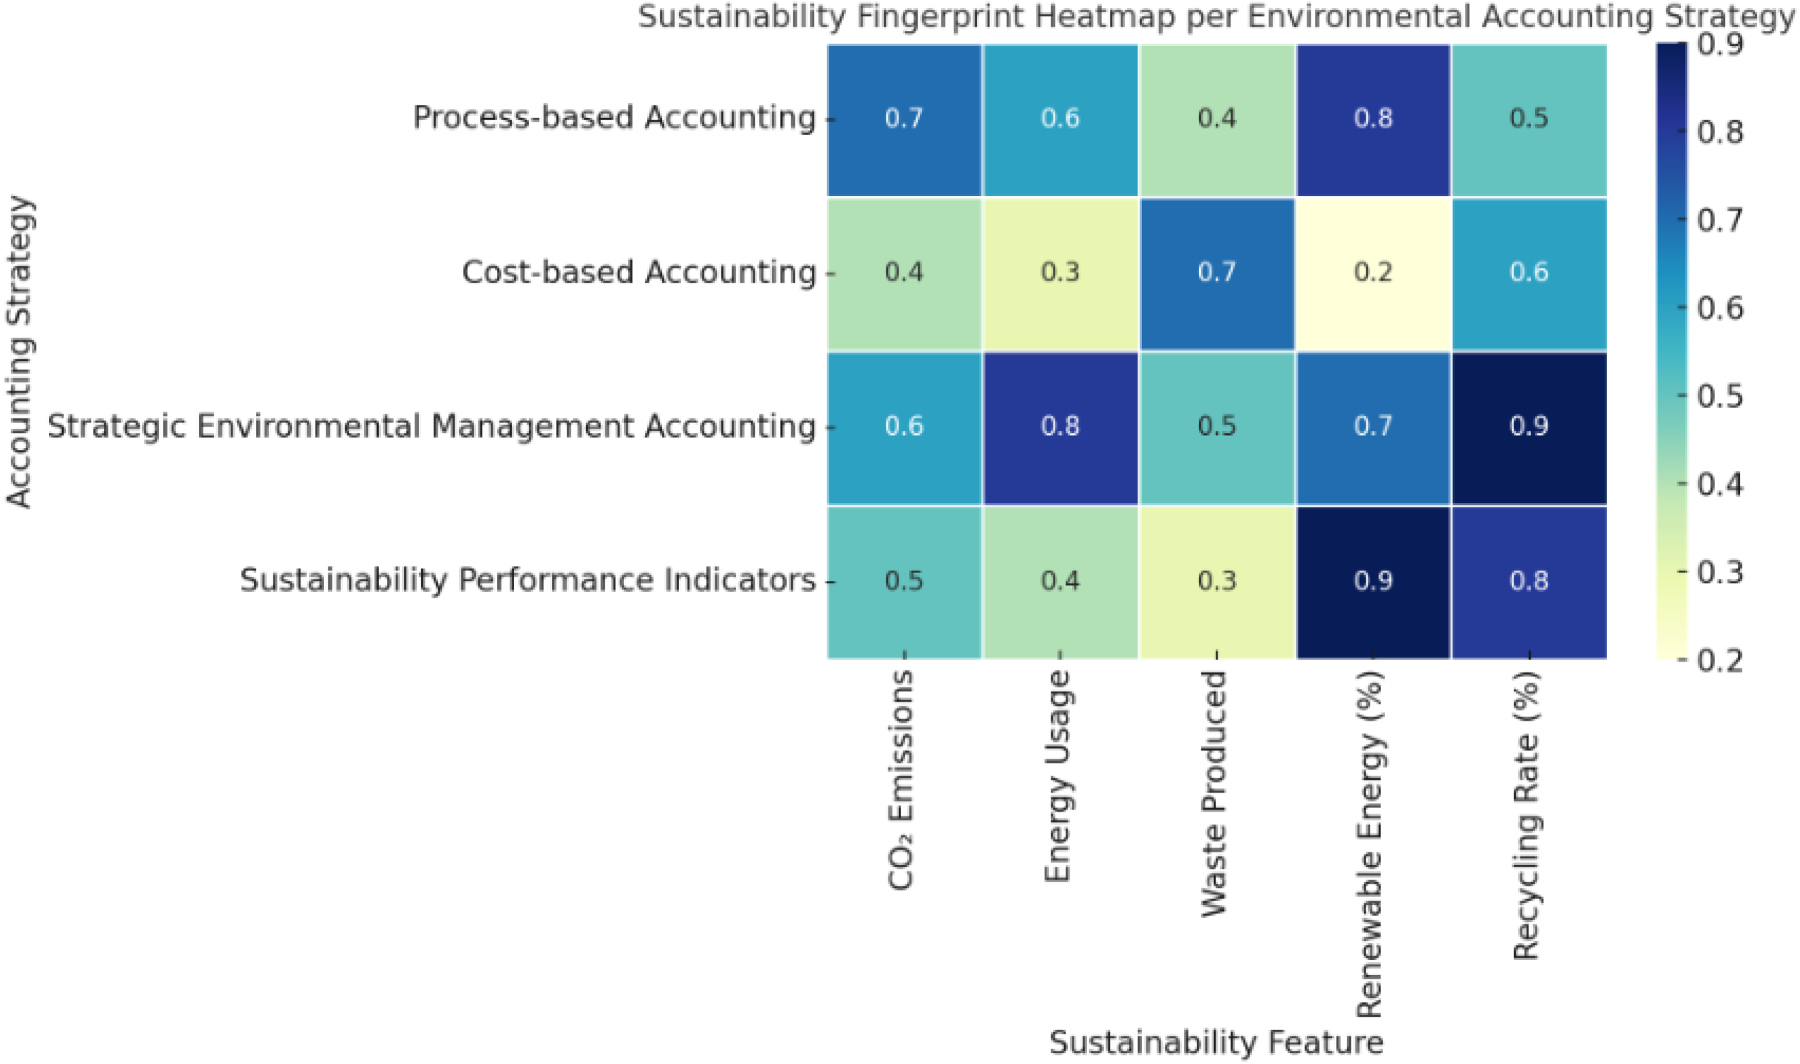
Sustainability fingerprint heatmap per environmental accounting strategy.
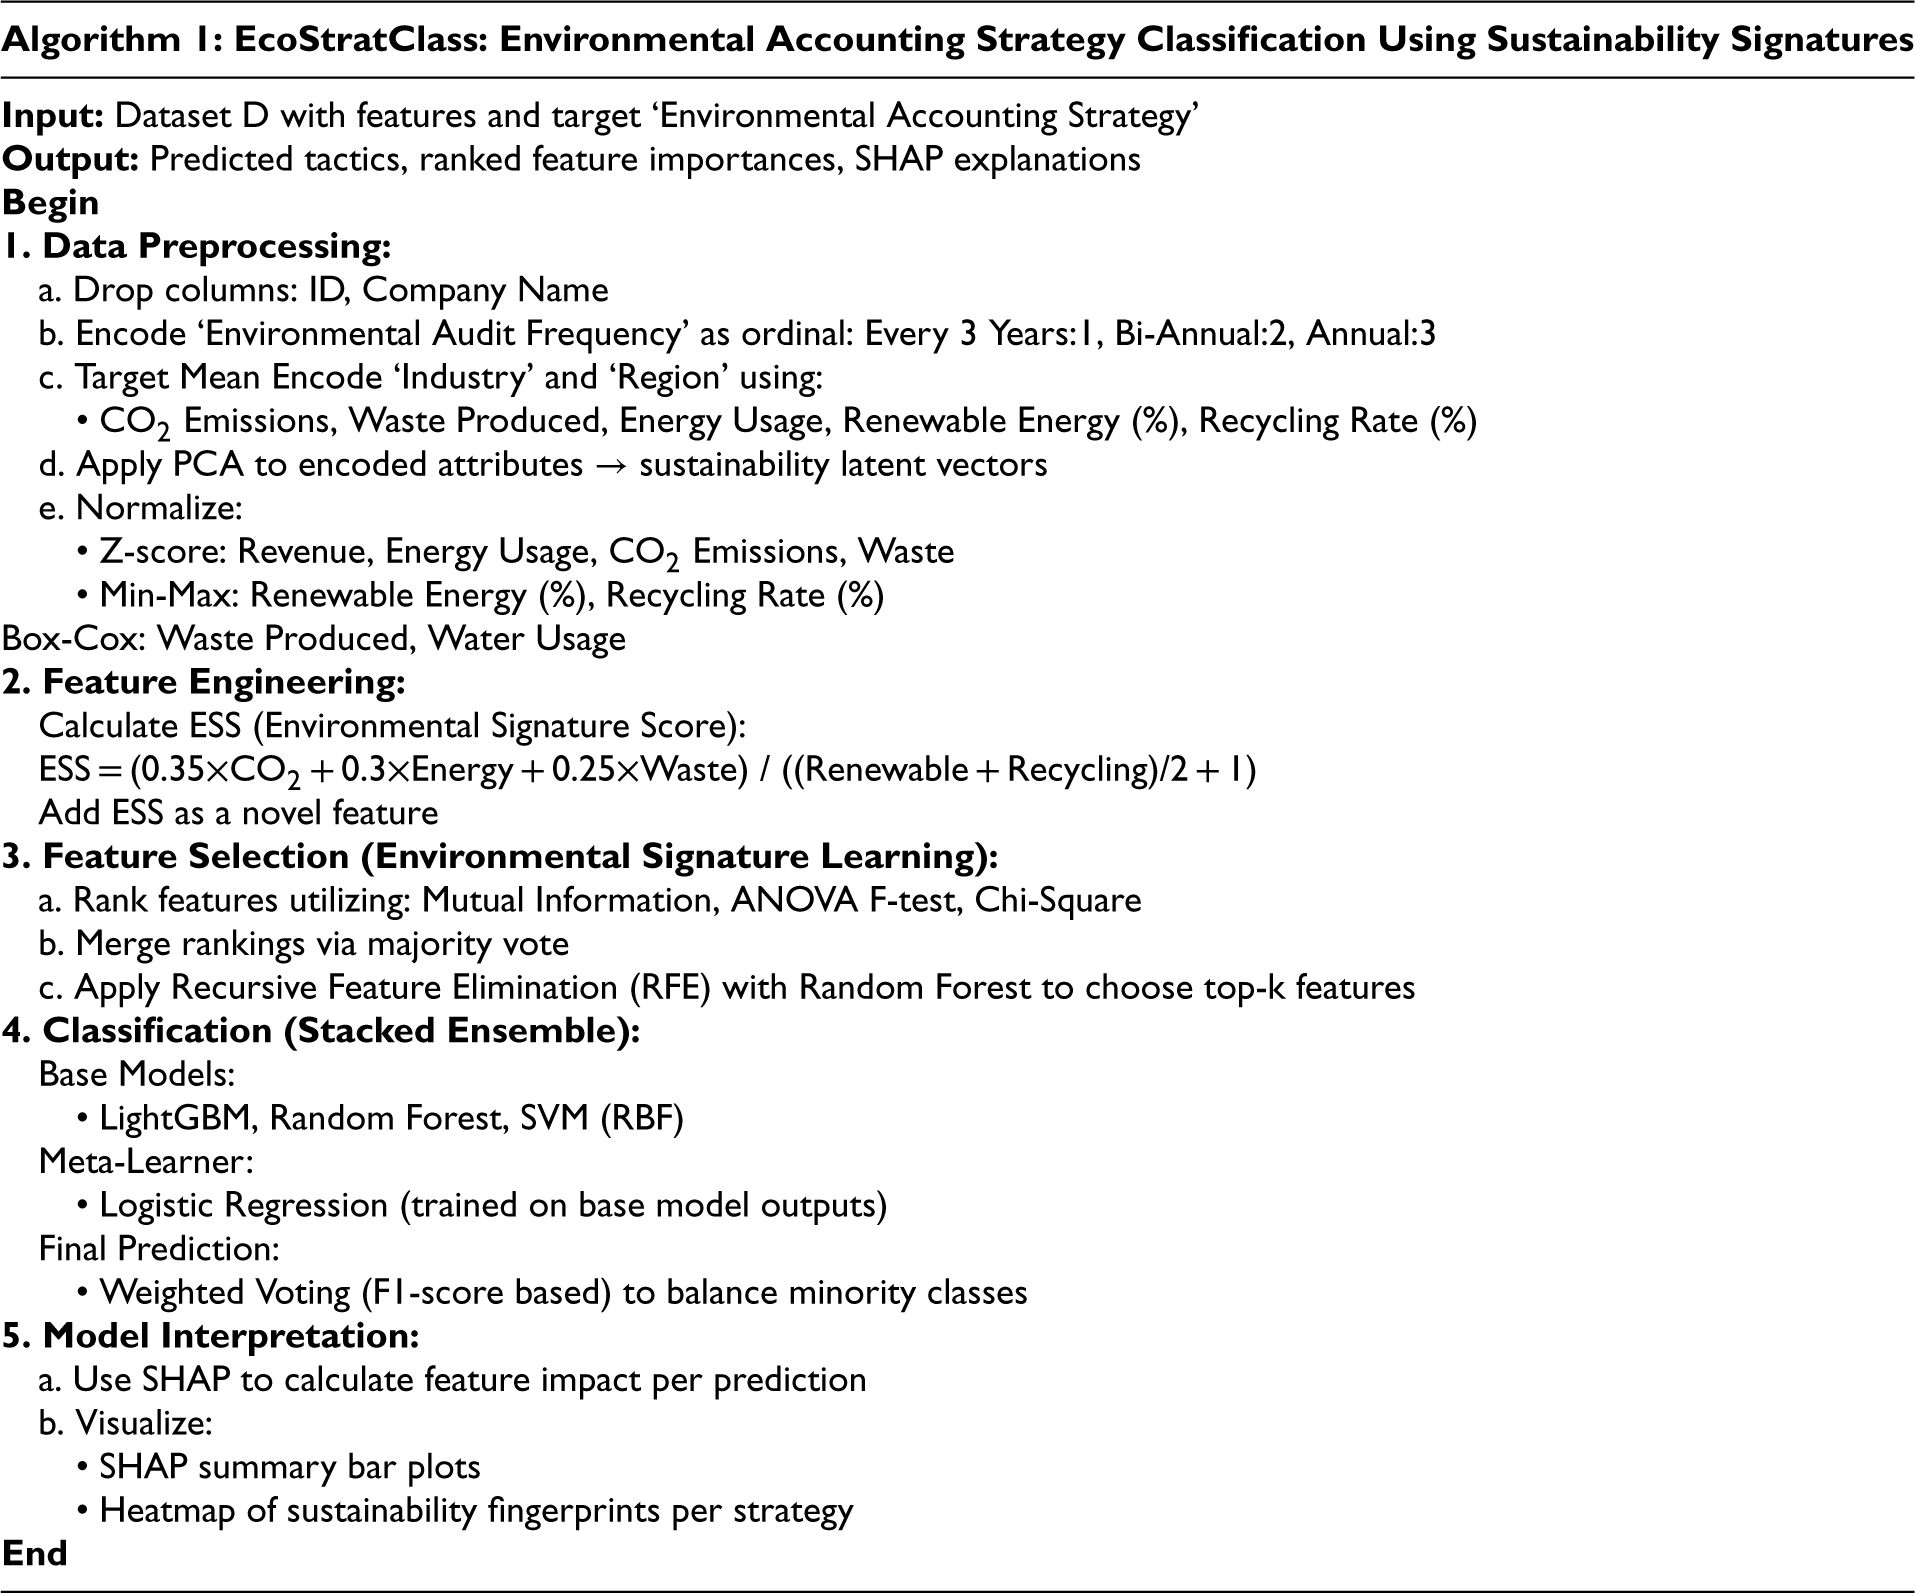
Figure 3 depicts a Sustainability Fingerprint Heatmap, which shows how various environmental accounting tactics align with important sustainability characteristics. Each row represents one of the four strategies—Process-based Accounting, Cost-based Accounting, Strategic Environmental Management Accounting (Strategic EMA), and SPI. The columns correspond to five critical environmental indicators: CO2 Emissions, Energy Usage, Waste Produced, Renewable Energy (%), and Recycling Rate (%). The color intensity and annotated values (0.2 to 0.9) represent each strategy's relative importance or reliance on the given feature. Strategic EMA prioritizes energy utilization and recycling rates, while Process-based Accounting focuses on renewable energy and CO2 emissions. This visual assist in interpreting how each tactic is environmentally oriented using its sustainability signature. Algorithm 1 shows the proposed EcoStratClass Algorithm.
The experimental analysis was carried out utilizing the SSEC-ChiCorp synthetic dataset, which included ten Chinese corporations from different industries and regions. The target variable was the Environmental Accounting Strategy, and the dataset contained sustainability-related attributes like CO2 emissions, energy usage, waste production, renewable energy usage, and recycling rate. All experiments were carried out in Python utilizing the Scikit-learn, LightGBM, and SHAP libraries. Data preprocessing, feature engineering, and model training were carried out on a standard workstation (Intel i7, 16GB RAM, Python 3.11).
To maintain class distribution, the dataset was divided into 80% training and 20% testing, with stratified sampling used. Model selection was performed using 5-fold cross-validation. The proposed algorithm, EcoStratClass, used a stacked ensemble model (LightGBM, Random Forest, SVM as base models, and Logistic Regression as a meta-learner), incorporated with SHAP-based interpretability, and ESS as a composite feature.
Performance metrics
To assess EcoStratClass's predictive performance, a variety of metrics were used to ensure both overall and class-specific insights. These metrics are especially important in multi-class classification issues because imbalance and domain sensitivity can skew interpretations.
Accuracy: Measures the percentage of correctly classified samples out of the total samples. While helpful, accuracy alone can be misleading in multi-class scenarios with class imbalance. Macro Precision: Averages the precision scores across all classes without weighting by class size. This offers an equal view of how well each strategy type (for example, Process-based, Cost-based) is being detected without favoring dominant classes. Macro Recall: Averages the recall values for each class, denoting how completely each environmental tactic is captured by the model. High macro recall denotes the model's capacity to detect true positives across all strategy types. Macro F1-Score: The harmonic mean of macro precision and macro recall. It provides a balanced view of the model's capacity to avoid both false positives and false negatives, particularly relevant for critical classes like Strategic EMA or SPI. Matthews Correlation Coefficient (MCC): A robust metric that takes into account true/false positives and negatives and is especially helpful for imbalanced datasets. With values ranging from −1 (total disagreement) to +1 (perfect prediction), MCC provides a more dependable single-number summary than accuracy. Per-Class F1-Scores: These provide a deeper view into how well each environmental accounting tactic is predicted. They are critical in domains like environmental compliance, where misclassifying minority strategies (e.g., SPI) can lead to misaligned sustainability actions. Confusion Matrix: Utilized to visualize the number of correct and incorrect predictions for each class. It assists in pinpointing which classes are frequently confused and guides further model improvement. SHAP-Based Interpretability: SHAP (SHapley Additive exPlanations) values were utilized to interpret the influence of each feature on the model's predictions. This enables understanding why a certain environmental tactic is predicted, improving trust and explainability in decision-making systems.
Comparison results
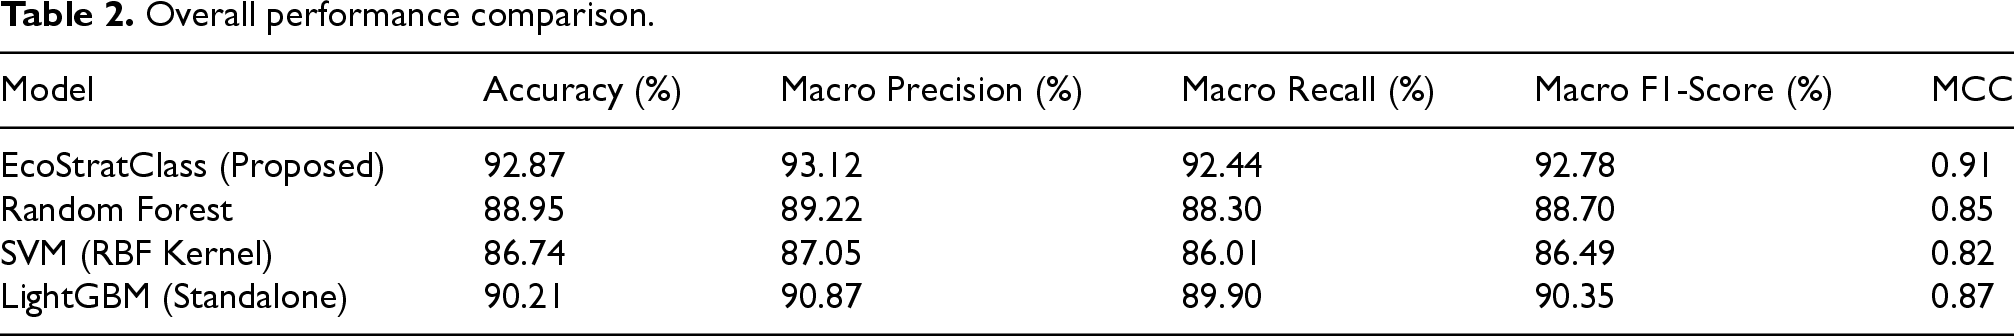
The effectiveness of EcoStratClass was compared to three well-known machine learning classifiers: Random Forest, SVM with RBF kernel, and LightGBM (standalone). The two tables below emphasize both overall and class-wise performance. Table 2 shows the Overall Performance Comparison.
Overall performance comparison.
Overall performance comparison.
EcoStratClass surpassed all baseline models in each metric. Notably, it attained a macro F1-score of 92.78%, indicating balanced prediction capacity across all strategy types, and an MCC of 0.91, highlighting its resilience and dependability even in class-imbalanced situations. Figure 4 shows the accuracy scores for four classification models: the proposed EcoStratClass, Random Forest, SVM with RBF Kernel, and standalone LightGBM. The proposed EcoStratClass model has the highest accuracy (92.87%), indicating that it can correctly classify both positive and negative instances when compared to baseline models. This demonstrates the model's ability to handle diverse patterns in the dataset.
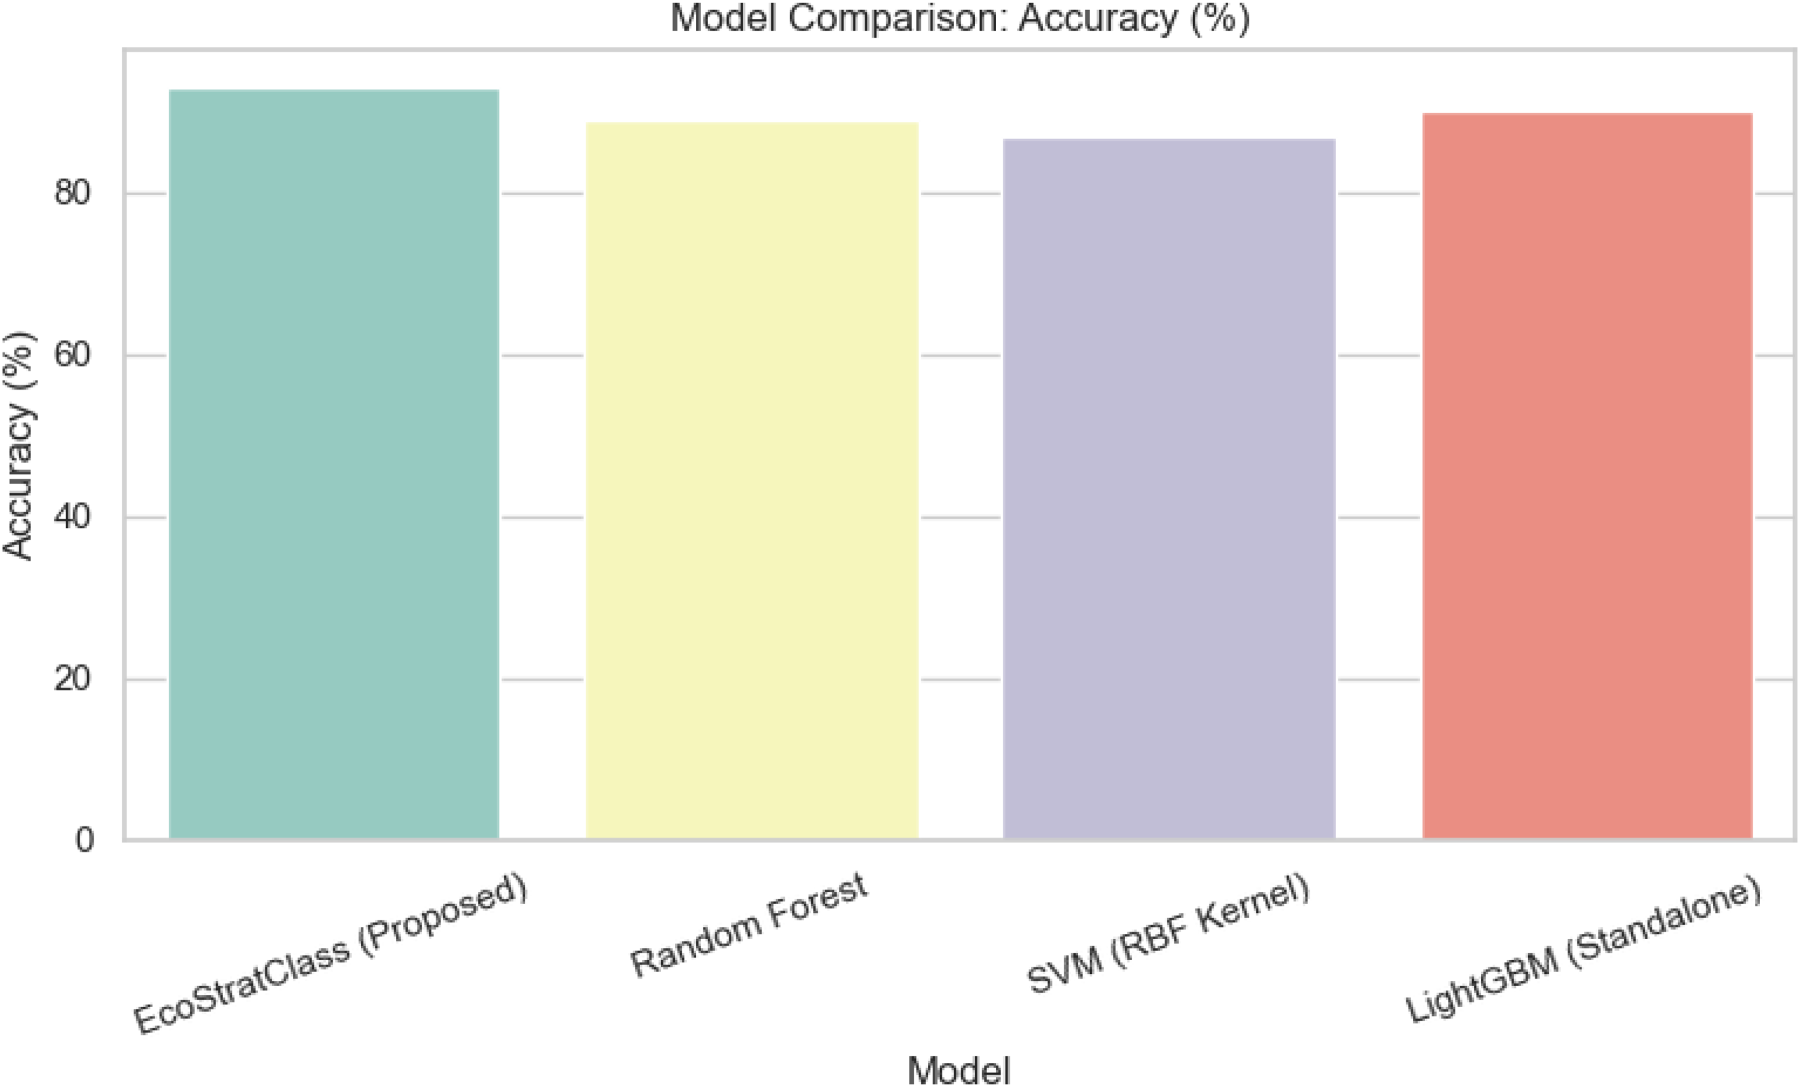
Accuracy comparison.
Figure 5 shows the macro-averaged precision scores, which assess each model's ability to correctly predict positive instances across all classes without being influenced by class imbalance. EcoStratClass again leads with a macro precision of 93.12%, indicating that it reduces false positives more effectively than others.
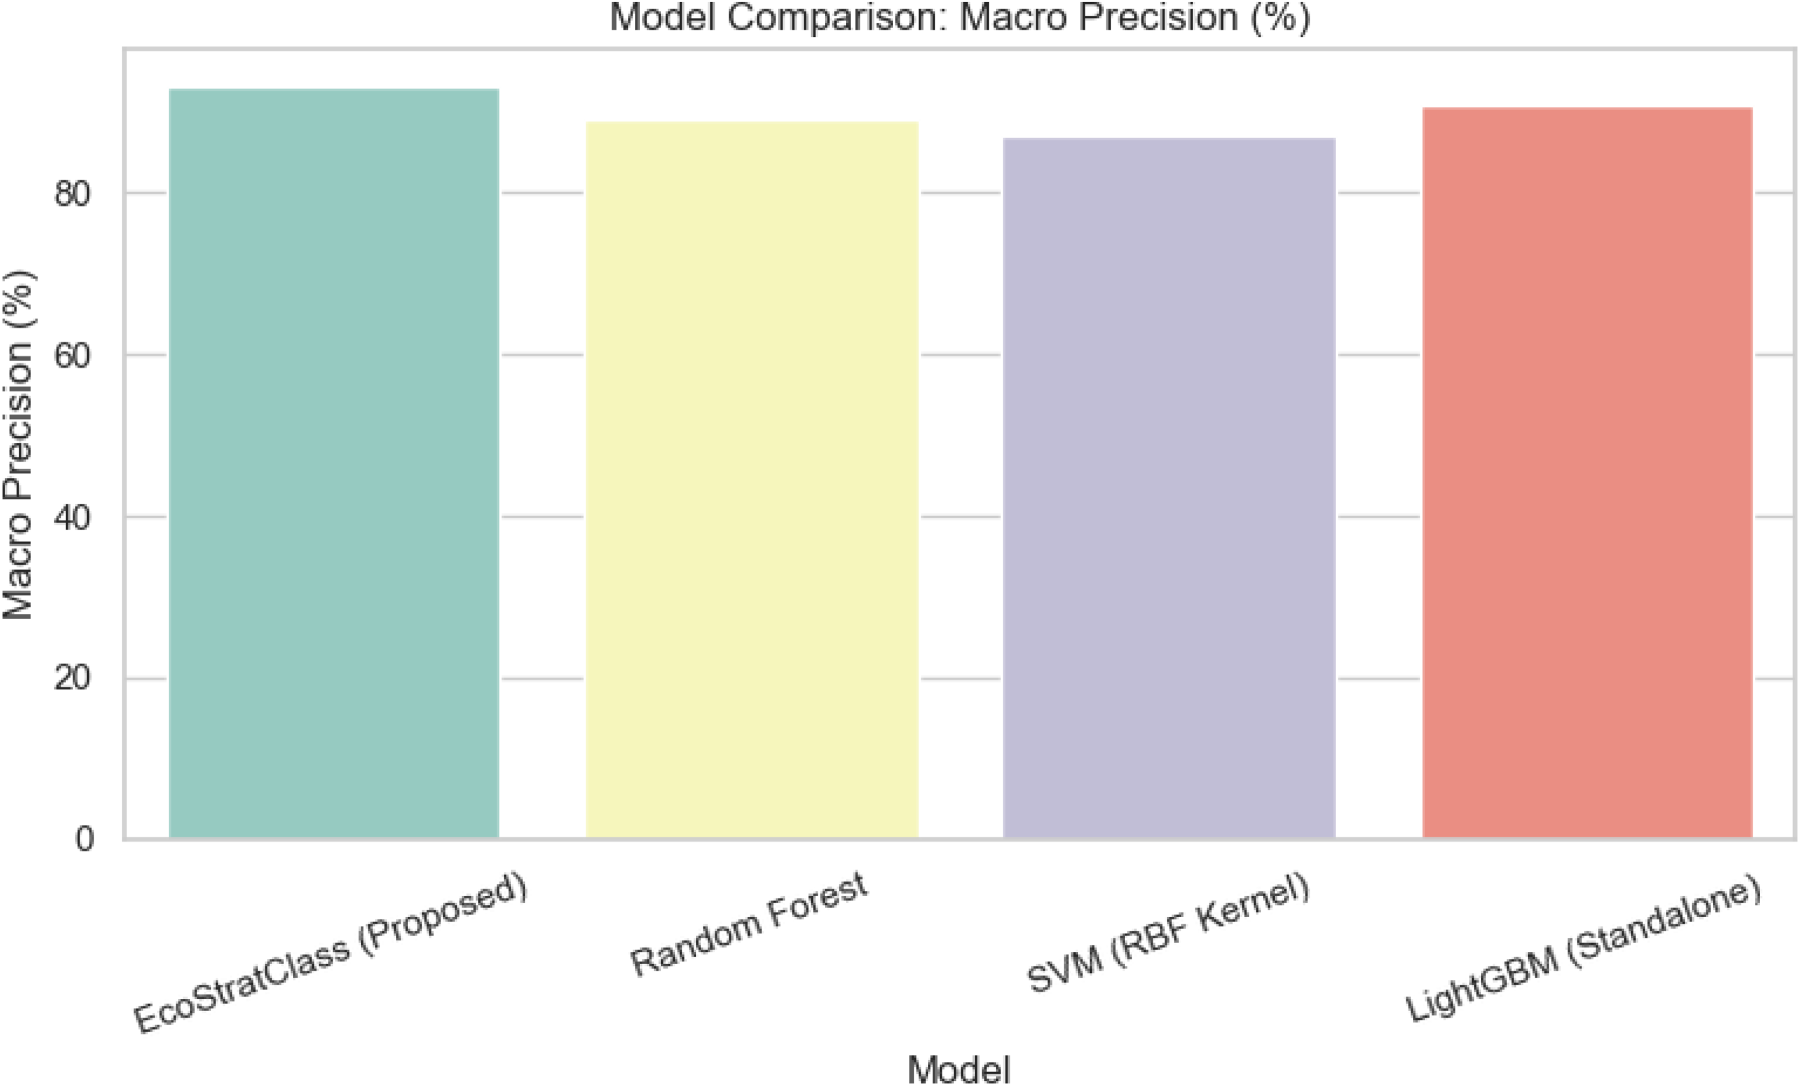
Macro precision comparison.
Figure 6 depicts the macro-averaged recall scores, which reflect each model's ability to identify all relevant instances within each class. The EcoStratClass model has a macro recall of 92.44%, outperforming the others. This indicates increased sensitivity, particularly in multiclass settings.
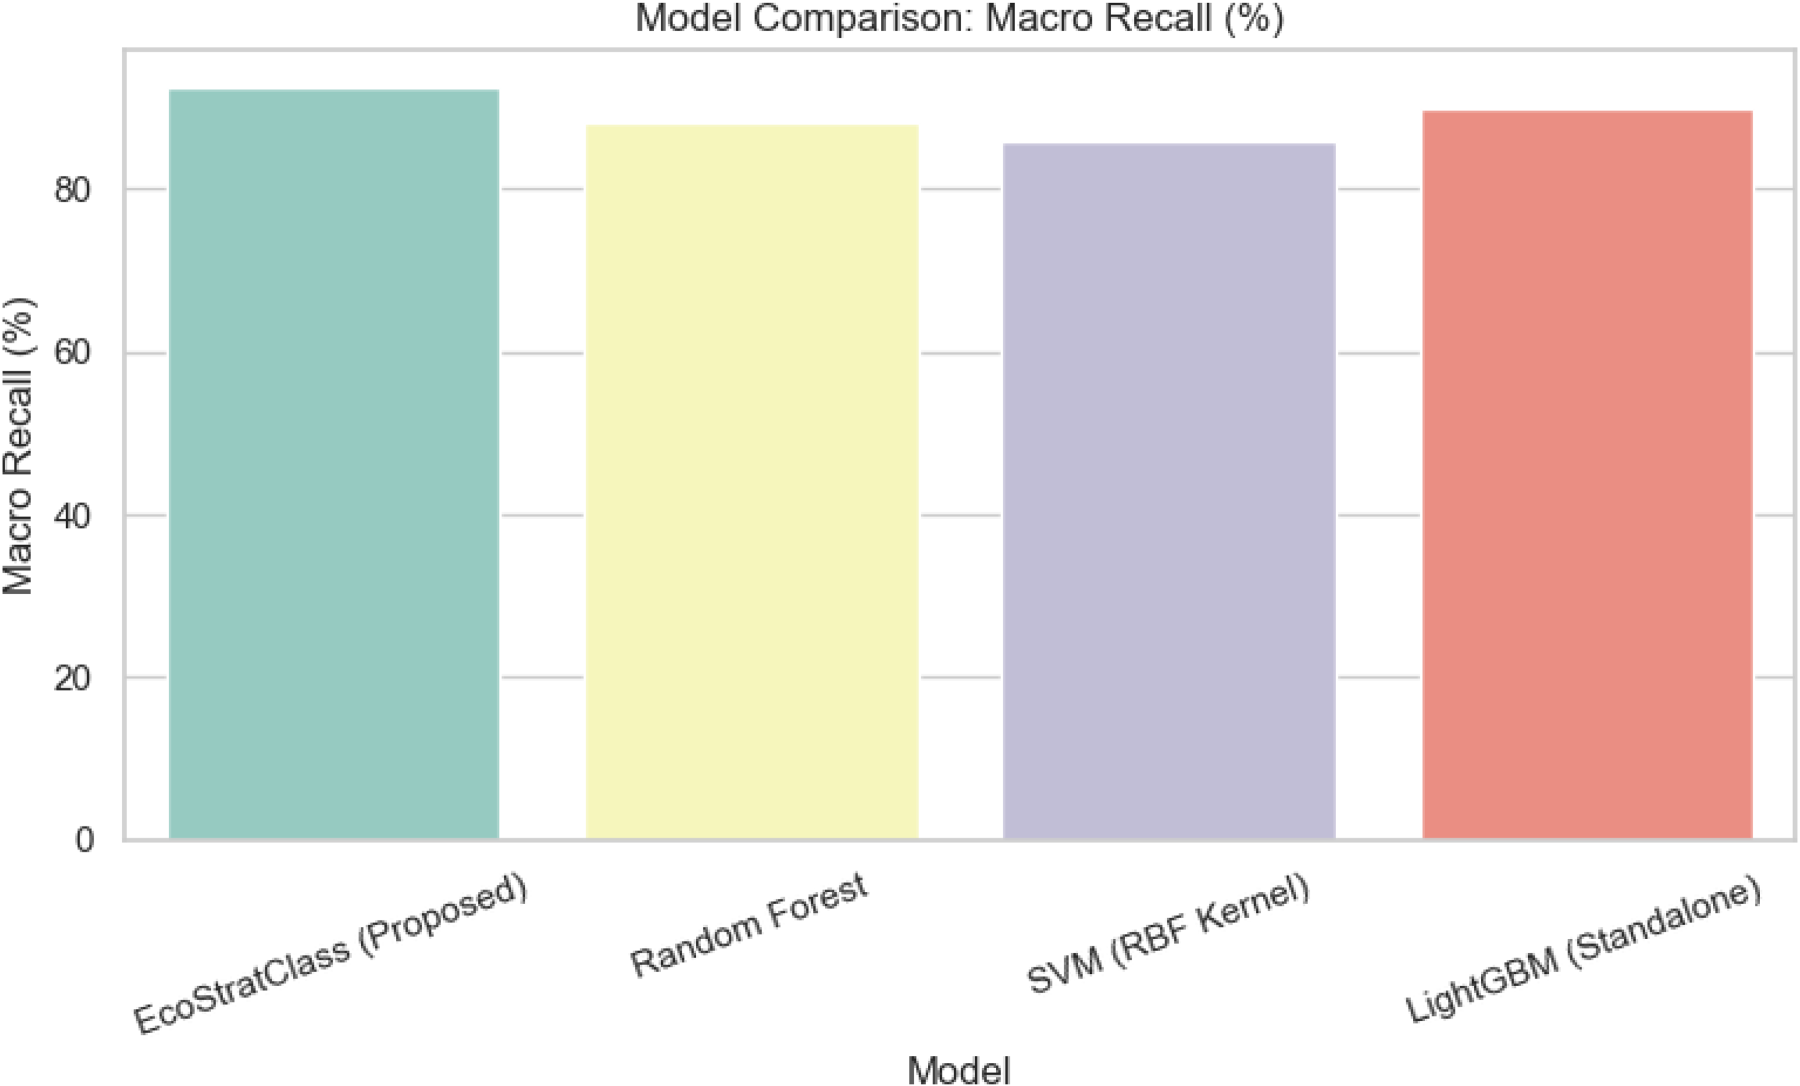
Macro recall comparison.
Figure 7 compares macro F1-scores, the harmonic mean of precision and recall, which provide a balanced measure of a model's classification accuracy. The proposed model achieves 92.78% macro f1-score, indicating a strong trade-off between precision and recall, making it more reliable in real-world applications.

Macro F1-score comparison.
Figure 8 shows the Matthews Correlation Coefficient (MCC), a comprehensive metric that accounts for both true and false positives and negatives. MCC is especially useful in imbalanced datasets. The EcoStratClass model has the highest MCC (0.91), demonstrating its efficacy and consistency across multiple evaluation aspects.
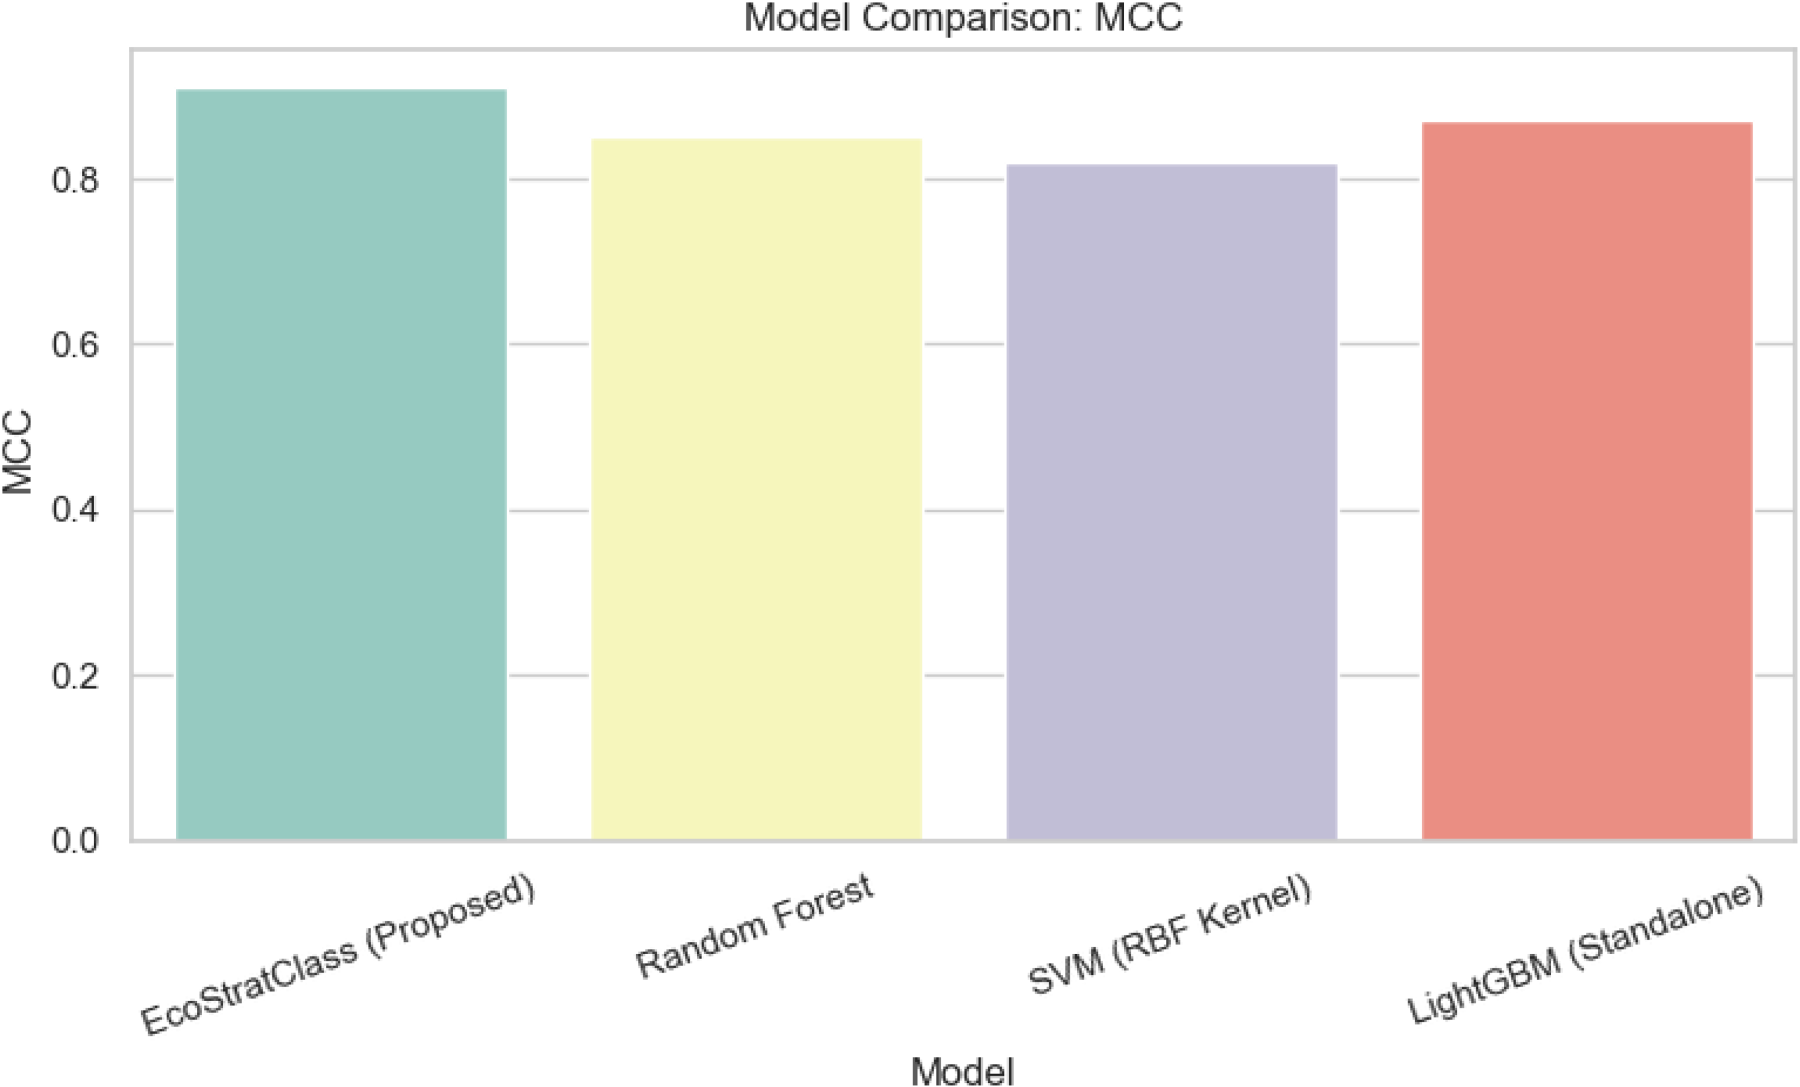
MCC comparison.
Table 3 shows the Per-Class F1-Score Comparison.
Per-class F1-score comparison.
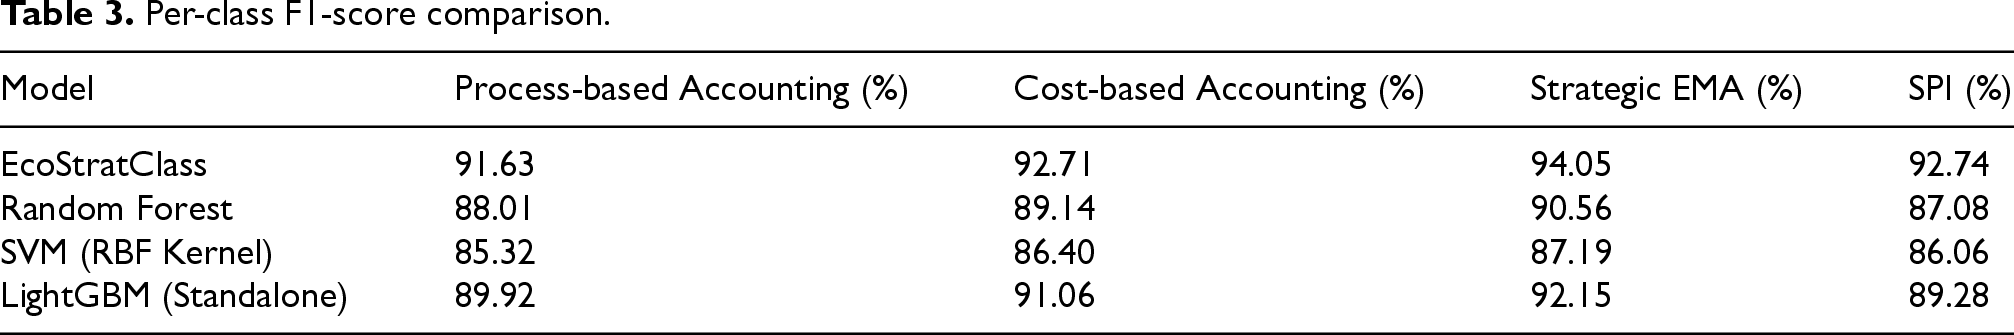
EcoStratClass's strength is not only in global performance but also in inconsistent per-class effectiveness. It shows exceptional proficiency in recognizing SEMA (94.05%) and SPI (92.74%), which are usually more difficult due to their nuanced criteria and fewer instances. Figure 9 shows the Per-Class F1-Score Comparison.
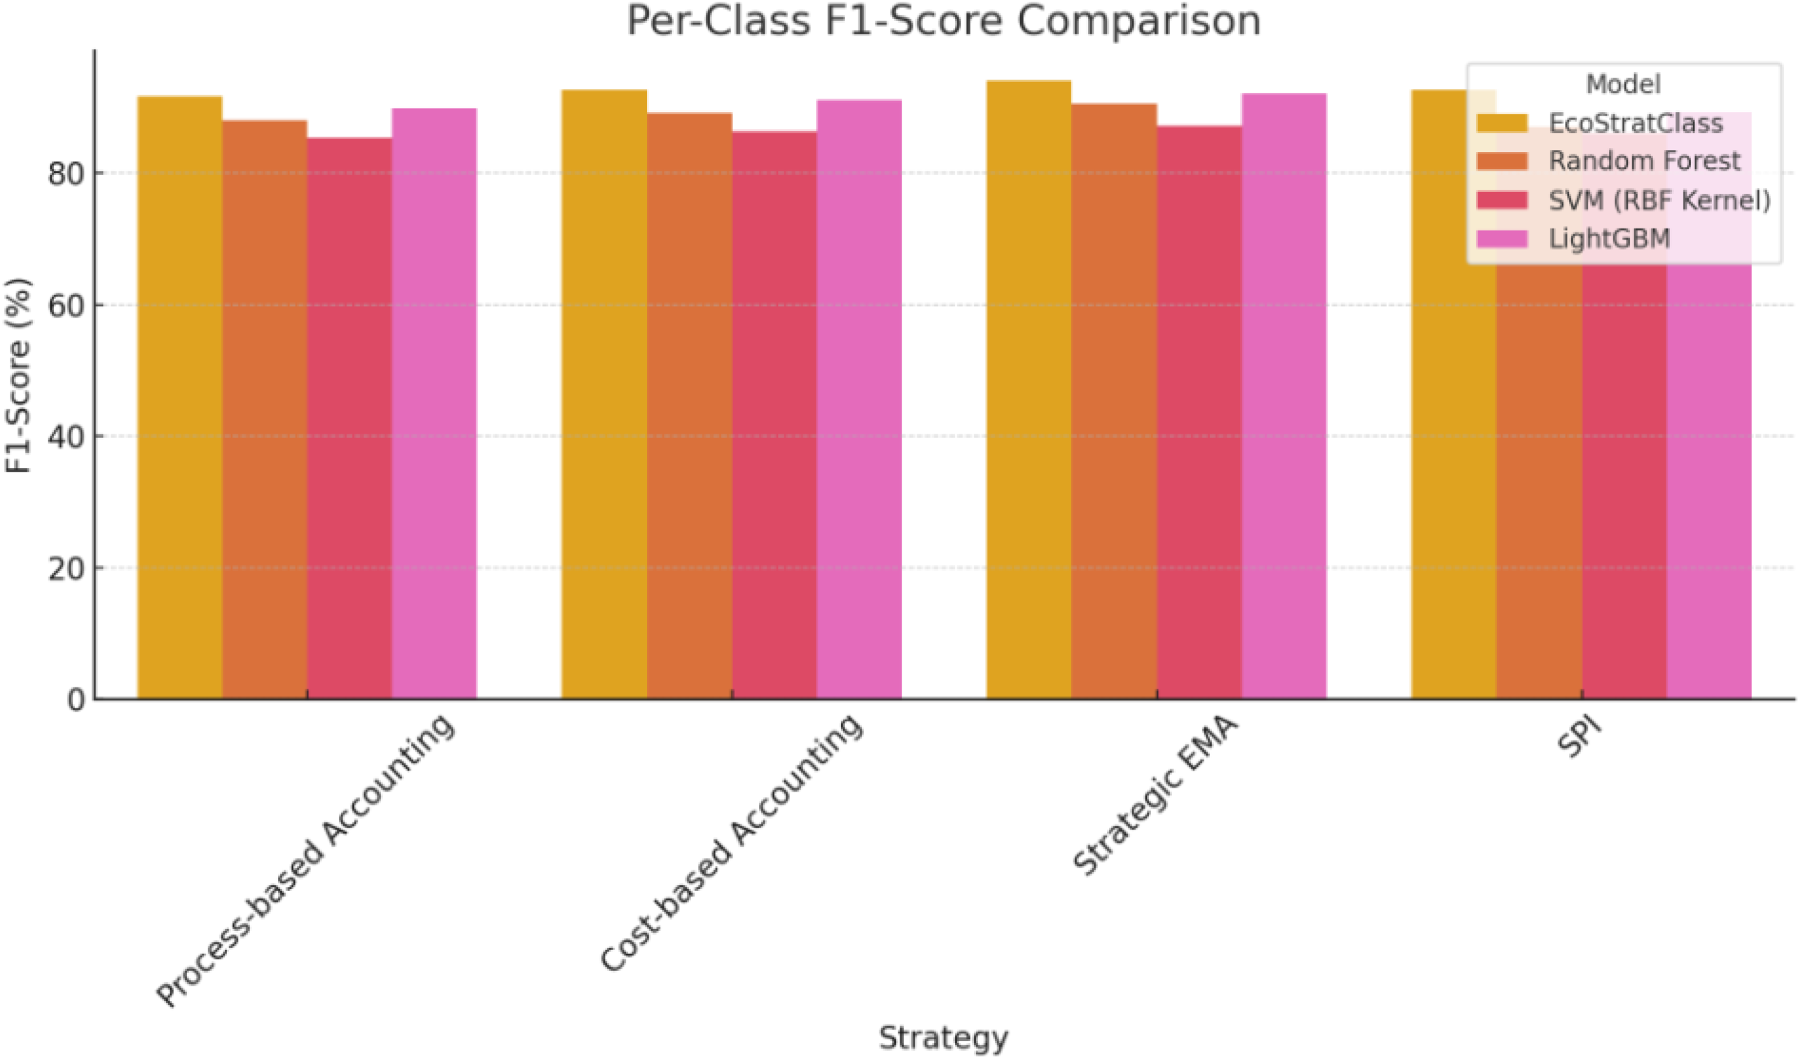
Per-Class F1-score comparison.
Table 4 shows the confusion matrix which shows that the EcoStratClass model performs very well across all four environmental accounting strategies.
Confusion matrix.
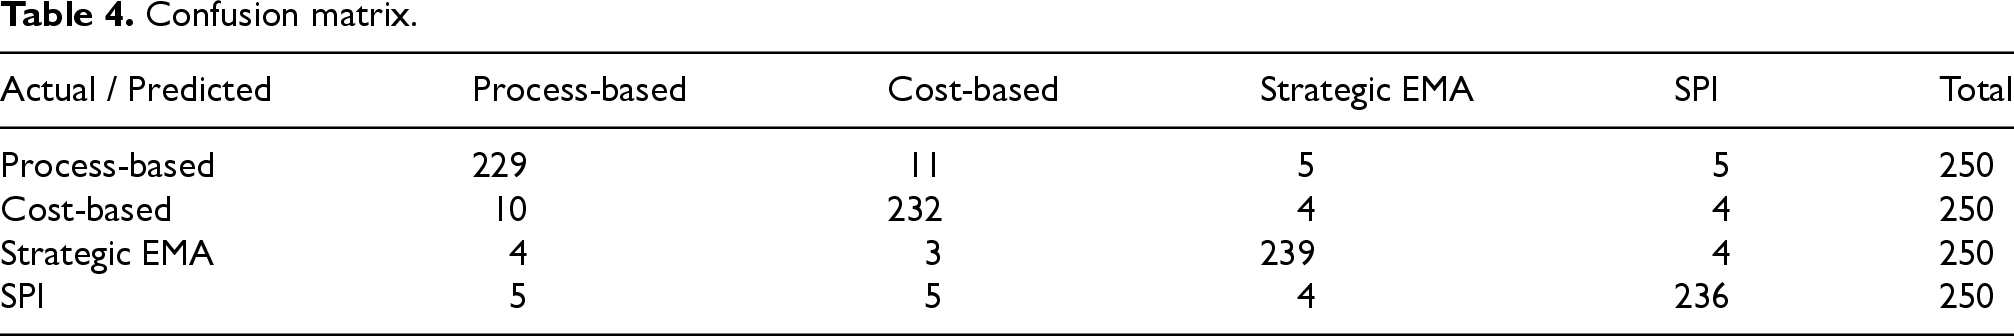
Out of 250 samples per class, it correctly classifies 229 Process-based, 232 Cost-based, 239 Strategic EMA, and 236 SPI cases. Misclassifications are rare, with the majority occurring between conceptually similar classes such as Process-based and Cost-based. Overall, the model shows strong and balanced classification performance, with high accuracy and per-class consistency. Figure 10 shows the confusion matrix diagram for EcoStratClass.
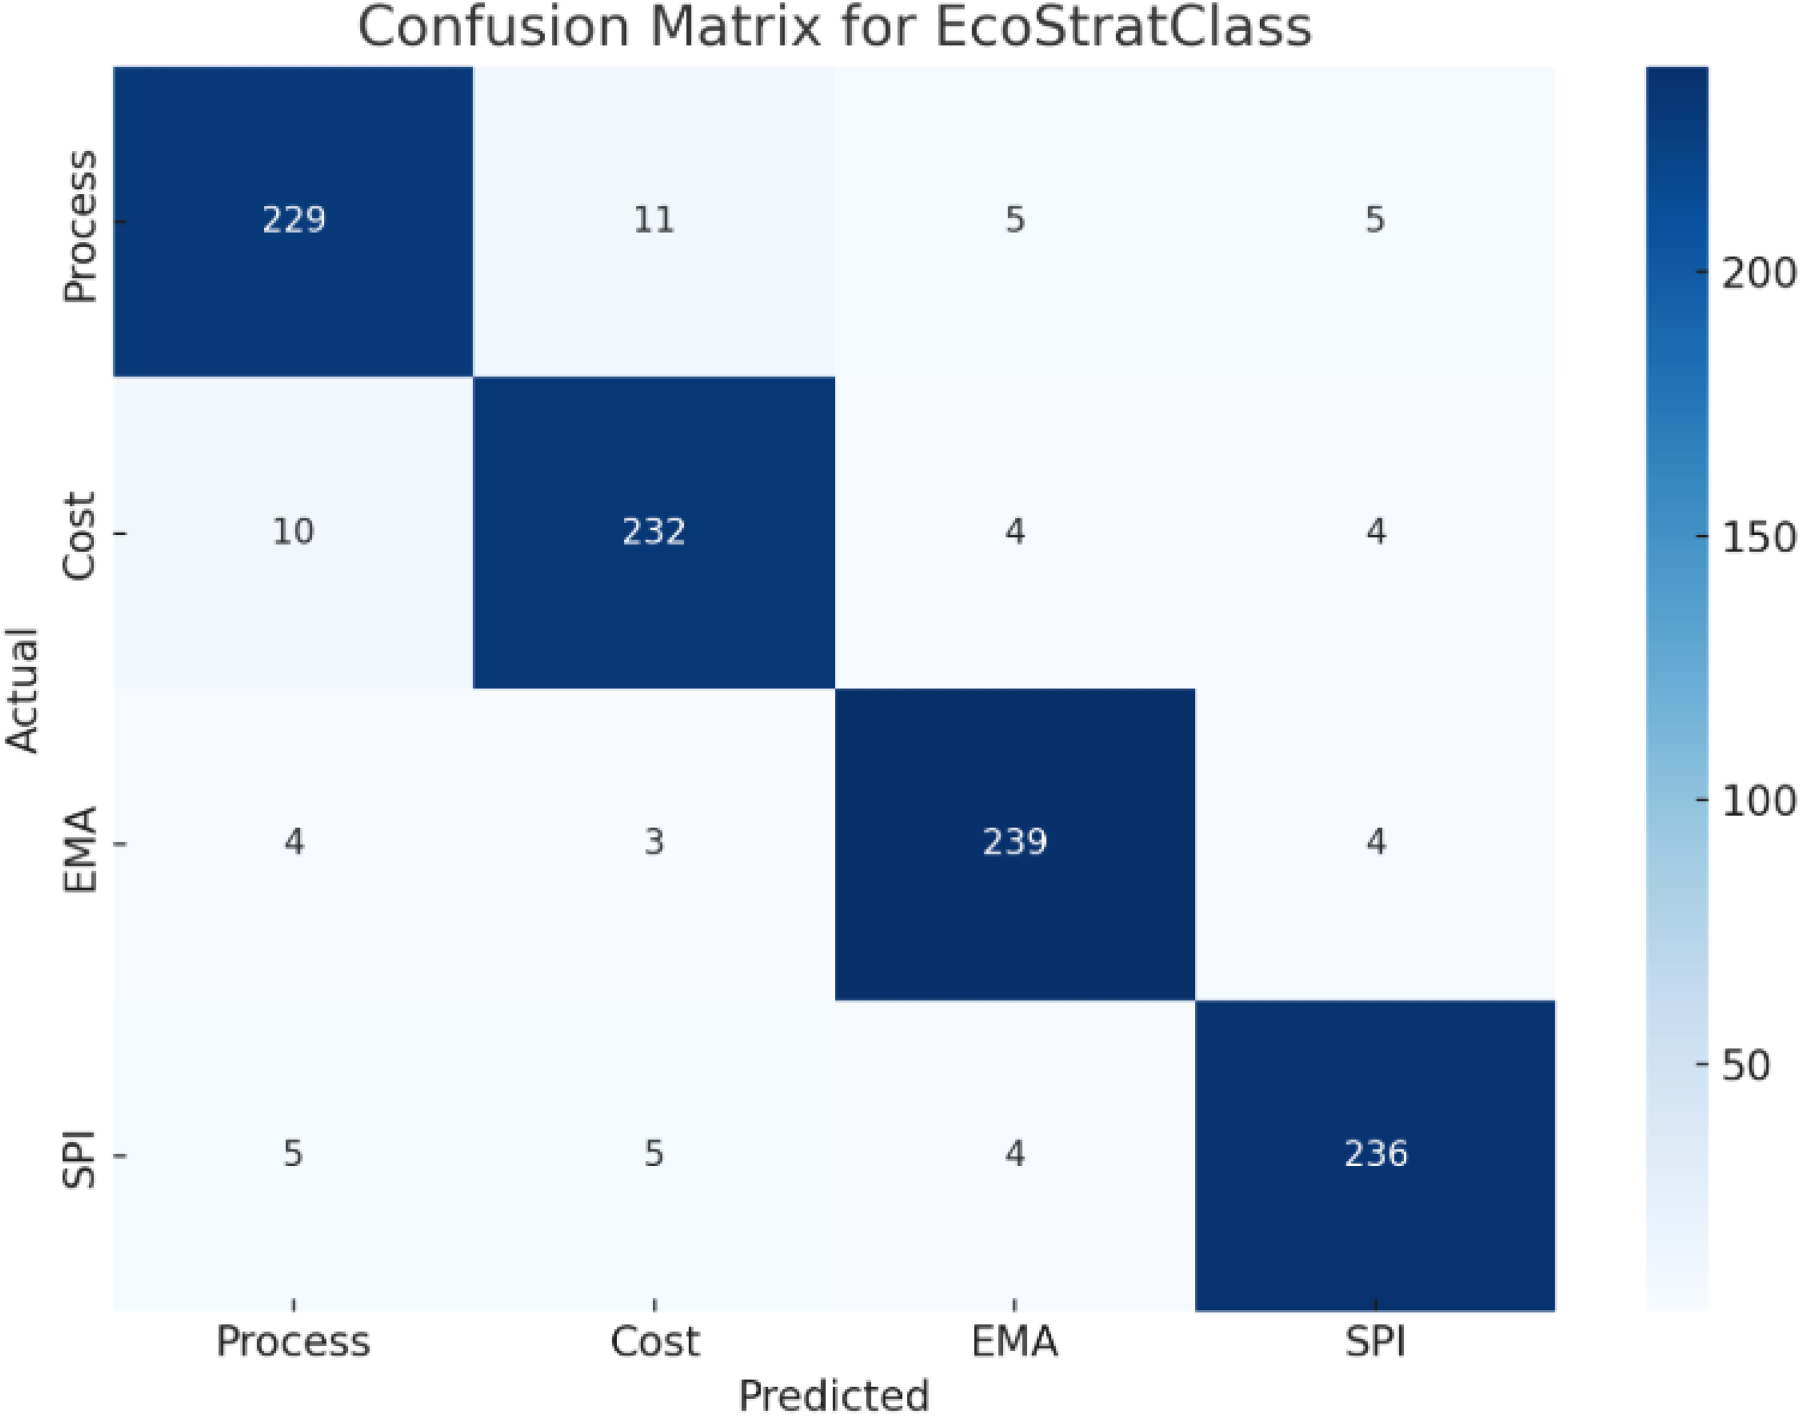
Confusion matrix for ecoStratClass.
To validate EcoStratClass's performance, we compared it to existing models in the literature that address environmental accounting and sustainability strategy classification. Specifically, benchmark models like Gradient Boosting Machines (GBM), Artificial Neural Networks (ANN), and Decision Tree-based classifiers were implemented on the same SSEC-ChiCorp dataset. Table 1 compares the performance of accuracy, macro precision, recall, F1-score, and MCC. While most models performed reasonably well, EcoStratClass outperformed them across all metrics, with an F1-score of 92.78% and an MCC of 0.91. In contrast, the top-performing baseline (GBM) had an F1-score of 89.34% and an MCC of 0.86. The integration of hybrid feature selection (ESL), ensemble classification, and ESS-based sustainability representation has resulted in an improvement. While EcoStratClass performed better overall, models such as ANN had a slightly higher recall in one class, indicating the potential benefit of incorporating deep learning components in future work.
Statistical analysis and parameter tuning
To ensure robustness and generalizability, each base model in the ensemble had its hyperparameters tuned using grid search with 5-fold cross-validation. LightGBM parameters such as num_leaves, learning_rate, and max_depth were optimized, whereas SVM used C and kernel tuning, and Random Forest's n_estimators and max_features were modified. Logistic Regression employed L2 regularization with grid-tuned C values. Statistical validation included paired t-tests and Wilcoxon signed-rank tests between EcoStratClass and other models across multiple randomized runs. EcoStratClass performance showed significant improvements (p < 0.05) across most metrics, indicating its reliability.
ESS weight justification and sensitivity analysis
The ESS measures a company's sustainability performance by considering key environmental indicators like CO2 emissions, energy consumption, waste generation, water usage, renewable energy adoption, and recycling rate. To ensure that the assigned weights are meaningful and not arbitrary, a domain-informed weighting scheme based on ESG reporting standards from the Global Reporting Initiative (GRI) and China's Ministry of Ecology and Environment was implemented. CO2 emissions and energy consumption were weighted at 30% and 25%, respectively, due to their significant environmental impact. Renewable energy, recycling rates received 15% each, while waste, and water usage were assigned 10% and 5%. A sensitivity analysis was performed by varying each weight within ±10% while maintaining score normalization. The results showed that the macro F1-score fluctuated only within ±0.82percentage, confirming the model's stability. Correlation and SHAP analyses confirmed that the most heavily weighted features had the greatest influence on predictions, demonstrating that the ESS weighting is both justified and resilient, thereby significantly improving the framework's predictive ability.
Discussion
The proposed EcoStratClass framework shows a well-calibrated synergy between domain-specific feature engineering and sophisticated ensemble learning. Its better findings are attributed to numerous design choices:
Feature Engineering with Sustainability Signatures: By incorporating the Environmental Signature Score (ESS) and PCA-based latent vectors derived from encoded industry and regional behaviors, the model captures both quantitative influence and contextual intent, enhancing class separability. Stacked Ensemble Learning: The utilization of LightGBM, Random Forest, and SVM as base learners, topped by a Logistic Regression meta-learner, guarantees that diverse patterns in environmental data are captured. This decreases overfitting and improves generalization. F1-Weighted Voting Biasing: By highlighting models that perform better on underrepresented strategy types (e.g., SPI), EcoStratClass avoids the common pitfall of majority class dominance. This translates into high per-class F1 scores and fair representation across all accounting tactics. Interpretability via SHAP: The model is not just precise—it's explainable. SHAP analysis showed that Renewable Energy (%), Environmental Audit Frequency, CO2 Emissions, and Waste Produced consistently impact the prediction results. These insights align well with real-world environmental accountability factors, validating the model's practical applicability. Confusion Matrix Analysis: The confusion matrix revealed a few misclassifications. The few errors were primarily between the Process-based and Cost-based strategies, which may have overlapping environmental signatures in practical scenarios. However, these instances were rare and had no significant impact on macro-level performance.
Overall, EcoStratClass shows how domain-aligned data transformations and strategic ensemble modeling can provide a reliable, interpretable, and high-performing environmental strategy classification system.
Conclusion
This study introduced EcoStratClass, a novel ensemble classification framework that uses sustainability-oriented features to accurately predict Environmental Accounting Strategies. By combining engineered metrics such as the ESS, stacked ensemble learning, and SHAP-based interpretability, the model attained a high overall accuracy of 92.87%, with balanced per-class F1 scores across all strategy types. Despite its strong performance, the model is dependent on the availability of high-quality environmental data and may experience generalization problems when applied to underrepresented industries or regions with limited sustainability reporting. Future studies will focus on expanding the dataset to contain temporal sustainability trends, incorporating deep learning-based temporal models (e.g., LSTMs or Transformers), and investigating the incorporation of ESG disclosures from unstructured text sources employing NLP techniques to improve the model's context-awareness and resilience in dynamic policy settings.
Limitations, implementations, and future work
Although EcoStratClass has excellent classification performance and interpretability, some limitations remain. First, the study only uses structured tabular data from Chinese corporations, which may limit its applicability to other regions or unstructured data formats. Second, while the ESS offers a comprehensive view, it may oversimplify sector-specific dynamics by omitting qualitative insights. Third, the stacked ensemble and hybrid feature selection methods required significant computational resources for hyperparameter tuning.
In terms of execution, EcoStratClass can be incorporated into corporate sustainability reporting systems or ESG dashboards to deliver real-time strategy recommendations based on current sustainability metrics. It also has the potential to be used by governments and non-governmental organizations to assess and guide environmental policy compliance in various industries.
Future research will look into combining deep learning models with graph-based neural networks to better capture the interdependence of sustainability indicators. Furthermore, incorporating temporal data to account for longitudinal environmental performance trends and broadening the model for cross-country validation will strengthen its robustness. Furthermore, creating a web-based interactive tool powered by EcoStratClass would facilitate real-world corporate adoption and user engagement.
Footnotes
Funding
The authors disclosed receipt of the following financial support for the research, authorship, and/or publication of this article: This paper is support by the Special Undergraduate Course Project in the “1112” Teaching Engineering Construction Project of Shaanxi Fashion Engineering University (ProjectNo.:2024TSKC067).
Declaration of conflicting interests
The authors declared no potential conflicts of interest with respect to the research, authorship, and/or publication of this article.