
Abstract
Most modern banks have incorporated IoT into their operations to offer customers better services, while the IoT nature of banking systems poses several security threats. There is nothing more irreplaceable than the banking sector, which deals with sensitive financial information; hence, the need for more protective measures against cybercriminals. In response, this research work puts forward a new Multi-instance Coupled Modular Neural Network with Newton-Raphson Optimizer (M-CMNNet-NRO) to achieve efficient attack detection within an IoT-based banking system. The model begins with text processing of raw data gathered from various IoT devices, utilizing Zero-shot Text Normalization (Z-STN), which aims to normalize and standardize textual data without requiring any prior sample data. Then, the Geometric Algebra Transformer (GAT) further delves into the data to incorporate additional features while navigating complex structures and patterns. The M-CMNNet effectively analyzes multiple instances of data simultaneously and can therefore identify new and complex attack patterns as well. To enhance the model's efficiency, the Newton-Raphson-based Optimizer (NRO) further adjusts the weights to improve convergence and performance. The findings show that the integrated model outperforms existing systems, achieving an accuracy of 99.45%, a recall of 99.60%, and an AUC of 99.90%, with the lowest error rate of 0.55%. These are valuable results because they emphasize its stability and fast running, which would make it applicable to the purpose of real-time fraud detection.
Keywords
Introduction
Banks today have greatly benefited from the advancement of Information Technology, which has provided easy management of banking services and ensured credible and efficient banking services electronically. 1 However, this transformation, along with the inclusion of the IoT, comes with a considerable level of risk to the banking ecosystem. IoT-based banking systems are essentially a combination of various smart terminals, including ATMs, mobile applications, POS terminals, and biometric authentication terminals; all these terminals are prone to cyber risks. 2 The increase in cybercrime in the financial sector has become rampant in recent years, posing a significant threat to society. A striking fact to illustrate that ransomware attacks increased by a factor of 1318% in the first half of the year, with the banking sector being the most affected. 3 Other types of cybercrimes that were evident included: Business email compromise (BEC) attacks, given that banks provide large databases of valuable financial information. 4 This risk increases because the different banks are connected, and an attack on one bank will affect the rest of the banks in the system. 5 Another concern about state-sponsored threats in the United States stems from the heightened risk to banks. 6
Some of the threats, such as phishing, credit card fraud, ATM skimming, identity theft, and ransomware, pose a significant risk to banking institutions. 7 Malicious acts on computers can result in theft of banking details, fraudulent activities, and abuse of banking services. 8 These threats lead to consequences such as power outages, leakage of sensitive financial data, and large-scale financial fraud affecting both institutions and customers. 9 To be more precise, current solutions that are applied to counter cyber threats appear to be insufficient in preventing and mitigating cyber threats in IoT-based banking systems. 10 In essence, by practicing biometric authentication and multi-factor authentication, as well as incorporating encryption into their various processes, a growing number of banks are enhancing their security. 11
Nevertheless, as anti-virus tools do not suffice in containing an attacker, the threat is not limited to abusing passwords or phishing lenses; malefactors develop new tactics, making traditional guarding ineffective. Therefore, it is essential to develop security features that are more sophisticated and AI-based to enable real-time threat analysis. 12 Due to the emergence of several digital-delivery methods in the banking sector, criminals have targeted IoT-based banking systems. More conventional forms of protection, such as passwords, PINs, and biometric identification methods like fingerprint, iris scan, and voice print, are vulnerable to bypass methods, including deep fake and credential stuffing. 13 The increasing sophistication of cyber threats necessitates more robust and intelligent security solutions. One of the primary concerns with IoT-based banking experiences is the ability to detect and prevent cyber threats in real-time. 14 Most existing IDS and security frameworks employ rules and signature-based solutions, which limit their effectiveness in responding to emerging threats and zero-day attacks. Furthermore, the constantly growing number of financial operations and intricate connections between banks also makes it challenging to detect illegitimate actions using traditional approaches. 15 With these barriers in mind, this paper aims to examine the suitability of biometric-based cybersecurity measures in IoT-integrated Banking systems.
1.1 Novelty and contribution
The approach begins with Zero-shot Text Normalization (Z-STN), which preprocesses textual data from diverse IoT devices, ensuring uniformity across various sources without requiring labeled data.
The Geometric Algebra Transformer (GAT) is then utilized for feature extraction, leveraging geometric algebra to capture complex relationships and patterns in the data, resulting in a more robust feature representation.
The Multi-instance Coupled Modular Neural Network (M-CMNNet) is employed for attack detection, effectively handling multiple data instances in parallel, improving the system's ability to identify sophisticated and evolving attack patterns.
A Newton-Raphson-based Optimizer (NRO) is applied to fine-tune the model's weights, enhancing convergence speed and accuracy, thereby improving the overall efficiency of the detection system.
The research study presented is organized as follows: Section 2 provides a summary of the most current studies on the subject. Section 3 provides more information about the recommended course of action. Section 4 presents the outcomes of the revised methodology. In Section 5, research justifications for conclusions are provided.
Literature survey
2.1 Below is a list of some of the current articles on attack detection in the banking sector
Alarfaj and Shahzadi 16 in 2024 investigate deep learning for fraud detection using autoencoders and graph neural networks (GNNs). As demonstrated by case studies from two banks, they suggest a GNN with a lambda architecture for real-time fraud detection and an autoencoder for credit card fraud detection. The study uses a temporal transaction graph with a gated temporal attention network to characterize fraud detection as a semi-supervised node classification task. The utilization of both labeled and unlabeled data improves the effectiveness of fraud detection. Limitations include reliance on high-quality data and the need for frequent model updates to identify emerging fraud trends, even when precision and recall have improved.
Nosrati et al. 17 present a hybrid model that combines feature selection using the GA algorithm, machine learning optimized with the WHO algorithm, and fuzzy k-means clustering to create a dynamic face authentication method. Effective facial traits are chosen to preserve accuracy while lowering processing complexity. Better machine learning architectures improve the reliability of verification. Fuzzy decision systems enhance security and client trust by ensuring final authentication, making them suitable for mobile banking. Although the method is highly accurate, it cannot authenticate unlabeled individuals, which restricts its applicability to unfamiliar faces.
Nanda and Goel 18 in 2024 provide a phishing detection method based on a Bidirectional Long Short-Term Memory (BiLSTM)- based Gated Highway Attention block Convolutional Neural Network (BiLSTM-GHA-CNN). With a highway network guaranteeing quick convergence, the CNN extracts prominent characteristics while the BiLSTM records contextual features. To improve classification accuracy, a gating mechanism improves feature weighting. Experiments on various datasets from sources such as PhishTank and OpenPhish show that the method significantly reduces response time while outperforming current methods in accuracy, precision, recall, and F1-score. Real-time deployment on low-power devices may be limited by the method's potentially high computational resource requirements.
For a quick and precise assessment of consumer credit quality, Amarnadh and Moparthi 19 in 2024 suggest a credit risk assessment model utilizing an Adaptive Binarized Spiking Neural Network (ABSNN). The Adaptive Marine Predators Algorithm (AMPA) optimizes neural network parameters to enhance accuracy and minimize loss, while the Variable Color Harmony Algorithm (VCHA) selects relevant characteristics. In terms of accuracy and computational efficiency, the method outperforms the most advanced techniques. Its dependence on intricate optimization methods, however, can raise processing requirements and restrict the scalability of real-time financial systems.
To forecast credit card fraud (CCF), Karthika and Senthilselvi 20 created a modified Deep Convolutional Neural Network (DCNN) model in 2023. To learn both temporal and spatial characteristics, DCNN uses Deep Convolutional Layers (DCL), in contrast to 1D-CNN. Three sample strategies —Random Under-sample (RUS), NearMiss (NMS), and SMOTE —are used to overcome the imbalance problem. The DCNN model outperforms the CNN in terms of accuracy, indicating better fraud detection capabilities. Longer training times and higher computing costs could result from its complexity, though.
Al-Dahasi et al. 21 utilize machine learning to enhance operational risk frameworks in 2025, aiming to detect financial fraud in digital payments. One-hot encoding, feature selection, sampling, normalization, and tokenization are among the data preparation techniques employed in the study. Hyperparameter optimization is utilized to train six machine learning models and enhance their forecasting accuracy. F1-score, recall, accuracy, and precision are used to assess performance. The outcomes demonstrate that Random Forest and XGBoost perform better than other models, successfully balancing the rates of erroneous positives and false negatives. Although the method enhances the effectiveness of fraud detection, its reliance on intensive preprocessing and hyperparameter tuning may make real-time systems more complex to implement and computationally more expensive.
Baabdullah et al. 22 present a credit card fraud detection (CCFD) system in 2024 that combines blockchain technology with Federated Learning (FL). Local models on fog nodes share starting parameters with a global learning model enabled by FL on a cloud server. Before updating the international model, three banks train their own models locally, protecting the privacy of their data. Blockchain ensures secure, immutable data transfer. The system protects privacy and data while improving fraud detection. However, FL's reliance on distributed learning may add computational complexity and communication costs, which could affect how well large-scale financial networks identify fraud in real-time.
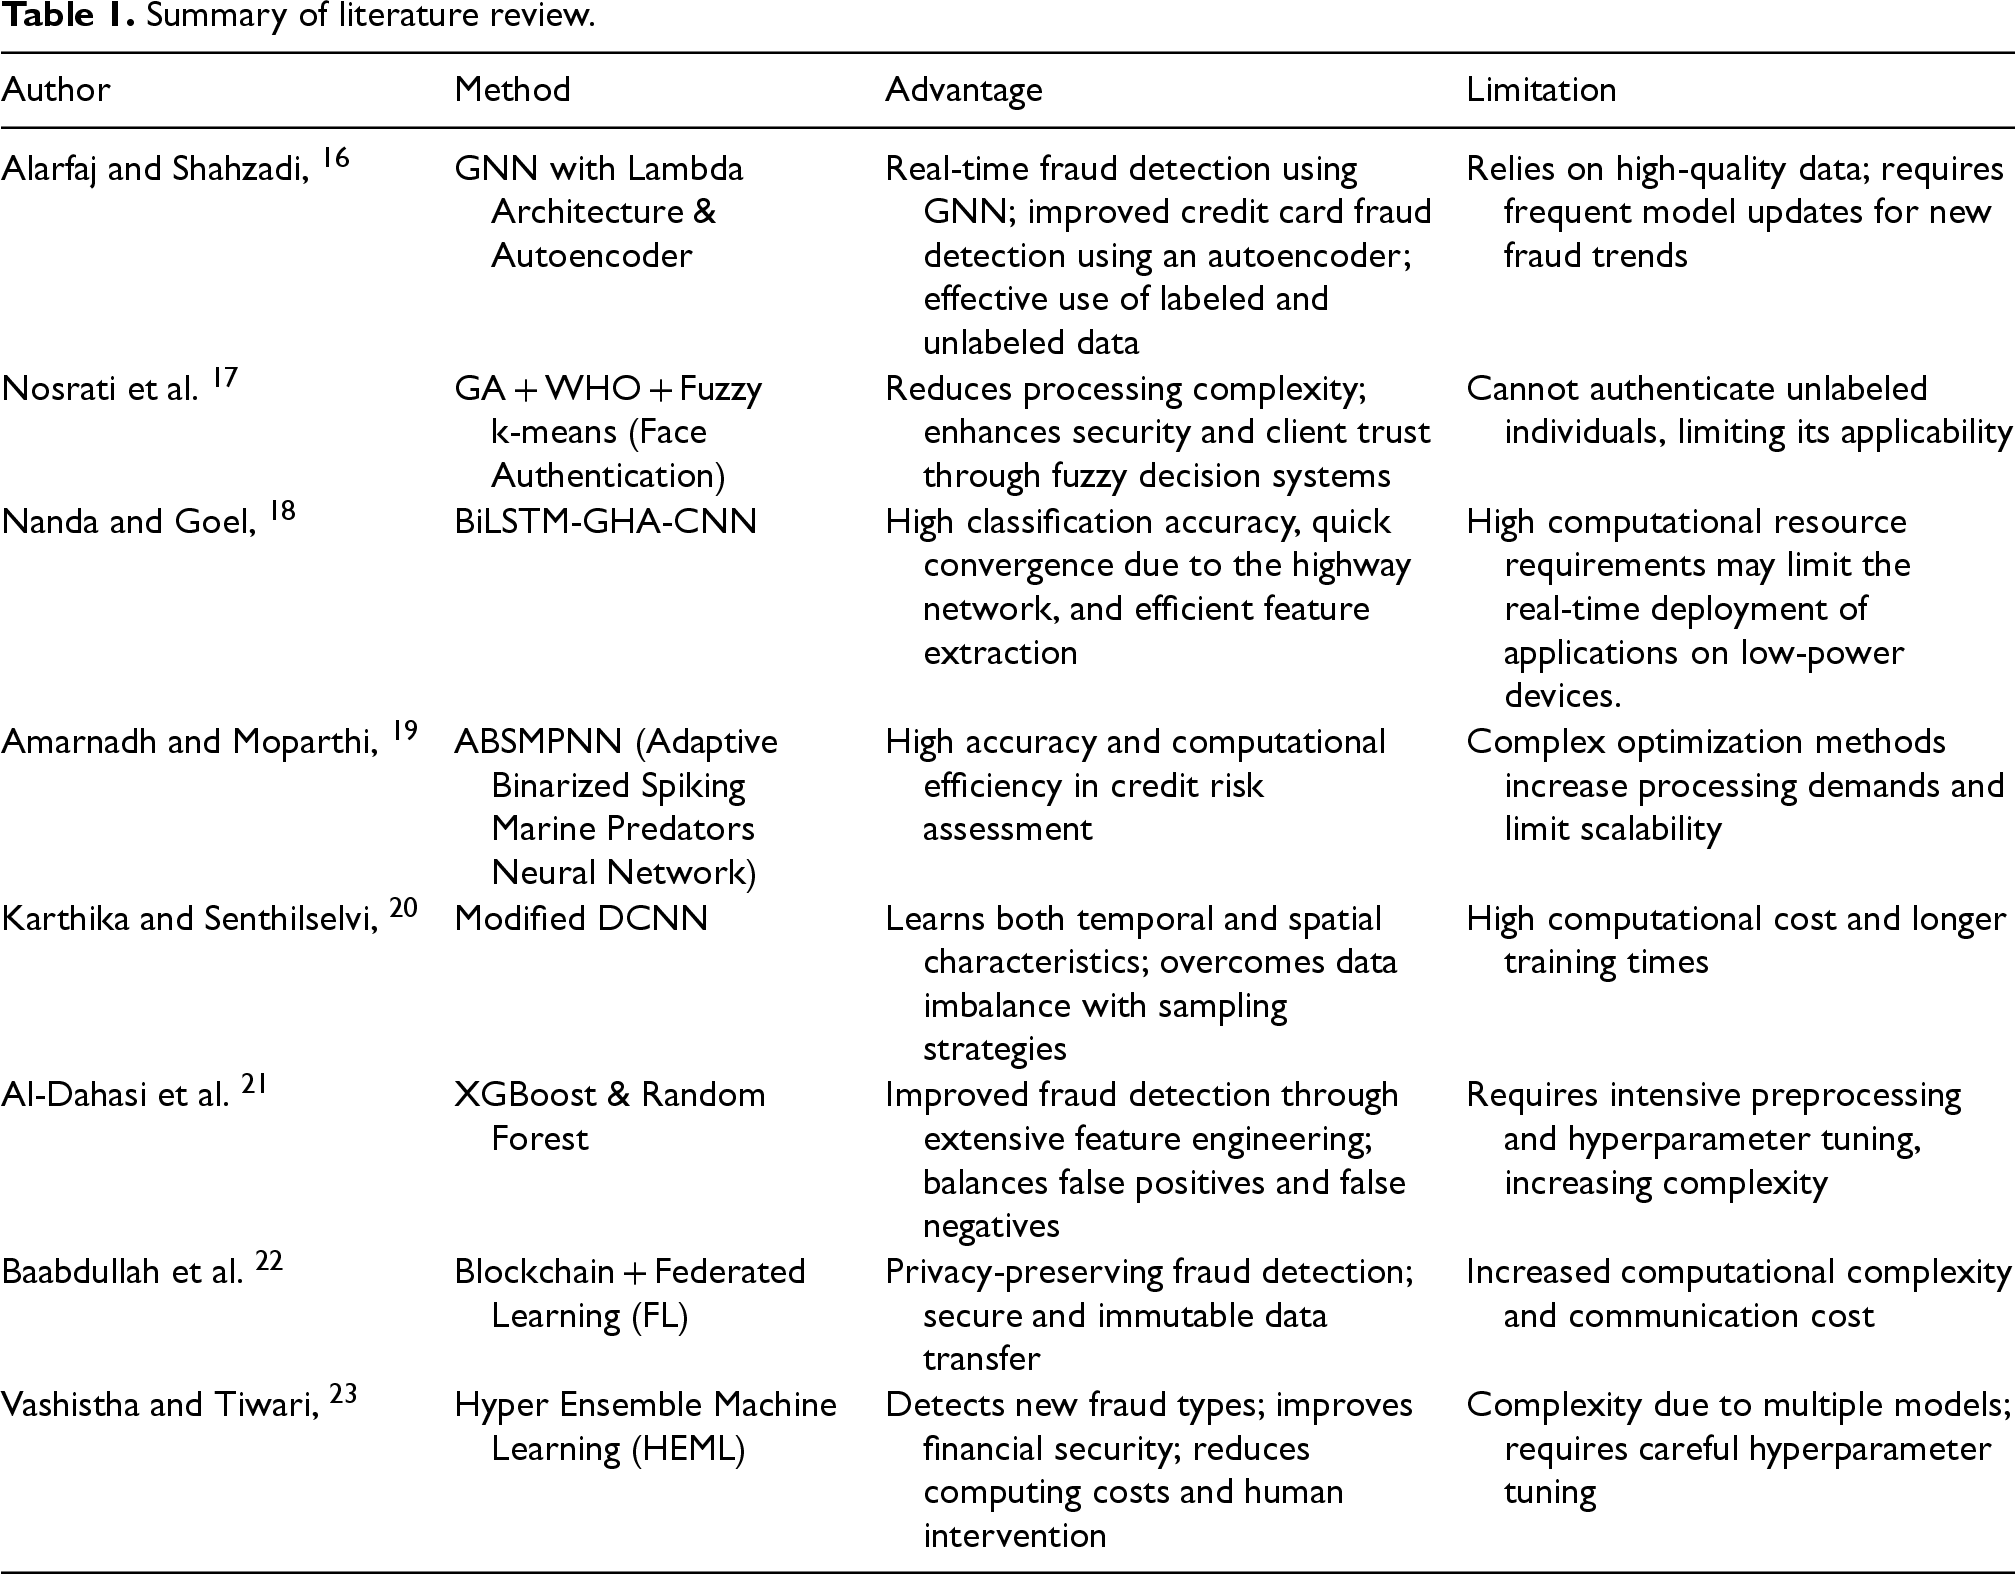
Vashistha and Tiwari 23 in 2024 propose a Hyper Ensemble Machine Learning (HEML) method for detecting bank fraud by combining unsupervised and semi-supervised models, including logistic regression, decision trees, SVM, neural networks, one-class SVM, and isolation forests. HEML reduces computing costs and human intervention while outperforming baseline approaches in accuracy, precision, recall, F1-score, and AUC-ROC when tested on actual bank transactions. New fraud types that are not present in the training data are successfully detected by it. However, combining several models makes things more complicated and necessitates careful adjustment of hyperparameters. Despite this, HEML improves fraud detection, enhancing financial security and flexibility in ever-changing fraud scenarios. The literature review summary is described in Table 1.
Summary of literature review.
Summary of literature review.
Significant security concerns have been raised by the growing reliance on IoT-based banking systems, particularly regarding the identification of attacks that compromise the integrity of financial transactions. Banks’ IoT devices remain vulnerable to various types of attacks, including DoS, unauthorized access, and data theft, which compromise customer data and erode trust. Due to these and other factors, robust and real-time attack detection and prevention mechanisms should be developed, as the attacks are highly complex and the IoT environment is constantly evolving. Consequently, to address the emerging threats in IoT-based banking systems, conventional security solutions may not be sufficient. Hence, to protect the banking operation process and customers’ information, it is essential to use a complicated and large-scale system that can effectively detect and prevent these attacks.
Proposed methodology
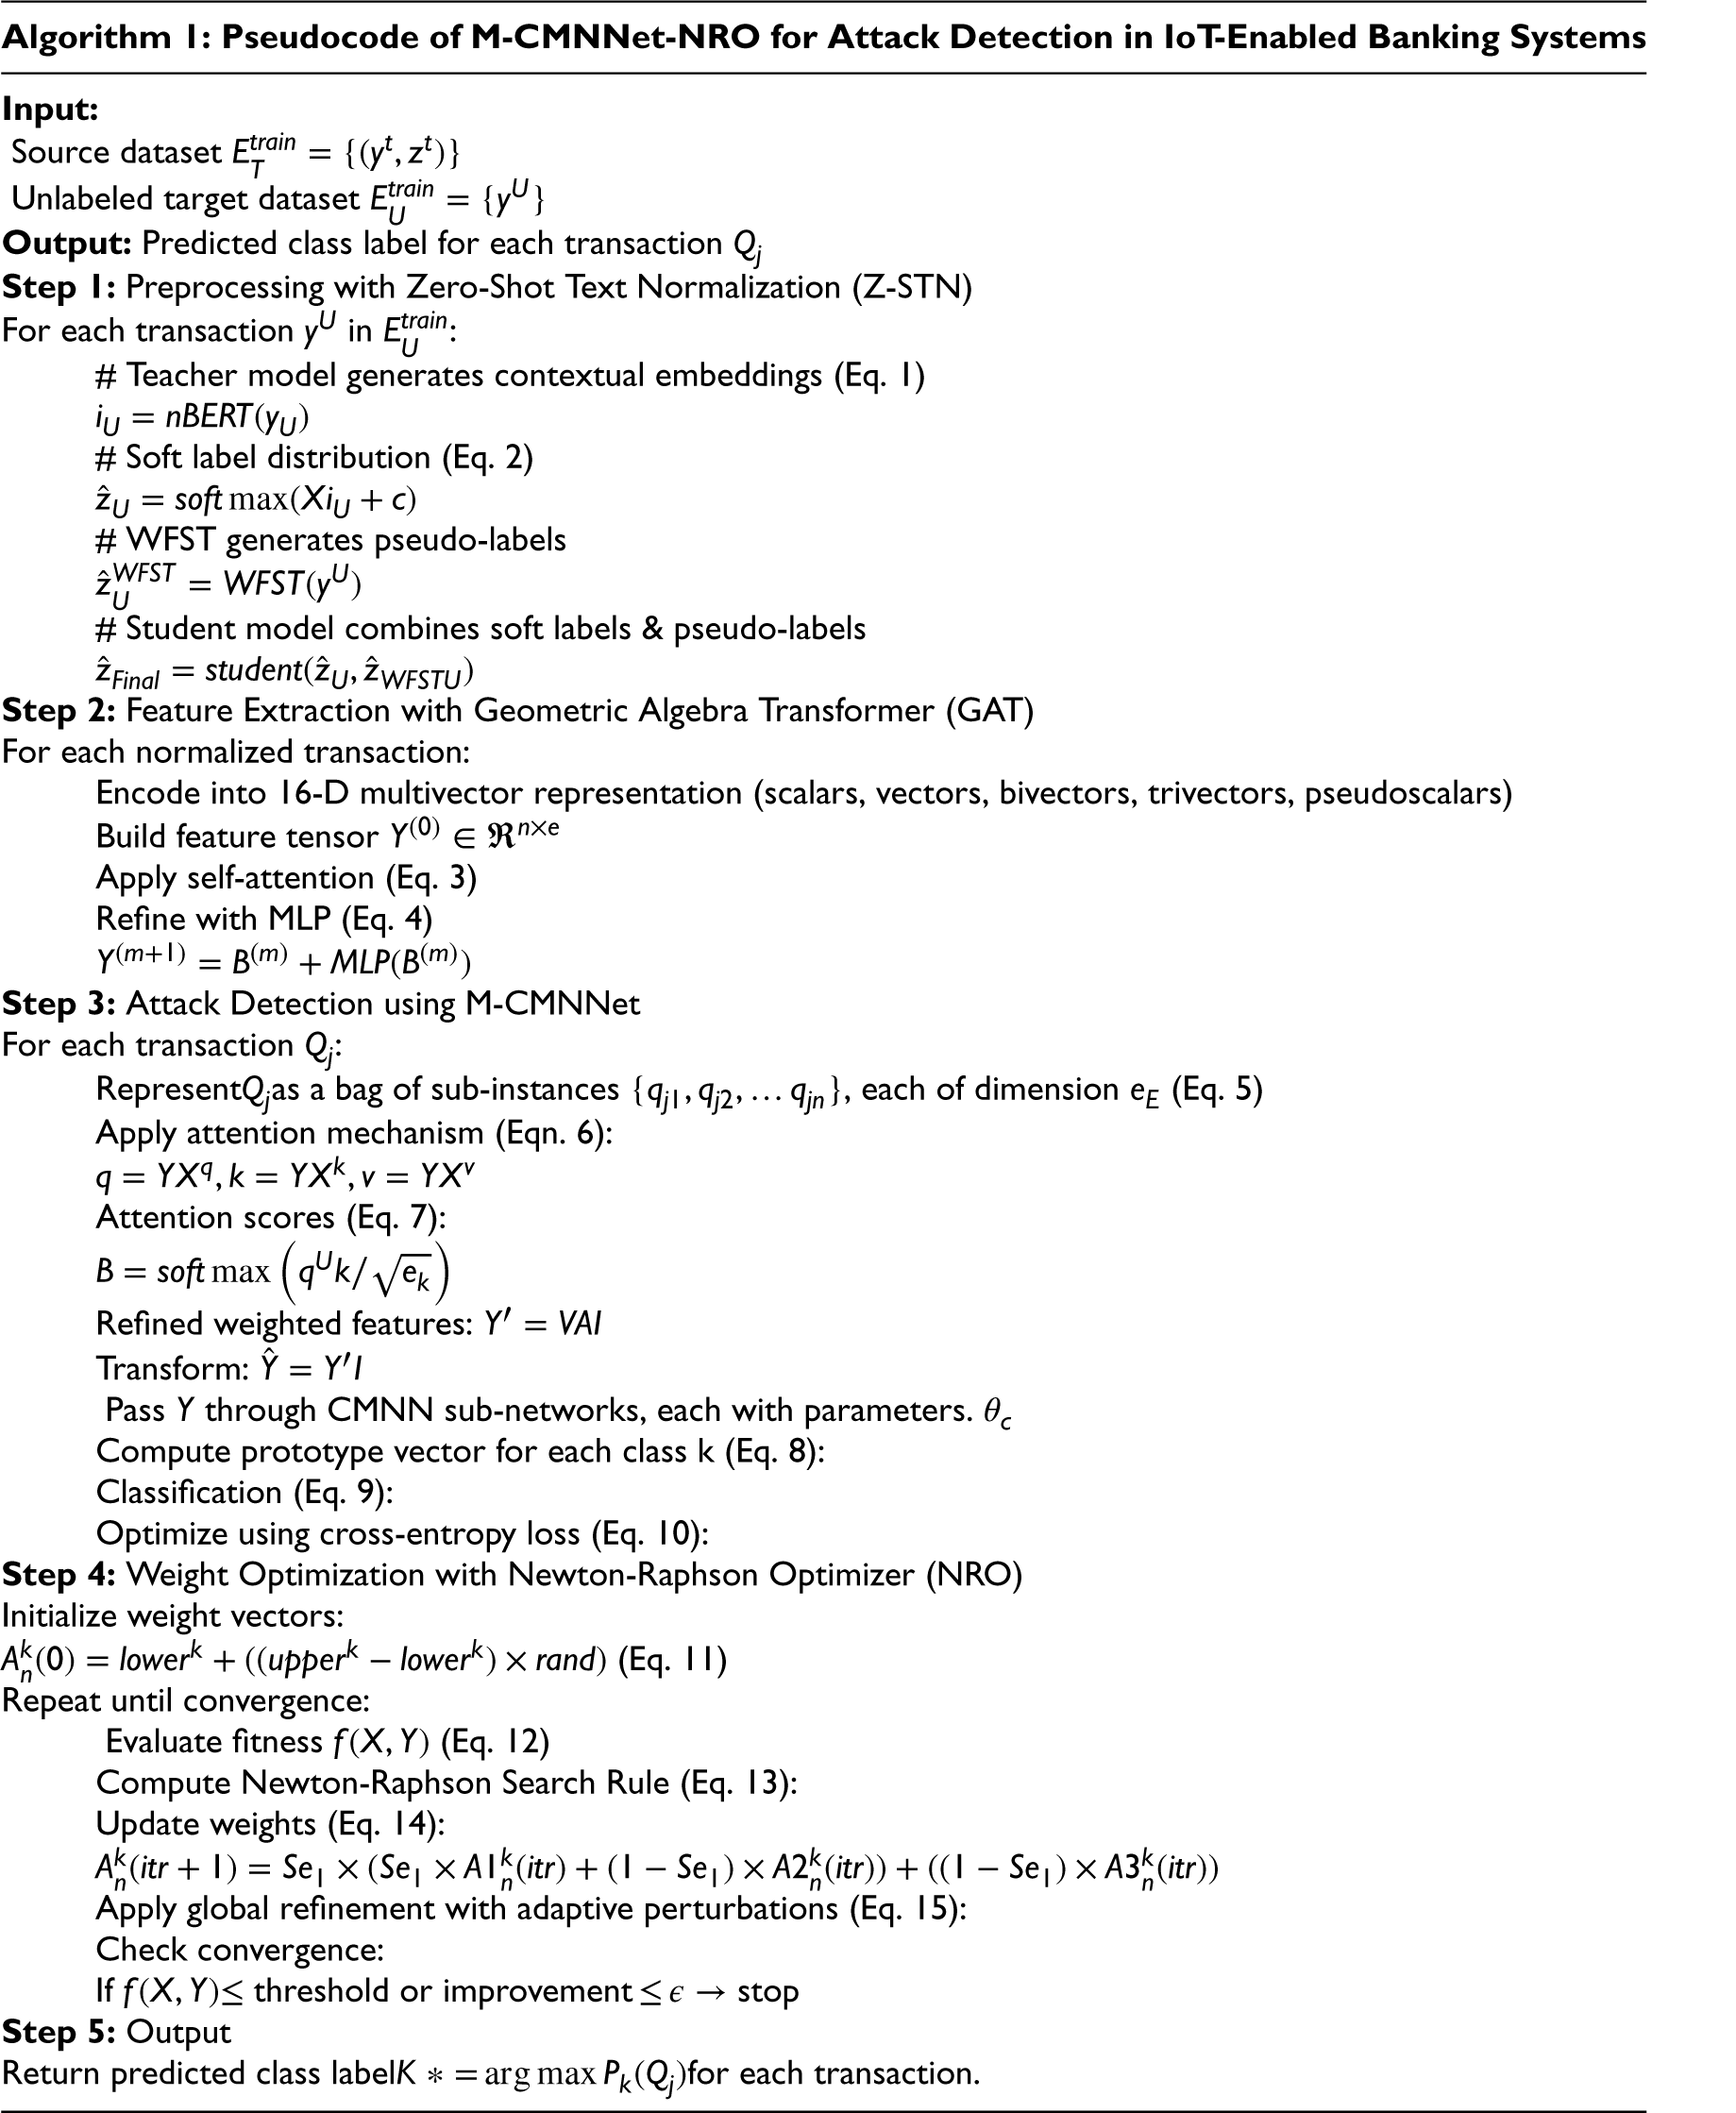
A new Multi-Instance Coupled Modular Neural Network with Newton-Raphson Optimizer (M-CMNNet-NRO) is introduced to detect attacks in IoT-based banking systems. Under this method, data is first gathered from various IoT devices within the banking system. The raw data is subsequently preprocessed by Zero-shot Text Normalization (Z-STN), which normalizes and standardizes text data from different sources, making them uniform without requiring labeled data. Then, the Geometric Algebra Transformer (GAT) is utilized for feature extraction, where it leverages geometric algebra to identify complex relationships and patterns within the data, resulting in a rich feature representation. Having these features, the Multi-instance Coupled Modular Neural Network (M-CMNNet) is utilized for attack detection. This network processes multiple instances of data at once, enhancing the detection of complex and dynamic attack patterns. To further optimize the model's efficiency, a Newton-Raphson-based Optimizer (NRO) is employed to fine-tune the weights, achieving faster convergence and higher accuracy. The proposed M-CMNNet-NRO architecture is described in Figure 1.
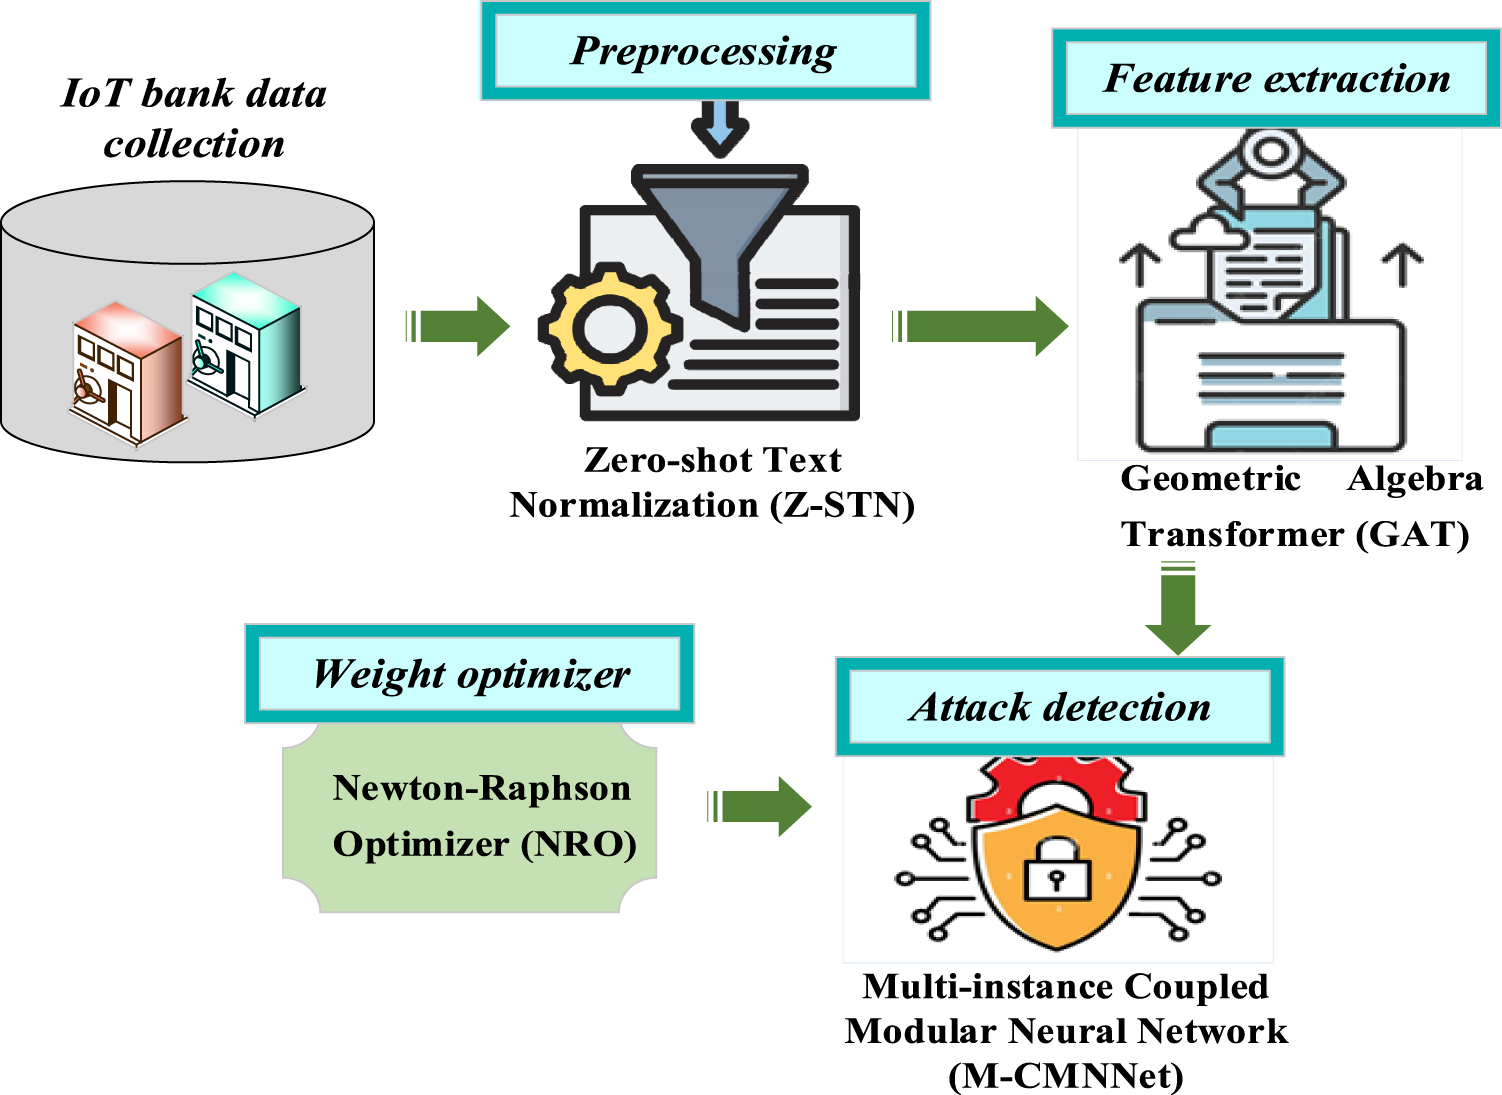
Proposed M-CMNNet-NRO architecture.
Zero-Shot Text Normalization (Z-STN)
24
preprocesses bank data by normalizing financial transaction records without labeled data. It normalizes textual information from various sources, ensuring consistency across different formats and structures. Using a labeled source dataset 

The Geometric Algebra Transformer (GAT)
25
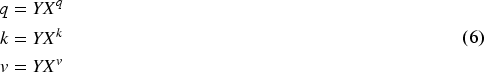
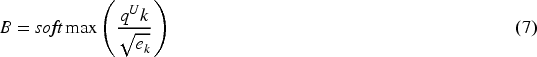
receives the preprocessed data and uses it to preserve geometric relationships while extracting relevant features. GAT functions within the geometric algebra 

The Multi-instance Coupled Modular Neural Network (M-CMNNet) processes the extracted features for precise attack detection. The model consists of a Multi-instance Attention Network (M-ANet)
26
and a Coupled Modular Neural Network (CMNN).
27
The attention network assigns different weights to feature sub-instances, while CMNN classifies attacks using modular sub-networks. Each sub-network focuses on distinct aspects of financial transactions, improving detection accuracy. Each transaction is represented as a bag of sub-instances by equation (5),

By doing this, it is ensured that more significant sub-instances receive more weight. When 

The M-CMNNet uses a Newton-Raphson-based optimizer (NRO)
28
to fine-tune the weight parameters
The NRO framework initializes a population of weight vectors at random within predefined constraints. Each agent is iteratively modified to reflect a weight vector based on optimization criteria. To give the initial weight vectors, use equation (11),

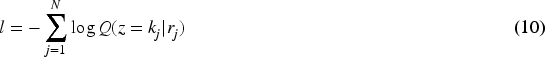
The effectiveness of the weight parameters in the M-CMNNet is assessed by the fitness function 
Here, the weight matrices at iteration n, denoted by
Weight values are refined with the use of the Newton-Raphson method, which approximates second-order derivatives. For each weight, the update direction is determined using equation (13),

To maximize performance, the weight update procedure iteratively fine-tunes the parameters. Using a weighted combination of prior values, the new weight 
Here,
This phase globally refines the solution with a perturbation method that dynamically changes the search space and adaptive perturbations based on previous results. Through adaptive adjustments in the search space, refinement is driven by equation (15), which employs both the best and worst responses, as well as random noise, to introduce variety.

The amount of adaptive modifications made during the perturbation process
The evaluation of the objective function
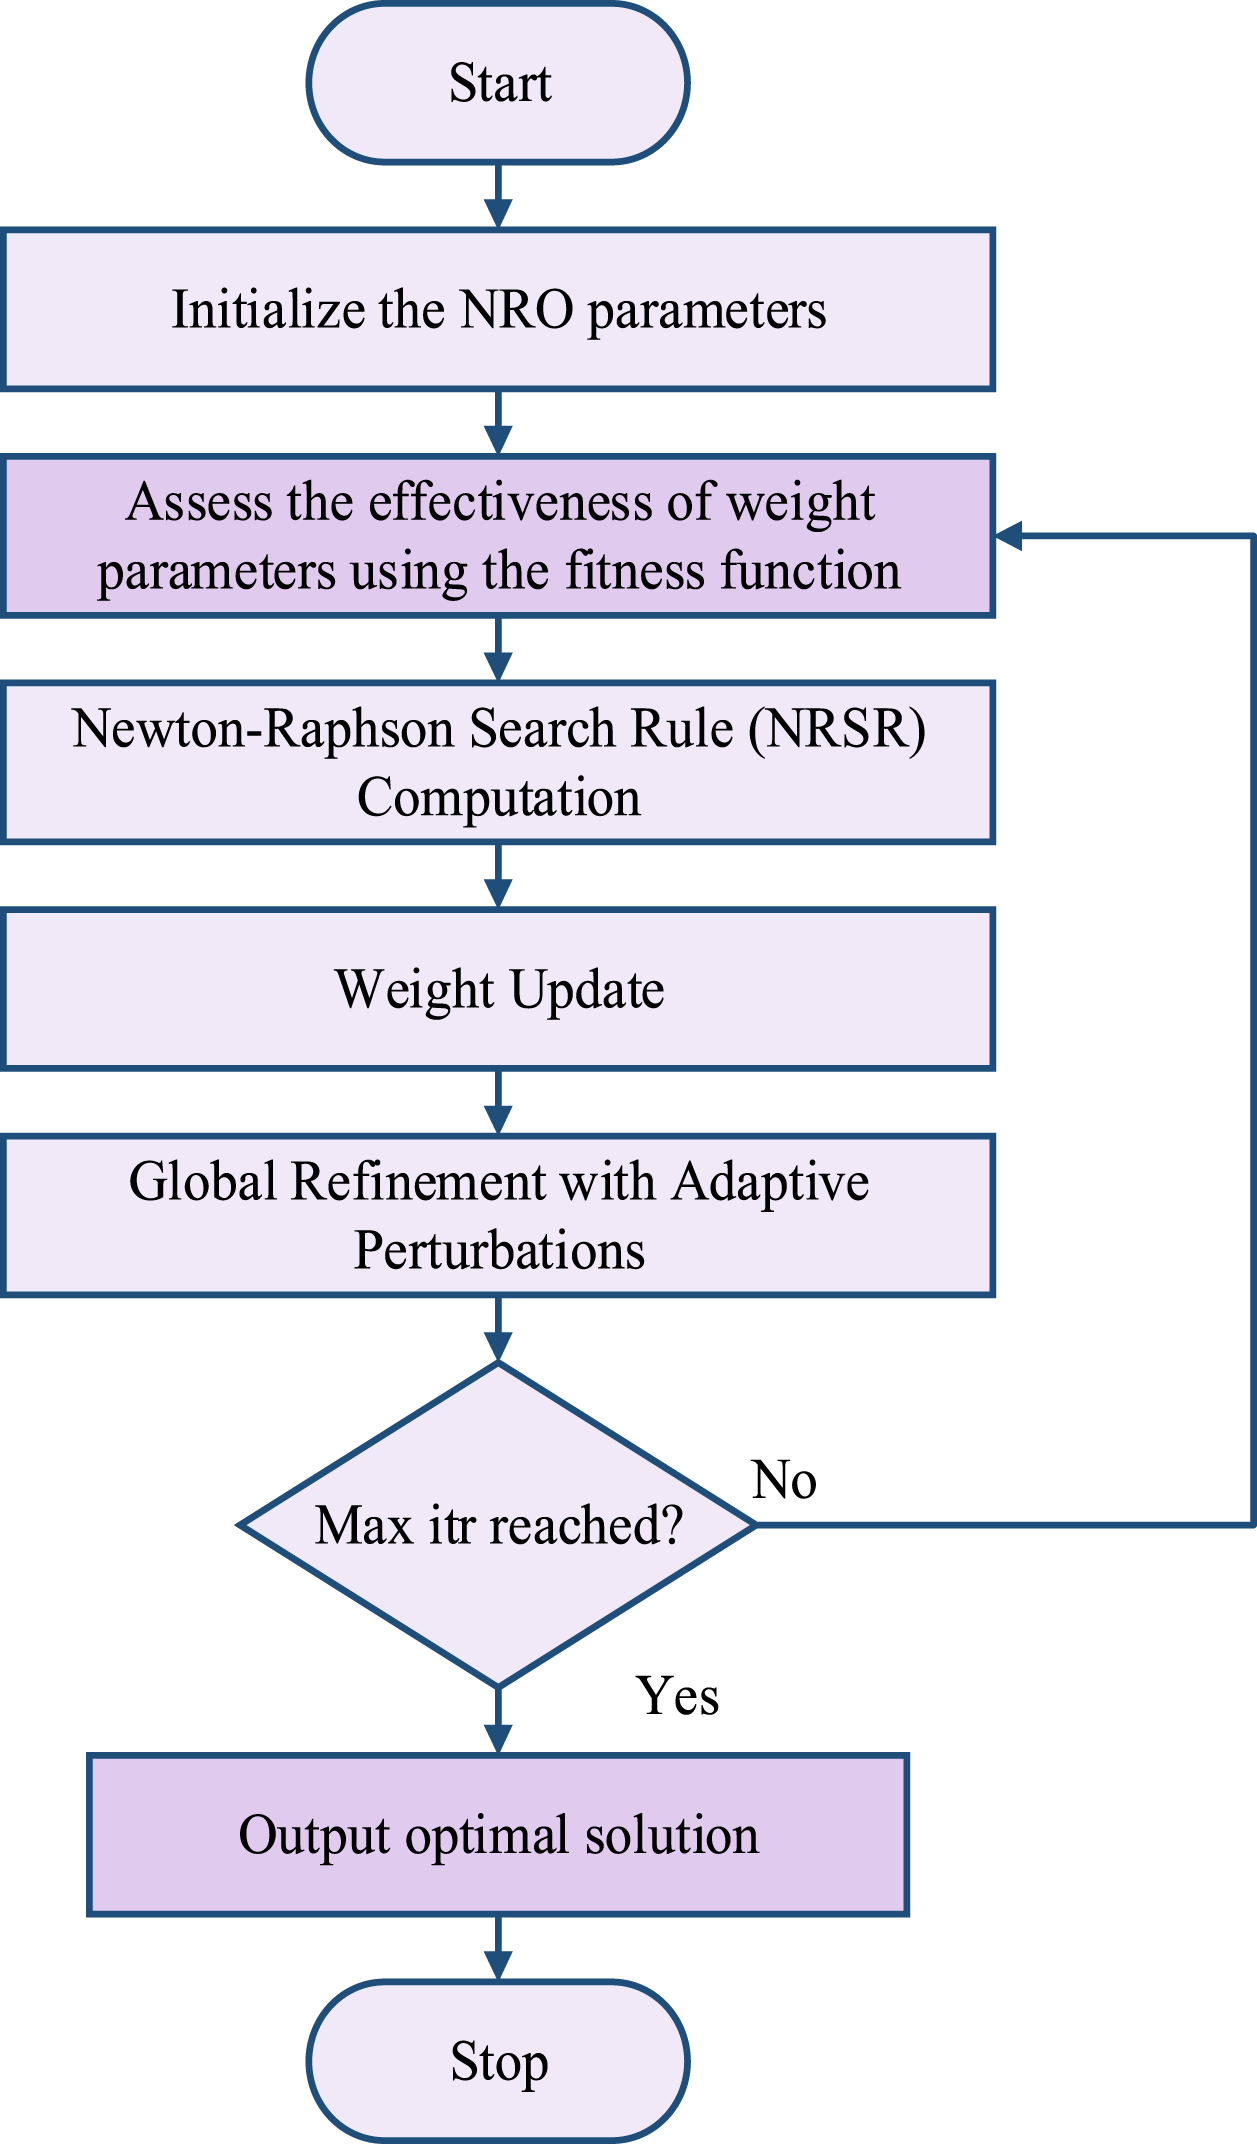
Flowchart of NRO.
In this section, the outcomes of applying the M-CMNNet-NRO model for attack detection in IoT-based banking systems are critically examined. Performance evaluations of the Python-developed models were conducted on a Windows 10 PC.
Dataset description
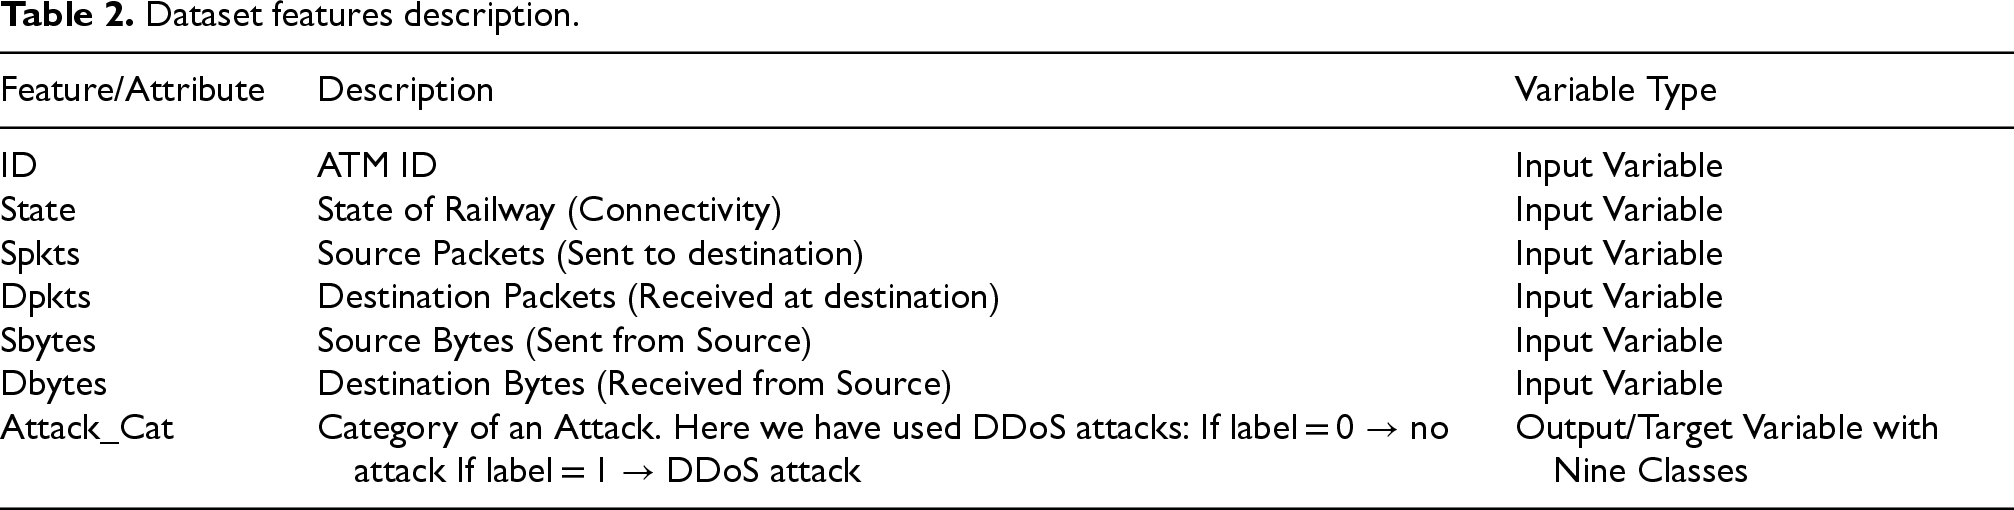
The Banking Dataset is designed to track network intrusions, with a particular emphasis on detecting malware, including Distributed Denial of Service (DDoS) and Denial of Service (DoS) attacks. In a financial setting, it offers essential characteristics about service utilization among four PCs. The likelihood of a major DDoS assault increases when the value in the PC's service distribution surpasses 0.5. A reduced likelihood of an attack is indicated by values less than 0.5. The dataset comprises a total of 2,25,000 samples with a distribution of target classes and 50,000 DDoS attacks. The feature description of this dataset is detailed in Table 2. To ensure a balanced approach to network threat identification and mitigation in banking systems, 80% of the data is used for training, while the remaining 20% is reserved for testing. This dataset is designed to simulate and detect Distributed Denial of Service (DDoS) attacks within a banking sector's IoT-based monitoring system. It was sourced from a public platform (Kaggle) and preprocessed for machine learning applications.
Dataset features description.
Dataset features description.
This study evaluates the proposed M-CMNNet-NRO model for attack detection in IoT-based banking systems using several performance indicators, including recall, accuracy, precision, F1-score, and false positive rate (FPR). The formulas for these performance measures are presented in Table 3 below.
Performance metrics.
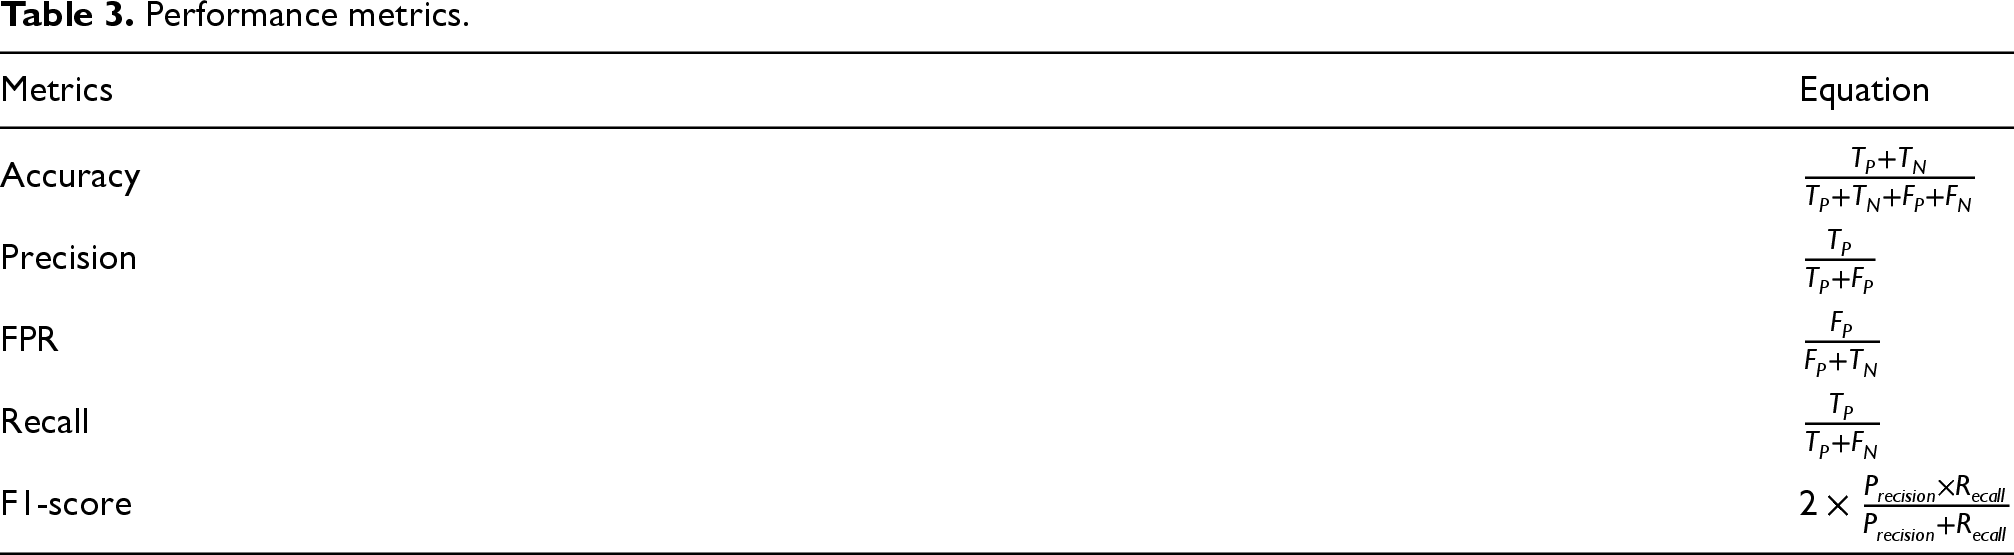
Performance metrics.
In this section, the effectiveness of the proposed M-CMNNet-NRO is comprehensively studied. To evaluate the model's effectiveness in identifying fraudulent transactions as much as possible, it is advisable to use specific metrics, including accuracy, precision, recall, F1-score, area under the curve (AUC) for specificity, false-positive rate, and error rate. For a proper evaluation of fraud detection skills, the Banking Fraud Detection dataset is used during the assessment. The authenticity-based measures, which provide insight into the true and false values of transactions, aid in understanding the model's categorization capabilities. This analysis provides strong validation of the model's performance.
Figure 3 illustrates the performance of the M-CMNNet-NRO model over 100 epochs of training and testing. In (a), the accuracy for testing and training rises quickly in the first few epochs, reaching approximately 0.98 by epoch 20. For both sets, the accuracy steadily increases and stabilizes around 0.99, suggesting excellent performance and little overfitting. The loss in (b) drops below 0.60 by epoch 20 after a steep decline in the early epochs. As it continues to decline, it stabilizes at approximately 0.57 for training and 0.58 for testing, indicating efficient learning and convergence.
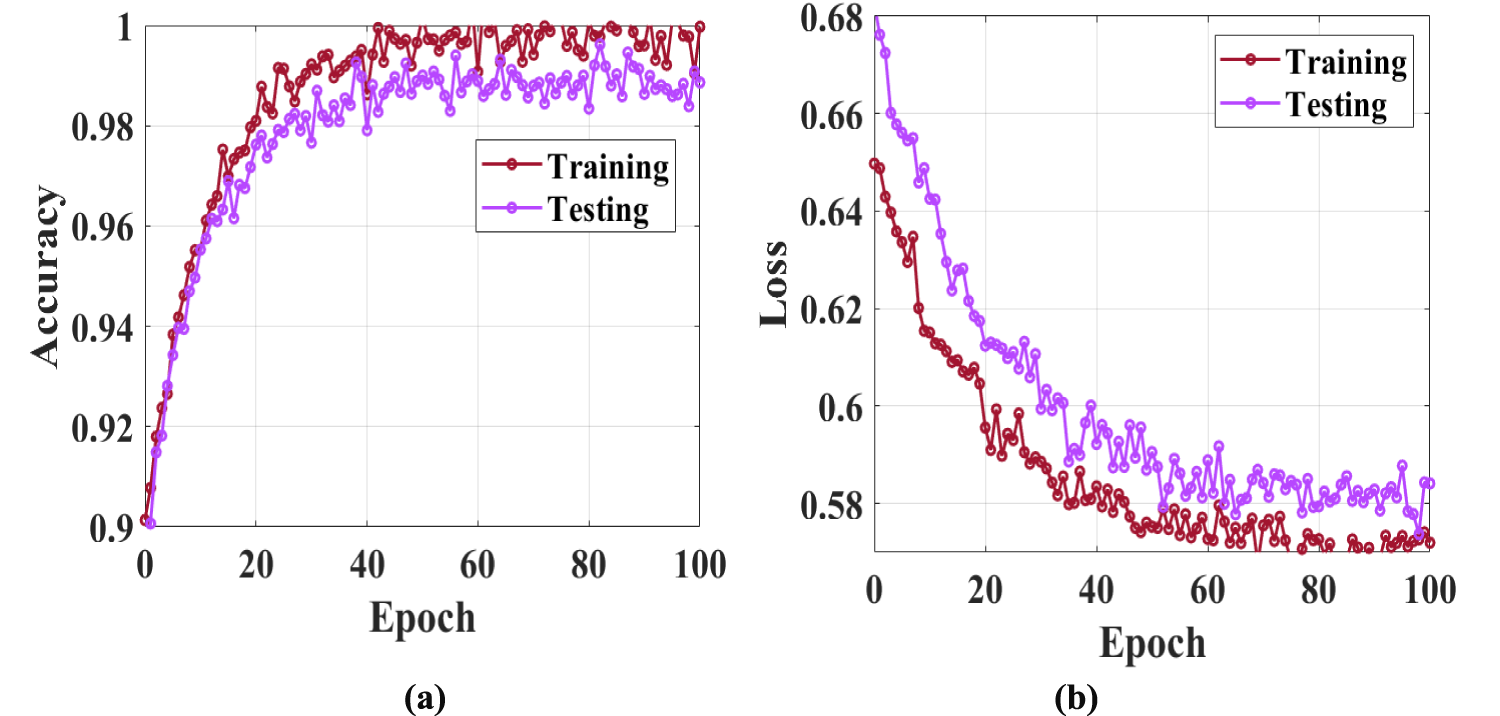
Proposed (a) accuracy (b) loss curve.
The Precision-Recall curve for the M-CMNNet-NRO model is shown in Figure 4, illustrating its effectiveness in attack detection. ‘Recall’ is represented by the X-axis, and ‘Precision’ by the Y-axis. At a recall of 0, the curve begins with a high precision of roughly 1.0, indicating that the model is quite accurate in making predictions, but only covers a very small percentage of actual positive cases. Precision rapidly decreases as recall rises, dropping below 0.2 when recall hits 0.1. Precision stabilizes at a low value, ranging from 0 to 0.05, after a recall of 0.2. This implies that the model's total capacity to capture all positive cases (high recall) is constrained, resulting in low accuracy for wider coverage, even though it can be accurate for a small subset of detections.
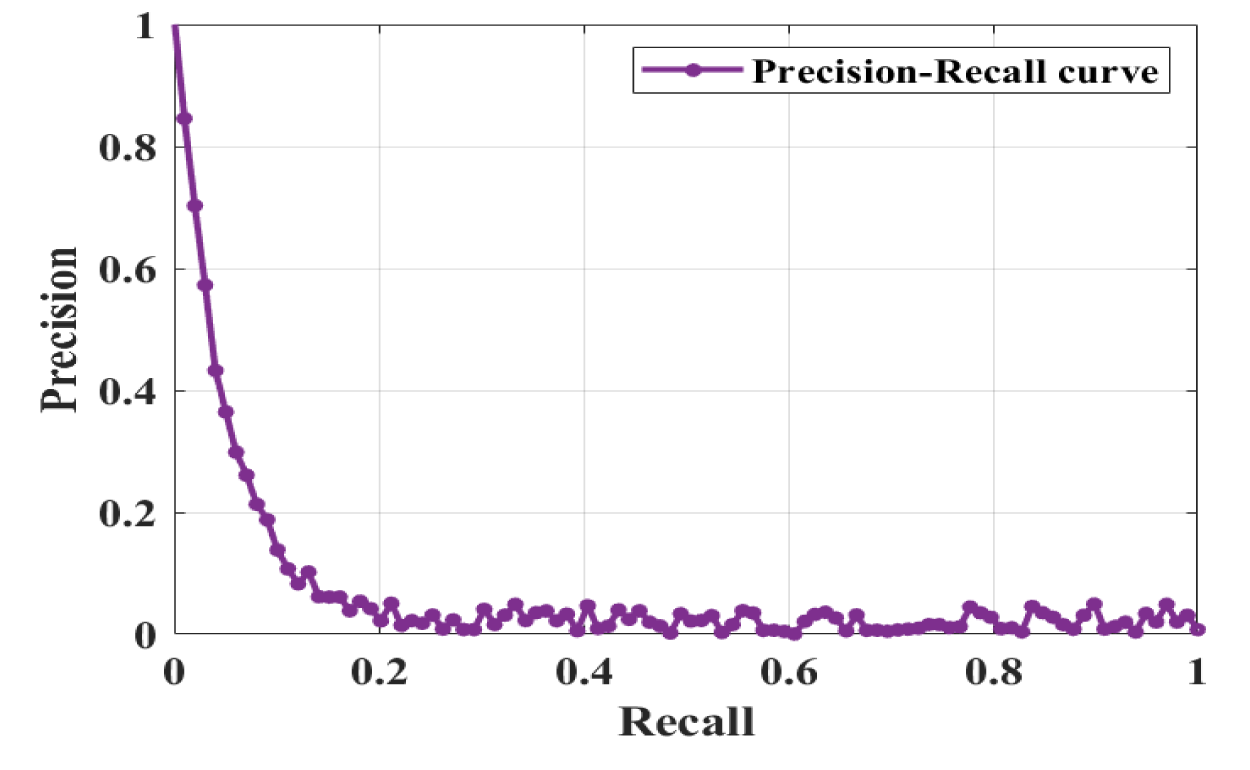
Precision-Recall curve of M-CMNNet-NRO.
The M-CMNNet-NRO model's Receiver Operating Characteristic (ROC) curve, which evaluates the model's ability to detect attacks, is presented in Figure 5. With a false positive rate of nearly zero and a True Positive Rate of approximately 0.4, the model's curve rises dramatically. After that, a staircase pattern appears, indicating excellent sensitivity and a low rate of false positives. Notably, the performance is outstanding with an Area under the Curve (AUC) of 0.99. With a high True Positive Rate and a low False Positive Rate, the model appears to be able to distinguish between attack and typical cases, as indicated by the high AUC value. The curve illustrates the model's reliability and accuracy in detecting attacks.
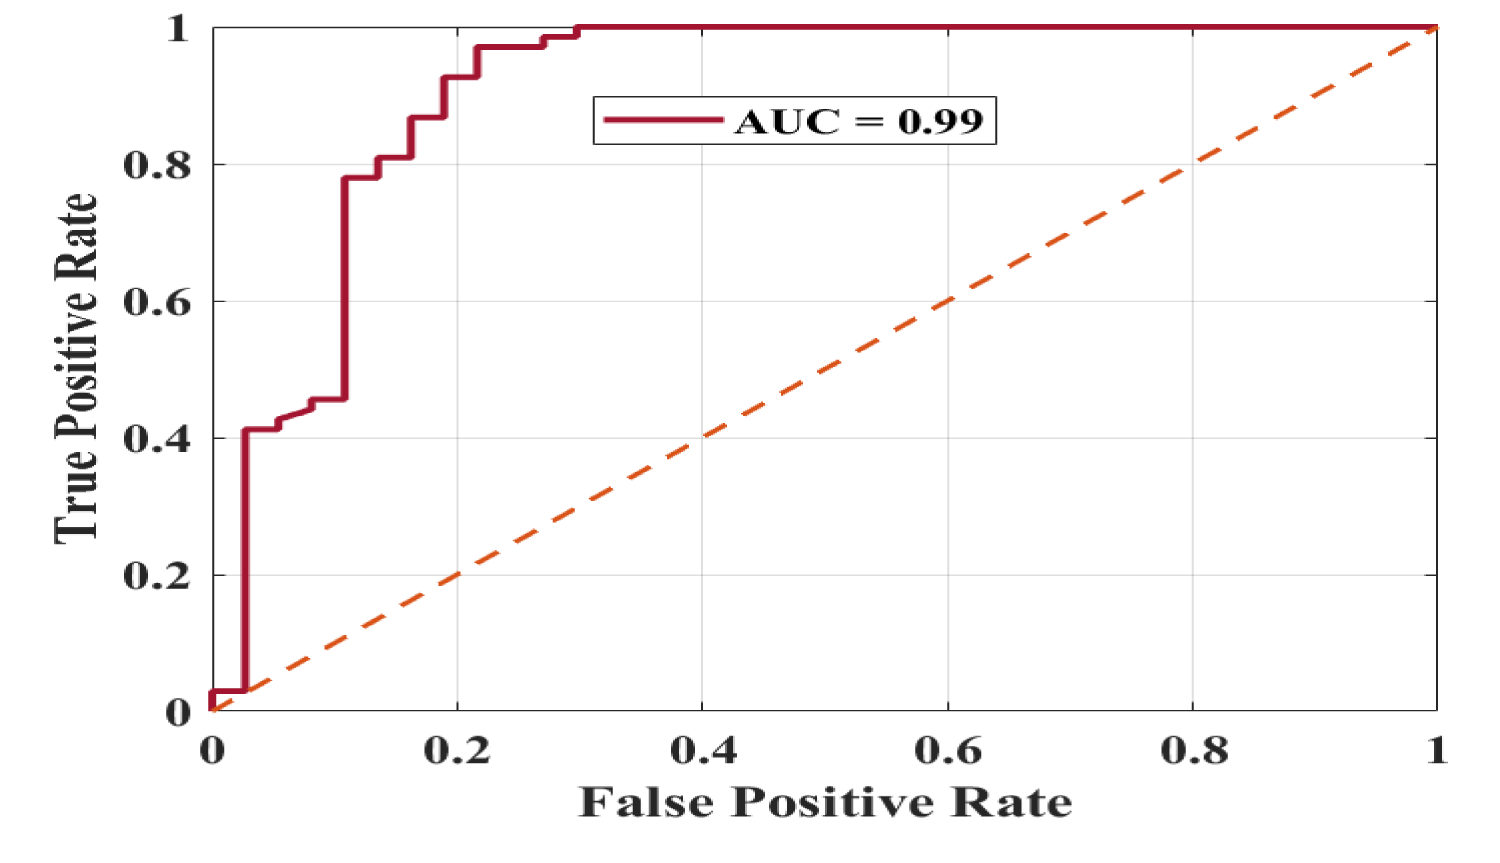
ROC curve of M-CMNNet-NRO with AUC.
‘Transaction Amount’ and ‘Account Balance’ are represented in terms of transaction amounts/number on the x-axis in the range of 0 to 100, as shown in Figure 6. The monetary values related to the mentioned factors are depicted on the y-axis. The ‘Transaction Amount’ (blue line) remains consistently low, typically ranging from 0 to 500, with sporadic peaks occurring around 1000. This suggests that there are occasionally larger transactions interspersed with very minor, frequent ones. The ‘Account Balance’ (orange line), on the other hand, exhibits a far wider range, fluctuating between roughly 2000 and 14000. It exhibits sharp fluctuations, indicating that the account balance has undergone significant fluctuations over the period.
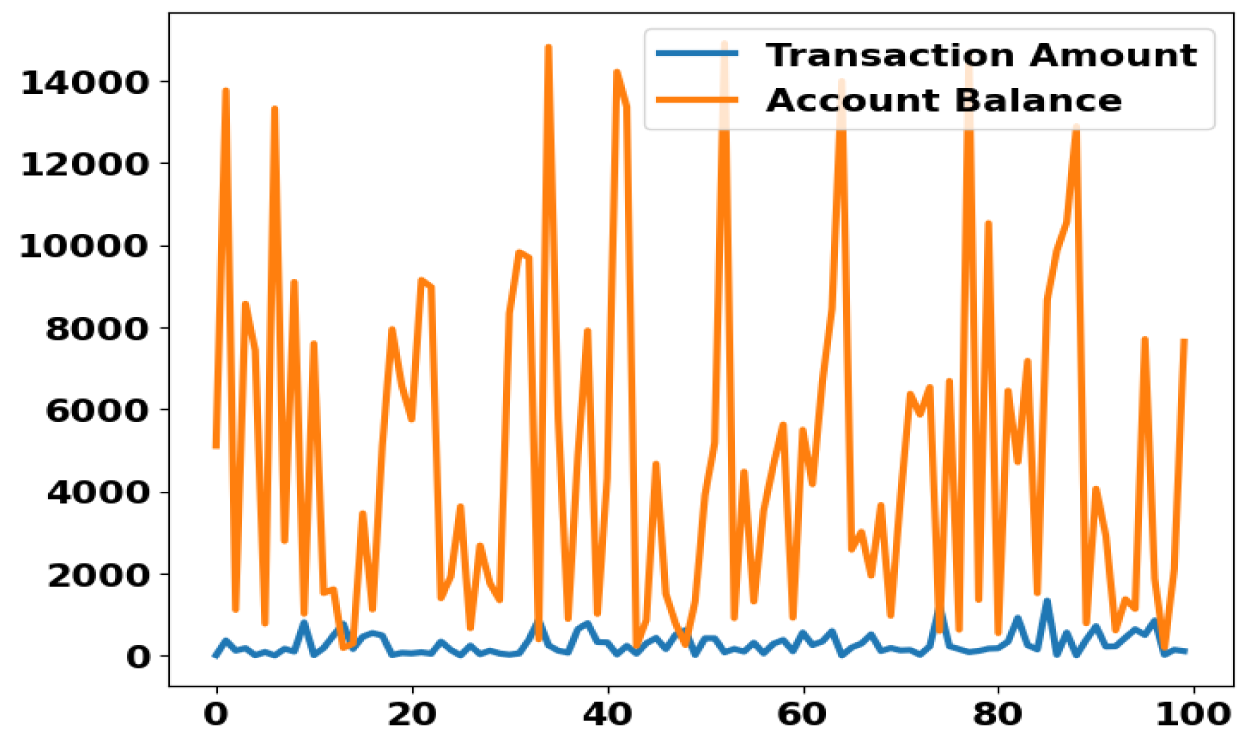
Transaction amount vs. Account Balance Over Time.
Figure 7 is a histogram illustrating the distribution of transaction amounts within a dataset. The y-axis represents the number of transactions, and the x-axis represents the Transaction Amount, which ranges from 0 to approximately 2000. The blue-shaded histogram bars indicate that the majority of transactions occur at smaller sums, with the maximum frequency observed between 50 and 100. As the transaction amount rises, the count falls, suggesting a distribution that is skewed to the right. The histogram is superimposed with a kernel density estimation (KDE) curve, which highlights the concentration of transactions at lower values. For values near zero, the number of transactions peaks at over 400, then rapidly decreases for larger amounts, with very few transactions beyond 1500.
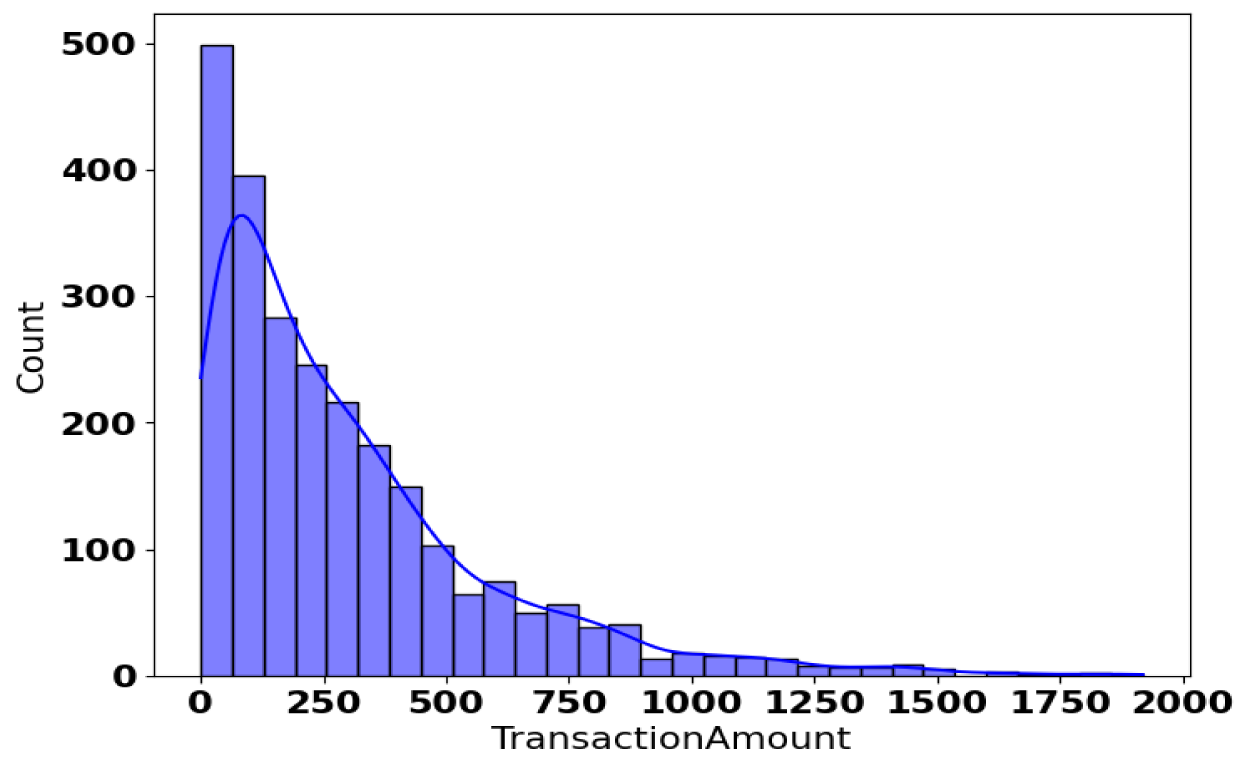
Distribution of transaction amounts.
The distribution of ‘Transaction Amount’ between ‘Debit’ and ‘Credit’ transactions is shown in Figure 8. The X-axis classifies transactions as either “Debit” or “Credit,” while the Y-axis shows the “Transaction Amount” in dollars. The distribution of ‘Debit’ is centered below 500, with a median of about 200. The right-skewed distribution of the shape indicates a few high-value transactions. The distribution of ‘Credit’ is slightly more dispersed, with a median of approximately 300. A right-skewed distribution is likewise suggested by the shape, although there is a greater range of transaction amounts than with Debit. In conclusion, credit transactions have a wider range and a slightly higher median than debit transactions, which are typically lower in value and less variable. Both kinds of transactions tend to involve smaller sums, with sporadic increases.
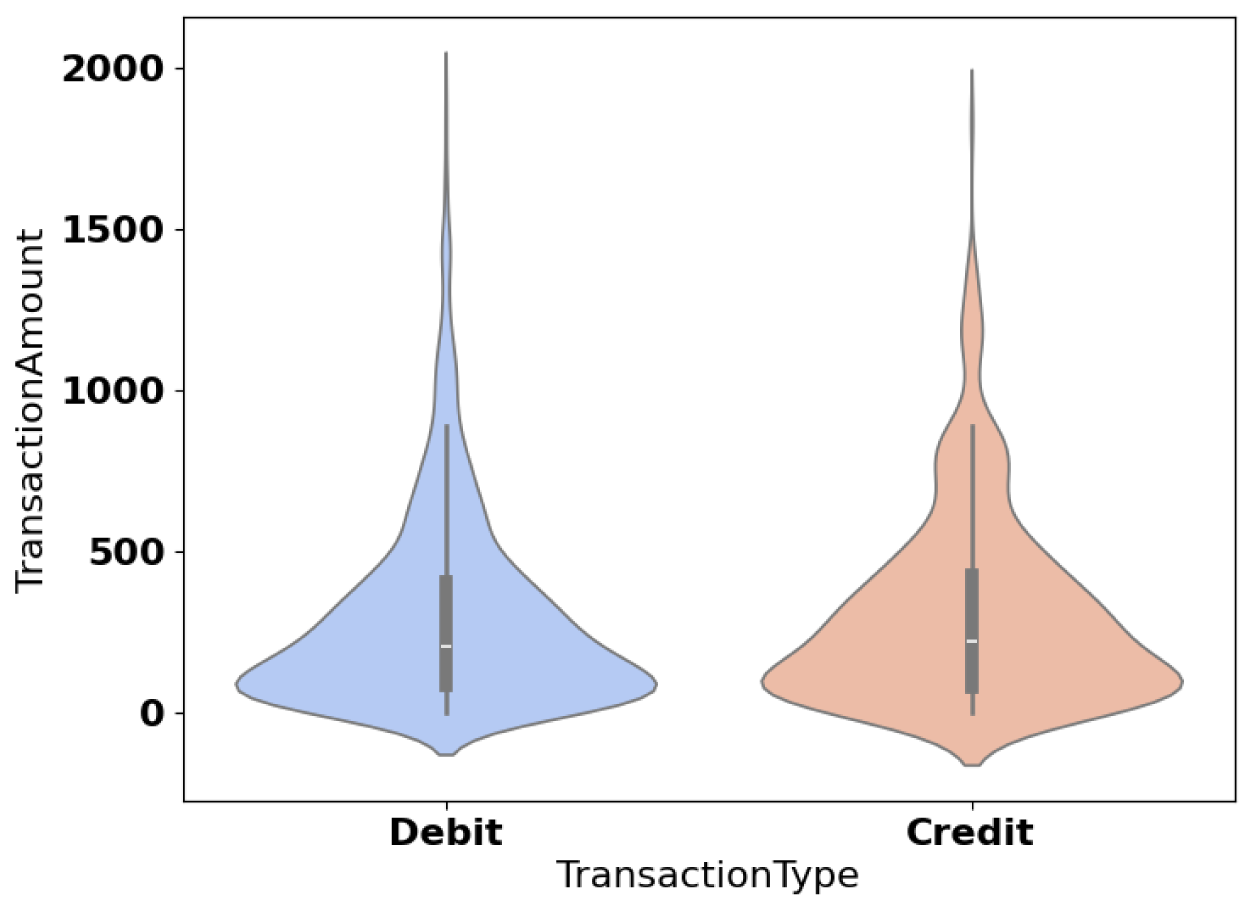
Violin plot of transaction amount by transaction type.
The availability of “Account Balance” for “Debit” and “Credit” is depicted in Figure 9. The horizontal axis, labeled “Transaction Type,” has two categories: “Debit” and “Credit,” and the vertical axis displays “Account Balance” in dollars. The data in the ‘Debit’ box varies from 1500 to 7500, while the midpoint of the ‘Account Balance’ is 4500. The whiskers that extend to the most significant and minimum values also contain a larger spread, up to the 15,000th outliers. Credit is included in the figure, ranging from roughly 2000 to 7800, while the mid-value of Credit, the median, was slightly higher, around 4800. Moreover, the whiskers indicate the extent of the range up to 15000. Hypothesis 1: Most accounts have an ‘Account Balance’ of a similar magnitude in ‘Transaction 1’ as in ‘Transaction 2’. In general, a relatively similar distribution of accounts of ‘Transaction 1’ and ‘Transaction 2’ can be observed concerning the ‘Account Balance’. The boxes indicate that for credit transactions, the spread is slightly higher.
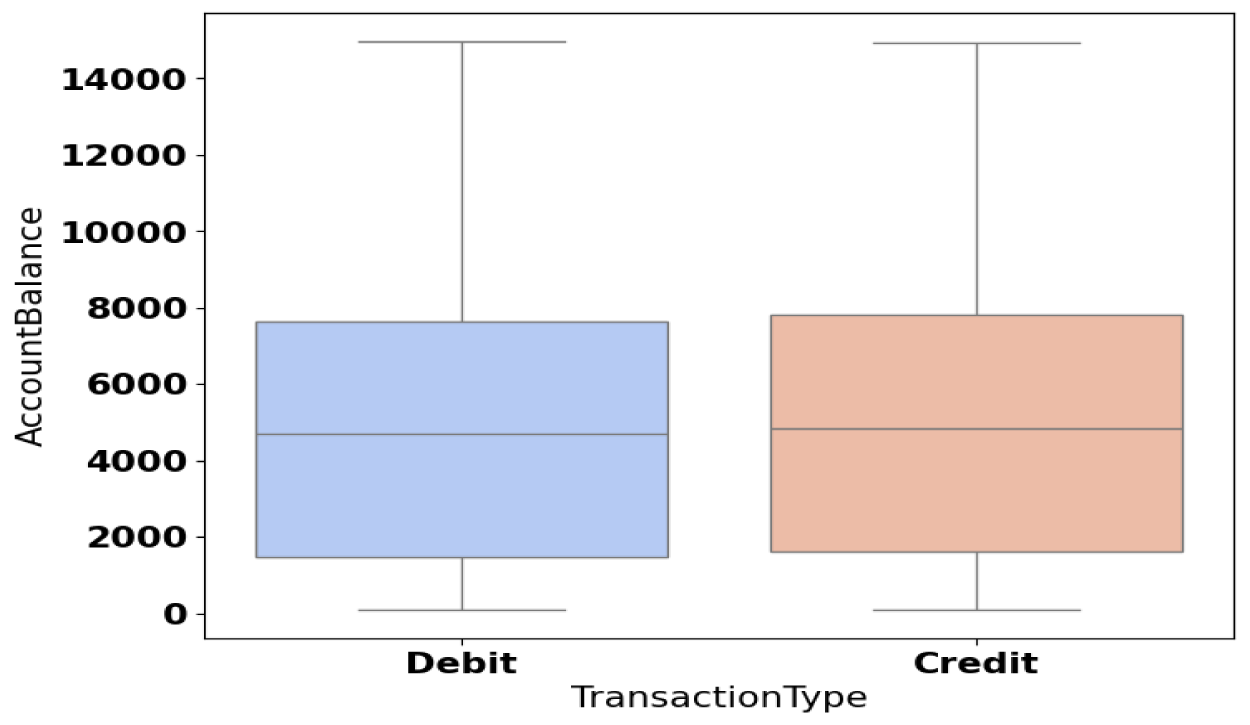
Account balance by transaction type.
Figure 10 illustrates spending disparities by visualizing transaction amounts for both credit and debit types. Transaction types are represented on the x-axis, while transaction values between 0 and 2000 are displayed on the y-axis. The distribution of debit transactions (blue, left) is wider, with a dense clustering between 0 and 750 and an extension up to about 1900. On the other hand, the distribution of credit transactions (orange, right) is more concentrated, with most values falling between 0 and 500, and fewer examples exceeding 1500. This variance suggests that larger amounts are typically involved in debit transactions, indicating distinct spending patterns. Different transaction patterns can be seen in the range of values; debit transactions are more variable, whereas credit transactions are more concentrated in smaller amounts, indicating more restrained spending.
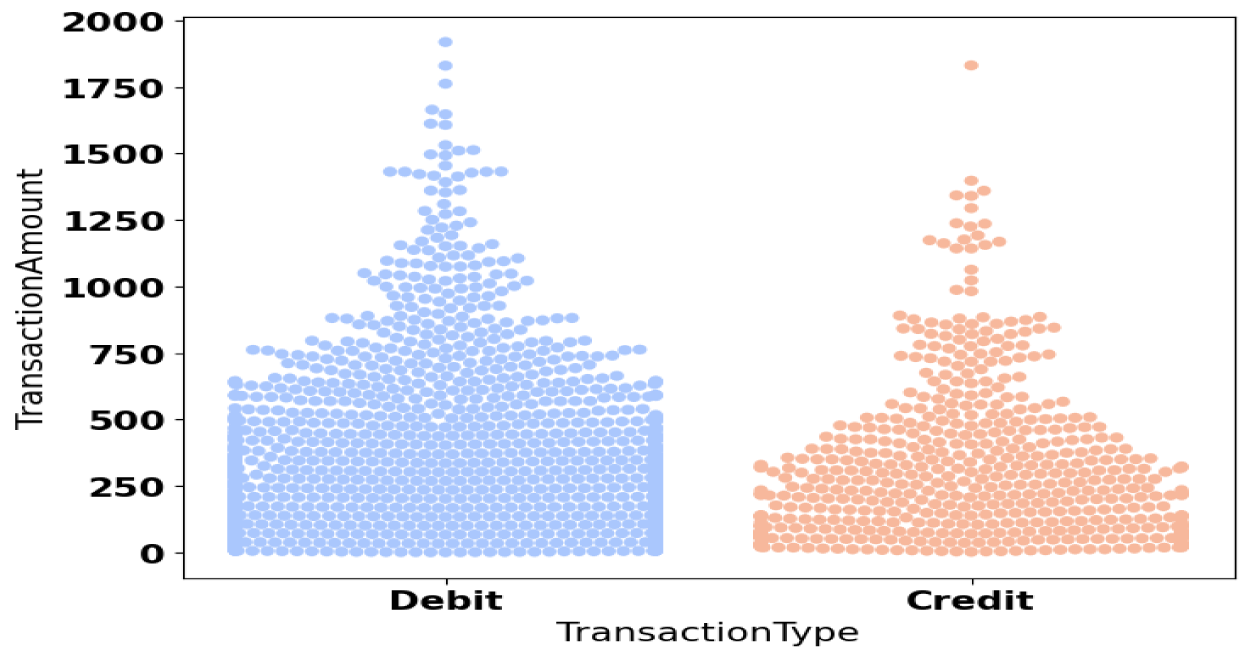
Transaction amount distribution by type.
For debit (blue) and credit (orange) transactions, Figure 11 shows the link between Transaction Amount (x-axis: 0–2000) and Account Balance (y-axis: 0–14000). With a larger density below 1000, debit transactions are more common and dispersed throughout the entire range. Credit transactions, on the other hand, are less frequent and mostly clustered below 750. Debit transactions account for the majority of higher transaction amounts, especially those over $1000. The greater concentration of account balances under $10,000 in both transaction types suggests that most users maintain reasonable balances. This graphic sheds light on spending patterns by showing that credit transactions are restricted to smaller sums, whilst debit transactions involve bigger amounts.
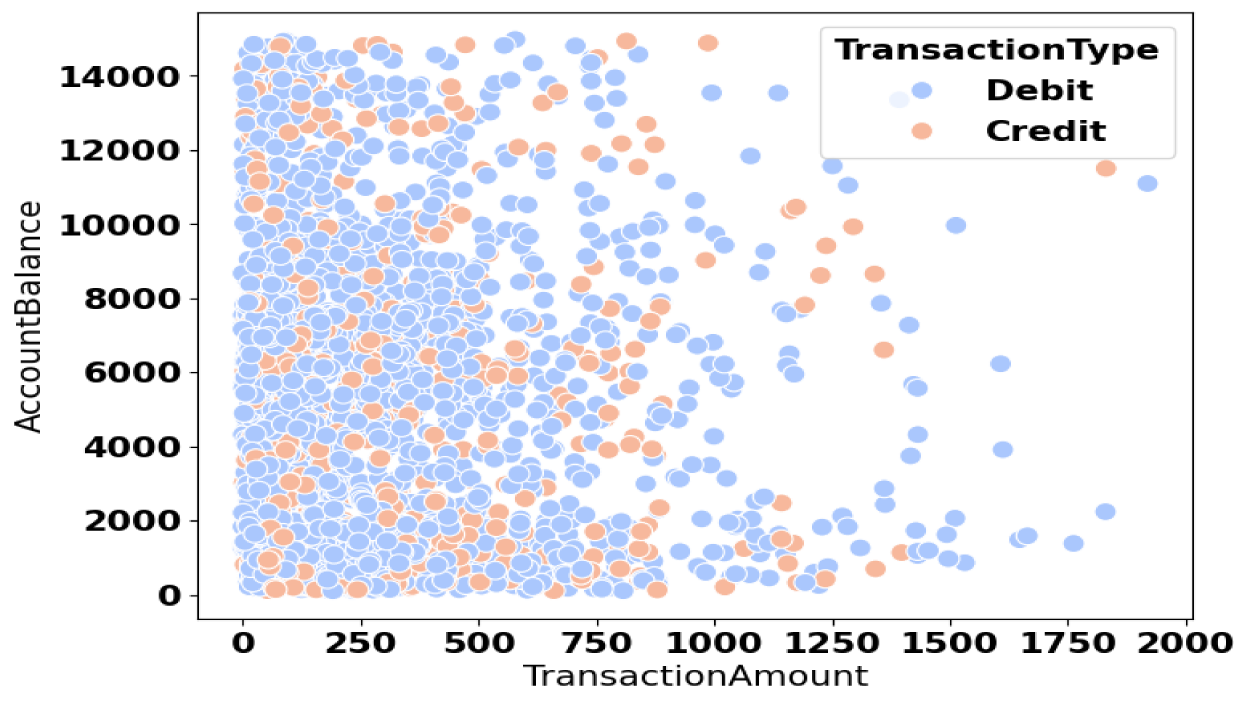
Account balance vs. Transaction Amount by Type.
‘Transaction Amount’ and ‘Account Balance’ for ‘Credit’ and ‘Debit’ transactions are contrasted in Figure 12. The ‘Transaction Amount’ (blue) for ‘Credit’ transactions is minimal, at approximately $200, although the ‘Account Balance’ (red) is significantly larger, at almost $5400. The bar's overall height is roughly 5600. The ‘Transaction Amount’ (blue) and ‘Account Balance’ (red) for ‘Debit’ transactions are approximately 200 and 4,800, respectively. The entire height of the bar is roughly 5000. Overall, for both transaction types, the ‘Account Balance’ dominates the overall value, while the ‘Debit’ shows a slightly lower balance. For both “Credit” and “Debit” transactions, the “Transaction Amount” is constantly less than the “Account Balance.”
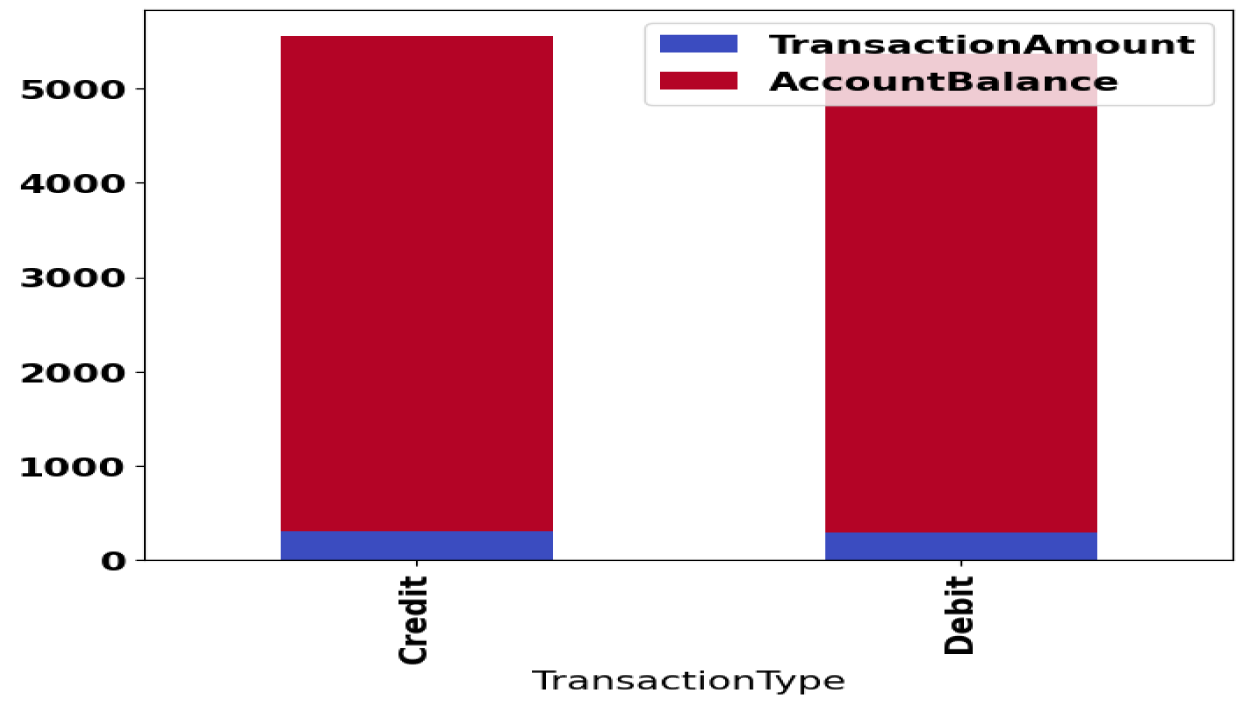
Stacked bar chart of transaction amount and account balance by transaction type.
Five financial features, Transaction Amount (0–2000), Customer Age (0–80), Transaction Duration (0–300), Login Attempts (0–5), and Account Balance (0–10000), are shown by scatter plots and histograms in Figure 13. Diagonal histograms show the distribution of every feature. The transaction amount and Account Balance show a positive association, suggesting that higher balances enable more transactions. There is no clear trend in the relationship between customer age and transaction amount across age groups. Although there are a few exceptions, most login attempts are minimal. There is little association between Transaction Duration and other parameters, and it varies greatly.
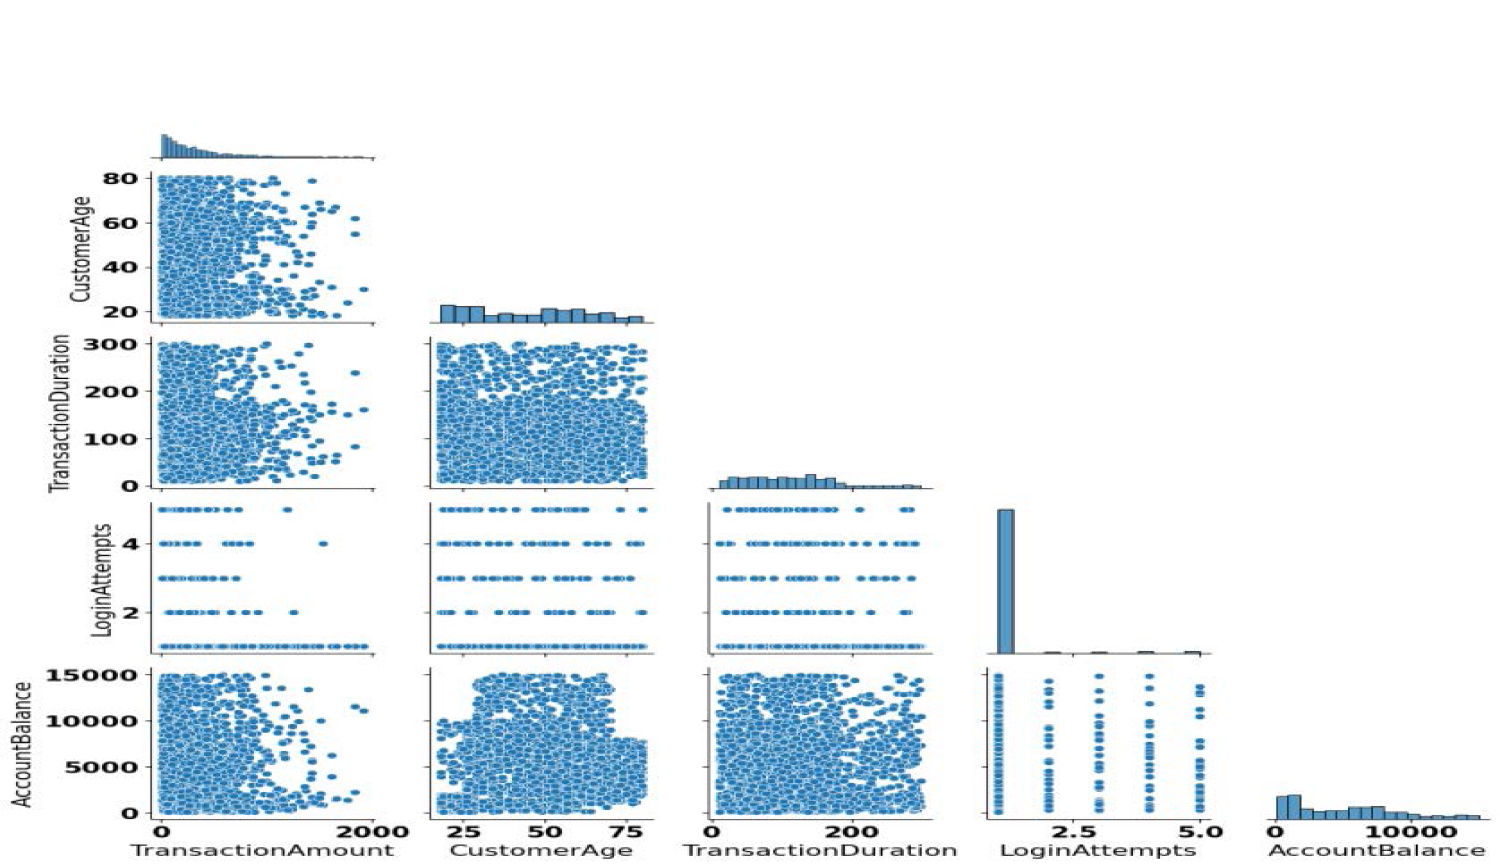
Pairwise relationships among transaction features.
Figure 14 shows a correlation matrix between five variables: ‘Transaction Amount’, ‘Customer Age’, ‘Transaction Duration’, ‘Login Attempts’, and ‘Account Balance’. The color gradient ranges from blue to red, with values displayed in each cell. ‘Transaction Amount’ has a weak negative correlation with ‘Customer Age’ and ‘Account Balance’, while ‘Customer Age’ has a moderate positive correlation with ‘Account Balance’. ‘Transaction Duration’ has weak correlations across all variables. ‘Login Attempts’ has negligible correlations.
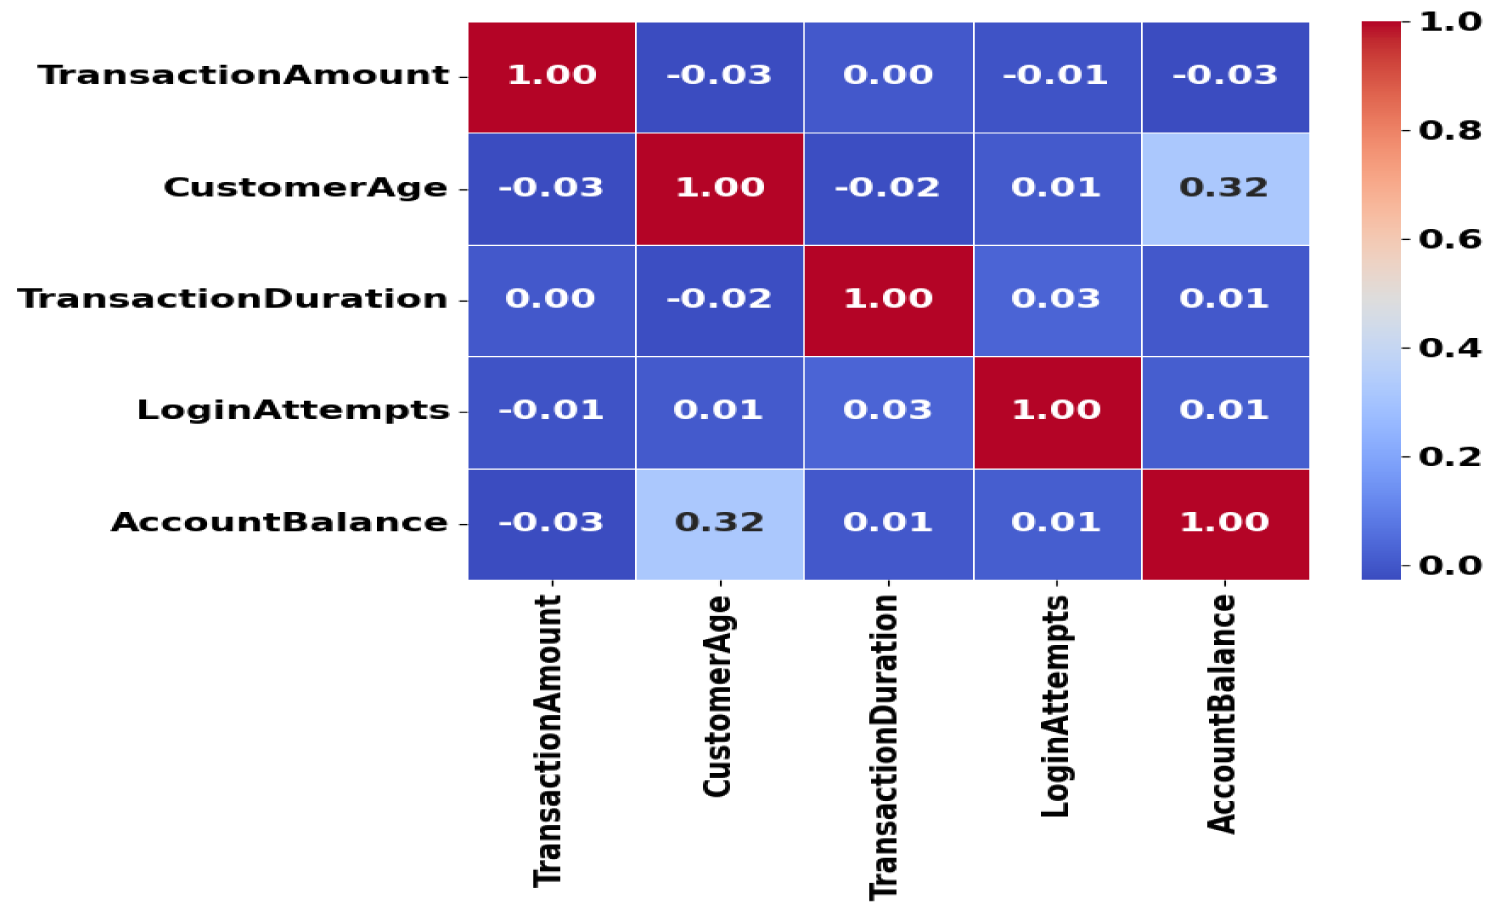
Correlation matrix of transaction data.
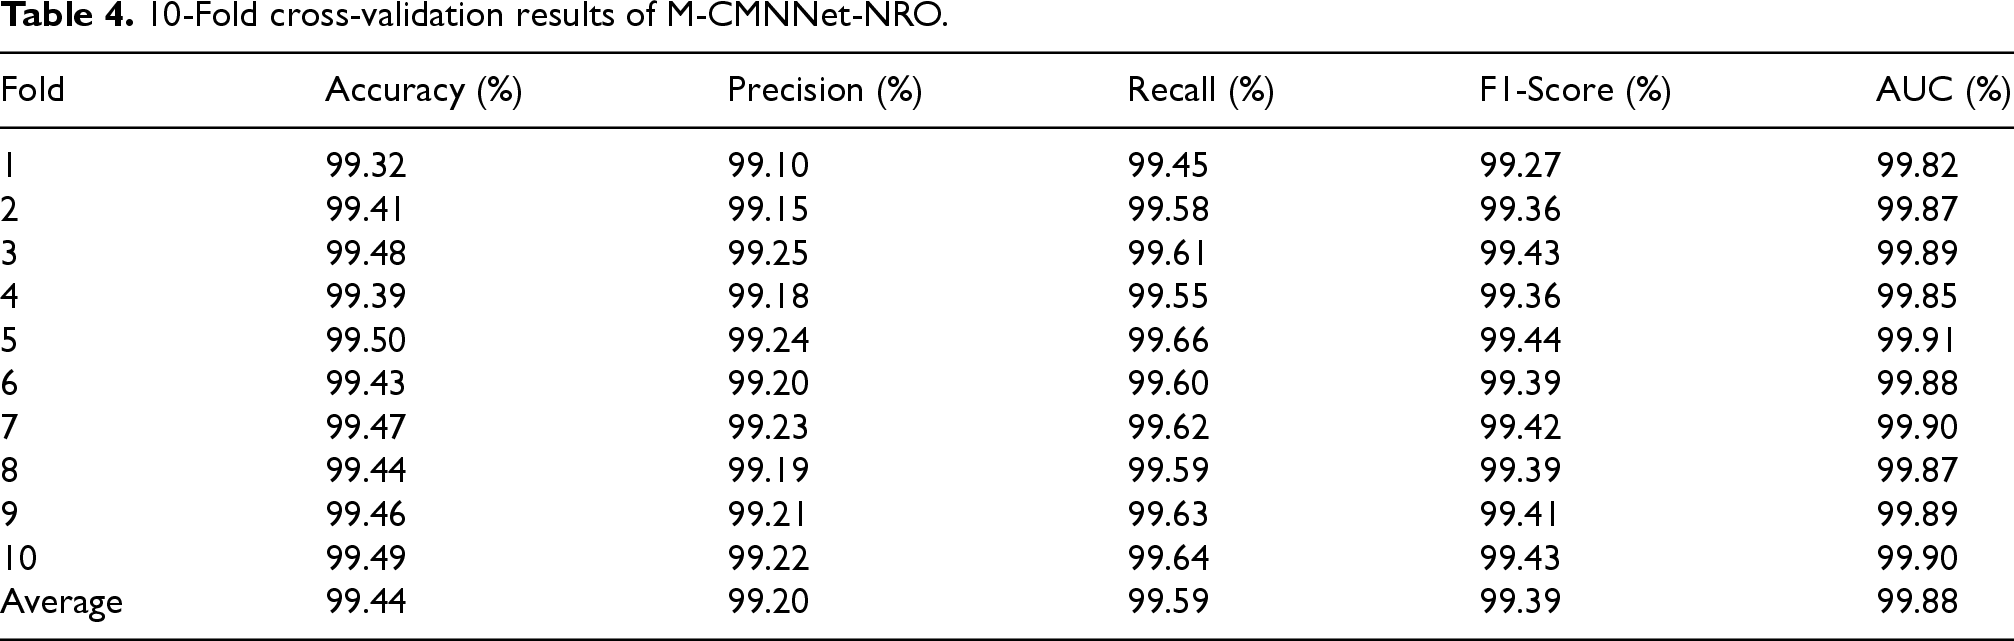
To further confirm the generalizability of the suggested M-CMNNet-NRO model, a 10-fold cross-validation was conducted on the Banking Fraud Detection dataset. The dataset was divided into ten identical subsets during this process; in every iteration, nine folds were used for training, while the remaining fold was used for testing. The process was repeated ten times, and the results were averaged over folds. This approach reduces bias from random partitioning and provides a more accurate estimation of model stability.
As indicated in Table 4, the model in this work performed consistently well on all folds with an average accuracy of 99.44%, a recall of 99.59%, and an AUC of 99.88%. Low fold variation indicates the robustness and stability of the model. The high recall suggests that false positives were detected with fewer false negatives, and the high precision validates the minimization of false alarms. Generally, the cross-validation results support the consistency of M-CMNNet-NRO in real-time fraud detection for IoT-based banking systems.
10-Fold cross-validation results of M-CMNNet-NRO.
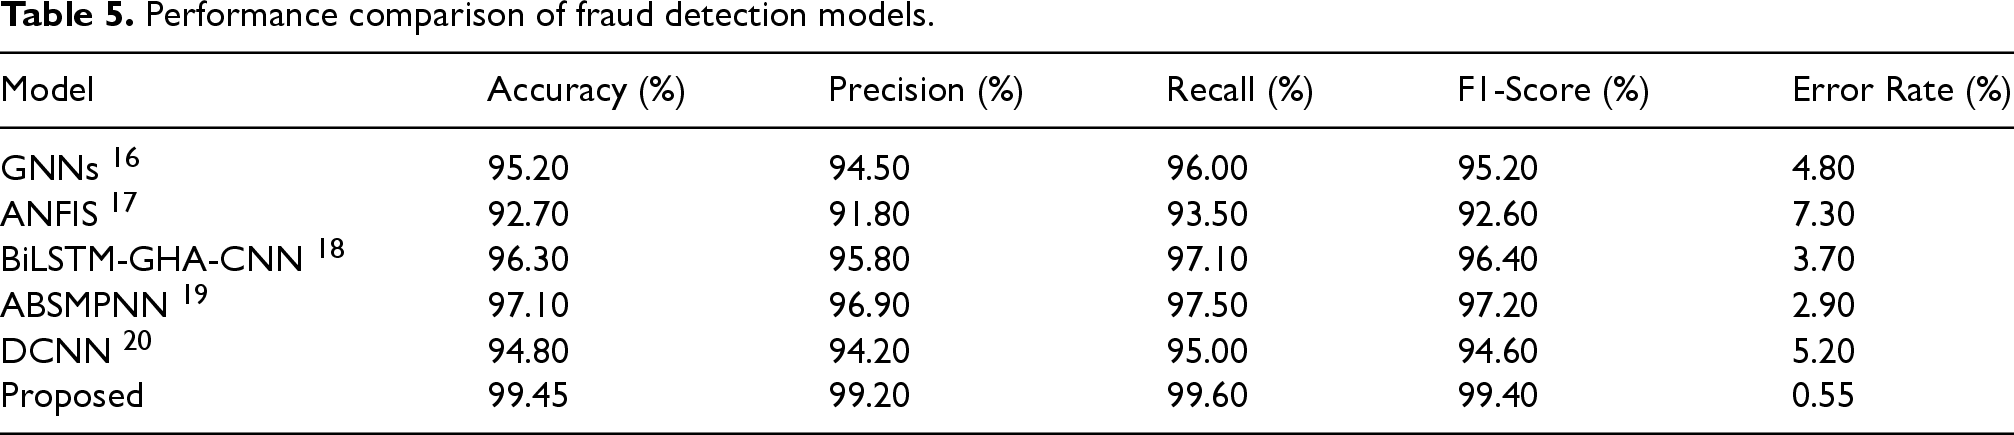
The performance of the proposed M-CMNNet-NRO architecture for attack detection in the Banking Fraud Detection Dataset is assessed using the following metrics: accuracy, precision, recall, F1-score, AUC, FPR, error rate, and processing time. To compare the efficiency in detecting financial fraud, the following methods are used: GNNs, 16 ANFIS, 17 BiLSTM-GHA-CNN, 18 ABSMPNN, 19 and DCNN. 20 By considering metrics such as precision, recall, and F1 score, the performance comparison can rely on the capacity to identify models for classifying fraudulent transactions profitably and systematically. Additionally, model performance and its reliability in ensuring real-life decision-making are evaluated based on the AUC, FPR, and the model's error rate. The time taken to process the models defines the operating performance of the models.
In Table 5, the performance of several models in the Fraud Detection Dataset is compared based on the following parameters. Hence, the proposed model achieves 99.45% accuracy, 99.20% precision, 99.60% recall, and 99.40% F1-score, outperforming all other models in terms of accuracy. This means that the model achieves an outstanding balance between precision and recall, and as a result, it performs well enough in predicting ‘fraud’. It also has the lowest misclassification rate of the lot, with a mere 0.55% error rate. However, in the BiLSTM-GHA-CNN model, the error rate is 3.70% with 95% confidence, and it achieves an accuracy of 96.30%, precision of 95.80%, recall of 97.10%, and F1-score of 96.40%. In terms of accuracy and error rate, the best-performing model is ABSMPNN, with an accuracy of 97.10% and an error rate of 2.90%. Therefore, based on the suggested approach, it is possible to set up new standards for fraud detection.
Performance comparison of fraud detection models.
Performance comparison of fraud detection models.
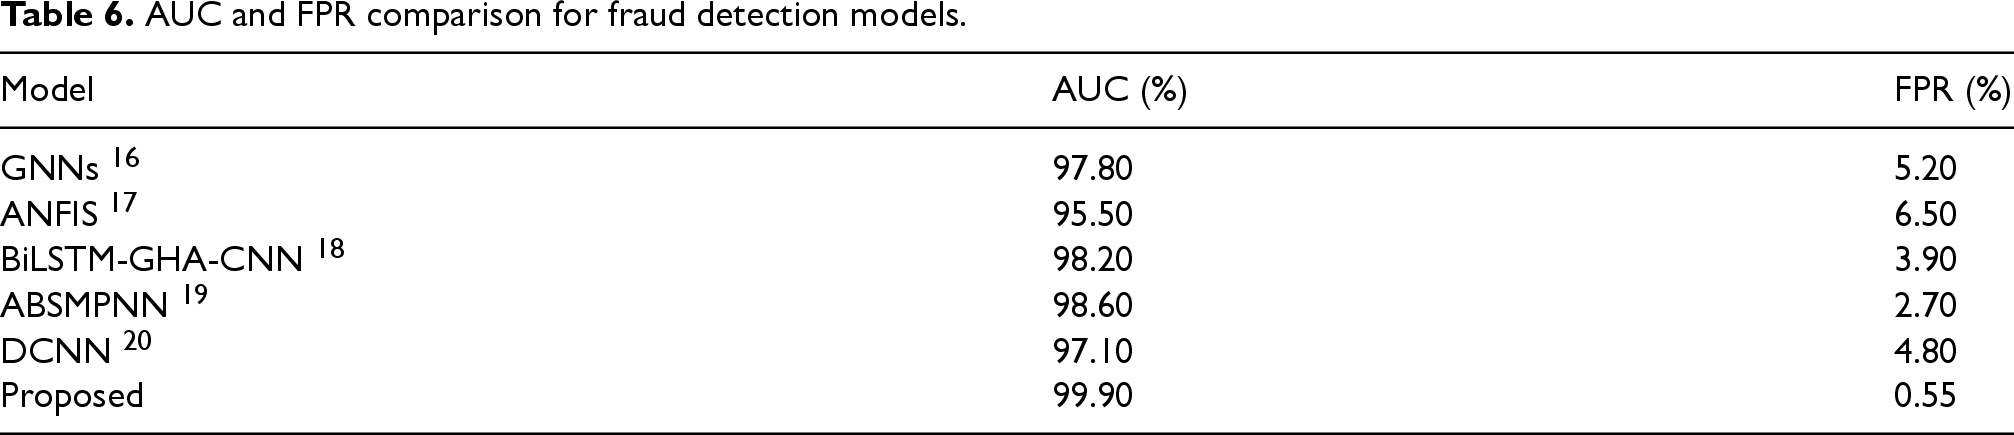
Table 6 presents the FPR, as well as the AUC, of various models for banking fraud detection. Thus, the suggested model exhibits a high accuracy in terms of AUC, with a value of 99.90%. This level of AUC highlights the model's ability to distinguish between fraudulent and non-fraudulent transactions. It also indicates the lowest FPR of 0.55%, which is crucial for minimizing the number of legal purchases marked as fraudulent ones. ABSMPNN has been found to perform better than BiLSTM-GHA-CNN, achieving a 98.60% AUC with a 2.70% FPR. The superior ability to identify instances of fraud is evident in the outcome of the GNN model, with an AUC of 97.80% and a FPR of 5.20%.
AUC and FPR comparison for fraud detection models.
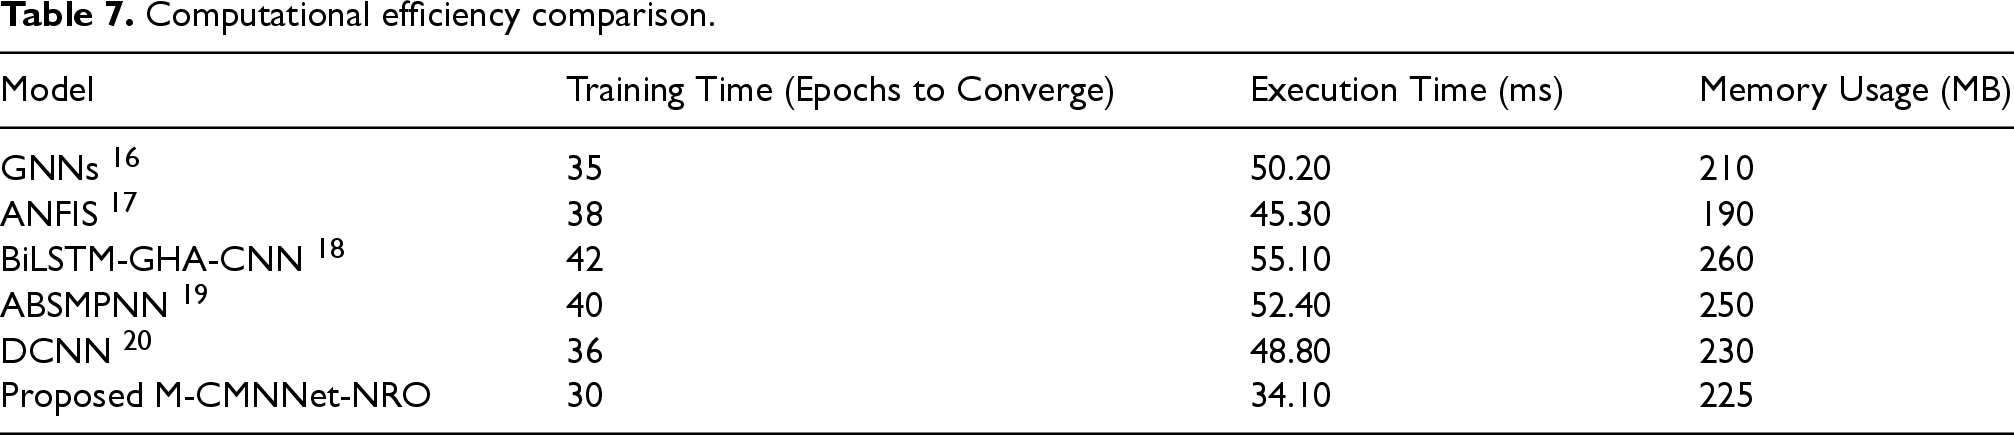
The time taken in milliseconds for several of the models used in banking fraud detection is shown in Table 7. The proposed approach achieves the fastest processing time, as shown in Column 2, with 34.10 ms, ensuring the execution of the algorithm without time delay for real-time fraud detection. In comparison with other algorithms, the maximum execution time of 55.10 ms for BI-LSTM-GHA-CNN therefore suggests higher computational complexity. With ABSMPNN, it takes 52.40 ms while the GNN model took only 50.20 ms. With an execution time of 48.80 ms, the DCNN model outperforms the proposed model but falls short of ABSMPNN. The M-CMNNet-NRO model achieves the fastest execution time (34.10 ms) and requires the fewest training epochs (30) to converge. Although it has a slightly higher parameter count than simpler models like ANFIS or DCNN, its efficient weight optimization through NRO and structured feature handling via GAT leads to lower runtime and memory consumption. This demonstrates that the model's high detection accuracy does not come at the cost of impractically high computational overhead, making it highly viable for deployment in real-time, resource-constrained banking environments.
Computational efficiency comparison.
To compare the effectiveness of the proposed approach in fraud detection and prevention with that of GNNs, ANFIS, BiLSTM-GHA-CNN, ABSMPNN, and DCNN, a statistical test was performed. The percentage of variation explained for each model was evaluated using its R-squared (R2) values. Model complexity was taken into consideration by using adjusted R2. The regression models’ ability to explain the variation in fraud detection results was assessed using ANOVA, and model fit was verified using F-tests. The regression coefficients indicate how various factors influence the detection of fraud. With p-values less than 0.05 indicating substantial performance differences amongst the models, the models were assessed for statistical significance.
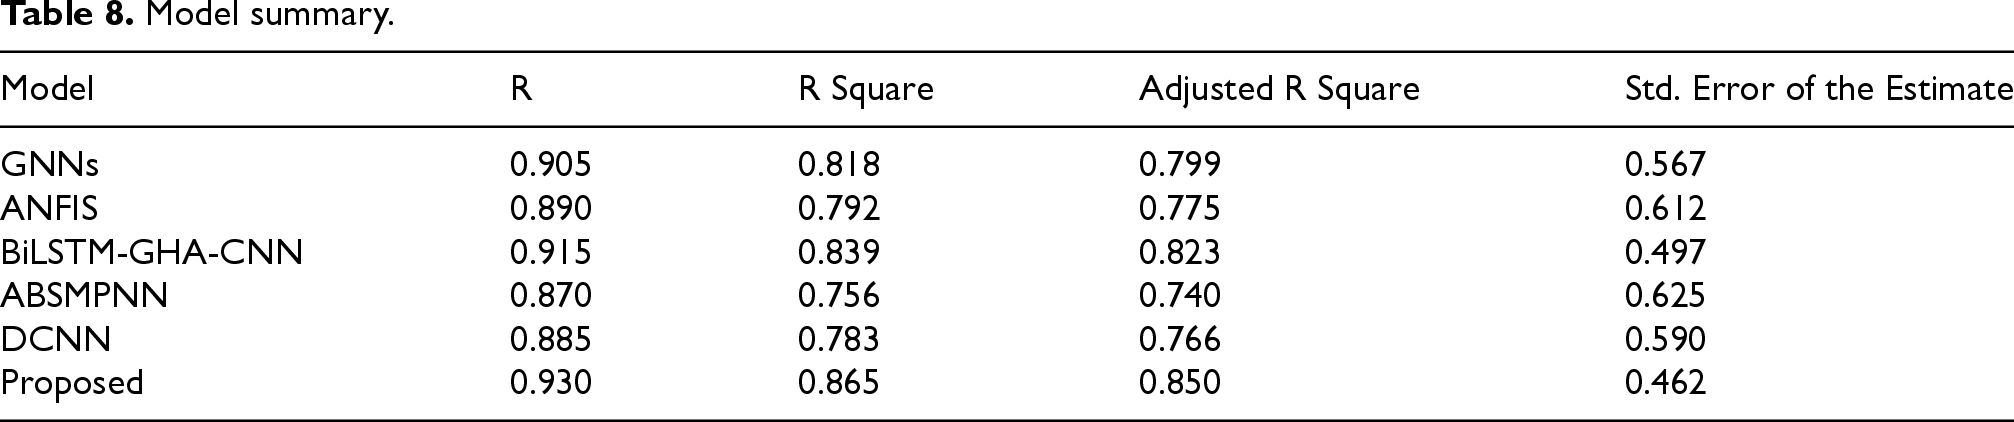
A Model Summary is presented in Table 8, where the performance of each model is evaluated using R-squared (R2), Adjusted R-squared, and the Standard Error of Estimate. The Proposed model has the highest R2 (0.865), indicating that it explains 86.5% of the variance in fraud detection results. R2 shows the percentage of variance explained by each model. In comparison to other models, the proposed model has the lowest standard error of estimate (0.462), indicating superior prediction accuracy.
Model summary.
Model summary.
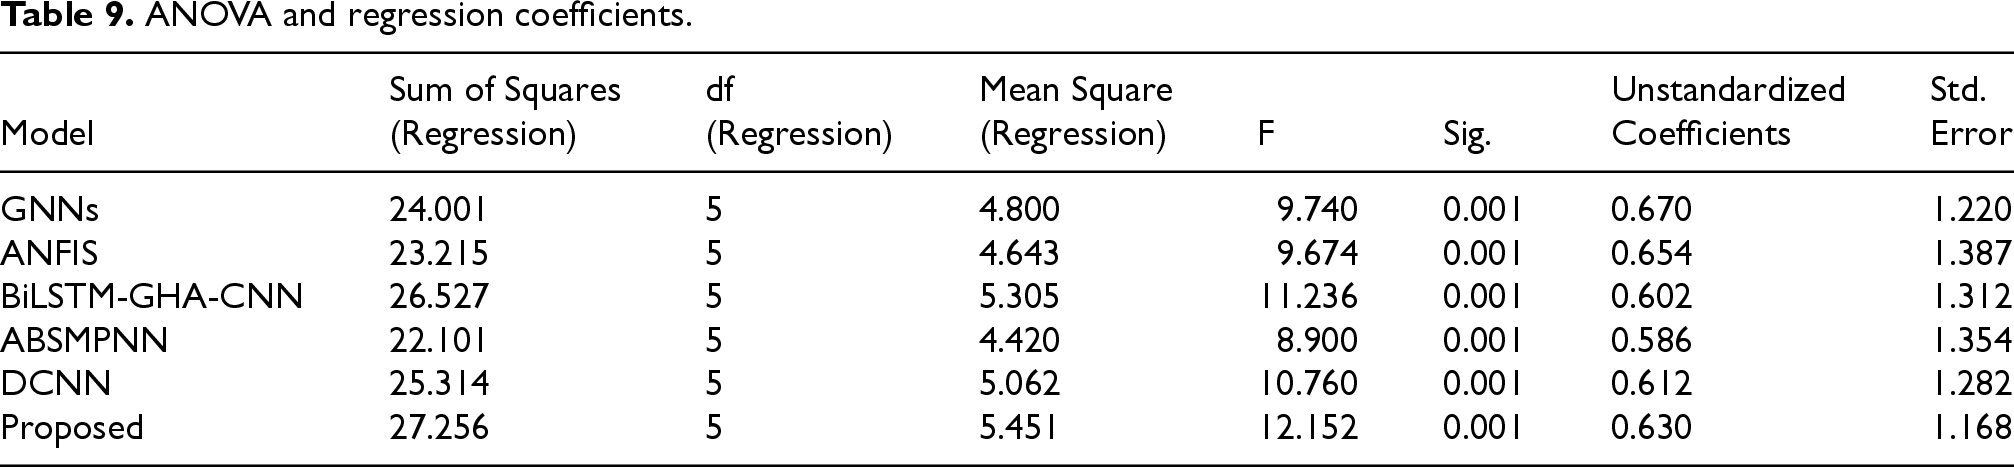
The ANOVA results and regression coefficients are shown in Table 9. When the p-value is less than 0.05, the ANOVA indicates that all models are statistically significant. The regression coefficients demonstrate the impact of each model's features on preventing fraud. The proposed model outperforms the others, as indicated by the highest regression strength and statistical significance.
ANOVA and regression coefficients.
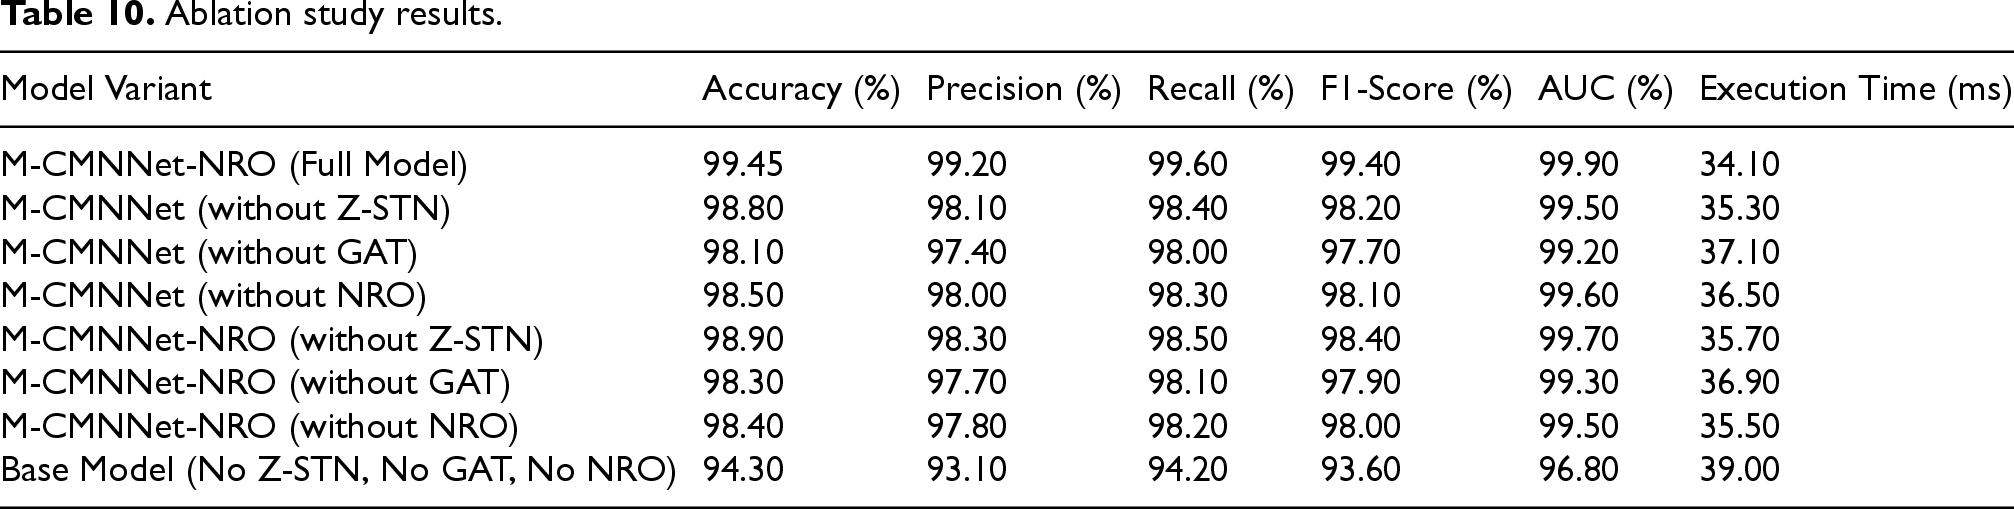
In this ablation study, we examine the performance of the proposed M-CMNNet-NRO model for detecting attacks in IoT-based banking systems. This study evaluates the contribution of four main components:
The findings of an ablation investigation on the M-CMNNet-NRO model for attack detection in IoT-based financial systems are shown in Table 10. With an execution time of 34.10 ms, the entire model (M-CMNNet-NRO) performs best, achieving 99.45% accuracy, 99.20% precision, 99.60% recall, 99.40% F1-Score, and 99.90% AUC. Accuracy decreases to 98.10% without GAT and to 98.80% when Z-STN is excluded. The accuracy drops to 98.50% when NRO is removed, demonstrating the impact of its optimization. The Base Model (without any component) performs the lowest with 94.30% accuracy, while the M-CMNNet-NRO (without Z-STN) variant has 98.90% accuracy. All things considered, each element greatly improves the model's performance.
Ablation study results.
Ablation study results.
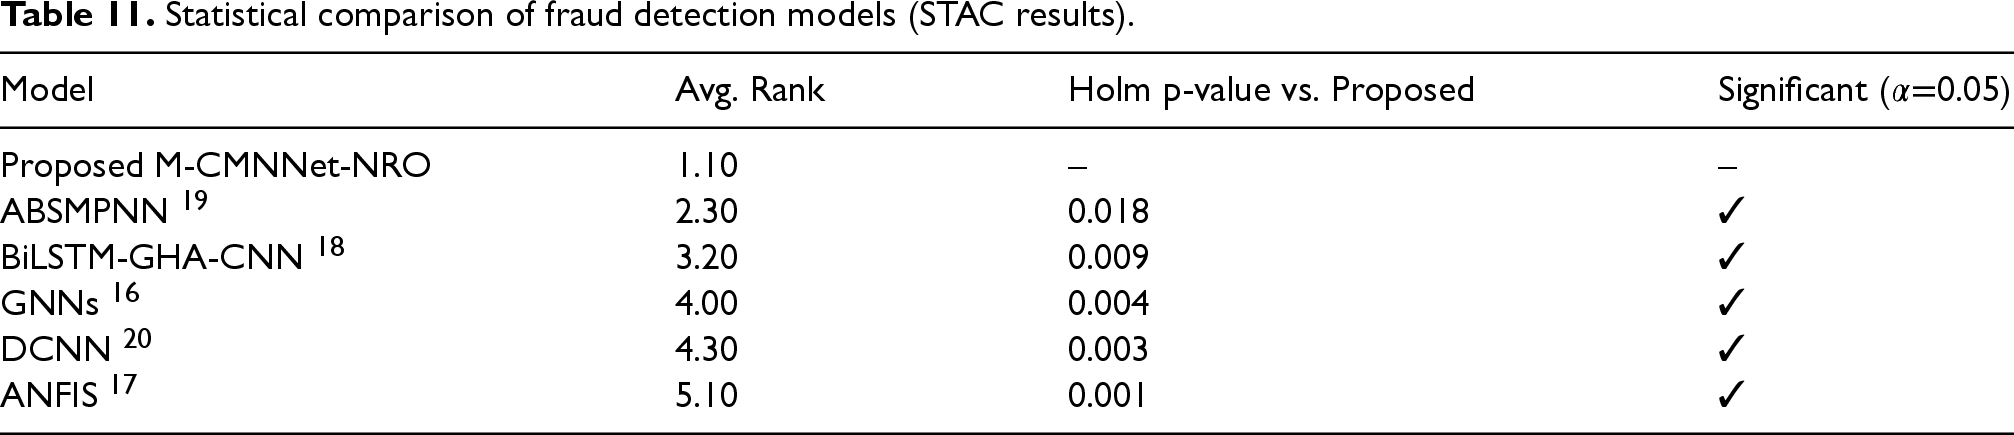
Raw performance metrics, such as accuracy, precision, recall, F1-score, and AUC, provide insight into the relative merits of fraud detection models. However, they are not enough to determine whether model differences are statistically significant. In the current work, the comparison was continued by conducting appropriate statistical tests to substantiate the superiority of the proposed M-CMNNet-NRO model.
The Statistical Tests for Algorithms Comparison (STAC) platform (https://tec.citius.usc.es/stac) was used to examine the experimental results from multiple runs and datasets. STAC accommodates more advanced statistical methods, such as the Friedman test, for identifying overall differences between several classifiers. This is followed by post-hoc pairwise tests (e.g., Nemenyi or Holm correction) to determine which models are significantly different.
For this experiment, the fold-wise values of performance on folds in 10-fold cross-validation were provided to STAC to compare M-CMNNet-NRO with GNNs, ANFIS, BiLSTM-GHA-CNN, ABSMPNN, and DCNN. The Friedman test established a statistically significant difference (p < 0.05) between the methods under study. Post-hoc tests confirmed that M-CMNNet-NRO performed better than all baseline methods, with statistically significant margins, particularly in terms of accuracy, recall, and AUC.
These findings in Table 11 verify that the improvements observed in M-CMNNet-NRO are not the result of random fluctuations but are a statistically significant enhancement in banking fraud detection based on IoT.
Statistical comparison of fraud detection models (STAC results).
Statistical comparison of fraud detection models (STAC results).
A comparative analysis of the M-CMNNet-NRO architecture with other models reveals its superior performance in detecting banking fraud. The experimental results of the proposed model have shown a better performance with an accuracy of 99.45% % and the specificity, the sensitivity, the F-measure, and the AUC of 99.20%, 99.60%, 99.40%, and 99.90% % respectively, in comparison to other techniques like GNNs 16 with an accuracy rate of 92.70–97.10. Similarly, it is also fairly fast (34.10 ms) in execution, making it suitable for real-time applications. It also highlights the importance of each component when it is removed from the study. Thus, the overall model, M-CMNNet-NRO, achieved the best diagnostic accuracy in all aspects. The removal of any of these components, including Z-STN, GAT, and NRO, lowered the level of accuracy value as well as precision and recall. For example, excluding the GAT, they achieved an accuracy of 98.10%, and in the case of excluding NRO, they obtained 98.50%. These results support the importance of each module in improving the suggested model's ability to detect attacks in IoT-based banking systems.
Although the suggested M-CMNNet-NRO model incorporates computationally advanced elements, such as the Geometric Algebra Transformer (GAT) and Newton-Raphson Optimizer (NRO), its general architecture is structured to trade performance for efficiency. GAT enhances feature representation by understanding geometric relations, and NRO accelerates convergence through second-order optimization, both of which ensure high detection precision. Although complex, the model achieves a realistic execution time of only 34.10 ms, as shown in Table 5, demonstrating its suitability for real-time use. This explains that the suggested system attains better fraud detection accuracy without necessitating excessive computational burden, rendering it deployable for IoT-based banking systems with average resource availability.
The suggested M-CMNNet-NRO model primarily utilizes Zero-shot Text Normalization (Z-STN) to normalize and organize textual logs and messages generated by IoT devices, such as system notifications, transaction logs, and communication metadata. The architecture of the model is not restricted to text data. Following Z-STN, the Geometric Algebra Transformer (GAT) handles structured numerical data, as well as intricate multivariate features such as network packet statistics, sensor measurements, and transactional metadata, enabling the holistic extraction of features across multiple data modalities. This tiered strategy provides the model with flexibility in handling a variety of IoT data types commonly found in banking systems, making it more robust and ubiquitous in detecting a range of cyber threats.
Although this study aims to validate the effectiveness of the M-CMNNet-NRO model in identifying a broad spectrum of attack patterns in IoT-based banking systems, future extensions will include exhaustive testing with adversarial examples and evasion attacks. The modularity of the model, particularly the deployment of the Geometric Algebra Transformer (GAT) and the Multi-instance Coupled Modular Neural Network (M-CMNNet), provides a solid foundation for flexibility and robustness. These elements are optimally suited to combine adversarial training techniques and anomaly-aware mechanisms. Adding adversarial robustness testing in subsequent work will serve to further establish the reliability of the model in real-world, high-risk settings where attackers can intentionally attempt to evade detection systems.
Apart from attaining state-of-the-art detection performance, the current work also addresses the interpretability challenge found in modular and deep neural network architectures. As M-CMNNet-NRO is a very complex architecture, it has the potential to be used as a “black box,” which is undesirable in banking, where auditability, compliance with regulatory systems, and transparency are required. To mitigate this, the current work combines attention mechanisms in the Multi-instance Attention Network and prototype-based learning in the Coupled Modular Neural Network. These bring partial interpretability through pointing out influential sub-instances and class prototypes that support the ultimate decision. Though not a complete solution, this design is a step in the direction of explainability over traditional deep learning models, thus aligning the suggested framework closer to the transparency requirements of financial institutions.
Conclusion
The developed Multi-instance Coupled Modular Neural Network with Newton-Raphson Optimizer (M-CMNNet-NRO) was also employed to detect attacks in IoT-based banking systems with a success rate of 99.45% accuracy, precision of 99.20%, recall of 99.60%, and F1-score of 99.40%. The model also performs better than the others, with the least error reaching 0.55%. The AUC is 0.9990, and the FPR is 0.55%. This makes it suitable for real-time detection as it takes 34.10 ms to execute. One advantage that must be mentioned is that it addresses loopholes in large-scale and highly dynamic IoT data, while still achieving high accuracy rates. The addition of the Newton-Raphson-based optimizer brings the benefit of faster convergence and improved solutions in the model.
Nevertheless, its complexity may be high and depend on data distribution, and the performance can be affected by extreme imbalance or unknown attack types. It is also expected that the method may encounter difficulties in applying and reproducing for a large number of different IoT devices with varying kinds and measured amounts of data. Further research can be oriented towards extending the approaches, allowing for the detection of various types of attacks and improving the system's adaptability to large-scale IoT networks.
Footnotes
Funding
The authors received no financial support for the research, authorship, and/or publication of this article.
Declaration of conflicting interests
The authors declared no potential conflicts of interest with respect to the research, authorship, and/or publication of this article.