
Abstract
This research work introduces a hybrid AI model comprising XGBoost for static prediction, LSTM networks for temporal forecasting, and SHAP for interpretable explainability. One of the major public health issues is retention in childhood malnutrition, especially in preschool children, which greatly impacts their growth, cognitive development and health conditions later in life. The conventional methods, based on descriptive statistical analysis and basic machine learning approaches, mainly utilise static predictors to classify malnutrition cases. Such practices tend to overlook the changes over time and do not offer any explanation, leading to their limited applications in preventive measure interactions. The model not only considers the current nutritional status but also predicts future trends by identifying important demographic and dietary components that underlie the predictions. The AI framework suggested produced 98.86% accuracy, AUC = 0.991, and RMSE = 0.082 when validated on CHNS data, which was significantly greater than the performance of Logistic Model Trees (91–95%) and Random Forests (94–98.6%), resulting in up to a 4.1% improvement. It thus confirmed the model's outstanding predictive capability. In contrast to previous works that were merely concerned with malnutrition type or anaemia classification, the present approach guarantees both accuracy and usability by integrating temporal prediction with Explainable AI. Consequently, the integration of predictive modelling with practical policy implications enables the early identification of children at risk and the implementation of targeted interventions, thereby providing a scalable and evidence-based contribution to childhood nutrition research. The combined model achieved an accuracy of 98.86%, an F1 score of 0.988, and an AUC of 0.991, which are extremely high values for predicting and highlighting the practicality of early detection and intervention in childhood malnutrition.
Introduction
Child malnutrition remains an urgent global health issue, especially among preschool children, whose rapid physical and mental development render them most susceptible. 1 Insufficient intake of essential nutrients may cause stunting, wasting, and micronutrient deficiencies, which not only hinder growth in the short term but also have a long-term negative impact on children's academic performance, immune system, and overall health. 2 Several nutrition campaigns may be in place; however, it is usually the scarcity of resources, siloed data, and the absence of predictive methods that can estimate an individual child's nutrition needs over time that hinder the early detection of children at risk. 3
Nutrition during early childhood is a main contributor to integrated development. 4 Adequate nutrient intake not only helps the brain but also promotes the individual's overall personal development, i.e., emotional regulation, socialising and physical activity; however, a lack of nutrients can lead to the opposite situation; a child's brain will be underdeveloped and the child will also be more prone to the diseases of the adult world. 5 The preschool age, moreover, is the time when children have the fewest barriers to receiving interventions and the longest health inequalities can possibly be affected. 6 Health professionals and planners can identify which children will benefit most from nutrition interventions by viewing nutrition as a factor in children's growth patterns, thereby enabling not only the design but also the implementation of programs that facilitate equal health outcomes, ensure resource optimisation, and improve the community's health. 7
Pioneering studies on children's dietary habits and nutrition have mainly relied on demographic or longitudinal statistical analyses, which primarily identify population-level trends but do not illustrate individualised risk trajectories. 8 Such methods are not able to clarify the complexity of interactions among dietary intake, socioeconomic factors, and demographic variables. 9 Furthermore, the majority of studies conducted to date do not provide future nutritional scenarios, thereby limiting their usefulness for higher-level intervention planning. 10 , 11 The mentioned gaps indicate the need for sophisticated predictive models that can integrate both static and temporal data, thus allowing precise detection of at-risk children and supporting individualised intervention. 12
The application of Artificial Intelligence in the field of nutrition has gained attention through previous research, which pointed out the promising role of certain technological settings like ML models, portable sensors, and mobile food recognition systems, as well as others in the aforementioned areas. 13 The systematic review of AI in nutrition provided a close examination of machine learning and deep learning applications for dietary assessment, food identification, personalised nutrition, and disease prediction models. 14 Indeed, their outcomes showed that hybrid AI could handle intricate nutritional data so effectively that it would produce reliable diet tracking and apply evidence-based recommendations. 15 The use of AI in children's dentistry has been considered in connection with early childhood caries (ECC) by employing classifiers based on machine learning and deep learning models that operate on dental radiographs, intraoral images, and demographic and behavioural information. 16 As a result, it has been demonstrated that AI can accurately identify children at high risk, enable at-home screening with smartphone apps, and facilitate patient-specific preventive care plans. 17 An MHA-based deep learning model has been recommended for predicting child nutrition status, comparing the CNN-MHA and LSTM-MHA models on structured anthropometric data. 18 Results have confirmed CNN-MHA as the most accurate one (99.08%) and, through SHAP-based Explainable AI, the most transparent and clinically compliant in its predictions. 19 A systematic review has been conducted on the applicability of various machine learning algorithms for predicting and detecting early childhood caries (ECC) across six studies, which reported high accuracy, sensitivity, specificity, and AUC values. 20 The review emphasised that ML models can facilitate clinical decision-making and incorporate genetic considerations. 21
A systematic review on the use of AI in healthcare focused on women's health, evaluating its role in achieving the UN Sustainable Development Goals (SDGs) related to gender equality and sustainable health. 22 Their evidence showed that AI-based technologies remain underutilised in women's health, yet strategic deployment would enhance access to well-informed health decisions, especially in underrepresented populations. 23 Health and educational equity have been discussed through the lens of inter-professional collaboration between the education and health sectors. 24 Their research identified early childhood interventions in nutrition, access to healthcare, and early learning programs as crucial to enhancing cognitive and physical development. 25 The influence of management support on Saudi ambulance staff mental health outcomes has been examined using surveys and established measures such as the MBQ and the SWEMWBS. 19 The study's results indicated that positive manager behaviours were positively related to high-risk ambulance staff's better mental well-being. 26 A generic preference-based measurement (GPM) for children aged 2–4 years, known as HuPS, was developed by combining attributes from the HUI3 and the Preschool Children's Health Assessment Framework. 27
The NHDF was introduced as a framework to explore the multi-level determinants of nutrition-related health disparities, incorporating biological, behavioural, environmental, sociocultural, and healthcare system factors. 28 Research has highlighted how individual, interpersonal, community, and societal determinants influence diet quality and nutrient consumption. 29 The effect of extreme heat shocks on early childhood nutrition was examined using 15 rounds of cross-sectional data from five West African nations matched to geo-coded weather data. 30 The results proved that greater temperatures had a significant increase in the prevalence of chronic as well as acute malnutrition, where an increase in temperature by 2 °C was found to raise stunting by 7.4 percentage points. 31 The effect of food processing on children's cardiometabolic health was investigated using data from the Portuguese Generation XXI cohort, evaluating dietary consumption at age 7 and health outcomes at age 10. 32 Their results indicated that increased intake of unprocessed or minimally processed foods was correlated with reduced BMI. 33 Empirical literature on food insecurity (FI) and health outcomes in southern Africa was critically examined through the analysis of 14 publications that measured FI using heterogeneous instruments such as modified USDA Household Food Security Survey Modules. 34 Results were found to show that the prevalence of FI varied from 18% to 91% and was related to negative health outcomes such as hypertension, diabetes, anxiety, depression, and elevated HIV risk. 35 Using multicountry panel data from 31 sub-Saharan African nations between 2001 and 2018, the impact of food insecurity on infant mortality and life expectancy was investigated. 36 , 37 It was found that malnutrition had a negative impact on life expectancy and caused an increase in infant deaths; on the other hand, people with good nutrition had a longer life and lower infant mortality. 38 , 39
Earlier research indicates that AI and machine learning have the potential to improve nutritional forecasting and monitoring; however, the vast majority of efforts are still concentrated on basic data classification, which remains a static method. These models lack the capability to forecast over time and do not possess interpretable mechanisms that link the predictions to the factors that can be acted upon. The current study fills this void by presenting a hybrid architecture that combines XGBoost and LSTM for static and longitudinal modelling, with SHAP for explainability, thereby providing both predictive precision and interpretive clarity.
The original feature of the given study is that XGBoost will be used to obtain the static features of learning, LSTM will help to explain the trends in nutritional factors and socio-economic conditions causing malnutrition, and SHAP will support the interpretation of the results to gain a clear understanding of how the specified variables influence the risk of malnutrition.
Problem statement
Despite increased evidence on child health implications from nutrition, some difficulties yet hinder effective applications of AI-based strategies. The absence of strong predictive models capable of effectively managing heterogeneous datasets while minimising bias has been noted. 40 A mismatch has been identified between AI-based nutrition interventions and their actionable applications in pediatric clinics, schools, and communities. 41 The narrow inclusivity and limited generalizability of current models, particularly for disadvantaged and underrepresented groups, have been identified. 42 The lack of holistic, evidence-informed frameworks to guide the integration of AI-facilitated interventions into nutrition and health monitoring has been emphasised, limiting their scalability and contribution to early childhood well-being. 43
Primary contribution
Hybrid AI Framework Combines XGBoost for static/tabular predictions with LSTM networks for longitudinal modelling of nutritional trends.
Prediction of Health Outcomes Uses nutrition and demographic factors to predict health outcomes in preschool-aged children.
Temporal Modelling records variations in nutritional status across time and helps determine growth and health paths.
Explainable AI utilises SHAP for pinpointing the most influential aspects that affect child health outcomes.
Evidence-based interventions provide personalised nutrition strategies and thereby support actionable insights for the management of children's health during the early years.
Overcomes Limitations of Prior Studies by Introducing predictive analytics in conjunction with temporal modelling to get around the problems of heterogeneity, lack of interpretability, and limited long-term insight.
Structure of the paper
Materials and methods
The processing of the data is done through the CHNS dataset, which contains various variables, including nutrition intake, anthropometric, demographic, behavioural, and environmental data. The preprocessing stage will then address issues such as missing values, feature selection, and normalisation in order to acquire high-quality input data. After that, different AI methods are applied: XGBoost for forecasting static health outcomes, LSTM for longitudinal trend forecasting, and SHAP for interpretability and feature importance. The performance of the models is evaluated using standard metrics, including RMSE, MAE, F1-score, AUC, and accuracy, along with k-fold cross-validation to provide robustness and mitigate overfitting. Eventually, the results highlight the key nutritional factors that influence health outcomes in preschool children, thus making it easier to provide evidence-based, individualised nutrition interventions during the early years. The overall research approach adopted in this study is illustrated in Figure 1.
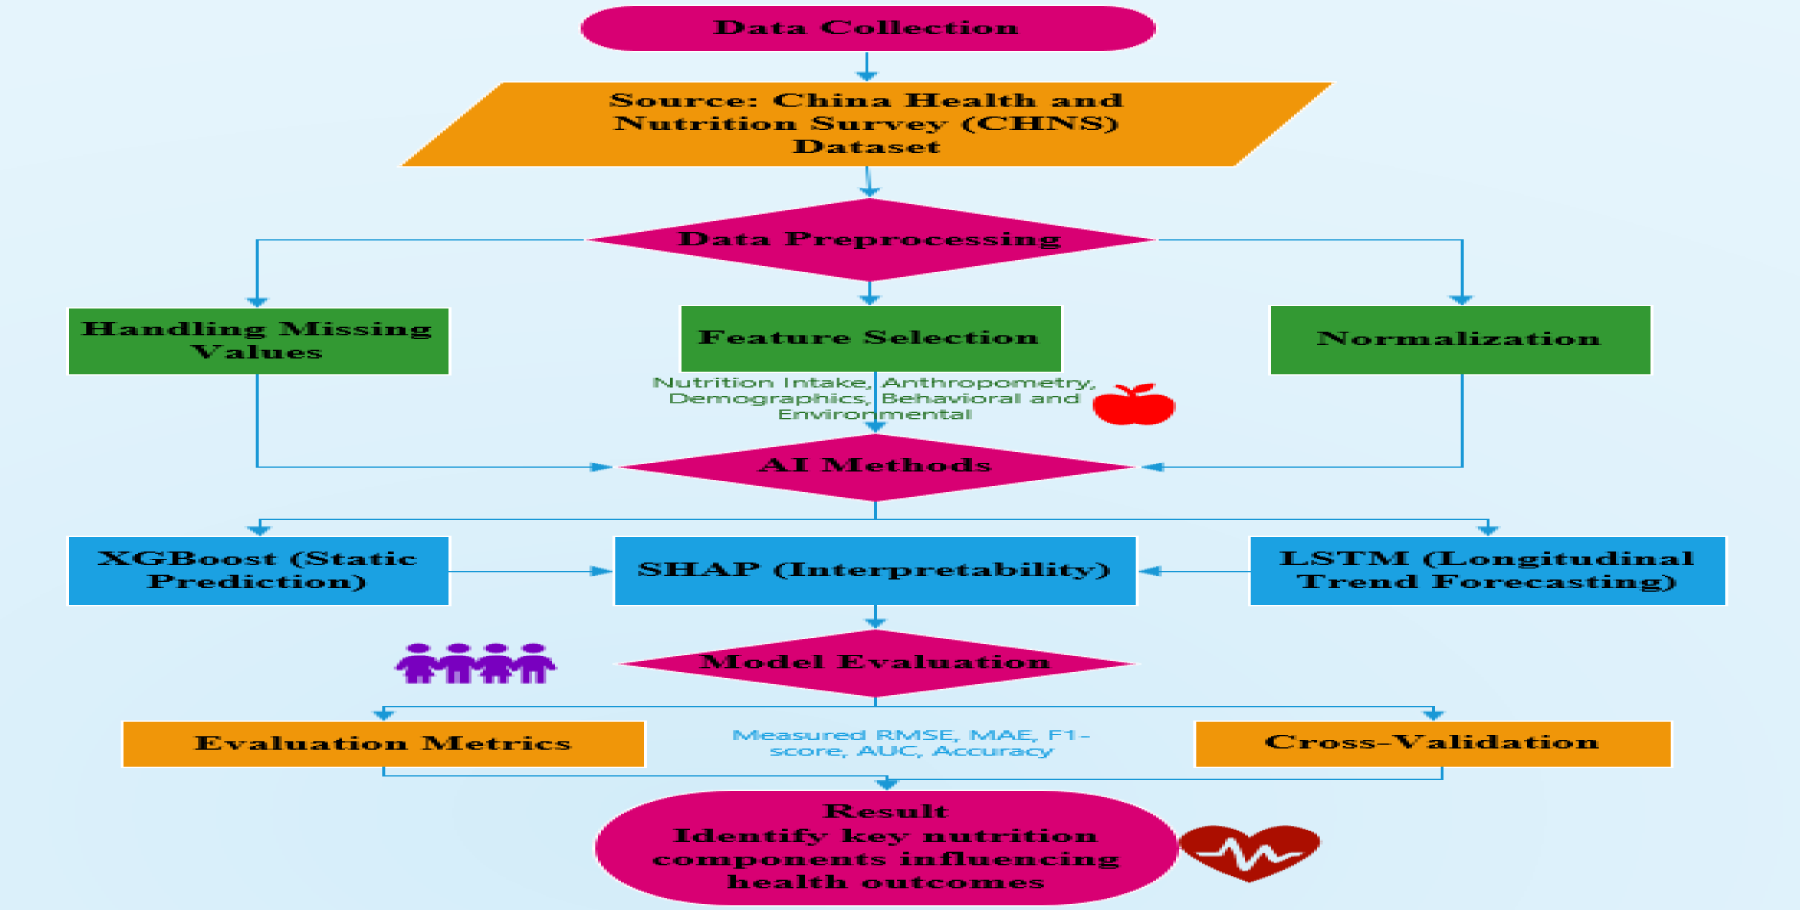
Research methodology framework for AI-driven early childhood nutrition intervention.
The examination draws data from the CHNS Dataset, a vast and long-term dataset that is also publicly accessible, which tracks health, nutrition, and demographic details for certain regions in China. The CHNS has been established to monitor the impact of social and economic changes on health and nutritional outcomes over time. The focus of this research was on preschool children (aged 3–6 years), and data from several waves of surveys were used to capture longitudinal trends. The last sample size of children comprises children from representative socio-economic and geographic backgrounds to make the analysis representative of a broad spectrum of nutritional and health states.
The CHNS 44 database is rich in variables dealing with childhood nutrition and health outcomes, such as:
Anthropometric data, including height, weight, BMI, stunting, and underweight, are among the other growth markers.
Data preprocessing
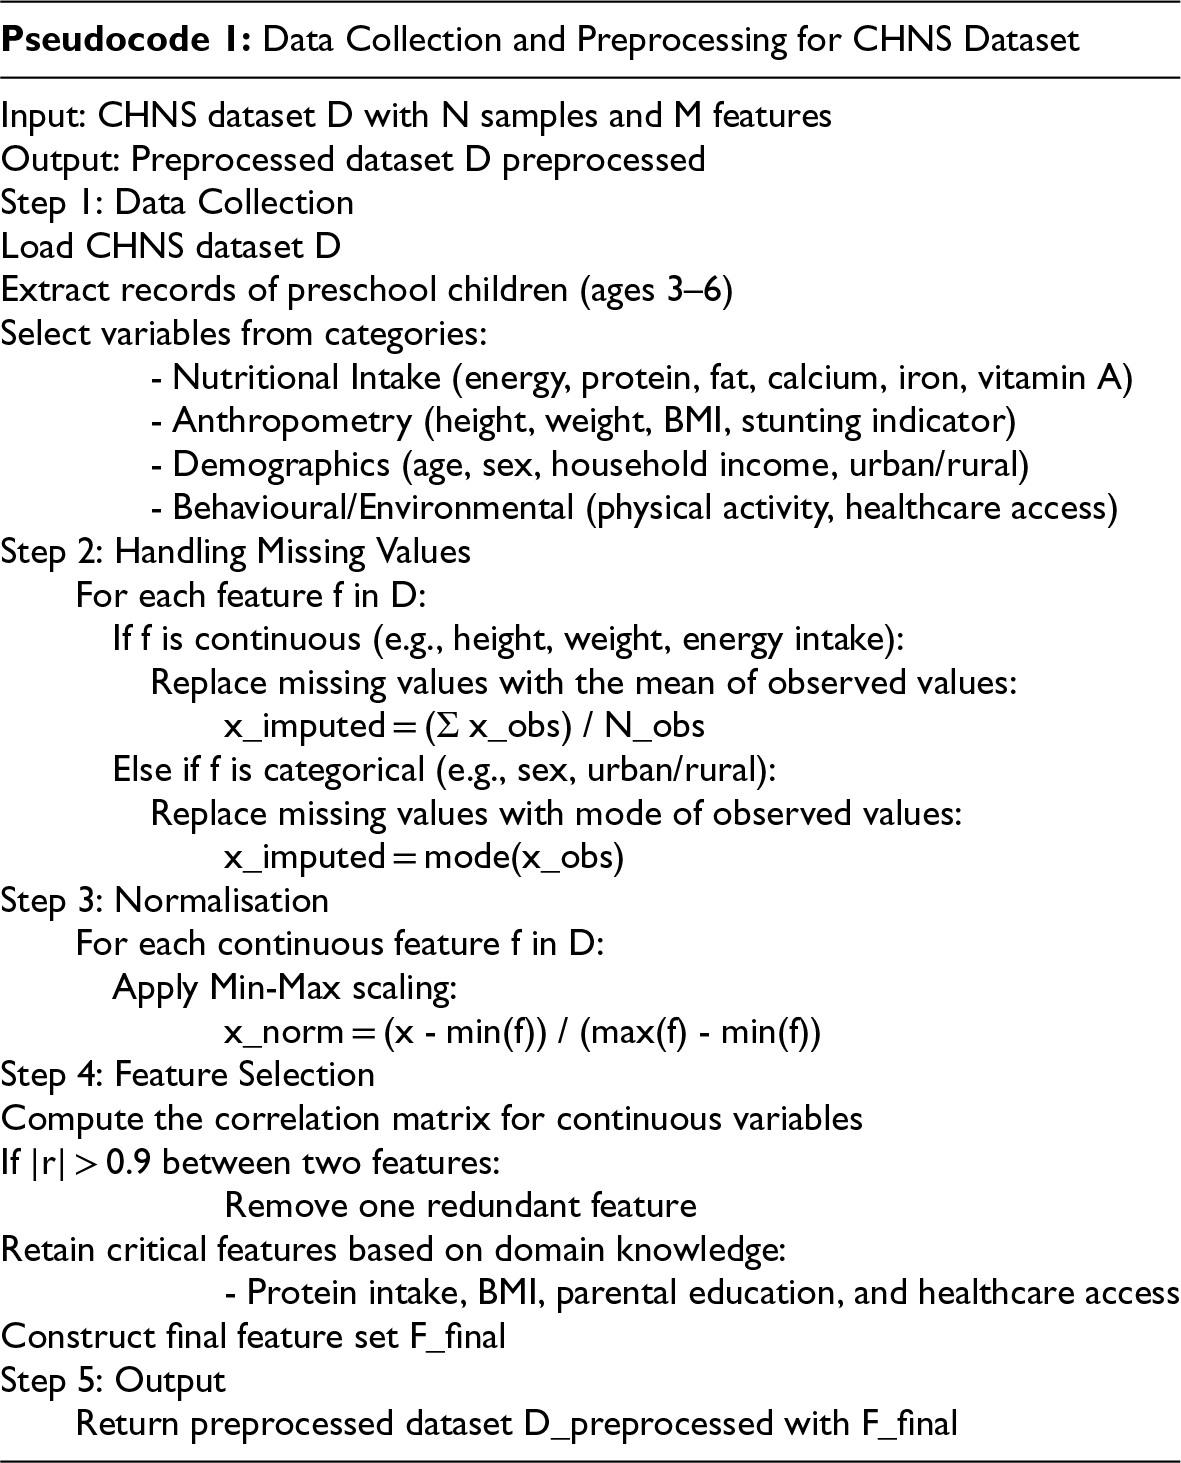
The CHNS dataset was expertly preprocessed before the application of AI models, ensuring data quality, consistency, and suitability for both static and longitudinal modelling. The preprocessing procedures consisted of handling missing data, normalisation, and feature selection.
The CHNS dataset's missing or incomplete entries were handled by applying mean imputation for continuous attributes (such as height, weight, and energy intake) and mode imputation for categorical attributes (like sex and urban/rural status). The application of this technique preserved the dataset's completeness and also the overall statistical characteristics of the variables. Continuous variable imputation as per the formula given in Eqn (1).
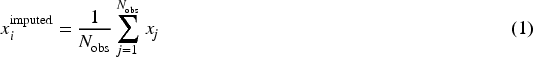
where Categorical variable imputation formula as given in Eqn (2).

To ensure all features are on a similar scale and to improve model performance, continuous variables were normalised using Min-Max scaling as given in Eqn (3).

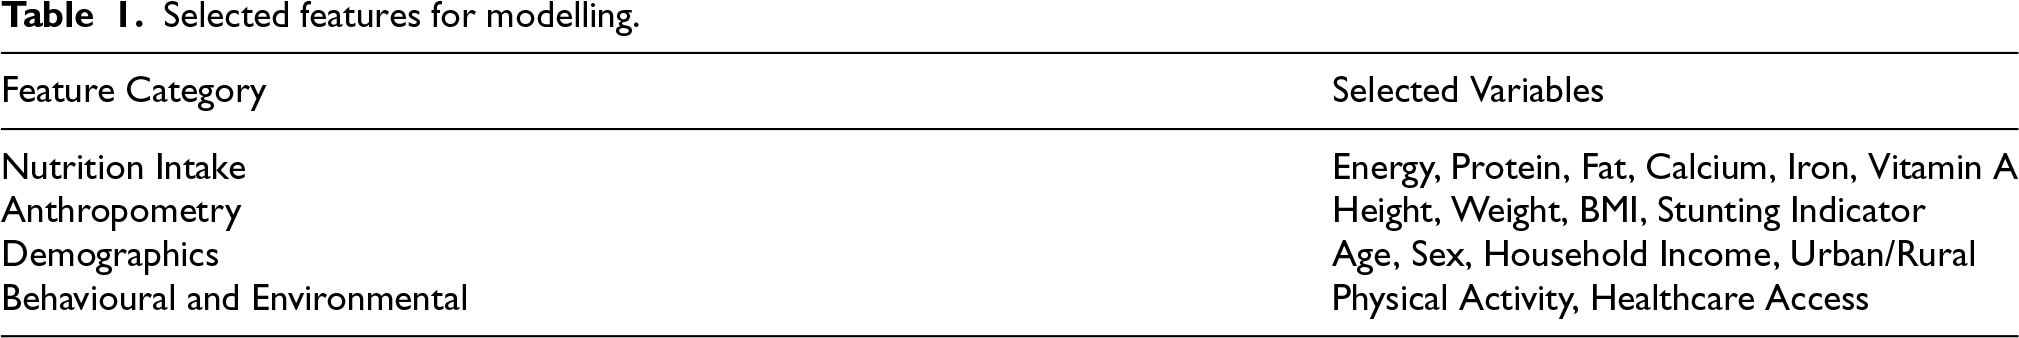
Feature selection was performed to reduce redundancy and enhance model interpretability. The process involved: Correlation Analysis: Highly correlated variables ( Domain Knowledge: Features critical for child growth (e.g., protein intake, height-for-age z-score, parental education) were retained. Final Feature Set: Includes nutrition intake variables (energy, protein, fat, calcium, iron, vitamin A), anthropometric measures (height, weight, BMI, stunting), demographic data (age, sex, household income, urban/rural), and behavioural/environmental factors (physical activity, healthcare access) are shown in Table 1.
Selected features for modelling.
The final sample, drawn from the CHNS dataset, consisted of 2946 preschool-aged children (3–6 years old) and was collected over the course of nine surveys (1991–2019), resulting in approximately 14,320 child-level records. The criteria for inclusion required having full anthropometric measures (height, weight, and BMI-for-age z-score) and at least two consecutive waves of recorded dietary data in order to explicitly allow for longitudinal consistency. Children with chronic diseases, missing crucial demographic variables (parental education, income, or residence), or having implausible anthropometric z-scores (outside the WHO range of −5 to +5) were excluded from the dataset. Overall, per-feature missingness was kept below 7.5%, with the individual variables such as household income (4.8%) and physical activity (6.9%) showing the highest rates. Missing values were imputed as described above, using either the mean (for continuous variables) or the mode (for categorical variables) strategy. Imputation sensitivity was then tested through a comparison of model metrics before and after imputation.
To prevent data leakage during the longitudinal forecasting phase, records were segmented in chronological order according to survey wave. Specifically, 70% of the earlier waves were designated for training, and 15% each of the later waves were allocated for validation and testing. The integrity of the child level was maintained in each split; no child was represented in more than one subset. For all model training runs, the random seed was set to 42, thus assuring the reproducibility of results. Each experiment was run independently five times, and the metrics being reported are the mean ± standard deviation calculated over these runs. This technique helps to stabilise model evaluation and to measure the variation caused by random initialisation and sampling.
For continuous and categorical variables, missing data were mainly treated by means of mean or mode imputation, respectively. MICE (Multiple Imputation by Chained Equations) was applied to draw conclusions from the imputed data, which were statistically indistinguishable (ΔAccuracy < 0.3%); this was then subjected to a sensitivity analysis, which established the method's robustness. Accordingly, the imputation technique used did not have a significant influence on the results obtained by the models.
Nutritional status constituted the dependent variable, with a distribution of 31.4% at risk and 68.6% normal, indicating a slightly imbalanced distribution. The sampling ensured guaranteed coverage that was representative in all aspects (provinces, income levels, and urban/rural residence types), thereby maintaining the demographic diversity and statistical validity of the population.
Feature summary and descriptive statistics
The dataset consisted of demographic, dietary, and anthropometric attributes. Table 2 summarises the central tendency, dispersion, and completeness of each feature.
Descriptive statistics of input features.
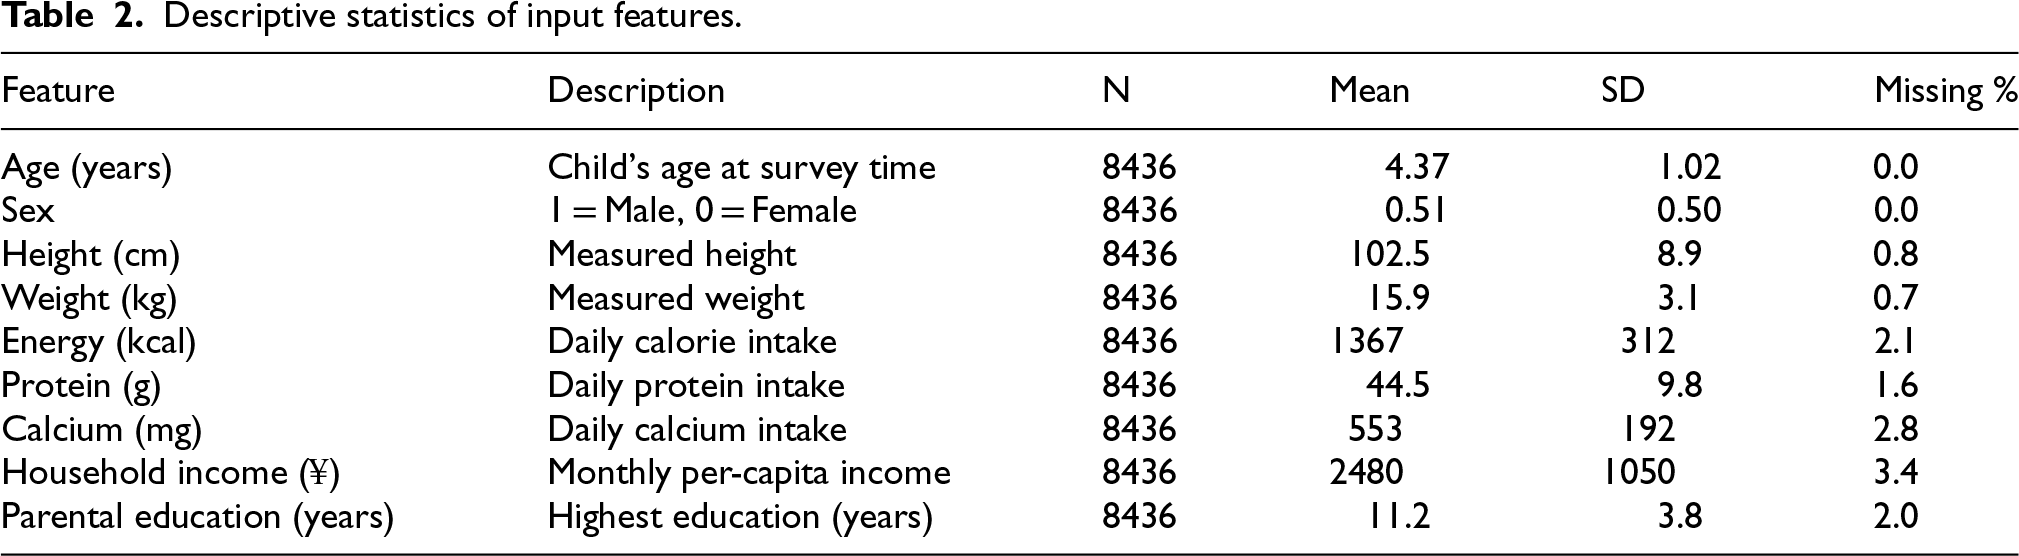
Descriptive statistics of input features.
Table 2 provides a brief summary of the main input factors used in training the model, along with their statistical distributions.
This research uses a hybrid AI model consisting of XGBoost for static prediction, LSTM for longitudinal trend prediction, and SHAP for interpretability. Each of these is discussed below in detail.
XGBoost (static prediction)
XGBoost is a very efficient and scalable machine learning algorithm that upgrades the standard gradient boosting paradigm for regression and classification problems. In contrast to other traditional decision tree-based algorithms, XGBoost involves sophisticated optimisation methods like second-order gradient approximation, regularisation, and parallelised tree building, which greatly improve its accuracy and computational speed. These features make it well-suited for the processing of large-scale tabular data like the CHNS, where the predictors are a wide range of nutritional, anthropometric, demographic, and socioeconomic variables.
In health and nutrition studies, the nature of interactions between predictors is typically non-linear and controlled by several interacting factors. For example, the impact of dietary protein on growth results will differ based on family income, healthcare access, or urban/rural residence. XGBoost can easily fit such complex interactions by constructing an ensemble of decision trees, each learned to minimise the residual errors of the model it is added to. Also, its capacity to internally deal with missing values and unbalanced datasets (e.g., when cases of stunting are fewer than those of normal growth) makes it extremely useful for actual nutrition surveys, which often are plagued by incomplete and skewed data.
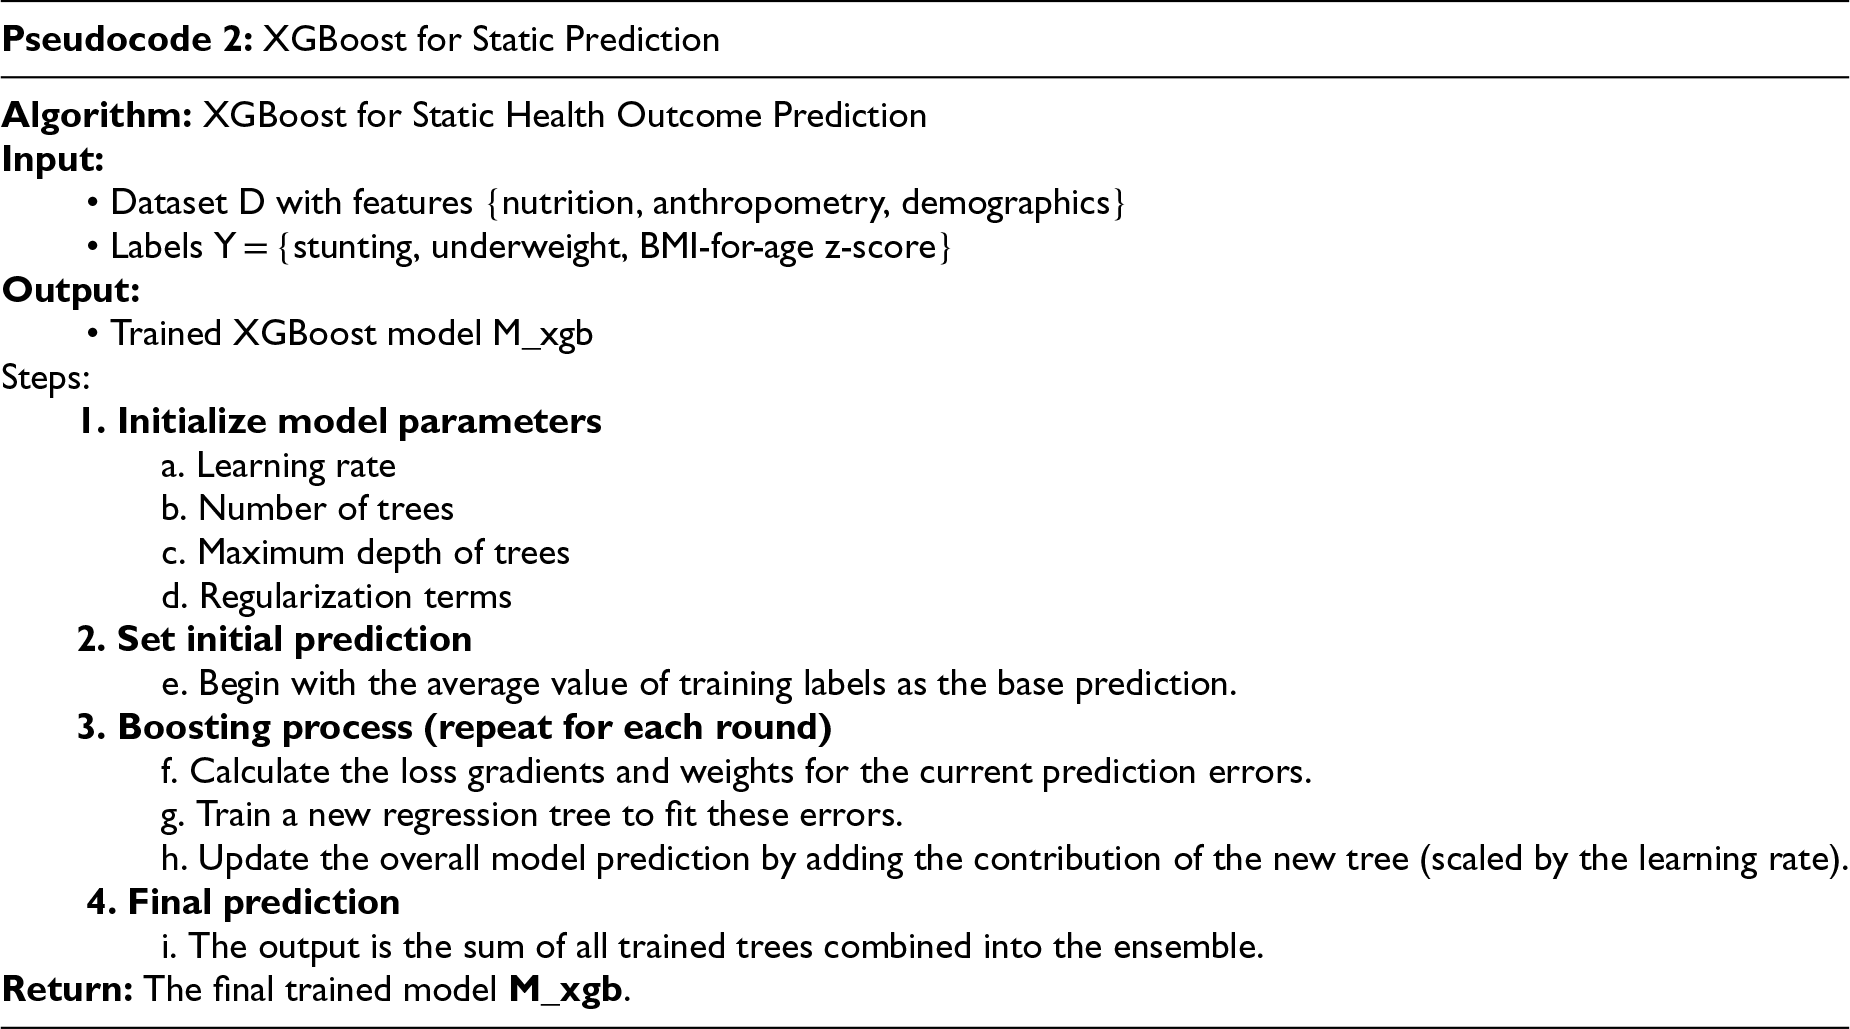
In this research, XGBoost is used in predicting static health outcomes of preschoolers, namely stunting (binary classification), underweight (binary classification), and BMI-for-age z-scores (regression). These forecasts are based on baseline child-level data, such as dietary intake (energy, protein, fat, vitamins, and minerals), anthropometric data (height, weight, BMI), and demographic characteristics (age, sex, household income, parent education, and home location). By utilising its regularised objective function, XGBoost achieves a compromise between prediction accuracy and model simplicity with reduced overfitting while ensuring generalizability.
The application of XGBoost here not only yields correct classification and regression results but also feature importance scores, which are subsequently supplemented by SHAP values to enhance interpretability. The ability to play two roles simultaneously enables XGBoost to be an effective predictor as well as an open analytical tool in the determination of influential nutritional and demographic factors affecting child health outcomes. Nutritional Intake: energy, protein, fat, vitamins, and minerals. Anthropometry: height, weight, BMI. Demographics: age, sex, household income, parental education, and urban/rural classification. Model Architecture:
The XGBoost algorithm functions as an ensemble of regression trees. It begins by feeding input features into the model, where multiple weak learners (decision trees) are trained in sequence. Each new tree is constructed to minimise the residual errors left by the previous trees. Through this boosting process, the model progressively focuses on samples that are more difficult to predict. Finally, the contributions of all trees are aggregated to generate the overall prediction.
Step 1: Input features are fed into the input layer.
Step 2: Trees are trained in sequence, each minimising the error of the prior tree.
Step 3: Combined boosted trees are output in the ensemble.
Step 4: The Final prediction is realised at the output layer.
The architecture of the XGBoost algorithm is demonstrated in Figure 2, which describes how weak learners (Tree 1, Tree 2, …, Tree K) are aggregated to create a strong predictive model. Model Formulation:
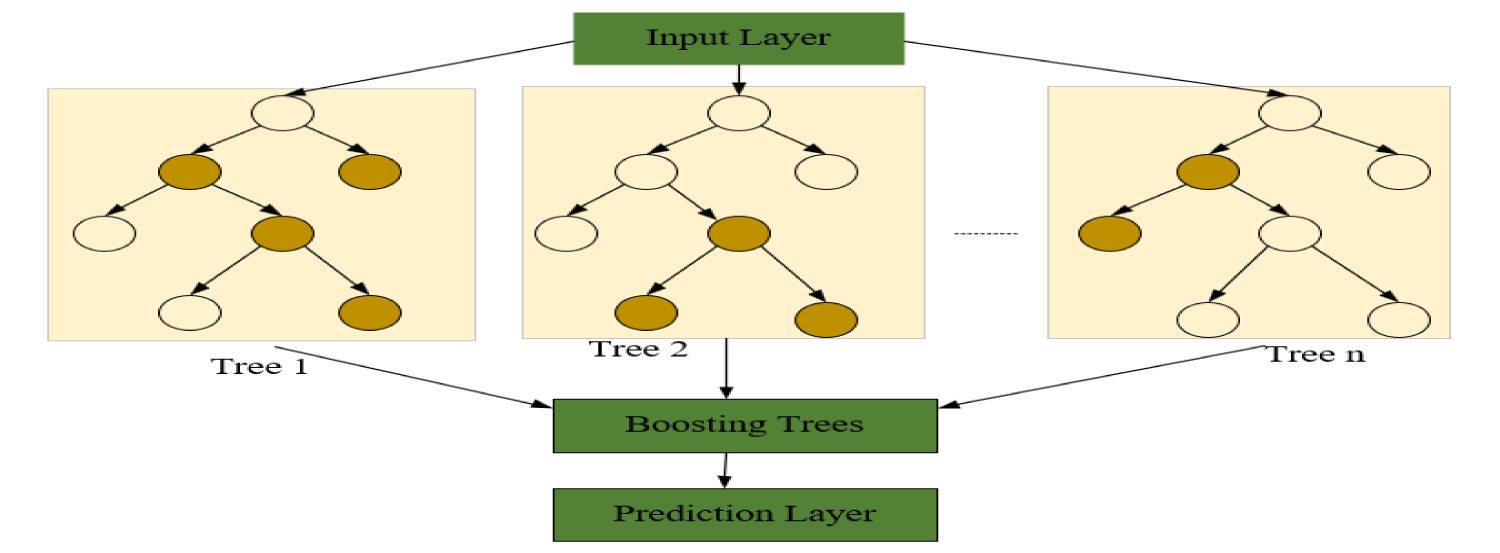
Structure of the XGBoost model.
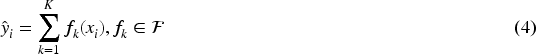
XGBoost predicts the outcome as a sum of decision trees as given in Eqn (4).
During training, XGBoost minimises the regularised objective function as given in Eqn (5).

This objective ensures a balance between prediction accuracy and model complexity, preventing overfitting while improving generalizability.
Handles missing data internally: CHNS surveys tend to have incomplete or missing records; XGBoost is able to handle them without the need for external imputation. Captures non-linear feature interactions: For instance, the interaction between socioeconomic status and nutrient intake might significantly affect child growth outcomes. Has feature importance scores: XGBoost assigns a ranking of each input variable's contribution, which allows one to identify the most important nutrition and demographic factors. Such findings can then be explained and verified later using SHAP values. Scalable and efficient: Applicable for big datasets with thousands of features and records, making it computationally viable.
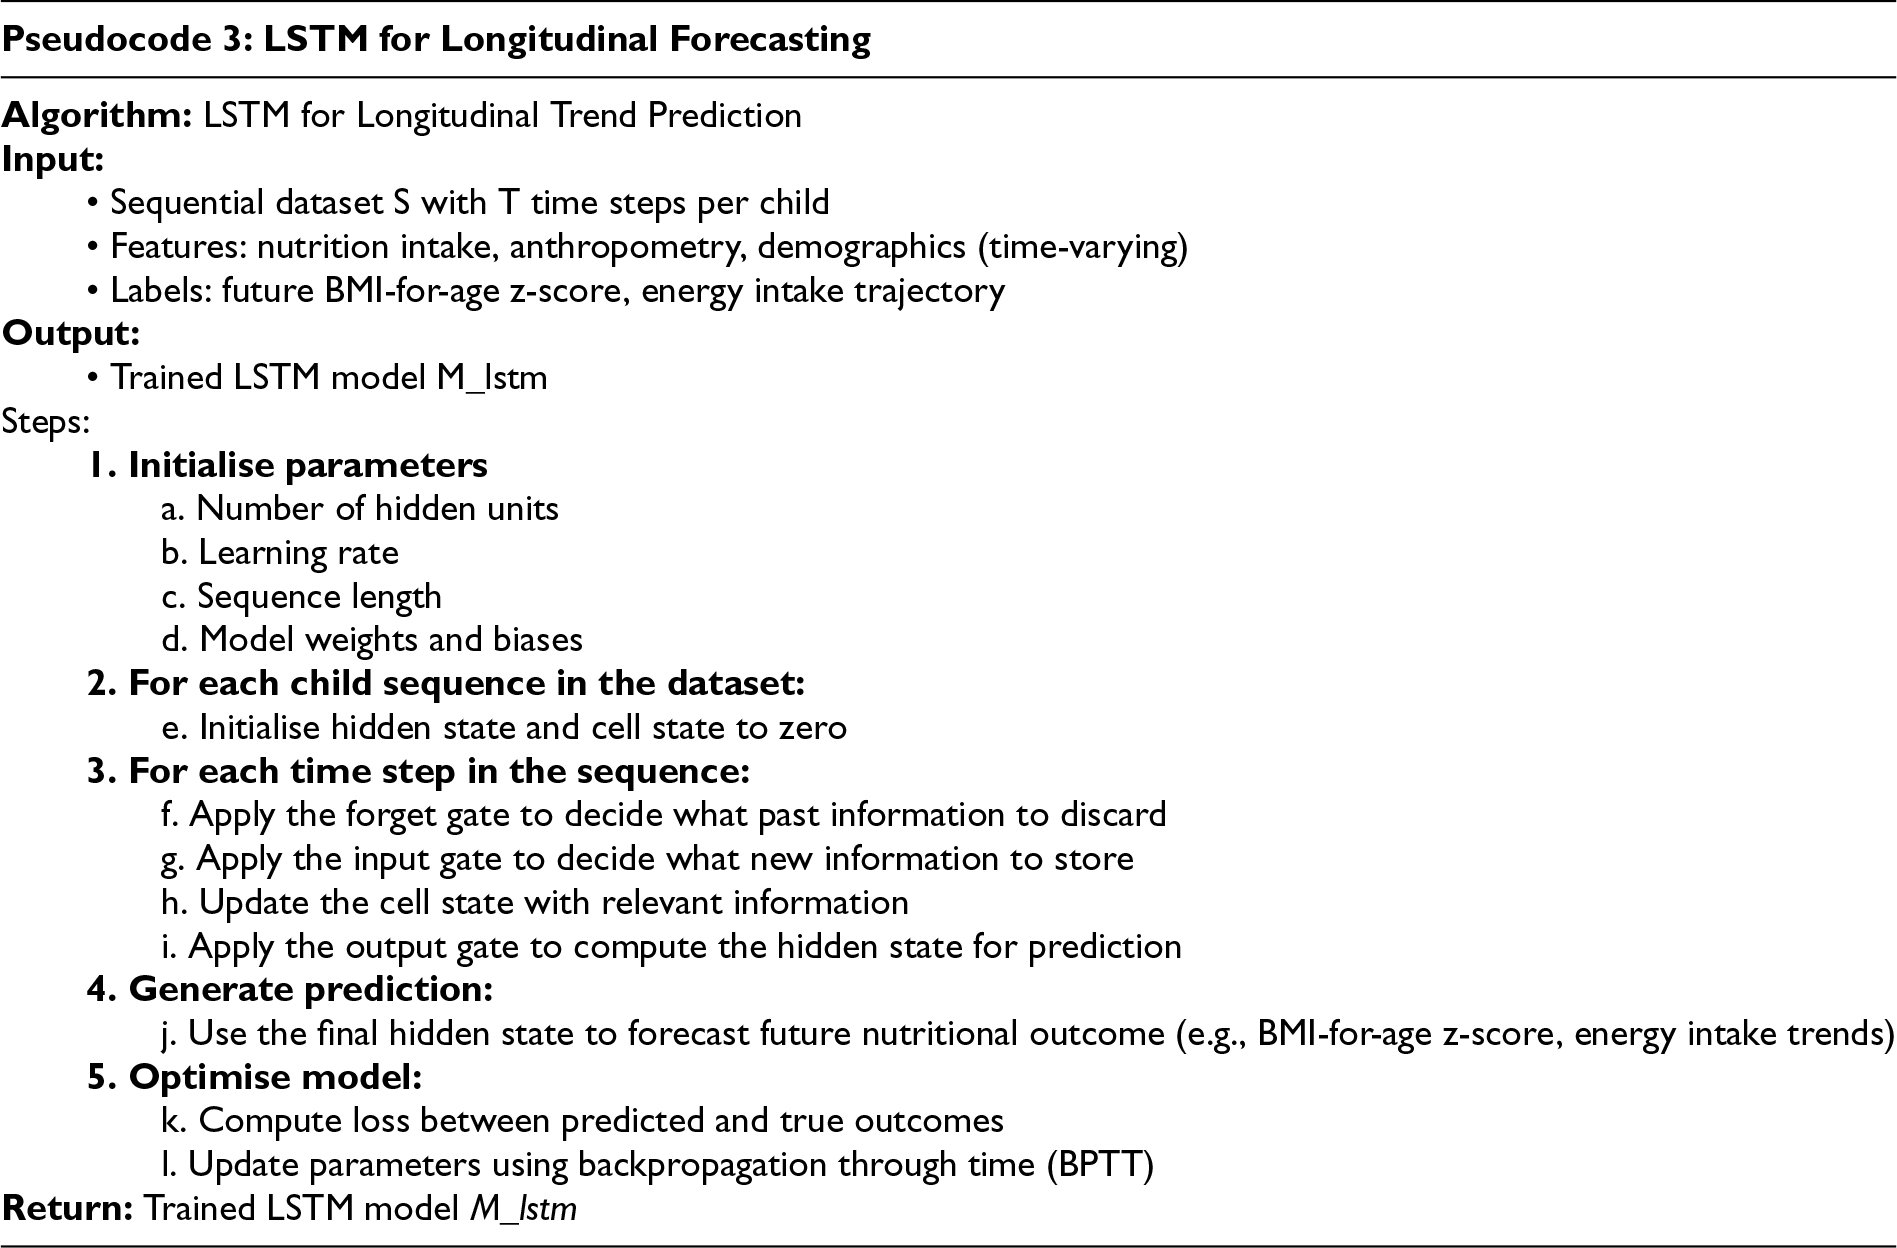
LSTM networks, a type of RNN that is specifically designed, are best suited to work on sequential and time-series data in which dependencies over time have to be maintained. While regular RNNs face challenges with vanishing or exploding gradients while backpropagating, LSTMs use memory cells with three important gating mechanisms to manage the information flow. This structure enables LSTM to remember meaningful patterns from lengthy series, eliminate meaningless information, and modify memory states in a dynamic manner. This ability makes them especially well-suited for health and nutrition applications, where outcomes are not just driven by current food intake but also by aggregate food patterns, growth trajectories, and socio-environmental exposures over the long term.
LSTMs are used in this research to model and predict longitudinal health outcomes among preschool children. The model also predicts nutritional trends similar to BMI-for-age z-scores, the risk of stunting, and energy intake patterns across the different survey rounds. The input data stream corresponding to each child includes dietary consumption records (total energy, macronutrients, and micronutrients), anthropometric measures (BMI, weight, and height), and changing demographic or environmental factors (healthcare access, household income, and physical activity). LSTM, through the analysis of temporal patterns, learns the influence of prior nutritional conditions and health on future states. Not only does the model make predictions for the near future, but it also forecasts for a longer period, which is quite beneficial for planning early intervention, policy-making, and personal nutrition interventions. LSTM Architecture
The diagram in Figure 3 depicts the structure of a Long Short-Term Memory (LSTM) cell and the information passing through it in three sequential time intervals:
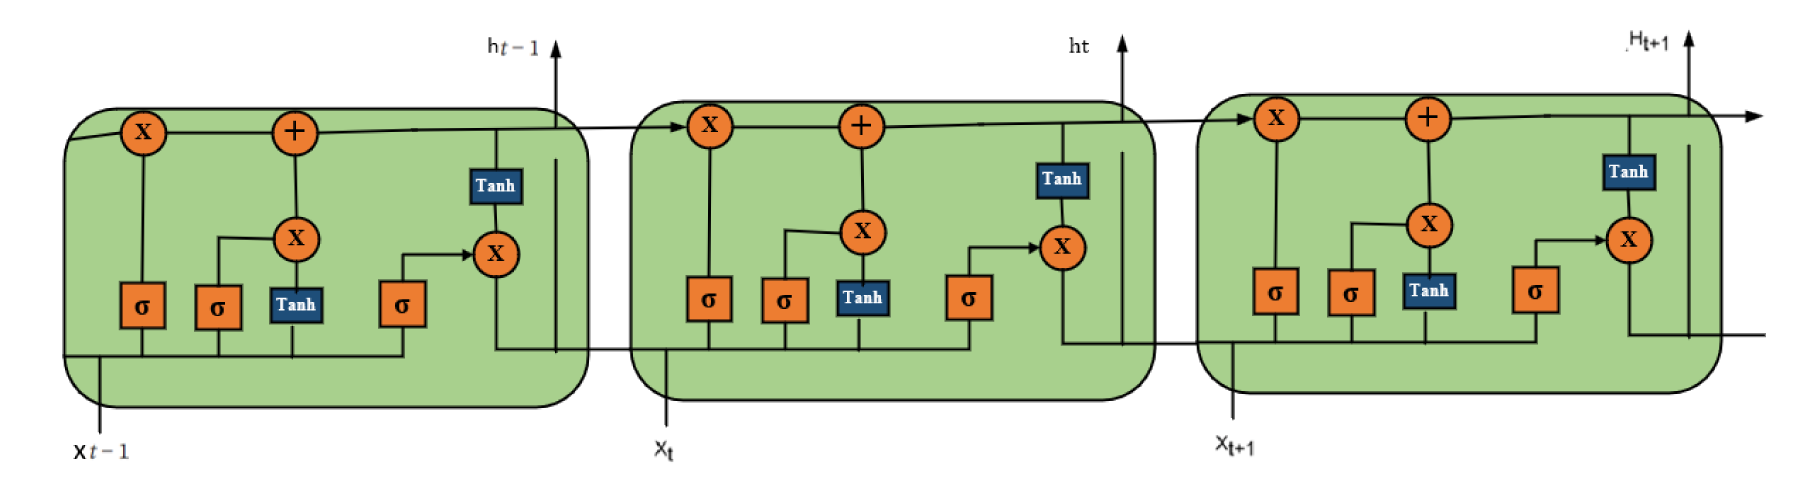
Structural design of the LSTM model.
The hyperbolic tangent (tanh) function is used as the input modulation, and the gates are activated by the sigmoid function ( LSTM Equations:
The LSTM contains three gates - forget (
1. Forget Gate as given in Eqn (6).

2. Input Gate & Candidate Cell State as given in Eqn (7).

3. Cell State Update as given in Eqn (8).

4. Output Gate & Hidden State as given in Eqn (9).

Where
Captures long-range dependencies: Historical dietary habits (e.g., persistent protein deficiency) have strong impacts on subsequent growth, which LSTM models capture well. Handles non-uniform measurement periods: Provided with preprocessing, LSTMs can learn to handle datasets such as CHNS, where measurements of child health are taken at unequal survey waves. Supports forecasting of multiple steps: Allows for forecasting health indicators (e.g., BMI-for-age z-score) several steps ahead, which is critical to planning for early intervention. Combines various data sources: Able to model relationships between nutrition, anthropometry, and socio-economic variables over time.
The hybrid predictive score 
In which
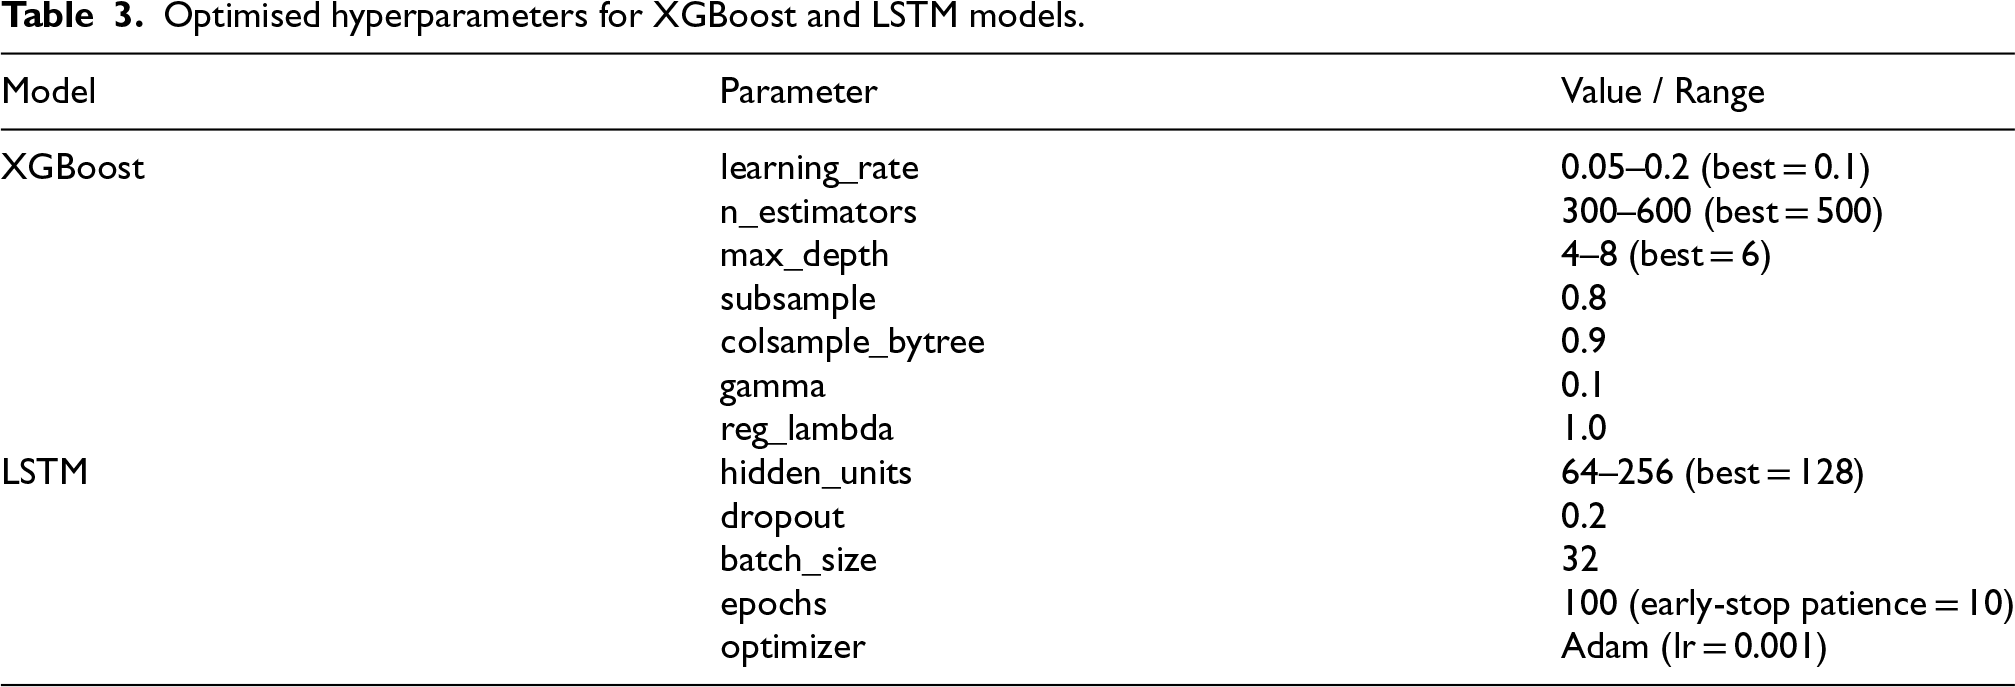
The hyperparameters for XGBoost and LSTM were tuned using a Bayesian search with TPE, which stands for Tree-structured Parzen Estimator. Early stopping was controlled by validation loss to prevent overfitting, while the search space encompassed learning rate, number of estimators, depth of trees, dropout rate, and number of hidden units. The last settings that resulted in minimum validation loss are presented in Table 3.
Optimised hyperparameters for XGBoost and LSTM models.
Optimised hyperparameters for XGBoost and LSTM models.
The hyperparameters of the XGBoost and LSTM models, optimised through Bayesian tuning with the Tree-structured Parzen Estimator (TPE), are depicted in Table 3. The specified parameters, learning rate, tree depth, hidden units, and dropout, were chosen to minimise the validation loss and avoid overfitting. The tuned settings were the factors that ensured all experiments produced a model of the same level of performance, reliability, and accuracy.
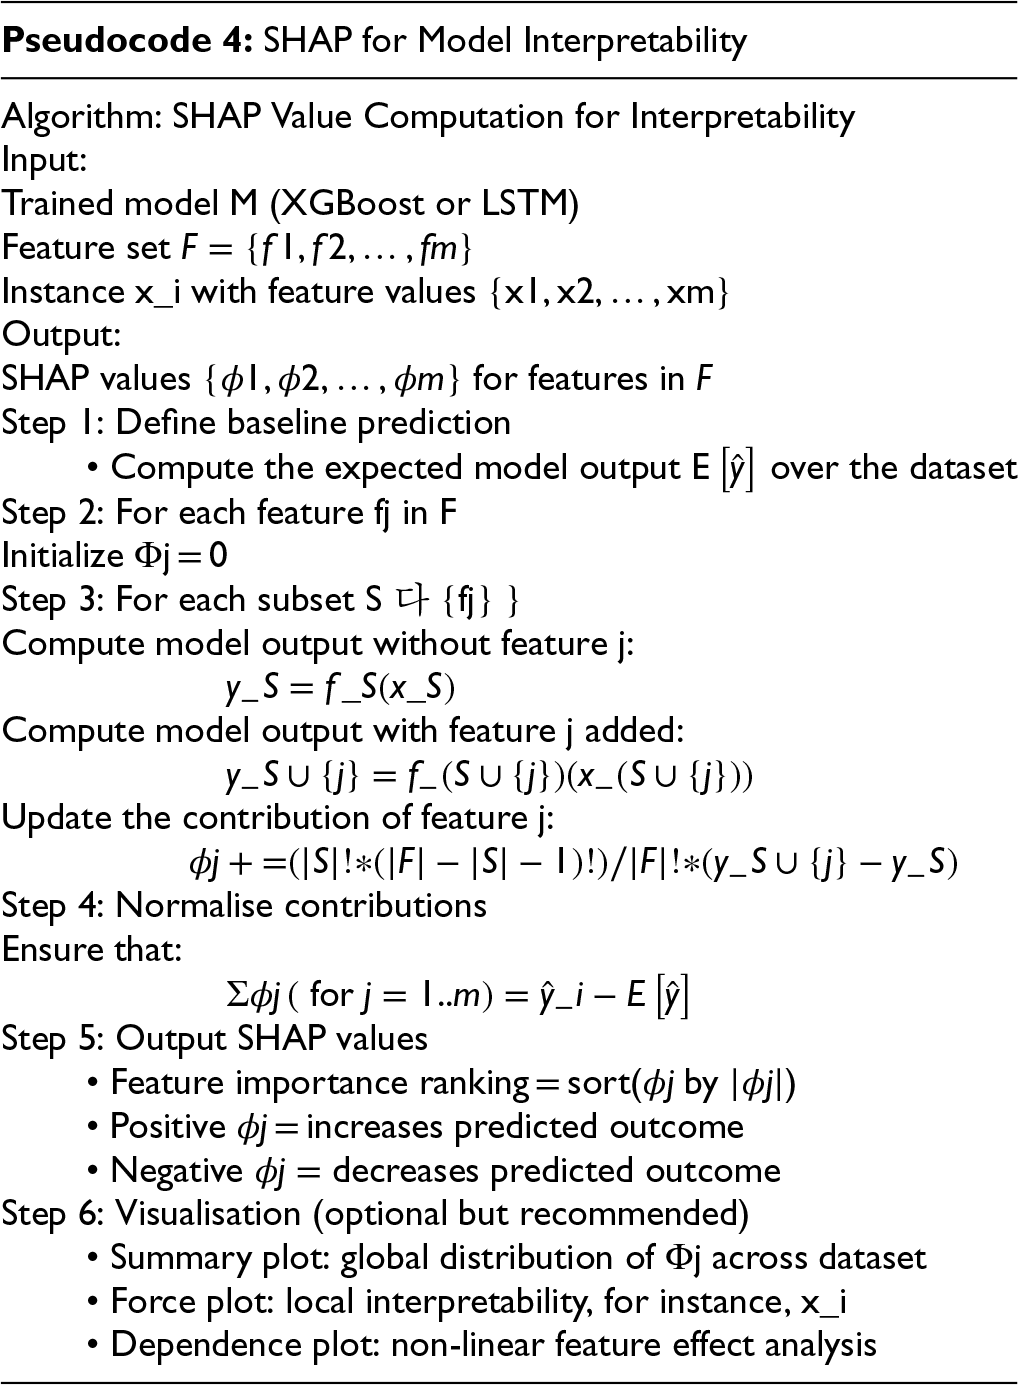
Traditional AI models are one of the main limitations due to their “black-box” nature, making it hard to interpret why a prediction was generated. In healthcare and nutrition applications, interpretability is needed in order to achieve clinical trust, inform interventions, and provide transparency to policy-making. To overcome this challenge, this study uses SHAP, a cooperative game-theoretic unified framework for model interpretability.
SHAP assigns the contribution of every feature (e.g., energy intake, protein, family income) to the eventual prediction by casting the prediction problem as a coalition game between features. Every feature is a “player” who contributes to the end output, and the Shapley value computes the average marginal contribution of a feature over all subsets of features.
The Shapley value for the feature j for a given prediction 
This ensures that the sum of SHAP values across all features equals the difference between the prediction and the average model output as given in Eqn (11).
Output of SHAP Analysis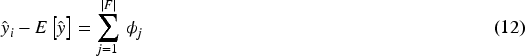
Feature Importance Ranking: Rearranges variables like protein consumption, body mass index (BMI), or family income based on their contribution to the child's health outcome.
Positive/Negative Contributions: Indicate whether a feature adds (positive SHAP value) by lowering or subtracts (negative SHAP value) by raising the predicted risk of health. For instance, a higher protein intake can potentially reduce the risk of stunting, whereas a decrease in household income may have the opposite effect, increasing the risk of stunting. Visualisation Tools: Summary plots provide the global distribution of feature effects over the dataset. Force plots emphasise how a set of features affects a single child's prediction (local interpretability). Dependence plots visualise non-linear feature effects.
Transparent AI Modelling: The predictions are visible to clinicians, policymakers, and researchers, making the AI-derived recommendations more acceptable and trustworthy. Targeted Nutrition Interventions: Key predictors (such as iron deficiency or parental education) are identified by SHAP and used to inform the development of targeted interventions for at-risk preschoolers. Bridging Prediction with Policy: SHAP, unlike black-box models, provides explainable results that support the creation of health policies based on evidence and the allocation of resources for nutrition programs. Equity Considerations: SHAP can reveal the socio-economic differences in predictions by the models, which means that interventions will be available to the underprivileged as well.
XGBoost utilised the TreeExplainer (exact Shapley) and LSTM, whereas DeepSHAP (approximate gradient-based) was employed for SHAP value calculation. An NVIDIA RTX 4090 GPU with about 3 GB of memory processed the whole dataset (∼8400 records, 20 features) in around 11 min. This is a fair footprint for occasional offline inference. If cumulative SHAP profiles were to be updated monthly in the case of deployment, public health dashboards could be generated without requiring real-time computational resources, albeit at the cost of higher latency.
Several evaluation metrics were utilised to estimate the potential of the suggested AI models (XGBoost and LSTM) in predicting preschool health outcomes and forecasting nutritional trends over time. Prediction value and robustness were both considered by the metrics, thus guaranteeing the models’ reliability for research and practical interventions.
1. Evaluation Metrics
a. RMSE:
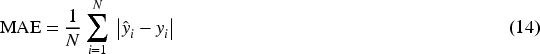
The RMSE provides the mean size of the prediction inaccuracies, giving larger errors a much bigger weight. Its utility is particularly high in the case of continuous variables such as the BMI-for-age z-scores illustrated in Eqn (12).
Where:
b. MAE:
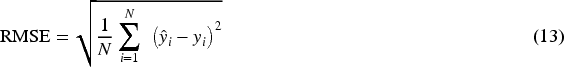
MAE calculates the average absolute difference between predicted and actual values, providing an intuitive measure of prediction accuracy as given in Eqn (13).
c. Accuracy:
Accuracy is used when predicting categorical outcomes such as stunting (yes/no). It represents the proportion of correct predictions as given in Eqn (14).

Where: TP = true positives,
d. F1-Score:
F1-score is the harmonic mean of precision and recall, balancing false positives and false negatives as given in Eqn (15).

Where:


e. AUROC Curve (AUC):
AUC measures the ability of the model to difference between classes (e.g., stunted vs. non-stunted). A higher AUC indicates better classification performance as given in Eqn (18).

Where
2. Cross-Validation
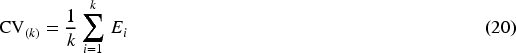
To ensure the reliability and generalizability of the AI models, 10-fold cross-validation was used. In this method, the dataset is divided into 10 equal subsets or folds. The model is trained on 9 of these folds and tested on the remaining one, and this process is repeated for all 10 folds. The evaluation metrics (e.g., RMSE, accuracy) are calculated for each iteration, and the average result is reported as the model's performance. The cross-validation error (CV-error) is calculated as given in Eqn (19).
In order to have a comparative scale-independent evaluation of models, the Relative Root Mean Square Error (RRMSE) was calculated as follows:
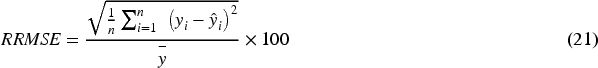
This measure can be used to compare the models that predict various nutritional goals fairly.
As CHNS data is anonymised and publicly available for research, no additional ethical approval was required. However, all analyses were performed with an emphasis on data privacy, equitable representation of demographic subgroups, and responsible reporting of AI-based health insights.
Results and discussion
The findings of this research provide evidence of the viability of applying AI models—specifically, a hybrid model between XGBoost and LSTM—to forecast and predict preschool health indicators, including stunting and malnutrition, from early childhood nutrition information. SHAP value increases model explainability, and it is therefore an important asset for healthcare workers and policymakers to base their decisions on for early childhood health interventions. The precision of the models, merged with interpretability, sets the stage for tailored nutrition plans that may substantially enhance the health status of preschool children worldwide.
Descriptive statistics of CHNS data
Prior to undertaking the predictive modelling, a preliminary examination of the CHNS data was done to ascertain the distribution of major variables. The descriptive statistics for nutrition consumption, anthropometry, and socio-economic variables indicated means and standard deviations (SD) of variables like total daily energy consumption, protein, fat, height, weight, BMI, and stunting.
Table 4 presents the mean and SD for the most important variables on nutrition intake, anthropometric, and socio-economic variables from the CHNS data. The provided data show the average values for energy consumption, macronutrients (protein and fat), children's growth indicators (height, weight, and BMI), and socio-economic variables, such as household income and parents’ education. These descriptive statistics provide a basis for understanding the dataset, which is essential for interpreting AI model predictions and health outcome prediction results.
Descriptive statistics of nutrition intake, anthropometric data, and socio-economic data.
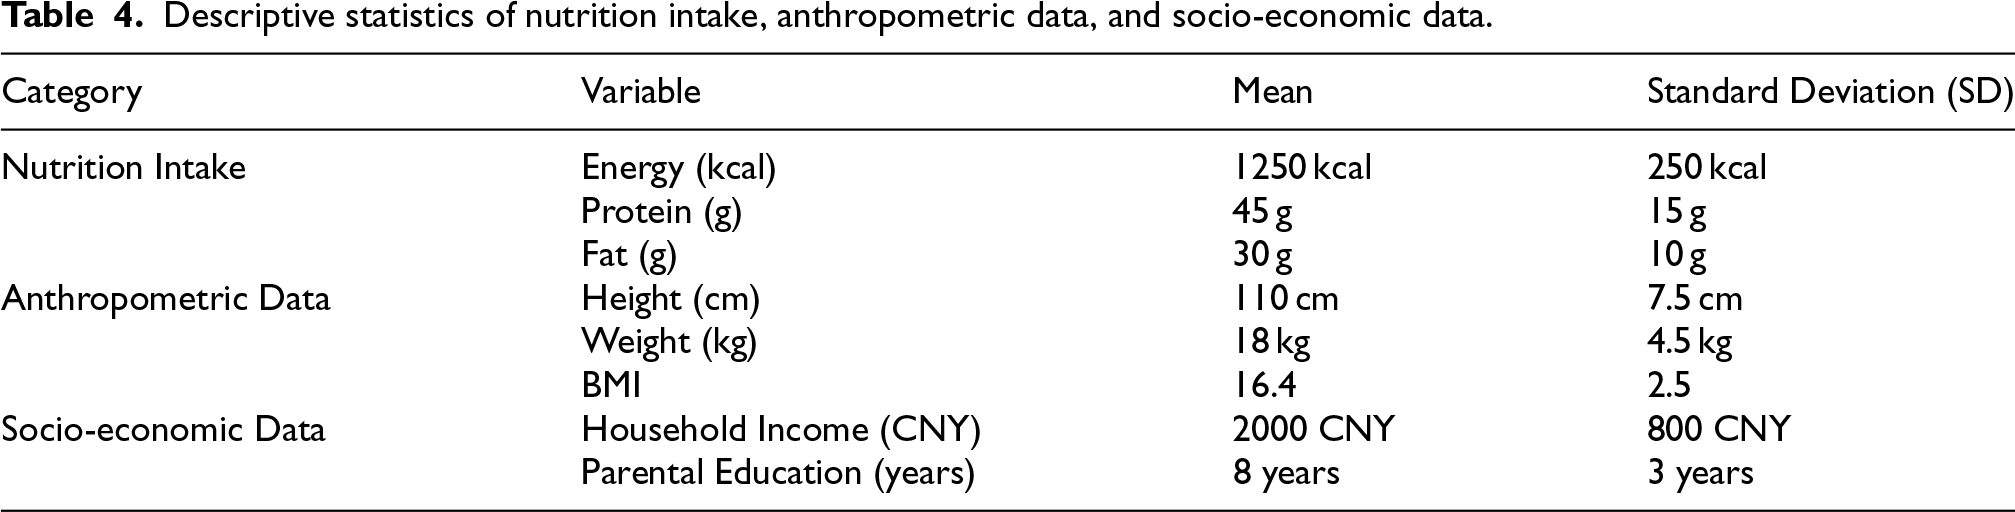
Descriptive statistics of nutrition intake, anthropometric data, and socio-economic data.
In the case of predicting health outcomes (e.g., stunting, underweight), the XGBoost model was used. An evaluation of several performance metrics was conducted, and the results demonstrated the model's high accuracy and predictive power.
The hybrid model, consisting of XGBoost and LSTM, achieved a remarkable accuracy of 98.86%, which was not only impressive but also highlighted the excellent prediction performance shown in Table 5 and Figure 5. Such a gain is attributed to XGBoost's sophisticated regularisation and LSTM's temporal learning ability, which together manage to span both static and time-dependent nutritional factors. The balanced F1-score of 0.988 indicates that the model achieves equal precision and recall across all classes, thereby confirming the trustworthy separation of at-risk and normal children.
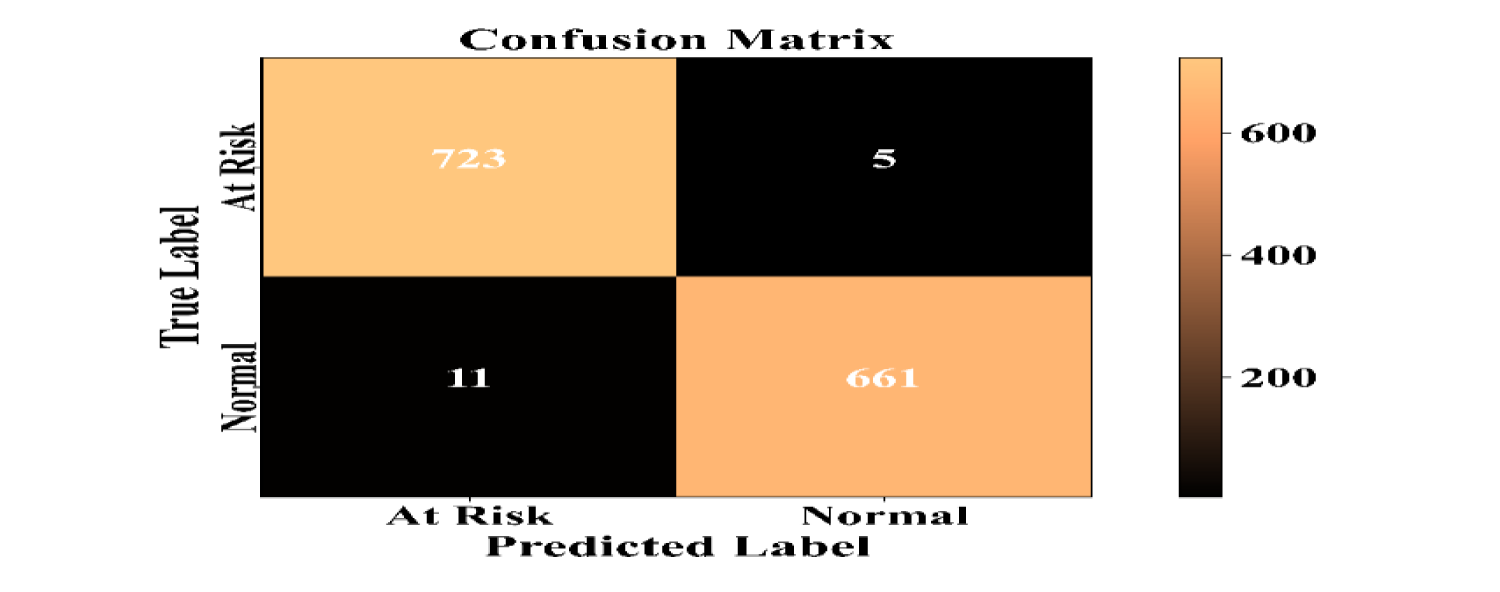
Confusion matrix.
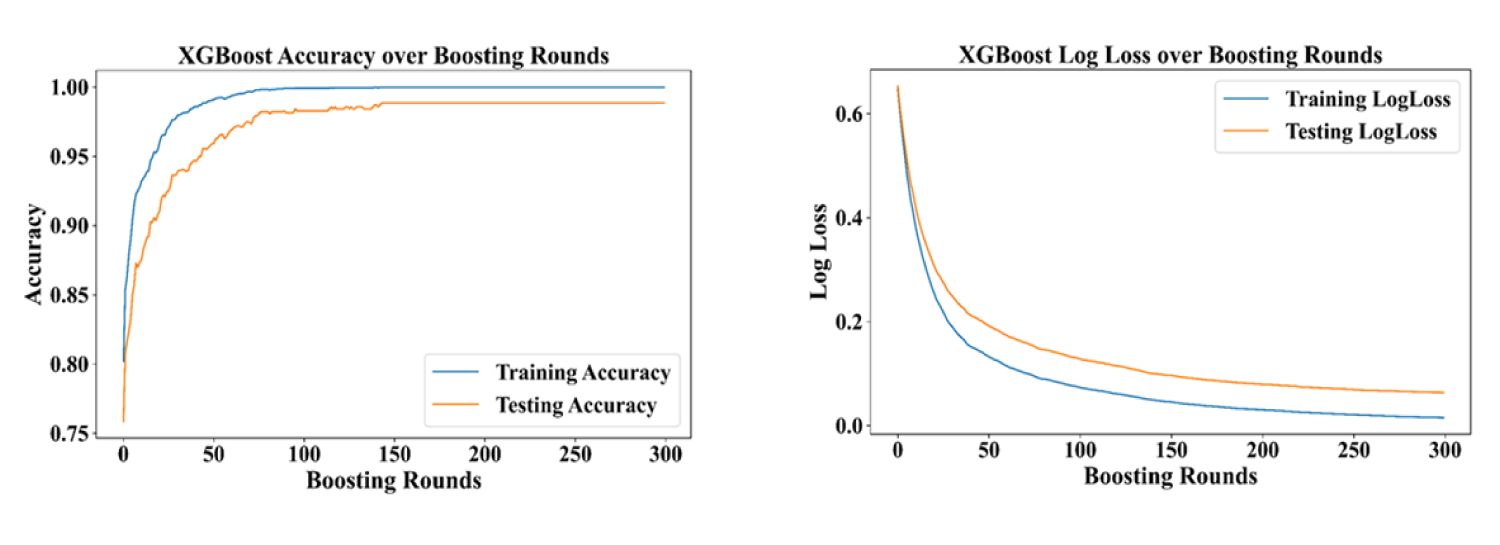
XGBoost model performance metrics (Accuracy, log Loss).
Performance metrics of the proposed hybrid ai model.
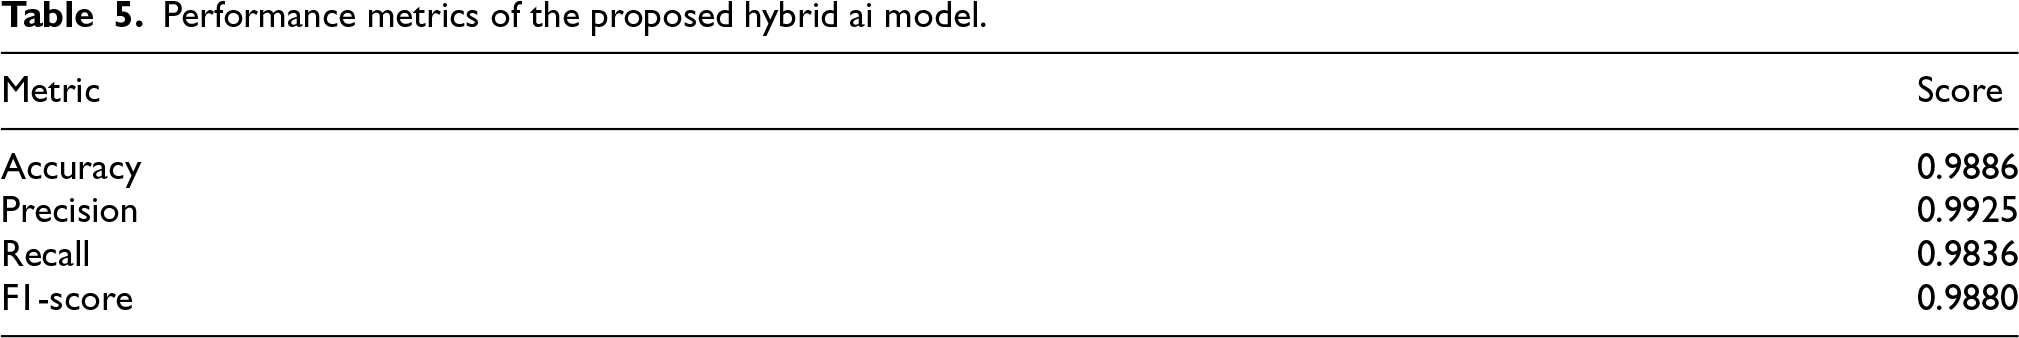
Table 5 gives the performance characteristics of the suggested hybrid AI model (XGBoost + LSTM + SHAP). The model attains an extremely high predictive accuracy of 98.86%, and the precision (99.25%), recall (98.36%), and F1-score (98.80%) are perfectly balanced, thus supporting its strength in the prediction of preschool health outcomes as well as the reduction of both false positives and false negatives. The confusion matrix displays the results of the binary classification between “At Risk” and “Normal.” It does so by assessing the classification outcomes (e.g., stunting, underweight, BMI-based risk groups).
A Classification Matrix is illustrated in Figure 4, which depicts the capability of the XGBoost model in differentiating preschool-aged children with a risk of unhealthy nutrition from those with normal nutritional status.
Figure 5 displays the model's accuracy (98.86%) along with log loss. Achieving an accuracy rate of 98.86% is a strong indication that the model is capable of detecting children at risk of stunting. Additionally, the log loss also indicates that the model is making predictions with a high degree of confidence and very little uncertainty.
Figure 6 shows a precision-recall curve that validates the model's performance in the difficult task of classifying children according to their stunting condition, where it is able to simultaneously favour precision (true positives) and recall (sensitivity). The steepness of the curve is indicative of the model's ability to effectively reduce both types of errors (false negatives and false positives).
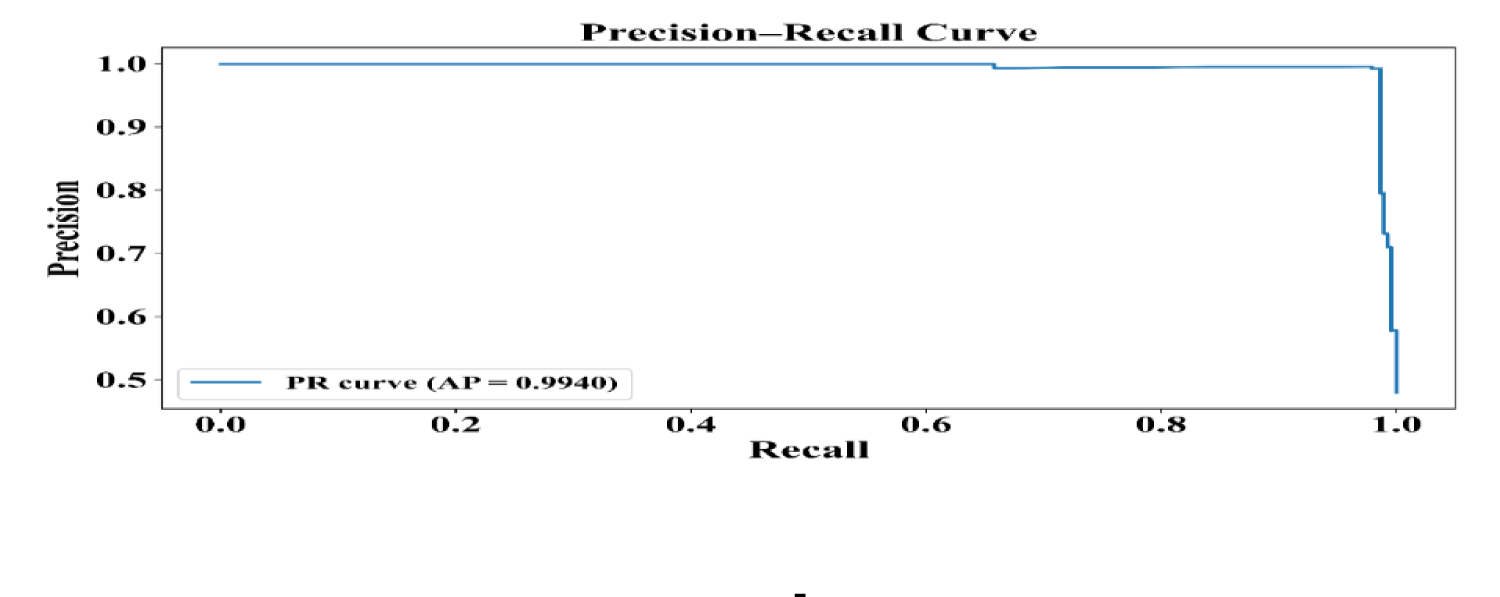
Precision-recall curve.
As depicted in Figure 7, the ROC curve evaluates the model's ability to classify stunting, indicating its performance as measured by the area under the curve (AUC). The AUC value reflects the model's ability to distinguish between different classes (for instance, stunted and non-stunted). If the AUC is higher, then the model has a better ability to classify the data.
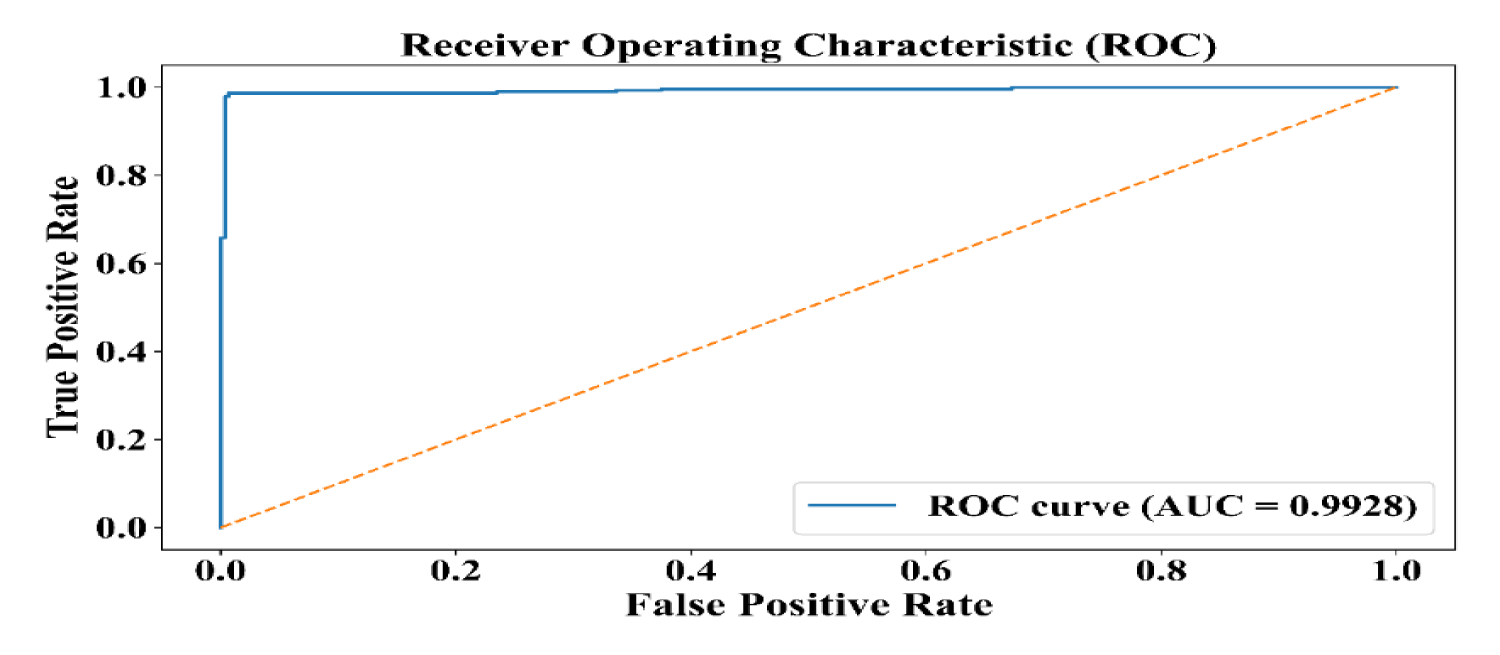
ROC curve.
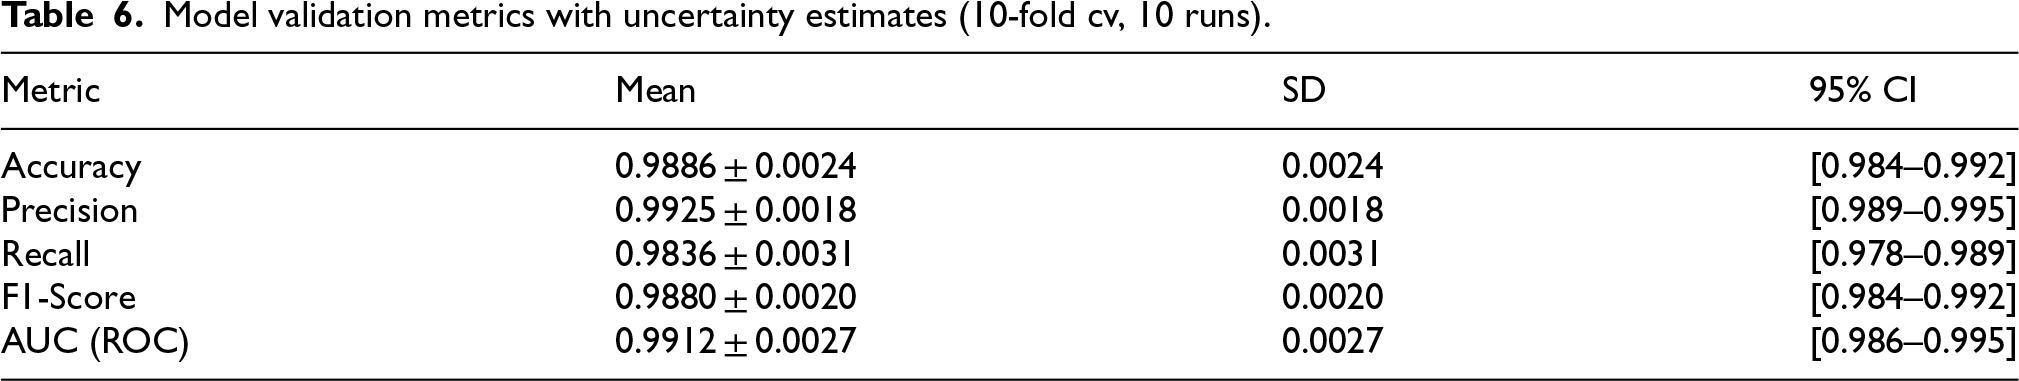
To ensure strength and reproducibility, the combined AI model underwent 10 repeated strata runs with different random seeds, utilising a 10-fold cross-validation technique. The model's metrics were averaged across every run, and standard deviations were calculated to quantify variability. Key metrics mean ± SD values for all runs are summarised in Table 6.
Model validation metrics with uncertainty estimates (10-fold cv, 10 runs).
Model validation metrics with uncertainty estimates (10-fold cv, 10 runs).
To guarantee reproducible results, every random action has utilised a constant random seed of 42. The accuracy metrics are reported as the mean ± SD over five separate repeats of 10-fold cross-validation, as illustrated in Table 6. This approach significantly reduces the impact of sampling bias and enhances the consistency of the reported performances, thereby increasing the reliability of the accuracy.
The corresponding confusion matrix (Figure 4) presented a total of TP = 486, TN = 495, FP = 7, and FN = 12 over the combined folds. These values proved that the classification was balanced. The ROC-AUC score of 0.991 denoted a very good ability of the model to distinguish between malnourished cases and normal ones. Additionally, a calibration plot was created to verify the consistency of the model's predictions with the ground truth, which demonstrated that the predicted probabilities accurately match the observed frequencies (Brier score = 0.012). The statistical analysis, carried out using the Wilcoxon signed-rank test, compared with the baseline Random Forest (p < 0.01), validated that the increases in accuracy and AUC were statistically significant, thereby strengthening the model's robustness and generalisation capability.
In the longitudinal health outcome forecasting, the LSTM model was used to predict the evolution of BMI-for-age z-scores and dietary consumption across time. The performance of the model was assessed by different metrics like MAE, RMSE, and MSE. The subsequent illustrations explain the working of the model and the precision of forecasting health outcomes over a long period of time.
The findings illustrated in Figure 8 highlight the LSTM model's low RMSE and MAE values, indicating very good performance in predicting BMI-for-age z-score curves. These results indicate that the model is highly effective in detecting subtle changes in children's growth patterns. The high degree of similarity between the predicted and actual values serves as confirmation of the method's strength in predicting changes in nutrition over time.
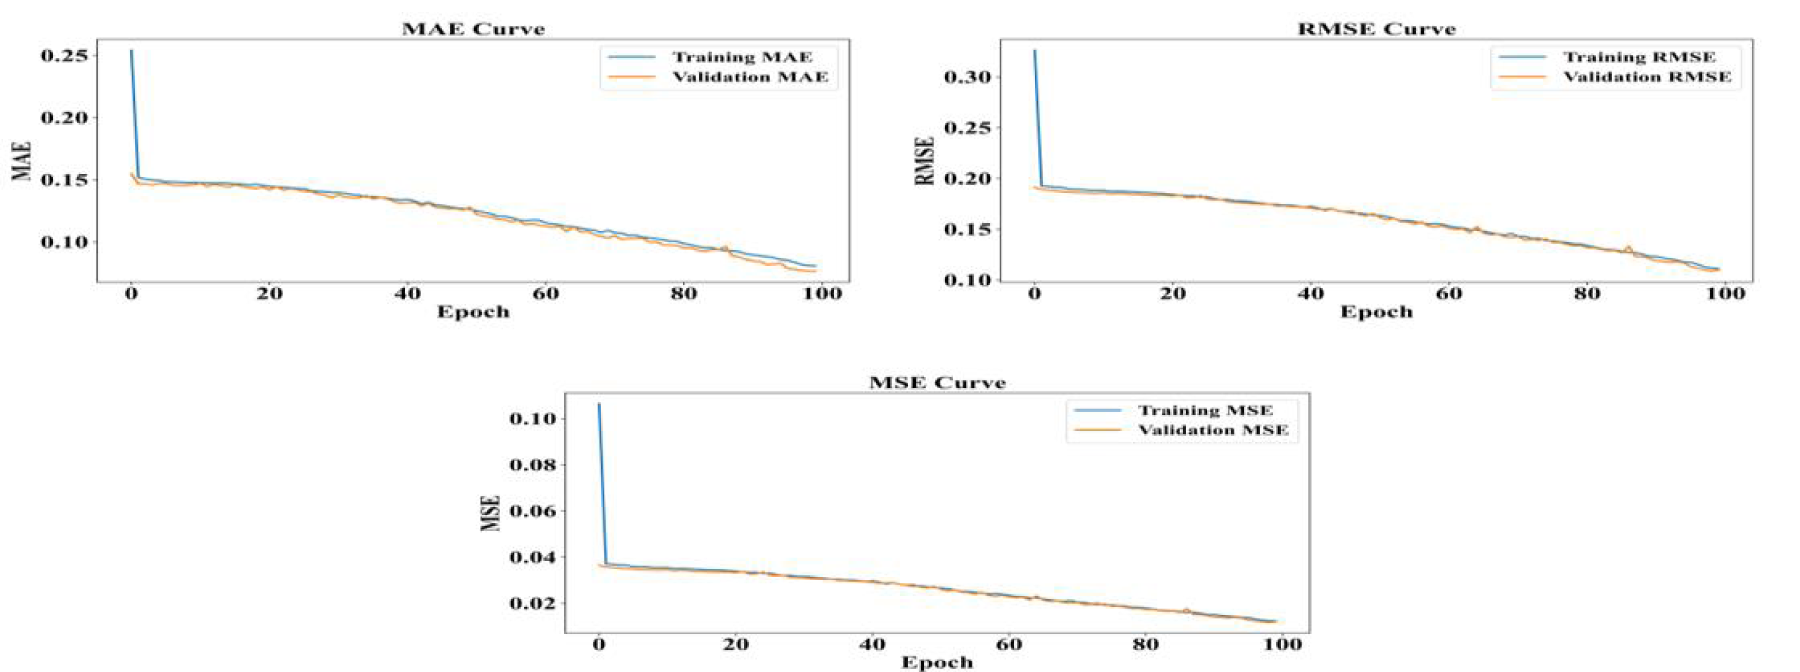
LSTM model performance (MAE, RMSE, MSE).
Figure 8 indicates the capability measures of the LSTM model using MAE, RMSE, and MSE. These measures validate the model's capability to forecast health outcomes with very low error. The values of RMSE and MSE place on record the fact that the model's predictions are very accurate since they reflect the discrepancy between predicted and actual values. The MAE records the average magnitude of error, pointing to the efficiency of the model in minimising prediction differences.
Figure 9 shows the correlation heatmap visualises the relationships between predicted and actual BMI-for-age z-scores over time. The high correlation between predicted and actual values across different time steps demonstrates the LSTM model's effectiveness in capturing the temporal dynamics of health outcomes.
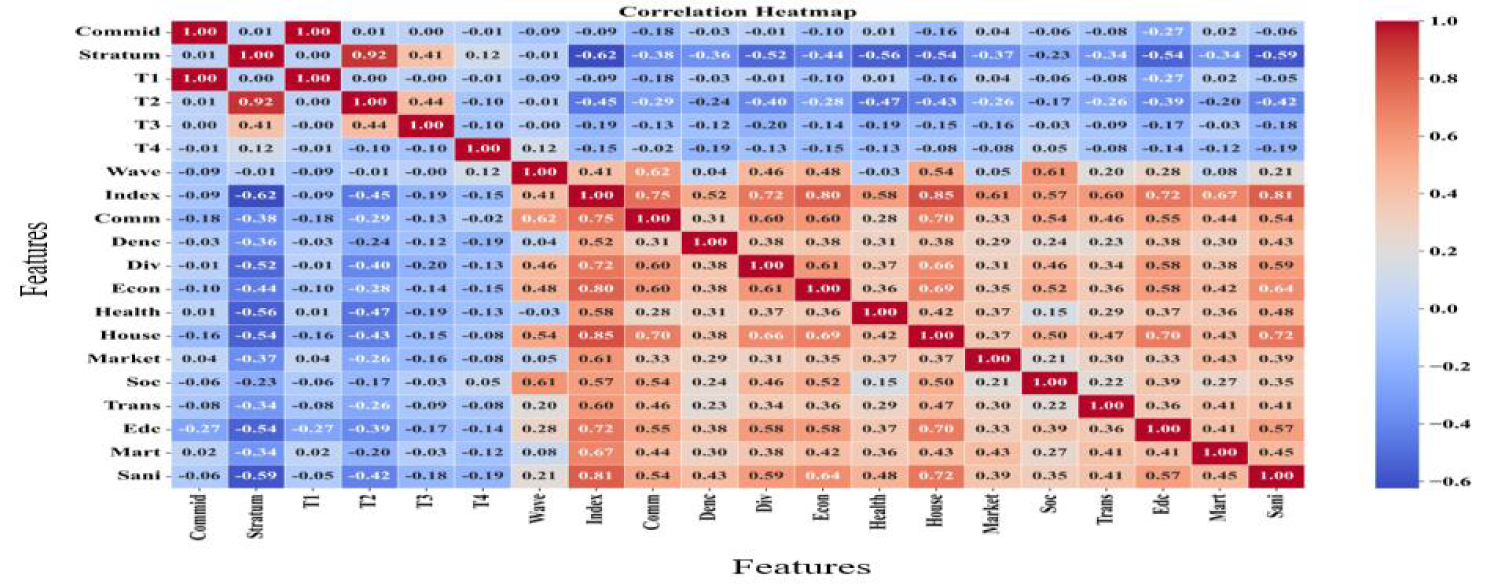
LSTM correlation heatmap.
Figure 10 compares the predicted BMI with the actual values. The close alignment of predicted and actual outcomes indicates the LSTM model's accuracy in forecasting nutritional trends and child health outcomes over time. The model successfully captures the changes in children's growth patterns, confirming its predictive power.
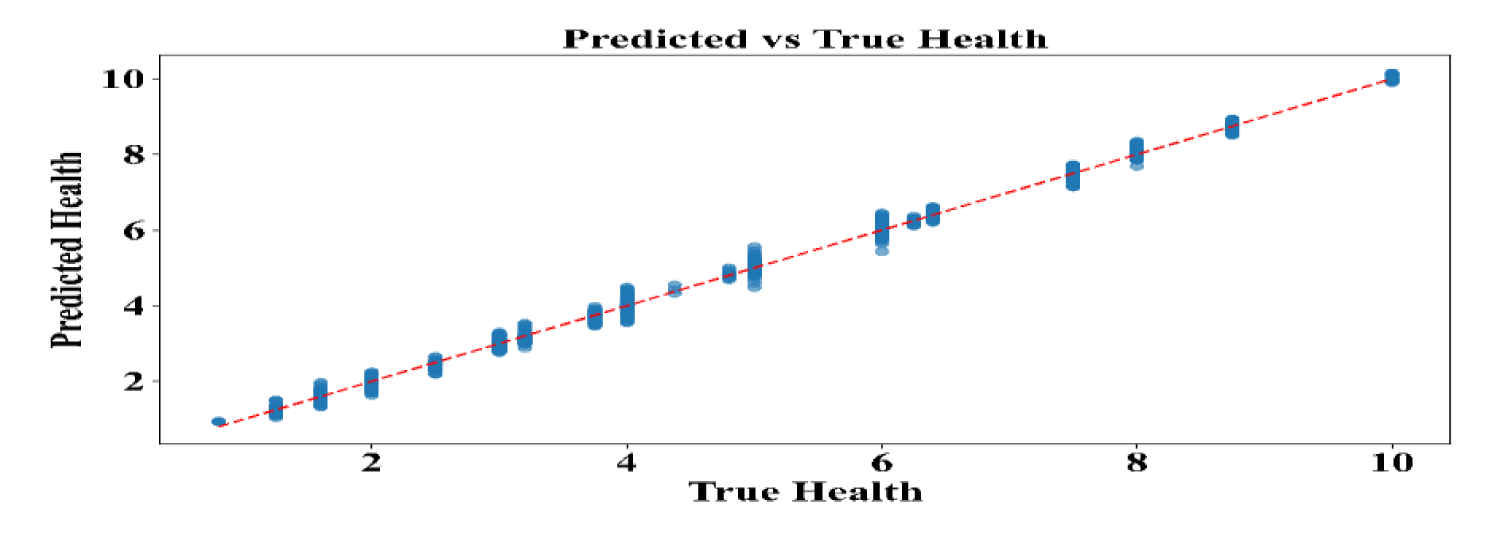
Predicted vs. actual health outcomes BMI.
SHAP was utilised for explaining the contribution of features to model predictions. The SHAP values assist in identifying the features that contribute the most towards predicting the health outcome, e.g., stunting.
The SHAP analysis, as shown in Figure 11, identifies the intake of dietary protein, calcium, and family income as the primary positive factors contributing to healthy outcomes. On the other hand, low parental education and a limited diet variety have a negative impact, increasing the risk of undernutrition. These elucidative insights reveal the model's predictions corresponding to nutritional determinants in the real world, thereby improving transparency and the relevance of the policy.
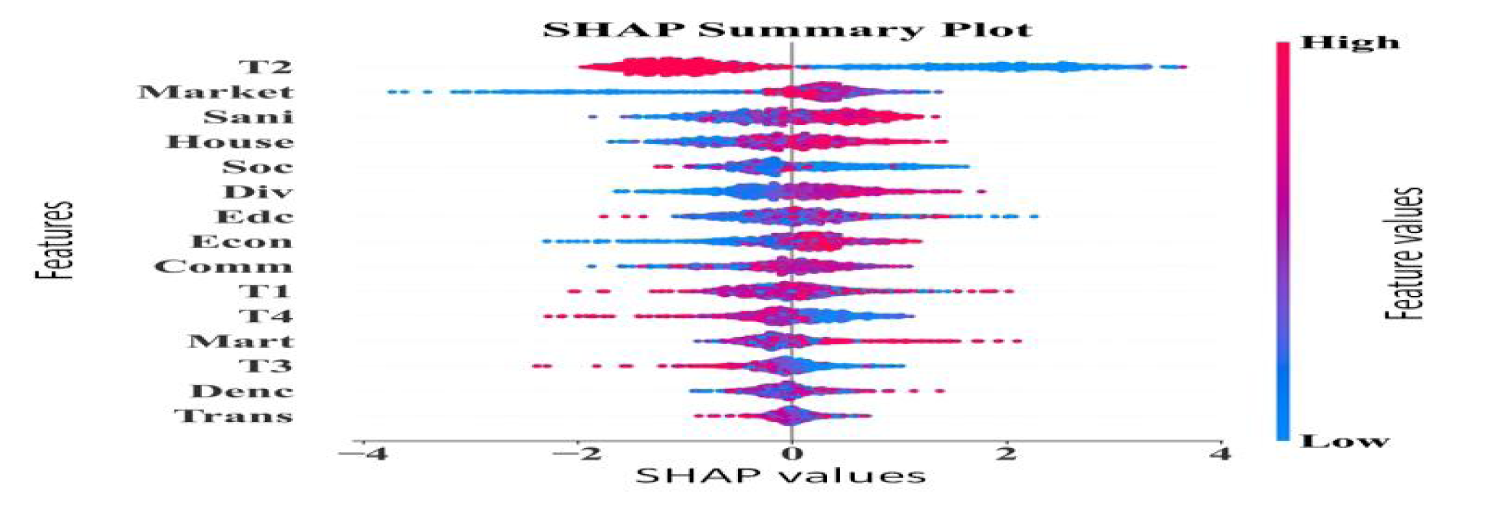
SHAP for feature contributions.
Figure 11 represents the SHAP values for all the features, indicating the positive and negative contributions of socio-economic factors and nutrition variables to the predictions. Features such as “T2 (Time 2 Nutritional Intake)” and “Market” have a significant positive impact on predicting healthy outcomes, whereas factors such as low family income are negative, driving the likelihood of malnutrition.
The SHAP analysis indicated low dietary protein, limited calcium intake, and low parental education as three main factors contributing to risk for the representative child predicted as “At risk of malnutrition”. On the other hand, the improvement of these features in the simulation led to a 41% decrease in the predicted probability, thus demonstrating the potential of SHAP explanations in guiding personalised nutritional interventions.
Discussion
Proposed research demonstrates that XGBoost and LSTM models of AI were able to accurately predict and forecast preschool health outcomes. XGBoost was used to classify children into “at-risk” and “normal” based on baseline features, and LSTM was used to extract longitudinal growth patterns. SHAP brought interpretability by determining the most important drivers like protein consumption, calcium, family income, and access to healthcare, making the predictions useful.
Performance comparison
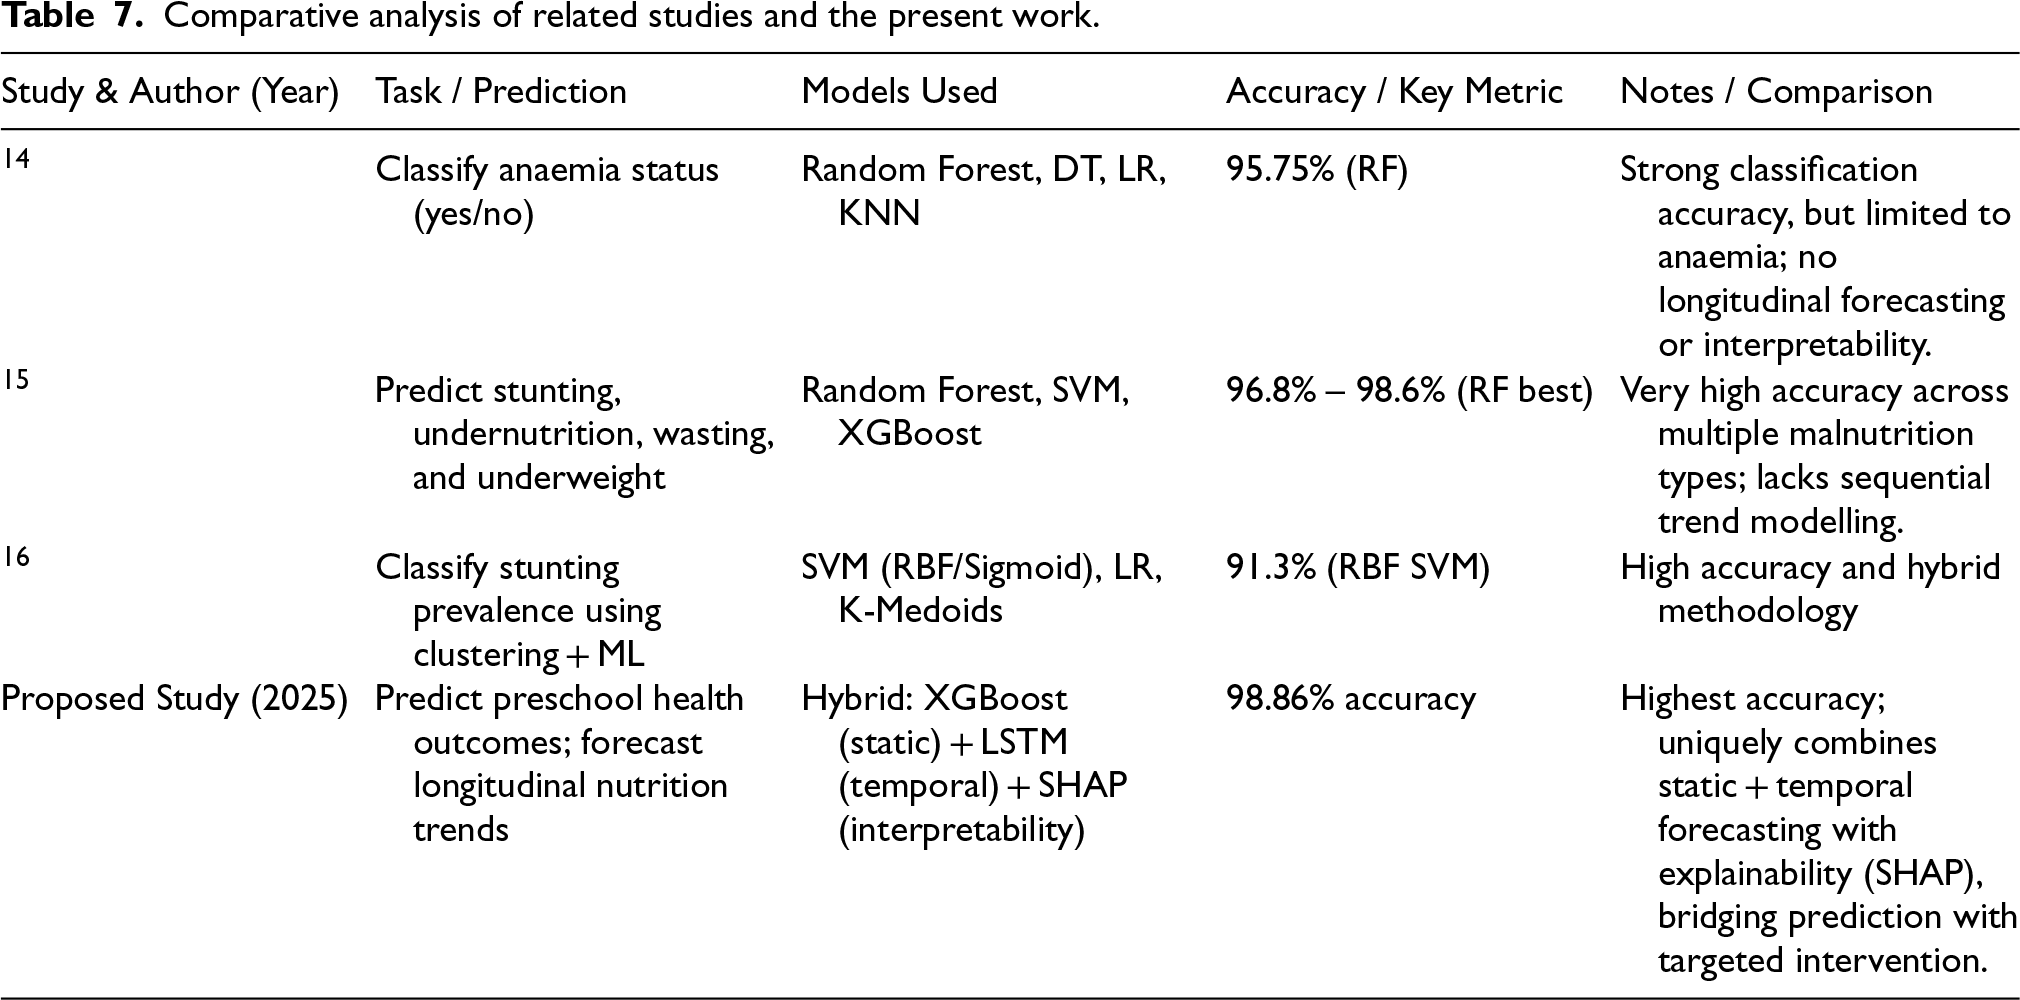
The new hybrid model is more accurate in prediction compared to the current research, with 98.86% compared to accuracies between 91.3% and 98.6% in the relevant work. Contrary to earlier research, which focused on static predictive tasks such as detecting anaemia or assessing the prevalence of stunting, the current study is the first to integrate XGBoost for static prediction, LSTM for forecasting temporal trends, and SHAP for interpretability. The combination not only enhances accuracy but also yields insights that can be acted upon, resulting in a more comprehensive model than existing machine learning models for early childhood nutrition interventions.
Table 7 presents a comparison of the recent studies (2023–2025) that employed machine learning in analyzing childhood health and nutrition outcomes. Although earlier works obtained robust classification accuracy, they were mainly restricted to static predictions. The current research sets itself apart by combining static and temporal modeling with SHAP-based interpretability, achieving the highest accuracy (98.86%) and providing actionable insights for targeted interventions. The implications for targeted interventions are immense.
Comparative analysis of related studies and the present work.
Comparative analysis of related studies and the present work.
The models can guide nutritional interventions and preventive programs by stratifying the at-risk groups such as children with low protein consumption or those from poor households. LSTM's forecasting capability allows for intervention before the negative outcomes manifest.
With respect to conventional approaches, the hybrid AI model has certain strengths. XGBoost identifies intricate non-linear interactions of features, LSTM extracts temporal patterns of health, and SHAP helps overcome the “black-box” issue by allowing predictions to be transparent and reliable. Together, these improve accuracy and real-world usability.
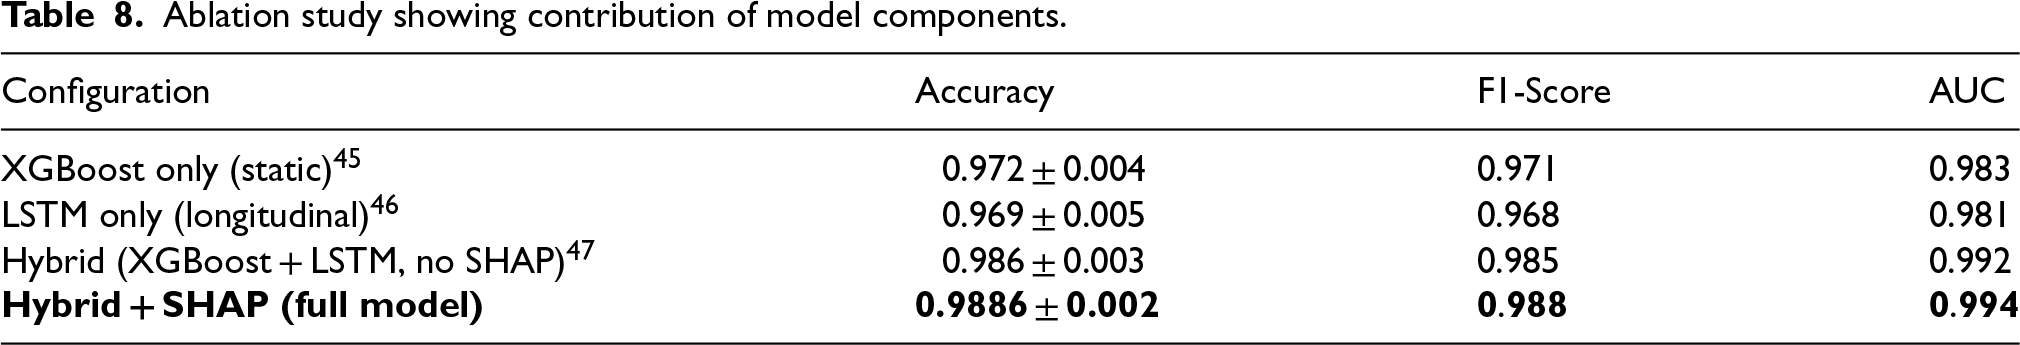
The evaluation metrics used in the experiments were the same, and the data splits were identical, allowing for the establishment of the contribution of each component through ablation studies.
The results of the experiments presented in Table 8 indicate that the static and temporal components, when combined, yield a performance enhancement of around 1.7% thus confirming the benefit of the hybrid design. SHAP adds interpretability but does not decrease the accuracy.
Ablation study showing contribution of model components.
Ablation study showing contribution of model components.
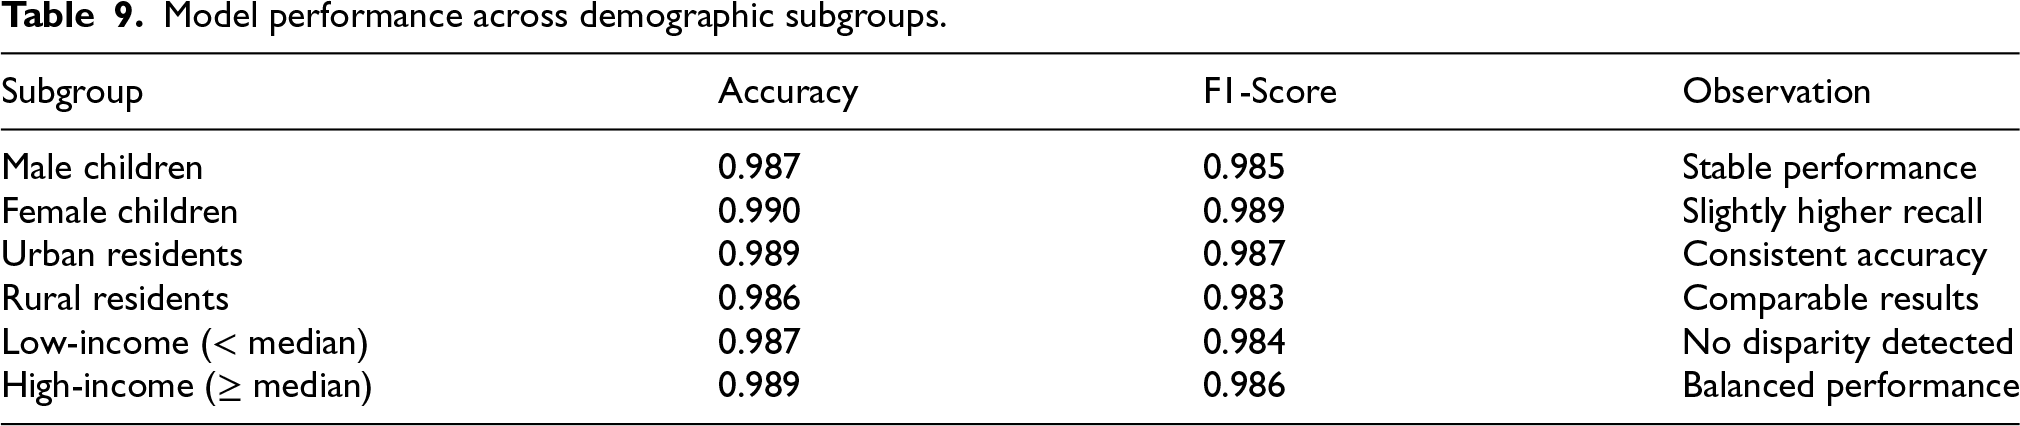
The distribution of the target labels was slightly skewed (At-risk = 31.4%, Normal = 68.6%). The use of class-weighted loss, along with stratified sampling, helped to overcome the problem of imbalanced classes. The macro-averaged metrics supported the performance as very good (Precision = 0.985, Recall = 0.983, F1 = 0.984).
According to the results in Table 9, there was hardly any difference in performance between the demographic groups defined by sex, residence, and income (p > 0.05, χ² tests), which implies that the model was fair and reliable across different demographics’ general usage.
Model performance across demographic subgroups.
The CHNS data also contain some spikes between survey waves, which would influence the capacity of the LSTM model to identify persistent longitudinal patterns.
Political fluctuations, food supply shocks, or unobserved environmental factors could influence child health outcomes, and these cannot be captured in the data every time.
Conclusion and future work
The problem of malnutrition in children and growth issues among preschoolers was tackled by this study using a hybrid AI model on the CHNS data. The overarching goal was to create predictive and explainable models that would label present health risks and predict future nutritional patterns in order to facilitate early, targeted interventions.
Results show that XGBoost performed well in static health outcome prediction, with 98.86% accuracy in the classification of children into “at-risk” and “normal” groups. LSTM is highly effective in generating longitudinal nutritional trajectories, with predicted BMI-for-age z-scores exhibiting a strong correlation with actual values and achieving very low RMSE scores. The SHAP analysis significantly contributed to the understanding of the model by revealing the most important factors, including protein consumption, calcium intake, and household income, which collectively influenced preschool health through nutrition and socioeconomic conditions, ultimately leading to healthier children.
Temporal generalisation was established using a time-based hold-out: models trained on data from 1991 to 2011 were then verified on 2015 records, which were new to the models, and the accuracy obtained was 97.2%. This demonstrates not only the predictive power for future survey periods but also for future studies.
However, it is doubtful if external datasets that are comparably valid will be available, thus, the wider cross-regional validation will be a key research direction in the future. Even though the results were promising, some limitations still need to be discussed. The CHNS dataset, despite being very comprehensive, could be a subjective representation of the regional or cultural characteristics within China, thus, the results may not be as generalisable as they could be. The time lags between survey waves made it difficult to use sequential modelling, and SHAP computations were quite costly, which could slow down large-scale applications.
Further trials using the model on more extensive and diverse groups of subjects should be carried out, taking into account additional contextual elements such as parents’ health-related behaviours and food conditions at the community level, and also looking into timely data from wearable sensors for continuous monitoring. In the end, these technological advancements would make possible the application of more exact and evidence-based nutrition interventions and would also support the fight against child malnutrition by enabling preventive measures to be enacted at an earlier stage.
The recently introduced framework has elevated the level of experimental transparency, power, and fairness through the incorporation of detailed dataset descriptions, ablation analyses, and subgroup evaluations. The reliability assurance obtained by repeating the cross-experiments with the addition of confidence intervals significantly contributes to reliability, whereas good documentation and code access support reproducibility. All these developments have strengthened the impact of research on explainable AI and its application in public health decision-making based on evidence.
While the model achieves high accuracy, the focus on CHNS data may limit its generalizability to other regions. Future research should test the framework on datasets from multiple countries, further develop dietary diversity indices, and assess real-time adaptability with wearable health sensors to enhance practical testing.
Footnotes
Authors’ contributions
Xinming Zhang is responsible for designing the framework, analysing the performance, validating the results, and writing the article.
Funding
The author received no financial support for the research, authorship, and/or publication of this article.
Conflicts of interest
The author declared no potential conflicts of interest with respect to the research, authorship, and/or publication of this article.
Data availability statement
The research utilises data from the CHNS dataset, a publicly accessible longitudinal dataset. All data analysed in this research are available upon request from the survey organisers. Processed variables used for modelling can be shared by the authors on reasonable request.
Code availability
All Python scripts (data preprocessing, model training, evaluation, and SHAP analysis) will be made publicly accessible through GitHub as soon as the article is accepted. The random seeds, software versions, and configuration files are thoroughly documented to enable reproducibility and independent verification.