
Abstract
The paper presents indicators of the impact of tourism on the labour market, reflecting both employment in the tourism industries and tourism employment, i.e., labour directly attributable to tourism demand in the economy as a whole. A detailed analysis is provided for 2019, the year before Covid; the results, reflecting formal employment, for the period 2011 to 2020 show the evolution over time and the impact of Covid. Between 2011 and 2019, the number of persons employed in tourism industries grew at an annual rate of 9.1% and that of tourism employment at an annual rate of 11.6%. In 2019, there were 810.000 persons employed in the tourism industries and 427.000 in tourism employment. Accommodation and food- and beverage service activities accounted for nearly 76% of tourism employment. In 2020, the Covid year, employment in the tourism industries and tourism employment fell by 16.4% and 31.7%, respectively, reflecting the impact of travel restrictions due to Covid.
Keywords
Introduction
Tourism Satellite Accounts (TSA) aim at measuring the contribution of tourism from both the demand side (as acquisition of consumer goods and services by visitors) and the supply-side (as supply of goods and services which visitors purchase or otherwise obtain for consumption purposes). TSA compiles a system of tables that quantify both internal tourism consumption and domestic supply (TSA Tables 1 to 6) and, on this basis, allows evaluating the contribution of tourism to the country's economy, including TDGVA and TDGDP, the part of Gross Value Added (GVA) and Gross Domestic Product (GDP), respectively, that is directly triggered by tourism, and the employment in tourism industries (i.e. TSA Table 7: Employment in the Tourism Industries).
For the EU and EFTA member states, the 2019 TSA in Europe report 1 provides data on the coverage of the TSA tables by the participating countries. For the core TSA Tables 6 and 7, 86% and 46% of the countries provided the indicators, respectively. This disparity can be attributed to the extensive data collection done by countries on tourism consumption, compared to the limited availability of data on employment in tourism industries.
Greece remains one of the few countries in Europe without an official TSA, mainly due to insufficient data and lack of adequate resources. TSA Tables 1 to 4 were implemented in 2016–17 for the reference year 2015 as part of an experimental project funded by the European Commission's Structural Reform Support Service (Hatzimarinakis and Hackl2,3). Preliminary results of TSA Table 6 for the years 2010 to 2020 have been published by Hackl and Hatzimarinakis. 4 The analysis of this paper complements these previous findings and provides TSA Table 7, including estimates of tourism employment for the period from 2011 to 2019, as well as the Covid year 2020. These findings address the need for statistical information among policy-makers, the tourism industries, and academics, recognising the strategic importance of tourism in Greece.
TSA Table 7 “Employment in the tourism industries” provides a detailed picture of employment in the tourism industries, i.e. establishments whose main output is a tourism characteristic product (see
5
; hereafter referred to as IRTS 2008). Measurements of employment in the tourism industries are indicators of its volume such as
the number of jobs the number of hours worked the number of full-time equivalent jobs. covers all jobs provided by tourism industries although not all volume of employment found in these industries corresponds to tourism consumption; however, does not cover employment in other industries that partly is serving tourism consumption.
The employment indicators are shown in total and in breakdowns by the status in employment (employees, self-employed) and by gender. TSA Table 7 also contains the number of establishments in each tourism industry. The quantification of employment used in TSA Table 7
It should be noted that TSA Table 7 does not highlight seasonality or spatial variations, which would be part of sub-annual and -national accounts, nor provides any information on black or illegal labour, mainly due to lack of data. It also does not measure indirect employment but could provide the basis for such calculation.
The number of jobs represents the demand-side of labour in terms of the number of posts provided by the establishments. The supply-side of labour is characterised by the number of persons employed, that is individuals, both employees and self-employed, who supply their labour in return for remuneration. As a person may have two or more jobs and a job may be covered by more than one person working part-time, the number of jobs provided by the tourism industries may differ from the number of persons employed who supply their labour for the provided posts; therefor the demand- and supply-side of labour vary in coverage and usually do not coincide; see chapter 7 of IRTS 2008. Depending on the intended use of the indicators and the availability of data, the volume of employment may be measured either as the number of jobs in tourism industries or as the number of persons employed in tourism industries.
An alternative to employment in the tourism industries, the concept of TSA Table 7, is tourism employment, which measures the number of persons employed or of jobs that are directly attributable to tourism demand in the entire economy, i.e. both in tourism and non-tourism industries. Employment engaged in a secondary non-tourism characteristic activity of a tourism industry is part of the employment in the tourism industries but not of tourism employment, whereas employment engaged in an activity of a non-tourism industry serving tourism demand, e.g. supermarket, pharmacy, grocery etc., is part of tourism employment but not of employment in the tourism industries.
Whereas the TSA Table 7 of TSA:RMF 2008 6 focuses on employment in the tourism industries, the employment module of the OECD 7 and the Human Resource Module of the Canadian TSA 8 have not one but several tables, are more elaborated and explore more details of employment in tourism industries and the tourism employment specifics. Consequently, countries have established different kinds of estimation on tourism employment; some countries have compiled TSA Table 7, others compiled it partially, others compiled employment with some other kinds of breakdown. Some countries estimate also indirect effects of employment.
In Greece, without an official TSA, the reported employment mainly pertains to the hotel sector (I55 of NACE rev.2), in some cases in combination with the food service sector (Section I); cf.9,10,11 Other reports are based on assumptions about the tourism share of employment (restricted to primary jobs) in branches that cater both tourism and non-tourism demand; 12 tourism-related employment in the food, sports, recreation, and retail sectors is estimated by calculating the percentage of enterprises engaged in those activities in regions with the highest tourism demand, compared to the total number of enterprises of their respective branches nationwide.
The OECD dataset on tourism-related employment in Greece uses the layout of TSA Table 7. However, due to selected data sources (Labour Force Survey), only the primary jobs are reported, which are not expressed in full-time equivalents and provide a limited breakdown of economic activities (including activities other than those identified as tourism characteristic in IRTS 2008, such as catering). Moreover, the coverage of tourism-related establishments is very limited and therefore does not correspond to the reported volume of employment; the Register of Tourism Enterprises (https://mintour.gov.gr/meletes-pinakes/stoicheia-mite/), which is used as a source for the number of establishments, only includes licenced tourism enterprises such as tourist offices, car rental offices, motorcycle rental companies. In addition, the OECD data do not cover tourism employment.
The TSA Table 7 presented in this paper provides, from a supply-side perspective, estimates of actual employment (i.e. including both primary and secondary jobs) in the tourism industries, as defined in IRTS 2008 (Annex 3), and also estimates of tourism employment are shown. The Supply Use Tables, the Statistical Business Register and the Structural Business Statistics are the most relevant, comprehensive in coverage and detailed data sources for the implementation of TSA Table 7 and for the estimation of tourism employment. The main problem in measuring employment is the lack of detail and the inconsistency of data sources.
Section 2 of the paper provides an overview of the data required. Section 3 explains how the table entries are calculated, given the prevailing data problems; particular reference is made to the Covid impact on tourism-related employment. Section 4 discusses the results.
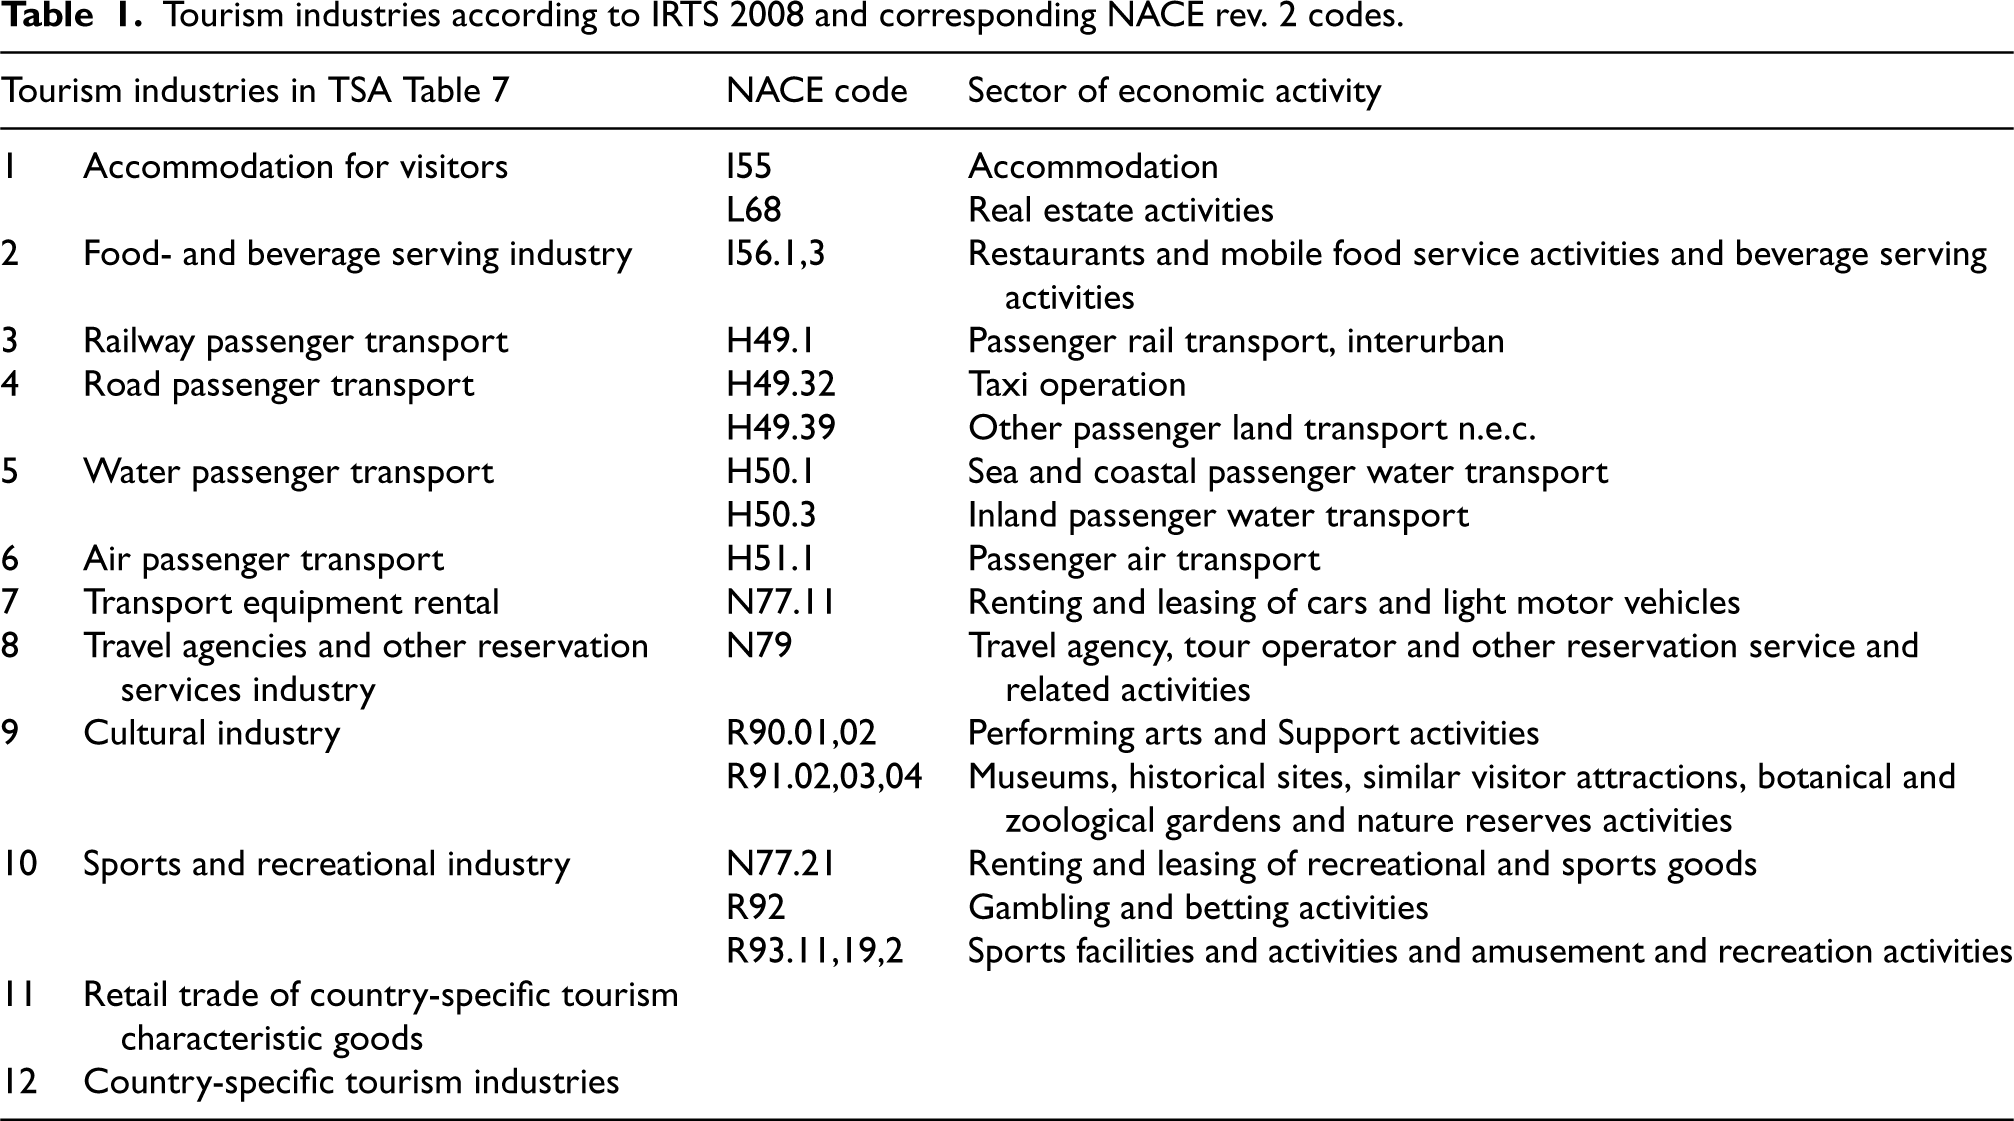
Table 1 shows the tourism industries together with the corresponding NACE rev 2 codes of economic activities; the tourism industries are defined at the 4-digit level as specified in Annex 3 of IRTS 2008; references to activities at the 2- or 3-digit level indicate that all 4-digit industries included produce one or more tourism characteristic products. It should be noted that IRTS uses ISIC codes while Table 1 refers to NACE codes; there are only minor differences between these codes, such as the split of ISIC group 551 into NACE groups 55.1 and 55.2.
Tourism industries according to IRTS 2008 and corresponding NACE rev. 2 codes.
Tourism industries according to IRTS 2008 and corresponding NACE rev. 2 codes.
Data sources on employment in economic entities of the tourism industries are
the Statistical Business Register (SBR), the national register of enterprises, the Structural Business Statistics (SBS), the Labour Force Survey (LFS), the Supply and Use Tables (SUT). SBR is a fully and comprehensive, annually updated and structured national register of the active population of legal and statistical units that produce goods and services. It is mainly based on data obtained from administrative sources (the Independent Authority for Public Revenues and the Social Insurance Institute), supplemented by small scaled statistical surveys conducted on large enterprises of each economic class, and is informed by the results of SBS data. SBR is the basis for estimating National Accounts data and the sampling frame for statistical surveys of enterprises. Besides identification and demographic characteristics, it contains – among the economic characteristic – the NACE-code and the annual average number of persons employed, data that are relevant for TSA Table 7; see.
13
SBS is an annual survey that provides a comprehensive picture on the structure, the performance, and the main features of the enterprises. It is mainly based on administrative, tax sources (the Independent Authority for Public Revenues and the Electronic Earnings Attestations), statistical surveys conducted on large enterprises as well as SBR; the results include labour input related variables such as number of persons employed and number of employees. Like SBR, SBS is used as a source for the compilation of the National Accounts, particularly of the GDP, with the calculation method from the production, the expenditure and the income side; see.
14
LFS is a quarterly rotating household sampling survey, the main purpose is to provide information about the labour market such as the numbers of employed, unemployed and economically inactive persons. The survey results are not detailed enough to draw conclusions about the number of persons employed in tourism characteristic branches. However, LFS collects variables that are relevant for TSA Table 7, such as demographic characteristics (gender) and characteristics of the main job (status in employment). SUT is a national accounting framework created by statistical synthesis that describes how domestically produced and imported goods and services become available in the economy and how these are used in a certain period of time. A key issue is the breakdown of statistics and survey results in terms of the economic activities. The SBR reports statistics for 4-digit classes of legal units, which corresponds to the level of detail in the specification of the tourism industries in IRTS 2008. However, the SBS only reports values for 3-digit groups of enterprises and does not cover section R (Arts, Entertainment and Recreation). The concept of employment that is used in SBS and SBR does not take into account non-formal employment, undeclared work, etc., forms of employment that may be prevalent in some industries such as accommodation and food service. SBS and SBR employment statistics do not take into account the seasonal nature of tourism SBS and SBR rely heavily on the accuracy and completeness of the data provided by the administrative sources. LFS provides data only at the 2-digit NACE code level, which is insufficient for the classification requirements of TSA. In addition, it only provides information on the primary job, so it does not include additional jobs that are typical in tourism due to high season. SUT reports at the 2-digit level of analysis for products and activities, thus providing a broader coverage of tourism industries themselves; at this level only tourism-related industries can be identified, which include non-tourism-related activities (e.g. freight transport and rental of household equipment).
The compilation of TSA Table 7 is based on these data sources, which are periodically updated and published by ELSTAT. More specifically,
Regarding the requirements of implementing the TSA Table 7, limitations of the data sources restrict the accuracy of the statistics shown in the table.
Employment data, in particular hours worked by industry, are reported in the Supply and Use Tables (SUTs) published by ELSTAT. However, it must be mentioned that GVA and output values reported in SUTs show substantial deviations from respective values provided in SBS. This is the result of the usage of additional sources to estimate SUT entries and of the necessary reconciliation process between the demand and supply-side. To give an example: For 2019 and Section I (Accommodation and Food service activities), SUT reports total output of 23,688 and GVA of 11,654 mio Euros, while in SBS the production value and the VA at factor costs are 13,445 and 4,749 mio Euros, respectively. Such discrepancies exist in all industries, albeit smaller in most cases. They may be an indication of undeclared or informal employment in SBS. Without reconciliation of SUT and SBS, the compilation of the TSA Table 7 is based on the establishment-based and household-based surveys mentioned.
Another limitation concerns employment that may be generated by the peer-to-peer economy, such as renting private accommodation or private transport via Uber, which is not covered by the employment statistics of the aforementioned data sources.
This section describes how tourism employment is estimated and TSA Table 7 is compiled. Due to the limited availability of data, statistical estimation methods are used to impute or substitute non-available data; the applied methods are presented for each type of data.
For implementing the TSA Table 7, the number of establishments, of employed individuals, of hours worked, of full-time equivalent persons employed and related details such as the status in employment etc. are required for the tourism industries as listed in Table 1. Limitations of these data are related to the employment breakdowns by industry which do not have the required level of details.
For measuring tourism employment, employment related to tourism demand is not available in the supply-side statistics: The supply of most establishments and of the branches in general is only partly consumed by visitors; other parts are used by residents for their daily needs (e.g. Food and Beverage Services, Transportation). Some establishments of tourism industries might also supply secondary products which are not consumed by visitors and primary products of non-tourism industries might be consumed by visitors.
In this situation, the number of persons employed and related characteristics in both the tourism and non-tourism industries are estimated using statistical analysis methods. Estimation is based on tourism demand. In this approach, the tourism ratio plays an important role, i.e. the ratio between the total value of the tourism consumption and the total value of the output of a given industry. Such an approach is used in developed TSAs such as that of Canada 15 and of UNWTO and ILO. 16 Hackl and Hatzimarinakis 4 apply the methodology proposed by UNWTO 17 for estimating tourism direct GDP with limited data to the case of Greece; the derived tourism ratios of the tourism-related products and industries are based on tourism expenditure collected through visitor surveys and supply reported in the Supply and Use Tables published by ELSTAT. The so obtained tourism ratios for the years 2011 through 2020 will be used as a basis for estimating employment as a supplement to TSA Table 7.
As a first step, the available data for the number of establishments and the number of persons employed are presented and discussed. These data are then compiled into TSA Table 7 and the main results analysed. It should be noted that, given this data situation, the compilation only results in a preliminary TSA Table.
Establishments in tourism industries
According to the System of National Accounts, 18 , para. 5.14 “an establishment is an enterprise, or part of an enterprise, that is situated in a single location and in which only a single productive activity is carried out or in which the principal productive activity accounts for most of the value added”. Also, “an enterprise is the view of an institutional unit as a producer of goods and services”, 18 para.5.1. The former may correspond to a single shop or a store providing goods or services in a particular location, and the latter to a legal entity that might be comprised of more than one establishment in the same or different location carrying out one or more economic activities. A legal unit, that is a separately identified entity obliged by law to declare income for tax purposes, may possess or be part of one or more enterprises.
Both the SBR and the results from the SBS contain variables characterising economic entities. The SBR has the number of legal units, together with turnover and total employment, for up to four-digit branches of economic activities of NACE. The results of SBS contain the number of enterprises together with a wide range of other business statistics for three-digit branches. Even though different in coverage, for purpose of simplicity both legal units and enterprises are onwards referred to as establishments; practically, in the vast majority of cases these three notions coincide, as small family businesses comprise the backbone in tourism business and the wider economy. SBS coverage may also differ from that of SBR as the latter includes enterprises that are in a transitional status of starting or closing an operation, as well as enterprises of a specific form or legal units which are out of SBS scope; see, 14 , para. 13.3.1.
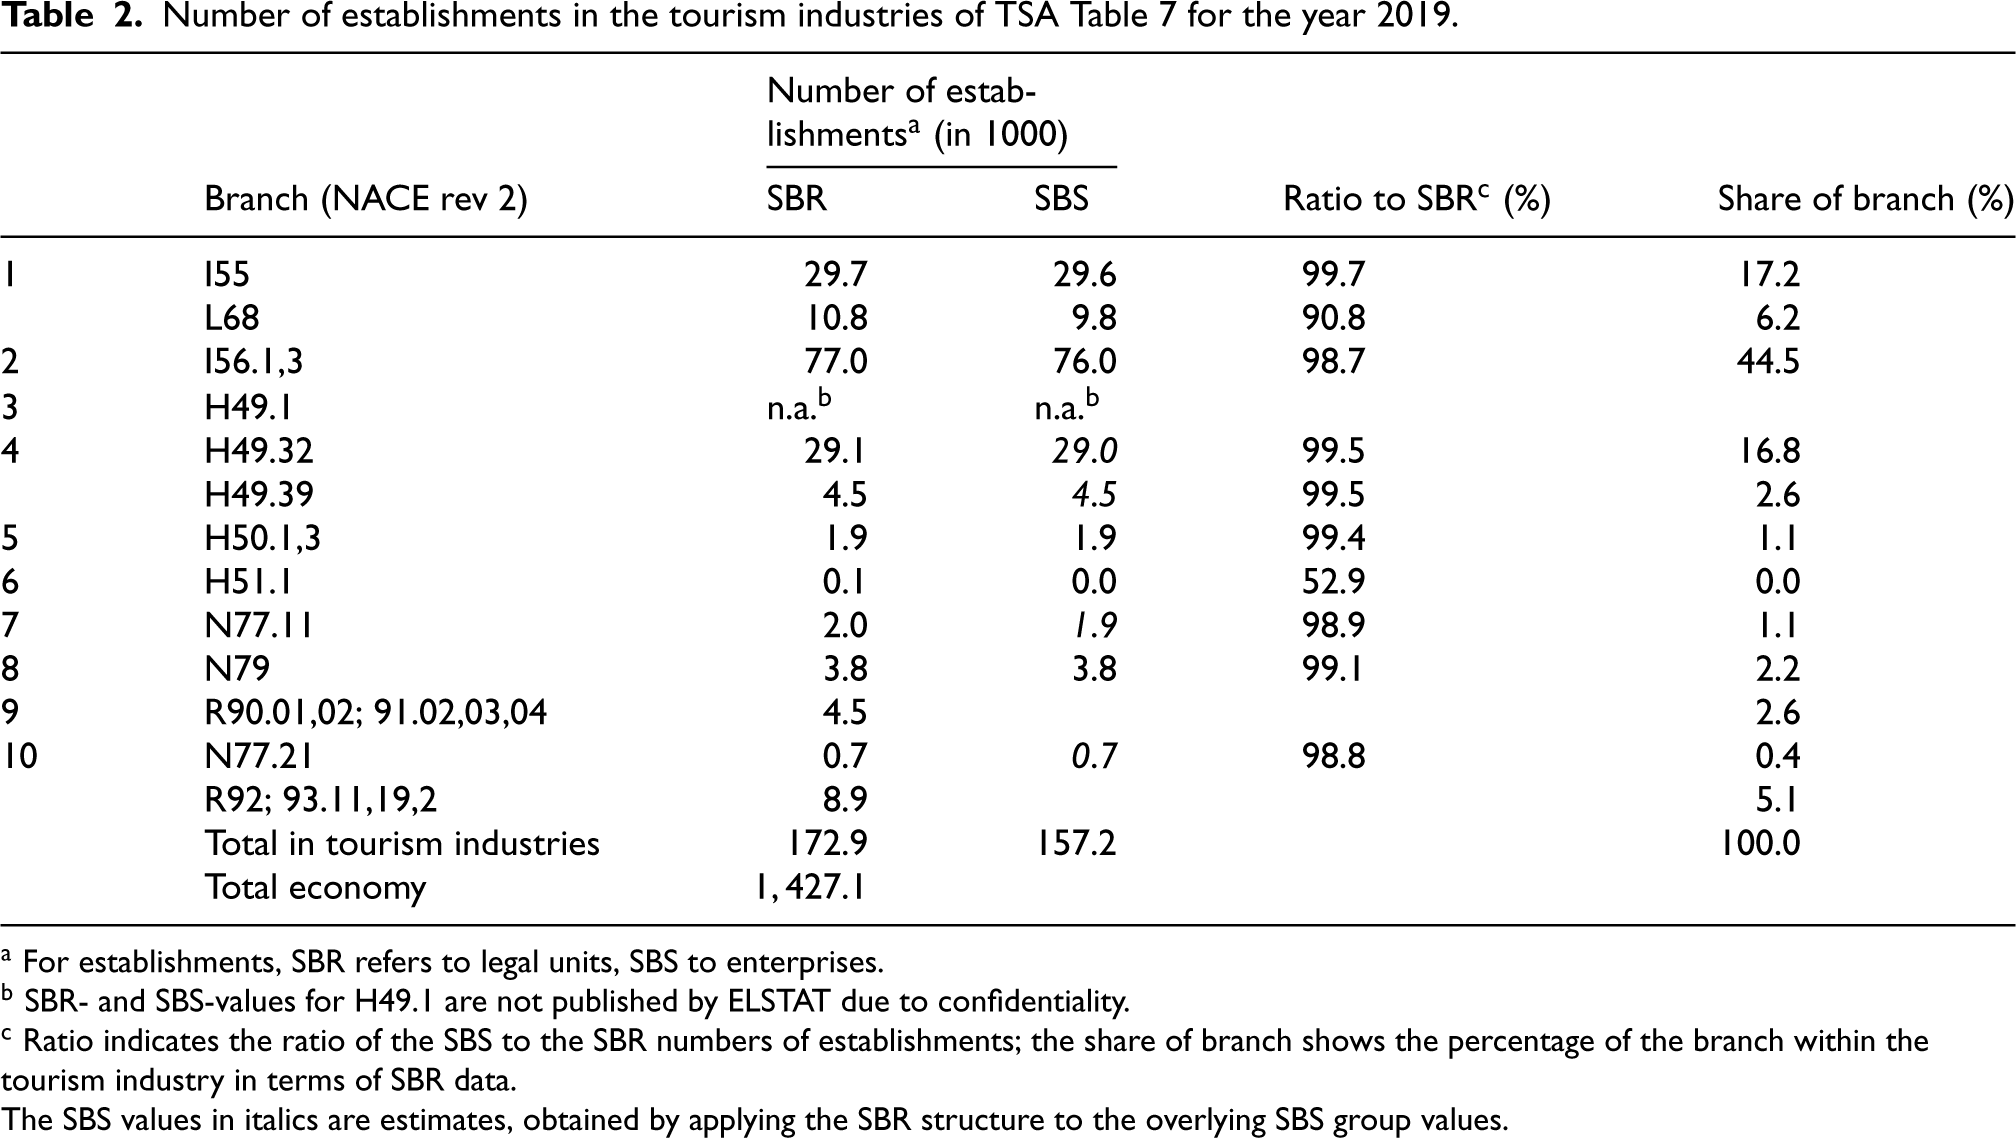
Keeping the above in mind, Table 2 shows the number of establishments that are available in the SBR and in the SBS reports for 2019. The SBR does not report the number of establishments in the group H491 (Passenger rail transport) due to confidentiality reasons. Due to a slightly different coverage of economic entities (legal units and enterprises, respectively), the values of SBR and SBS are not identical, but the ratios between the SBR and SBS values are in most cases close to 100%.
Number of establishments in the tourism industries of TSA Table 7 for the year 2019.
Number of establishments in the tourism industries of TSA Table 7 for the year 2019.
a For establishments, SBR refers to legal units, SBS to enterprises.
b SBR- and SBS-values for H49.1 are not published by ELSTAT due to confidentiality.
c Ratio indicates the ratio of the SBS to the SBR numbers of establishments; the share of branch shows the percentage of the branch within the tourism industry in terms of SBR data.
The SBS values in italics are estimates, obtained by applying the SBR structure to the overlying SBS group values.
The numbers of establishments shown in Table 2 refer to the affiliation of the establishments to the NACE categories. These values do not take into account that some categories contain establishments which may not primarily supply for tourism demand. E.g. the establishments of the branch Food and beverage service activities not only serve visitors but also the resident population in their daily activities.
The values in Table 2 are subject of limited availability of values in the pertinent ELSTAT reports. Whereas the SBR reports values for 4-digit classes of establishments, the SBS reports values only for 3-digit groups. To illustrate the consequences: In Sports and recreational industry, establishments of the category N77.21 (Renting and leasing of recreational and sports goods) are tourism relevant. In Table 2, the category N77.2 (Rental and leasing of personal and household goods) is substituted for N77.21 for which the number of establishments is not available in SBS. In SBR, 45.7% of N77.2-establishments are in N77.21, and this percentage is used to estimate the corresponding SBS value. For Cultural industry and most of Sports and Recreational industry, SBS does not report data.
In terms of SBR data, the number of establishments in tourism industries, about 173,000, is 12.1% of that in the total economy. It should be noted that only three branches contain 79% of establishments: Restaurants and mobile food service activities and beverage serving activities, Accommodation (not including L68 corresponding to private accommodation provided by natural persons) and Taxi operations account for 44.5%, 17.2% and 16.8% of the 173,000 establishments, respectively.
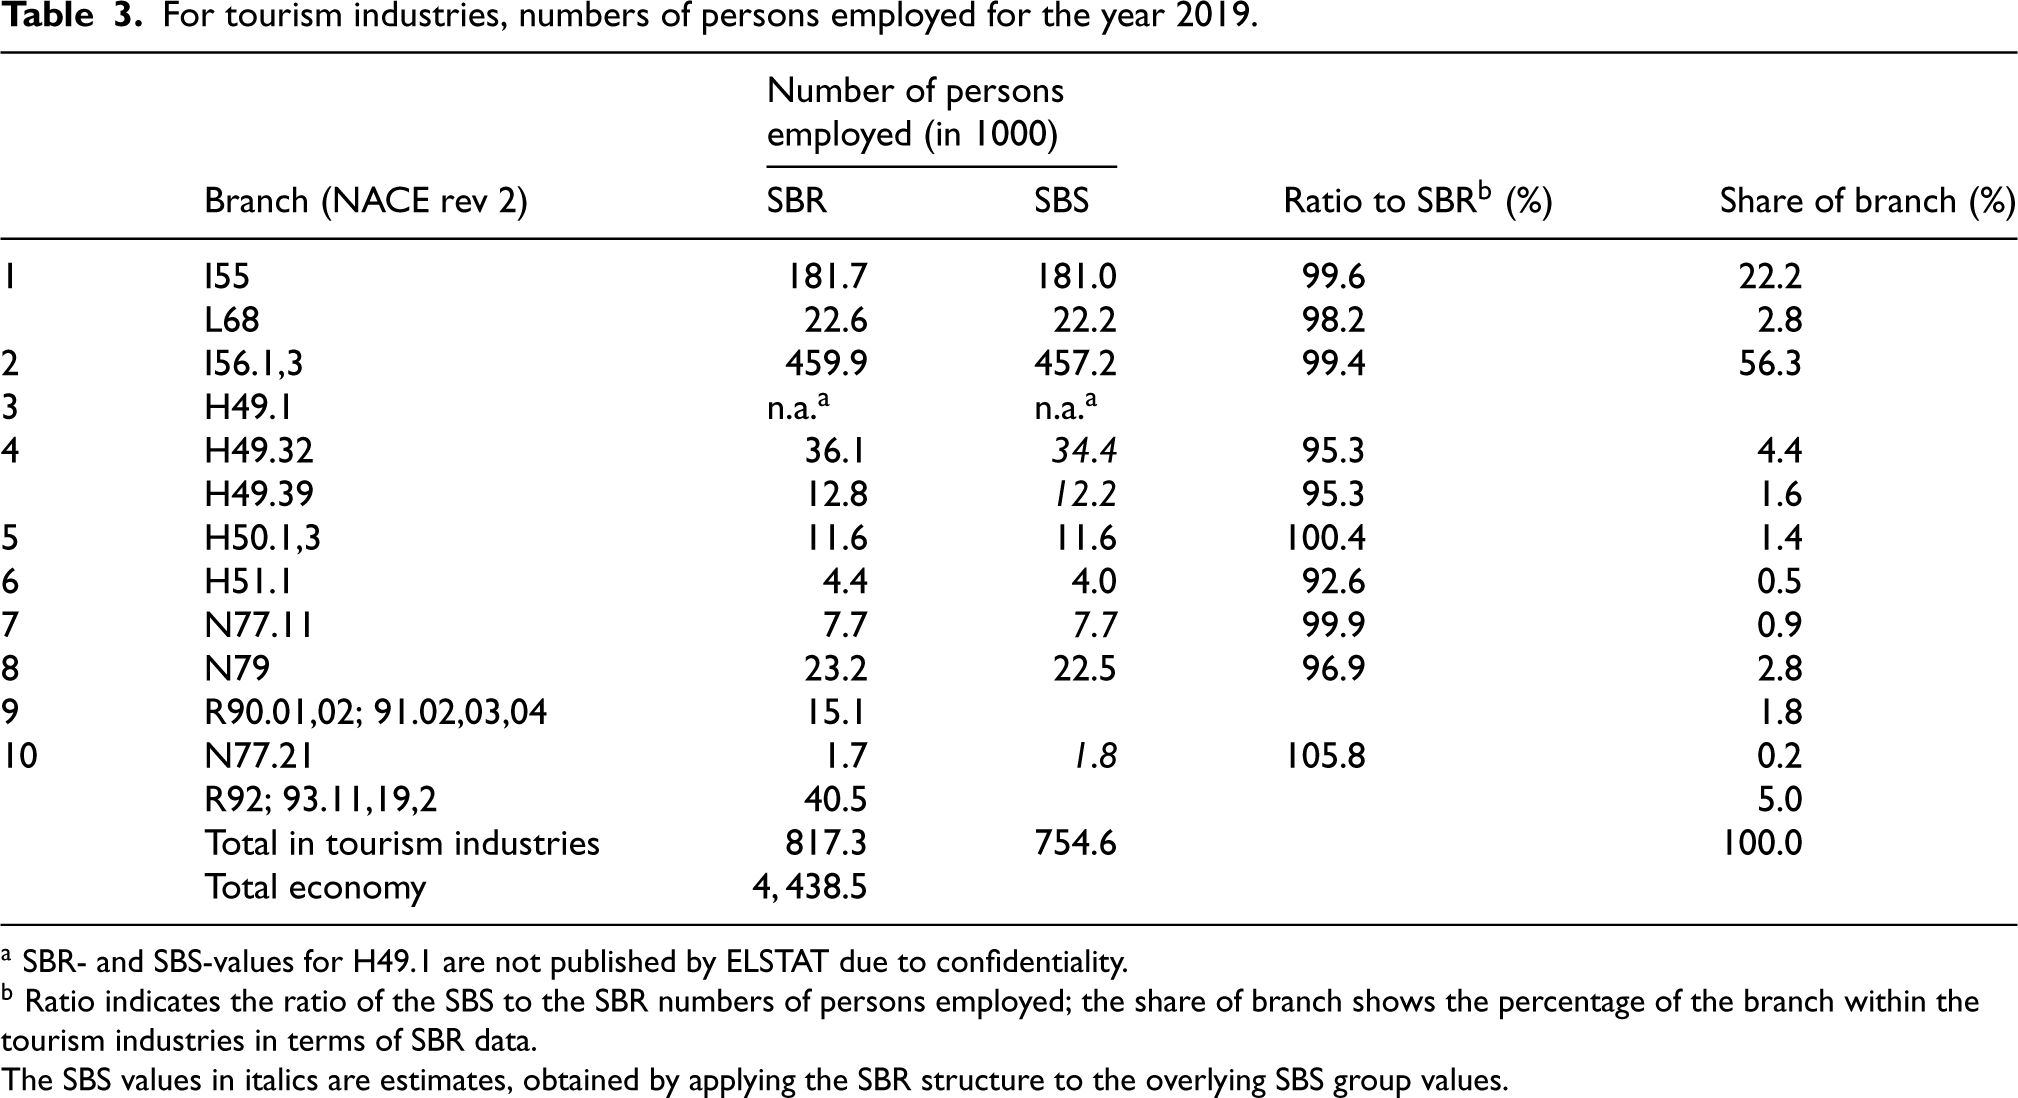
Data on employment that can be used for implementing TSA Table 7 are available in SBR and in the reports of SBS surveys. SBR contains the total persons employed for up to four-digit branches of economic activities. The SBS contains, besides the number of persons employed, the number of employees for up to three-digit branches; no values are reported for branches in R90-93. For both SBR and SBS, the number of persons employed is indicated in terms of average annual employment. Table 3 gives a comprehensive picture of the employment in the tourism industries. The numbers of persons employed according to SBR and SBS are similar in most cases.
For tourism industries, numbers of persons employed for the year 2019.
For tourism industries, numbers of persons employed for the year 2019.
a SBR- and SBS-values for H49.1 are not published by ELSTAT due to confidentiality.
b Ratio indicates the ratio of the SBS to the SBR numbers of persons employed; the share of branch shows the percentage of the branch within the tourism industries in terms of SBR data.
The SBS values in italics are estimates, obtained by applying the SBR structure to the overlying SBS group values.
In terms of SBR data, the number of persons employed in the tourism industries, about 817,000, is 18.4% of that in the total economy. Very similar results can be expected for SBS data: The number of persons employed for which SBS data are shown in Table 3 are about 761,700 and 754,600 for SBR and SBS, respectively; the ratio between the two is 99.1%.
The fact that a person is employed in a tourism industry does not mean that the employed person contributes to the supply of that industry for tourism demand. Branches contain establishments which may not primarily supply for tourism demand; the supply of establishments may only partly be consumed by visitors, whereas other parts may be used by residents. On the other hand, persons employed in non-tourism industries may contribute to meeting tourism demand. Section 3.3 provides TSA Table 7, presenting employment in tourism industries; Section 3.4 provides a picture of tourism employment in the Greek economy, i.e. employment which is directly attributed to tourism, whether belonging to a tourism or a non-tourism industry.
TSA Table 7 provides statistics on employment in tourism industries, where either the total supply of a tourism industry is consumed by visitors or the tourism industry serves both visitors and non-touristic consumers. The case that tourism consumption relates to a non-tourism industry is not relevant for the TSA Table 7 but will be considered in Section 3.4 that is dealing with tourism employment, i.e. employment which is directly attributed to tourism demand.
TSA Table 7, shown in Table 4, is compiled for the year 2019 and contains for the tourism industries
TSA Table 7 for the year 2019.
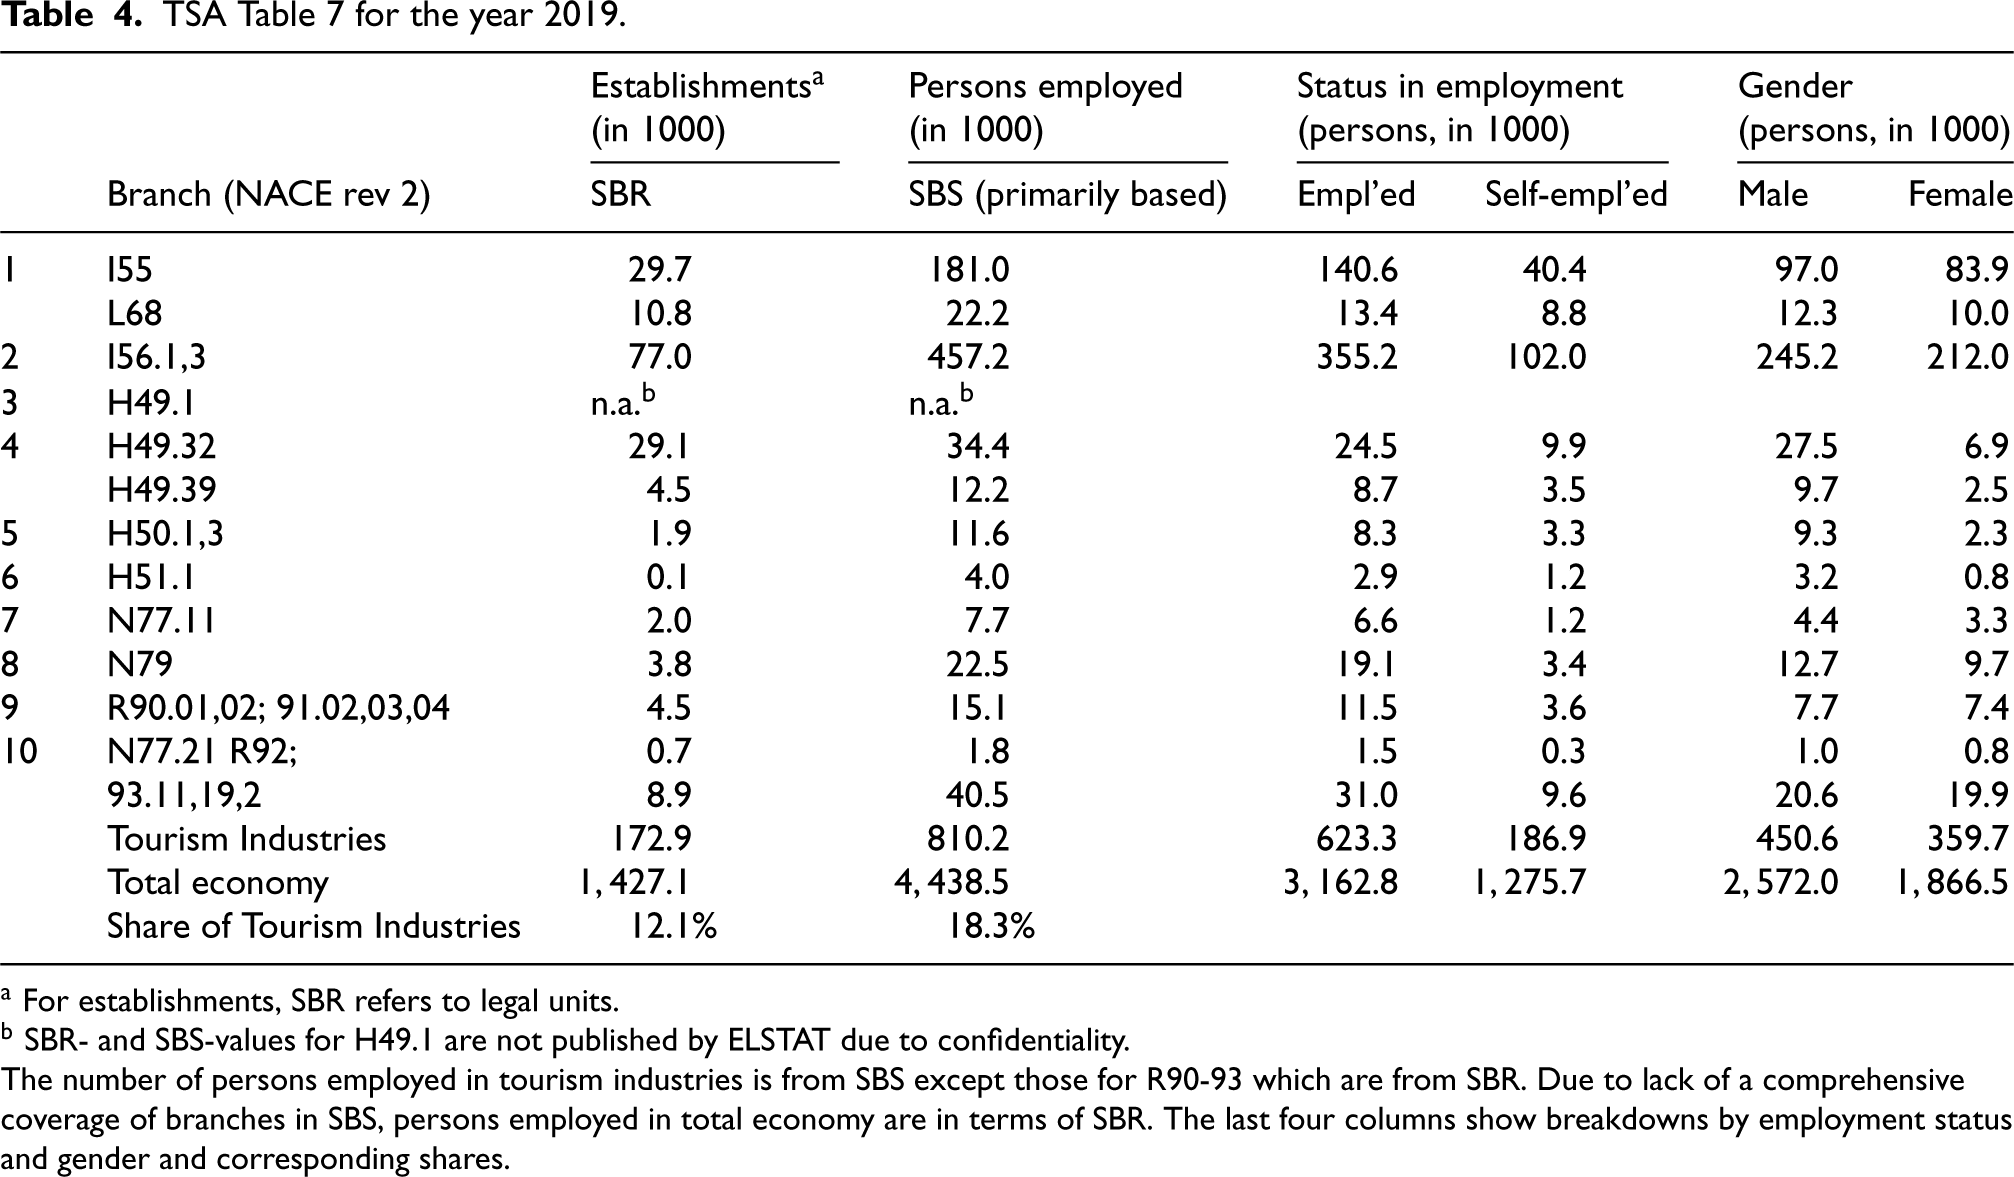
a For establishments, SBR refers to legal units.
b SBR- and SBS-values for H49.1 are not published by ELSTAT due to confidentiality.
The number of persons employed in tourism industries is from SBS except those for R90-93 which are from SBR. Due to lack of a comprehensive coverage of branches in SBS, persons employed in total economy are in terms of SBR. The last four columns show breakdowns by employment status and gender and corresponding shares.
The numbers of establishments are taken from SBR; they are preferred to SBS results because of its broader coverage and a more detailed breakdown of economic activities. The numbers of persons employed are taken from SBS; SBS is preferred to SBR, as the former provides data on GVA and output by economic activity that can be related to hours worked provided in the SUT, and subsequently render feasible a full time equivalent measurement of persons employed. For Cultural Industry and Sports and Recreational Industry, SBR values are used since SBS values are not available. Breakdowns of the number of persons employed are shown with respect to the status in employment and gender. These breakdowns are obtained by applying the corresponding portions reported in the LFS. The results shown in Table 4 are provisional due to the limited availability of data.
As Table 4 indicates, the share of employment – in number of persons employed – in tourism industries is slightly above 18% of that in the total Greek economy, whereas the share of establishments is about 12%. About 79% of the persons employed in the tourism industries belong to the two branches Restaurants and mobile food service activities and Beverage serving activities (56.4%) and Accommodation (22.3%); the latter do not include L68. In terms of status in employment and gender, self-employed represent almost 25% and males more than 50% of total persons employed.
TSA:RMF 2008 requires TSA Table 7 to shows, in addition to the number of persons employed, the numbers of hours worked and of full-time equivalent persons employed. However, inconsistencies in the available data on output and GVA by activity between SBS and SUT, which are in some cases considerable, allow only preliminary values for these statistics. In 2019, around 65% of the more than 1 million full-time equivalent persons employed in the tourism-related industries (corresponding to the 2-digit level, and thus including a broader coverage than the tourism industries themselves), worked in Accommodation and Food and beverage service activities, regardless of whether the recipient of the services was a tourist or not.
In order to provide a comprehensive picture of employment generated by tourism, the TSA Table 7 on employment in tourism industries is complemented by a table on tourism employment, i.e. employment directly attributable to tourism demand. This refers to all employment in branches where all or almost all of the output is consumed by visitors; in branches serving both visitors and non-tourist consumers, a corresponding share of the employment is to be counted, regardless of whether the branch is part of the tourism industries or not.
Branches where the total supply is at least predominantly consumed by visitors are Accommodation (I55), Passenger water transport (H50), Passenger air transport (H51) and Travel agencies etc. (N79). For tourism industries serving both visitors and non-tourist consumers, the number of persons employed in domestic supply serving tourism demand has to be estimated on the basis of additional information. This also applies to non-tourism industries whose employees serve tourism demand. An obvious approach to estimating these figures is to use the tourism output ratio for each industry (the proportion of the branch's output that is consumed by visitors), assuming that the labour input is proportional to the output in the whole branch, i.e. that the share of employment in the branch is the same as the share of output that is consumed by visitors. In practice, the tourism ratio can only be calculated for a few highly aggregated categories of economic activities corresponding to the breakdowns available in the SUT. For 2019, tourism ratios were estimated (see Hackl and Hatzimarinakis
4
) for
Accommodation and food service activities (I): 49.6% Real estate activities excluding imputed rents (L68): 0.5% Transportation (H49-51) and Rental and leasing activities (N77): 12.0% Travel agency, tour operator reservation service and related activities (N79): 2.4% Arts, entertainment and recreation activities (R): 13.9% Other industries: 1.2%
The tourism ratio of these industry aggregates is used to estimate tourism employment in the included tourism industries. E.g. the tourism ratio for Transportation, 12.0%, is used to estimate employment serving tourism demand in the tourism industries of H49.1 (Passenger rail transport, interurban), H49.32 (Taxi operation), H49.39 (Other passenger land transport n.e.c.), H50.1-H50.3 (Sea, coastal and inland passenger transport), H49.3 (Passenger air transport), H77.11 (Renting and leasing of cars and light motor vehicles) and H77.21 (Renting and leasing of recreational and sports goods).
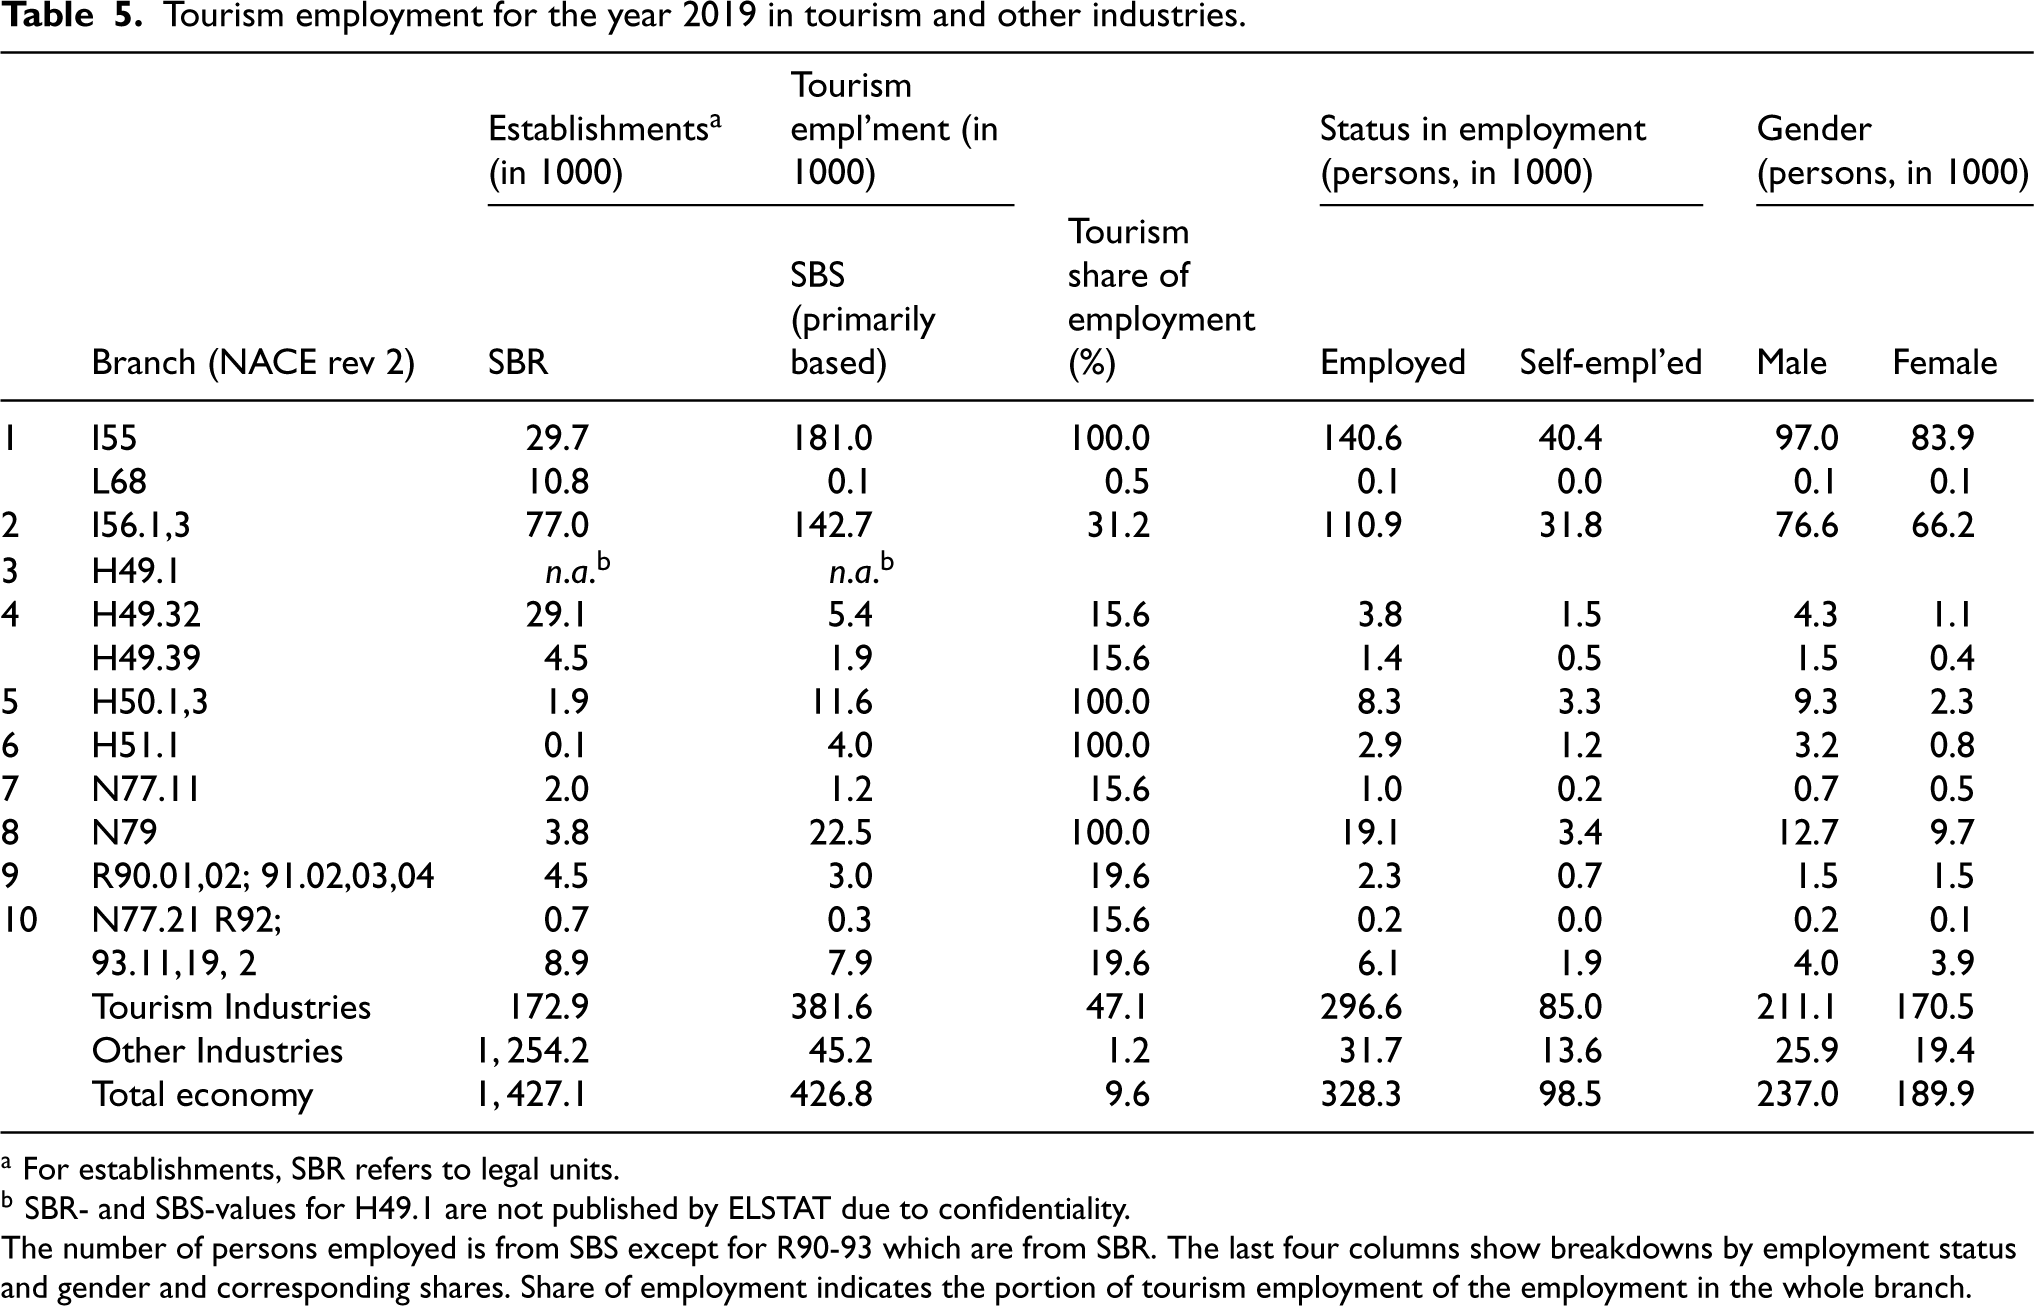
Table 5 shows, in column 4, tourism employment in terms of the number of persons employed for the year 2019. The compilation of this measure for the different categories of tourism industries is explained below.
I (Accommodation and food service activities) This section of industry employs about 652 thousand persons. The tourism ratio amounts to 49.6%, resulting in 323.7 thousand persons employed for serving tourism demand in this aggregated branch.
I55 (Accommodation) This industry, which accounts for 22% of employment in the tourism industries, overwhelmingly produces for tourism demand. The number of persons employed reported in the SBS, nearly 181 thousand, is directly attributed to tourism employment, even though a part of it may serve non-visitors (e.g. seasonal workers, refugees). I56.1 (Restaurants and mobile food service activities), I56.3 (Beverage serving activities) This industry provides about 56% of employment in the tourism industries. Tourism employment in this industry is calculated as the difference between the 323.7 thousand persons employed in the total section I for tourism demand and the almost 181 thousand persons employed in division I55 (Accommodation), i.e. 142.8 thousand employed persons. These account for 31.2% of total employment in the establishments of the tourism-related food and beverage serving industries (I56.1 and I56.3). It should be noted that group I56.2 (Event catering and other food service activities) is not tourism characteristic according to IRTS 2008, and therefore no tourism employment is attributed to this branch, although some persons may be employed to directly serve tourism demand. L68 (Real estate activities) The contribution of this branch to tourism is small. It primarily corresponds to private accommodation offered by natural persons in a peer-to-peer economy on platforms such as Airbnb or Booking. The tourism ratio amounts to 0.5%, which corresponds to only 112 persons employed for tourism out of all 22.2 thousand employed persons in this branch. This ratio is certainly underestimated: Inbound tourism expenditures for accommodation recorded in demand surveys do not separately identify expenses for I55 and L68; all related expenditure is attributed to section I (see Hatzimarinakis and Hackl
2
). H49 - 51 (Transport), N77 (Rental and leasing activities) This aggregation of industries employs about 202.7 thousand persons. The tourism ratio amounts to 12.0%, resulting in 24.4 thousand persons attributed to tourism employment.
H50.1 (Sea and coastal passenger water transport), H50.3 (Inland passenger water transport) These industries are considered to produce, like Accommodation, only for tourism demand; about 11.6 thousand employed persons are reported in SBS. H51.1 (Passenger air transport) This industry is also considered to produce entirely for tourism demand; about 4.0 thousand employed persons are reported in SBS. H49.1 (Passenger rail transport, interurban), Η49.32 (Taxi operation), Η49.39 (Other passenger land transport n.e.c.), N77.11 (Renting and leasing of cars and light motor vehicles) The number of persons employed in the railway services is not published by ELSTAT and is therefore not included in Table 5. Other land transport industries (N49.32, H49.39) and the renting and leasing industries (N77.11, N77.21) have 34.4, 12.2, 7.7 and 1.8 thousand persons, respectively. In order to calculate the number of persons in these industries attributed to tourism employment, the number of employed persons in water and air transport industries is subtracted from the total number of employed persons for tourism, 24.4 thousand; the resulting 8.8 thousand tourism employment is allocated in proportion to the number of persons employed in these branches, i.e. approximately 5.4, 1.9, 1.2 and 0.3 thousand persons employed in tourism for H49.32, H49.39, N77.11 and N77.21, respectively. Obviously, some of these tourism jobs could be created in other non-characteristic branches of the transport and rental industry. N79 (Travel agency, tour operator and other reservation service and related activities) This industry produces only for tourism demand. The SBS reports nearly 22.5 thousand employed persons, and they are attributed to tourism employment as a whole. R (Arts, entertainment and recreation) Section R employs almost 78.4 thousand people. The arts, entertainment and recreation industries (R90-91 and R92-93) have 15.1 and 40.5 thousand employed persons, respectively. The tourism ratios in these branches amount to 13.9%, resulting in about 10.9 thousand people in tourism employment. These employed persons are assigned to the tourism-related classes of R90-R91 and R92-R93 proportional to the number of employed persons in these branches, contributing 3.0 and 7.9 thousand persons in tourism employment, respectively. According to IRTS 2008, Renting and leasing of recreational and sports goods industries (N77.21) are to be treated with tourism-related classes of divisions R92-93 under Sports and Recreational Industry. Tourism employment in N77.21 is calculated together with transport and rental and leasing activities, as mentioned above (0.3 thousand). Other Industries Tourism employment in the Other Industries of the economy is obtained by applying a tourism ratio of 1.2%, which corresponds to the share of tourism consumption in the output of the non-tourism industries. This gives a contribution to tourism employment of around 45 thousand persons.
Tourism employment for the year 2019 in tourism and other industries.
a For establishments, SBR refers to legal units.
b SBR- and SBS-values for H49.1 are not published by ELSTAT due to confidentiality.
The number of persons employed is from SBS except for R90-93 which are from SBR. The last four columns show breakdowns by employment status and gender and corresponding shares. Share of employment indicates the portion of tourism employment of the employment in the whole branch.
Table 5, which supplements TSA Table 7, shows tourism employment instead of employment in the tourism industries. It includes the number of establishments and of persons employed together with breakdowns by employment status and gender. These breakdowns are obtained by applying the corresponding portions reported in the LFS. Table 5 also includes the employment statistics for Other Industries, i.e. the whole economy excluding tourism industries.
Table 5 shows that in 2019 tourism employment, i.e. employment attributed to tourism demand in tourism and non-tourism industries, amounts to 427 thousand, of which 382 thousand, almost 90%, come from the tourism industries. Tourism employment accounts for almost 10% of total employment in Greece (4,439 thousand).
The branches with the highest employment in tourism are Accommodation with almost 181 thousand persons employed and Food- and beverage service activities with 143 thousand persons employed; these figures represent 42.4% and 33.4%, respectively, or almost 76% of tourism employment. Other industries with substantial tourism employment are Travel agency, tour operator, etc. with 22.5 thousand persons employed and Passenger water transport with 11.6 thousand persons employed. Taxi operation, one of the three largest branches in terms of the number of establishments, provides only about 5.4 thousand persons in tourism employment.
In terms of employment status and gender, of the 427 thousand persons employed in tourism, 98.5 thousand, or about 23%, are self-employed; the highest proportion of self-employed individuals, 29%, is in transport. About 237 thousand persons employed in tourism, or about 56%, are male; the proportion of female employees is 44% on average, but only 20% in transport.
The number of full-time equivalent persons employed directly in serving tourism demand is calculated by applying the tourism ratios to the hours worked reported in the SUT, which, as mentioned above, provides a limited analysis at the 2-digit level corresponding to a broader coverage of tourism industries themselves (e.g. freight transport and rental of household equipment are included). As SUT production values and GVA differ substantially from SBS values (at 2-digit level), only preliminary estimates are available, a similar case to tourism industries in TSA Table 7; the majority of the full-time equivalent persons employed related to tourism employment in the tourism-related industries, around 380 thousand in 2019, work in Accommodation and Food and beverage service activities, the main employer of tourism employment.
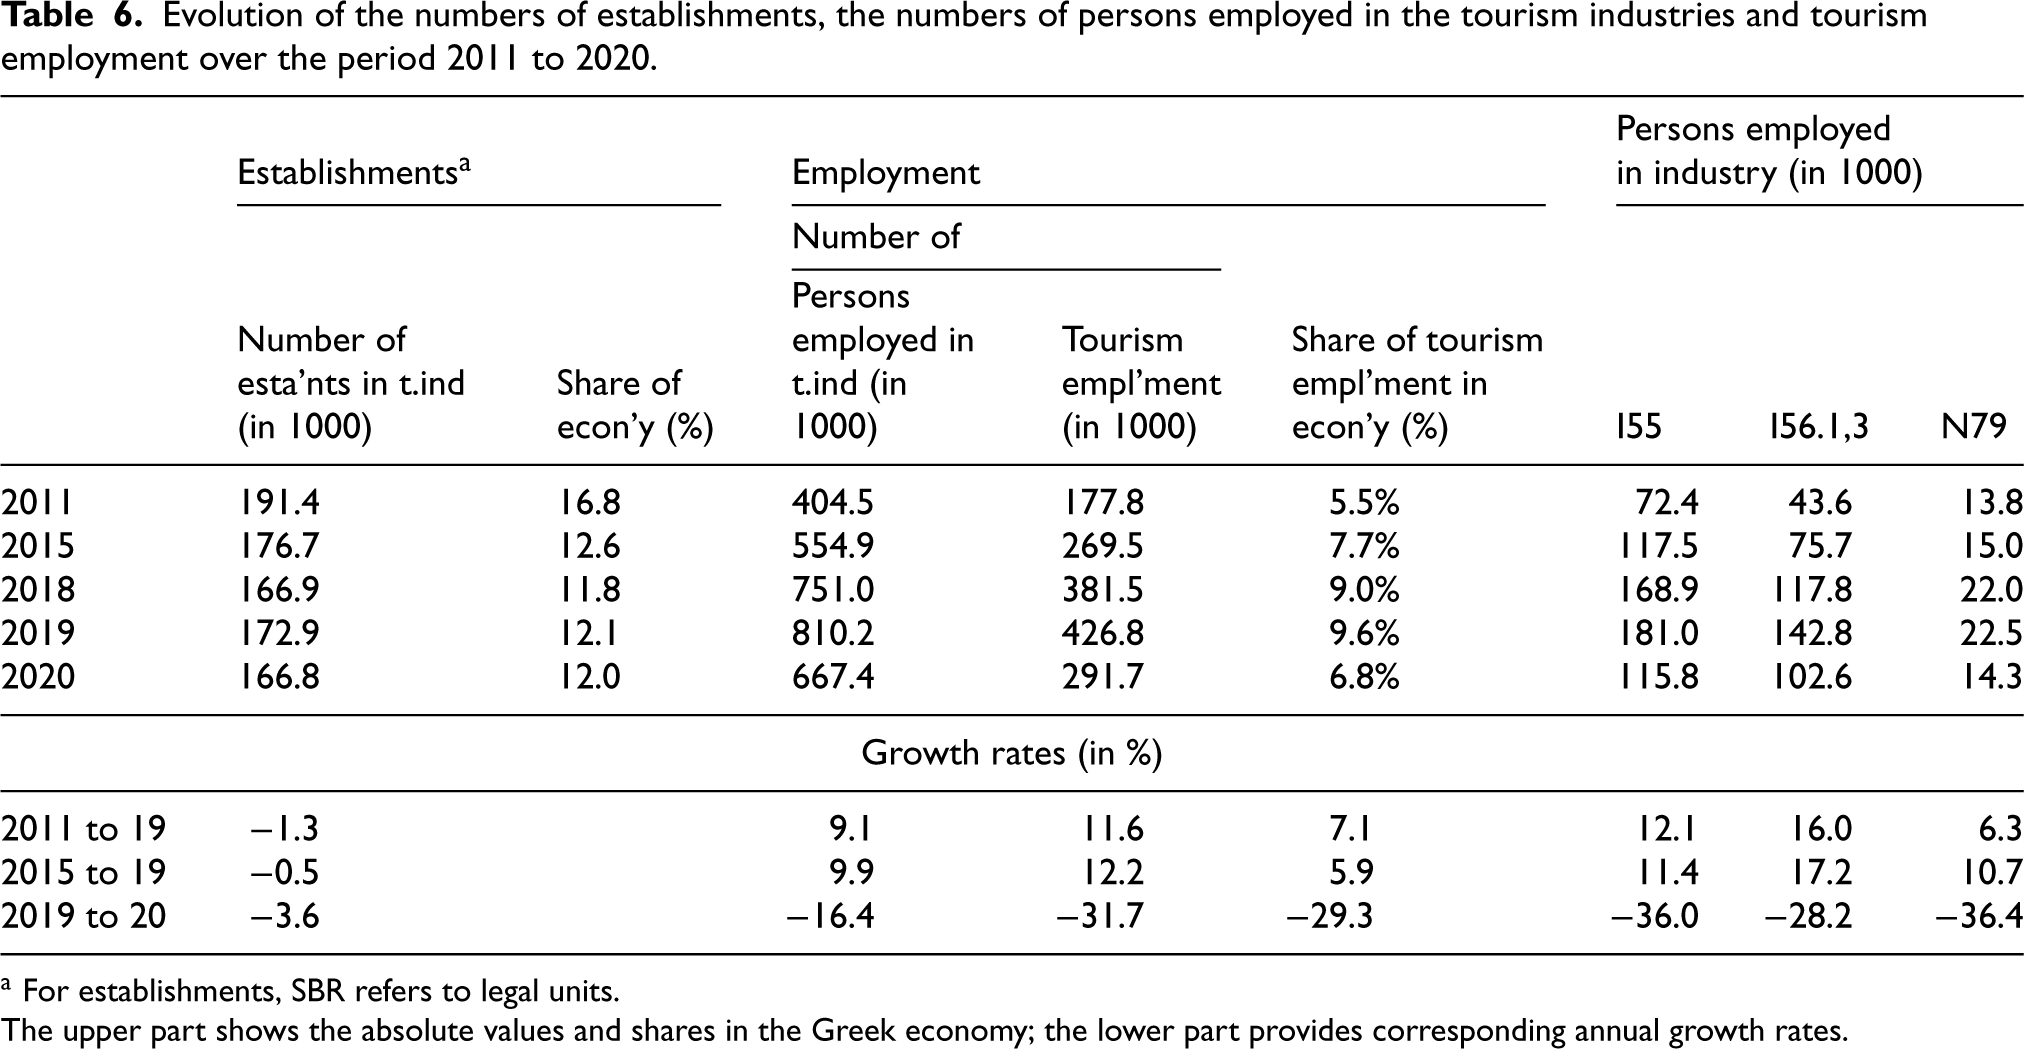
Employment in the tourism industries and tourism employment were measured or estimated for the years 2011, 2015, and 2018 to 2020. Table 6 shows the evolution of the number of establishments and persons employed over the period mentioned. The SBR and SBS values for the number of establishments and persons employed are generally in good agreement (see Subsection 3.1. for differences in coverage), with only the values for 2011 showing substantial differences.
Evolution of the numbers of establishments, the numbers of persons employed in the tourism industries and tourism employment over the period 2011 to 2020.
Evolution of the numbers of establishments, the numbers of persons employed in the tourism industries and tourism employment over the period 2011 to 2020.
a For establishments, SBR refers to legal units.
The upper part shows the absolute values and shares in the Greek economy; the lower part provides corresponding annual growth rates.
Between 2011 and 2019, the number of establishments in tourism industries decreased slightly by 1.3% per year, from 191 thousand to 173 thousand. The share of tourism enterprises among Greek enterprises – with 1,427 thousand establishments – decreased from almost 17% in 2011 to around 12% in 2019.
Between 2011 and 2019, the number of persons employed in tourism industries doubled from more than 405 thousand to just over 810 thousand in 2019, with an annual growth rate of 9.1%. The share of employment in tourism industries in the total Greek employment increased from 12.6% to 18.3% during this period, with an annual growth rate of almost 4.7%.
Over the same period, tourism employment increased substantially, from 178 thousand in 2011 to 427 thousand in 2019, an annual growth of 11.6%. Its share in total employment in Greece increased steadily from around 5.5% in 2011 to 9.6% in 2019. In Accommodation and Food and beverage service activities (the parts corresponding to I561 and I563, excluding catering), tourism employment grew by 12.1% and 16% per annum, respectively.
Preliminary estimates of full-time equivalent persons employed for the years 2011 to 2019 show that the share of Accommodation and Food and beverage service activities in tourism-related industries are between 57% and 65%, with an annual growth of around 7%. The corresponding growth in the number of full-time equivalent persons employed to serving tourism demand (the tourism part of the full-time equivalent) is 9%.
Table 6 also illustrates the impact of Covid on employment. The travel restrictions on tourism-related employment due to Covid are reflected in a substantial decline in employment statistics from 2019 to 2020. The number of persons employed in the tourism industries and tourism employment fall by 16.4% and 31.7%, respectively. The share of persons employed in the tourism industries in total employment in Greece falls from 18.3% in 2019 to 15.8% in 2020, and the share of tourism employment falls from 9.6% to 6.8%, respectively. It should be noted that from 2019 to 2020, the number of establishments in the tourism industries decreased by almost 4%. During this period, Greece's gross domestic product of fell by 10%.
An interesting economic indicator is the number of employees per establishment. This indicator has increased over the years, starting from an average of 2.1 for the tourism industries in 2011 and reaching to 4.7 in 2019; the corresponding values for the economy as a whole are 2.8 in 2011 and 3.1 in 2019. While the average number of persons employed in tourism industries was below the national average in 2011, this ratio is reversed in 2019, indicating an increasing contribution of these industries to total employment.
Tourism employment in the tourism industries was less than 1.0 person per establishment in 2011; it reached 2.2 in 2019. The indicator varies considerably, as shown by the following values for 2019: In the main tourism branches Accommodation and Food and beverage service activities, the average number of people employed in tourism per establishments is around 6.1 and 1.9 persons, respectively. A slightly higher value is found for the branches Passenger water transport (6.2) and Travel agency, tour operator, etc. (5.9). The highest value in the tourism industry is 47.5 tourism employed persons per establishment, obtained for Passenger air transport.
In 2020, the Covid year, the number of employees per establishment in the tourism industries fell slightly to 4.1 (from 4.7 in 2019), a decrease of 13%. The corresponding value for the whole economy remained unchanged (3.1). The decline in tourism employment in the tourism industries is even more pronounced: It fell from 2.2 persons per establishment in 2019 to 1.6, a decrease of 28%.
Concluding remarks
The results of the paper provide statistical information on tourism-related employment for policy makers, the tourism industry and academics in Greece. The methodology followed is that of the internationally recommended TSA framework, which aims to assess the economic impact of tourism. The selected data sources allow for a comprehensive coverage of tourism industries, the actual volume of persons employed (not limited to primary jobs) and the estimation of tourism employment; SBS and SBR are considered to be the more appropriate sources for compiling tourism-related employment statistics according to TSA specifications. Given the data sources and methodology used, the results of this paper provide a more detailed and accurate picture of employment in Greek tourism than previously available studies and datasets.
Given the strategic importance of tourism in a country, TSA Table 7 is essential for the analysis of the tourism industries. It is considered to be part of the core of the Tourism Satellite Accounts and complements the TSA Tables 1 to 6, which provide detailed information on the consumption of goods and services purchased by visitors and the industries supplying them.
Due to the limitations of the data available, the table focuses on the number of enterprises and persons employed, but does not include the indicators hours worked, full-time equivalent persons employed and related values; in this sense, the TSA Table 7 presented in Table 4 and the other reported results are preliminary and highlight the experimental status of our analysis. Available data sources also do not cover non-formal employment and employment that may be generated by the peer-to-peer economy, e.g. renting of private accommodation through Airbnb, private transportation through Uber, and similar services, so the underlying employment is not reflected in the results presented.
TSA Table 7 shows a very positive evolution of tourism employment in Greece. Tourism employment grew from around 180 thousand persons in 2011 to almost 430 thousand persons in 2019, an annual growth rate of 11.6%, with the share of tourism employment in total employment in Greece raising steadily from around 5.5% to 9.6%. The share of tourism employment in the two main tourism branches, Accommodation (I55) and Food- and beverage service activities (more specifically I561 and I563), increased from 65% in 2011 to 76% in 2019.
In 2020, the impact of the travel restrictions imposed due to the Covid pandemic was substantial; the number of persons employed in the tourism industries fell by more than 16% and the number of tourism employment fell by almost 32%, while their share in total employment in the Greek economy fell to almost 16% and 7%, respectively. Despite the impact of Covid, both the growing number and share of employment in the tourism industries and of tourism employment in the Greek economy suggest that tourism will continue to be a growing labour market in the coming years.
The future compilation of an official fully fledged TSA may result in more accurate tourism ratios per economic activity for the calculation of direct tourism employment. It may also allow the estimation of full-time equivalent values.