
Abstract
Due to global events impacting social and economic landscapes, the spotlight on inequalities endured by marginalized and vulnerable groups has intensified, necessitating action from policymakers to create a more equitable future for all. It is essential that National Statistics Offices (NSOs) provide detailed statistical data which highlights the experiences of these marginalized groups to ensure that fairness and inclusion are key components of evidence-based policy. Aligning with these principles, in 2021 Canada became the first country to collect and disseminate data on gender diversity in a national census giving Canadians the option to select male, female, or non-binary. Due to their small size, non-binary population totals were not used in the 2021 Census long-form sample calibration due to the risk of increasing the variance of estimates. This paper presents an alternative long-form calibration strategy which allows for small populations, such as non-binary individuals, to be incorporated while mitigating methodological concerns. The strategy put forward can incorporate multiple small populations simultaneously while also being adaptable to the calibration systems of other NSOs. The results of a Monte Carlo simulation are presented showing improved data quality for the non-binary population under the alternative calibration strategy.
Introduction
A key pillar of the 2030 United Nations Sustainable Development Goals (UNSDG) is the principle of leaving no one behind. In recent years, UN Member-States have recognized that growing inequalities amongst marginalized groups are international challenges which must be addressed. 1 In response, Member-States have committed to reducing the inequalities faced by vulnerable groups in their country. In fact, the United Nations Statistical Commission (UNSC) developed a framework highlighting that “Sustainable Development Goal indicators should be disaggregated, where relevant, by income, sex, age, race, ethnicity, migratory status, disability and geographic location or other characteristics, in accordance with the Fundamental Principles of Official Statistics”. 2 To ensure that fairness and inclusion are a key part of evidence-based policy, it is essential that National Statistics Offices (NSOs) provide detailed statistical data that highlights the experiences of marginalized groups.
Aligning with these principles, in 2021 Canada became the first country to collect and disseminate data based on gender diversity in a national census. 3 The Canadian census of population program provides a detailed statistical portrait of the Canadian population, playing an important role in data-driven policymaking. Conducted every 5 years, 2021 being the most recent, this program consists of 2 parts: a census which enumerates the entire population and collects basic demographic information and the long-form (LF) sample survey, which collects more detailed social and economic data on approximately 25% of the population. In 2021 the census portion included a new question measuring gender using the cisgender, transgender and non-binary categories. Cisgender refers to individuals who have reported that their sex assigned at birth is the same as their current gender whereas transgender refers to individuals whose sex assigned at birth does not align with their gender. Non-binary refers to individuals whose gender is not exclusively “man” or “woman”. 3 The addition of this question created an avenue to publish data by both sex and gender crossed with intersectionality variables to better understand the inequalities faced by gender minorities.
As NSOs strive to fill data gaps with disaggregated data, it raises the question of sound methods to produce high quality disaggregated estimates. 4 Calibration, introduced by Deville & Särndal, 5 is a weighting procedure commonly used by survey practitioners to improve the quality of estimates derived from survey data. Its goals are to increase the precision of estimates, address unit non-response, correct coverage errors and force estimates to match known control totals. To perform calibration, NSOs leverage a rich set of auxiliary information obtained from administrative sources, censuses and other surveys. However, when disaggregating data on marginalized populations, resulting cells often have small population sizes especially at lower levels of geography. Calibrating to small population totals can be problematic since some samples may have pre-calibrated sample totals which are comparatively far from the controls. In this scenario, extreme calibration weights – which are known to increase the variance of estimates – may be required to achieve coherence with the controls. Because of this, census counts of non-binary persons were not used in the 2021 LF sample calibration. Instead, a 2-category gender variable with categories men + and women + was used.
This paper proposes an alternative calibration strategy to incorporate small populations into the census LF calibration process while mitigating the methodological concerns. The application of the proposed strategy to the non-binary population is demonstrated. However, the solution can be extended to incorporate multiple small populations simultaneously while being adaptable to the calibration systems of other NSOs. The remainder of the paper is organized as follows. Section 2 describes the usual LF calibration procedure. Section 3 presents the proposed alternative LF calibration strategy. Section 4 describes the results of a Monte Carlo (MC) simulation which studied the impact on data quality of calibration to non-binary population counts. The main conclusions are summarized in Section 5.
Long-form estimation strategy
The LF sample is proportionately distributed across the country to ensure a high reliability of estimates for all areas. To improve the efficiency of field operations, Canada is partitioned into 49,217 geographical areas called collection units (CUs). In each CU, a 25% systematic sample of dwellings is drawn to constitute the LF sample. An initial set of design weights are constructed at the household-level as the inverse of the sampling fraction. Then, these design weights undergo a series of adjustments to address coverage and unit non-response errors. After this, a final calibration procedure is applied which is the focus of this paper. After the final calibration procedure, all persons within a household receive a person-level weight equal to their final household weight.
During LF calibration, household weights are adjusted to reduce sampling variance and ensure numerical consistency of estimates with known census counts. Calibration is carried out independently and in parallel within Super Aggregate Dissemination Areas (SADAs). These are standard geographic areas created for the LF weighting process which partition the country. SADAs are contiguous areas respecting provincial/territorial boundaries whose sizes are between 50,000 and 150,000 persons. Also used in the weighting process are Aggregate Dissemination Areas (ADAs) which are partitions of SADAs whose sizes are between 5,000 and 15,000 persons. Figure 1 illustrates the hierarchical relationship beween provinces/territores, SADAs and ADAs.
A selection process is carried out within each area to determine the set of population characteristics, called calibration constraints, to calibrate on. One set of constraints is selected for each SADA and each of the ADAs comprising each SADA. Due to the hierarchical nature of SADAs and ADAs, ADA-level constraints from a mathematical standpoint are analogous to SADA constraints. For the remainder of this paper, SADA-level constraints will refer to both SADA and ADA constraints. Constraint selection is an iterative procedure. The first step consists of defining a set of candidate constraints which is the same for each SADA. Then, constraints with a population count less than 200 are removed to protect against inflating the variance of estimates. Lastly, constraints are removed based on collinearity and explanatory redundancy. Once constraints are selected, calibrated weights for households in each SADA are obtained by solving the linear calibration problem stated by Deville & Särndal.
5
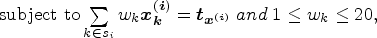
This involves minimizing a Chi-squared type distance function subject to the constraints:


In 2021, if non-binary population counts were evaluated by the constraint selection process, they would have been filtered out in most areas due to their small population sizes. Instead of calibrating non-binary persons to SADA and ADA population totals, the proposed strategy calibrates weights to provincial/territorial totals. This mitigates the risk of increasing the variance due to provinces/territories being aggregates of SADAs and therefore having larger population sizes. For brevity, provinces and territories will be referred to as “provinces” going forward. The proposed strategy maintains the usual SADA-level constraints alongside the newly introduced provincial-level constraint, which shifts the calibration problem from the SADA to provincial level. In other words, within a province, household weights are calibrated to the provincial and SADA constraints simultaneously. The resulting calibration will be referred to as the provincial problem as stated in section 3.1. The provincial problem is solvable using standard optimization methods however, for many provinces, the increased size of the calibration due to provincial-level processing requires computing power and resources which exceeds those available in the LF calibration environment. For example, the province of Ontario – the largest in Canada – is comprised of 150 SADAs. Instead of solving 150 SADA problems in parallel, a single problem, roughly 150 times larger must be solved. This issue is addressed in section 3.2 which presents the novel contribution of this paper – a decomposition scheme to partition the large provincial problem back into independent SADA problems of a manageable size.
The hierarchical relationship between provinces and SADAs allows for the aggregation of small population totals at the SADA level into a larger provincial constraint facilitating the use of small populations, albeit at a higher geographical level. Although the relationship between a province and SADAs are specific to the Canadian census, many NSOs maintain similar geographical hierarchies to facilitate sampling and estimation procedures which can be leveraged. For example, the US Census Bureau maintains a hierarchical relationship between states, counties and census tracts. 7
The provincial non-binary calibration problem
Let


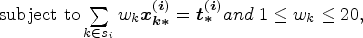
The decomposition scheme relies on first re-writing the provincial non-binary person constraint as a sum of SADA-level constraints:


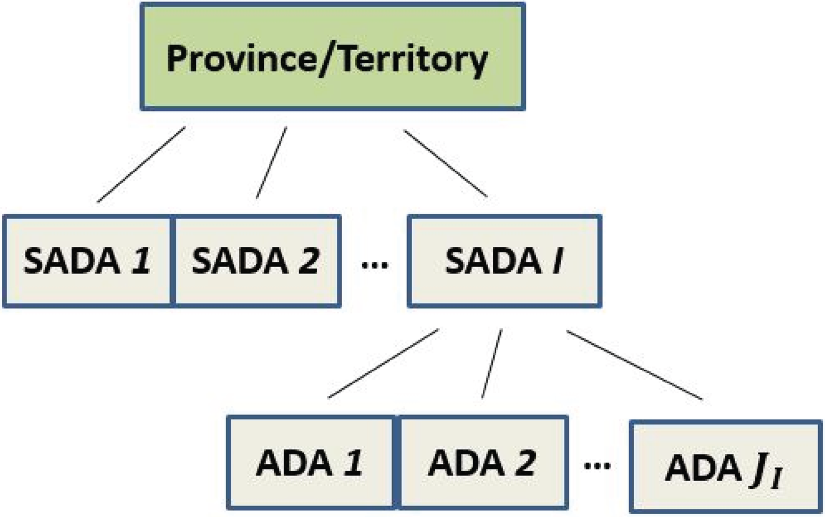
Hierarchical representation of the standard geographies used in the Canadian census calibration process.
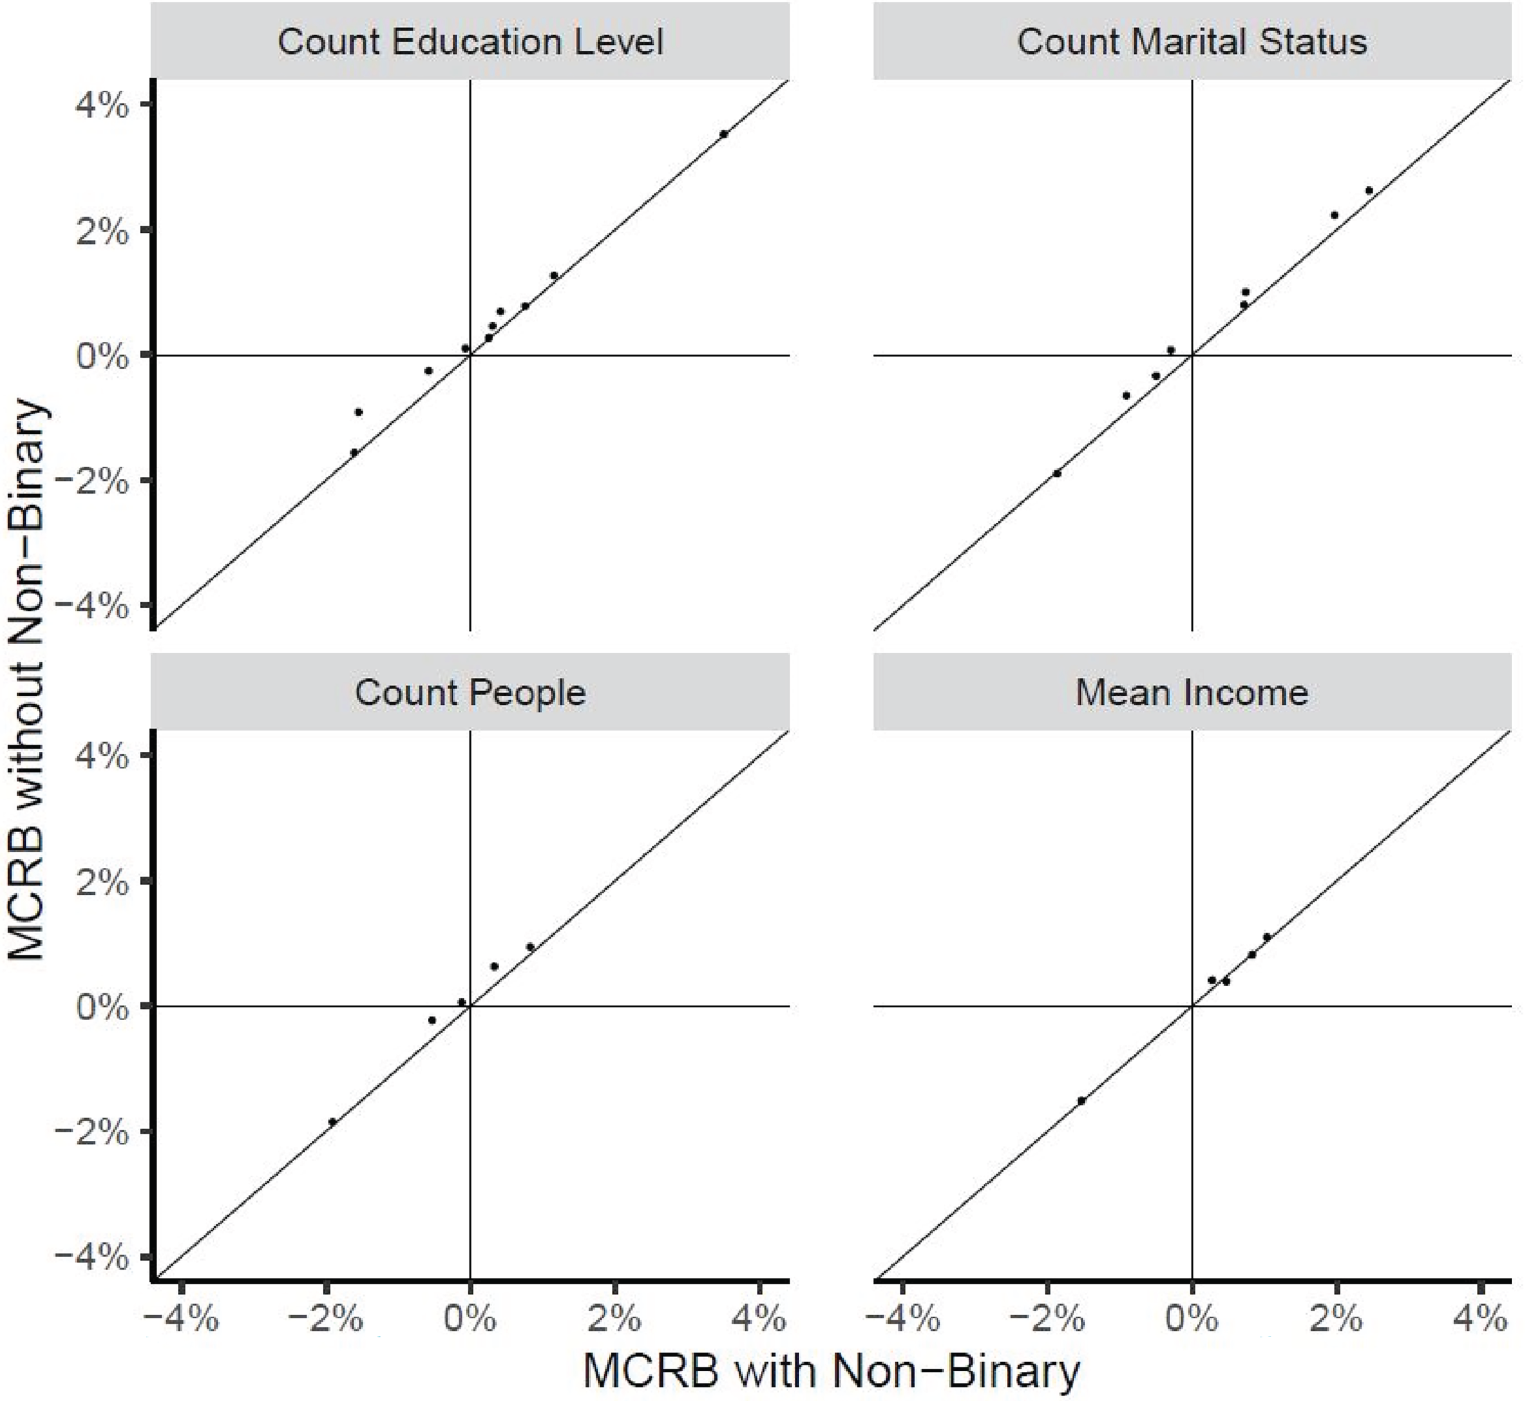
MCRB of point estimates: with non-binary calibration plotted against without non-binary calibration at the SADA-level by estimate type.
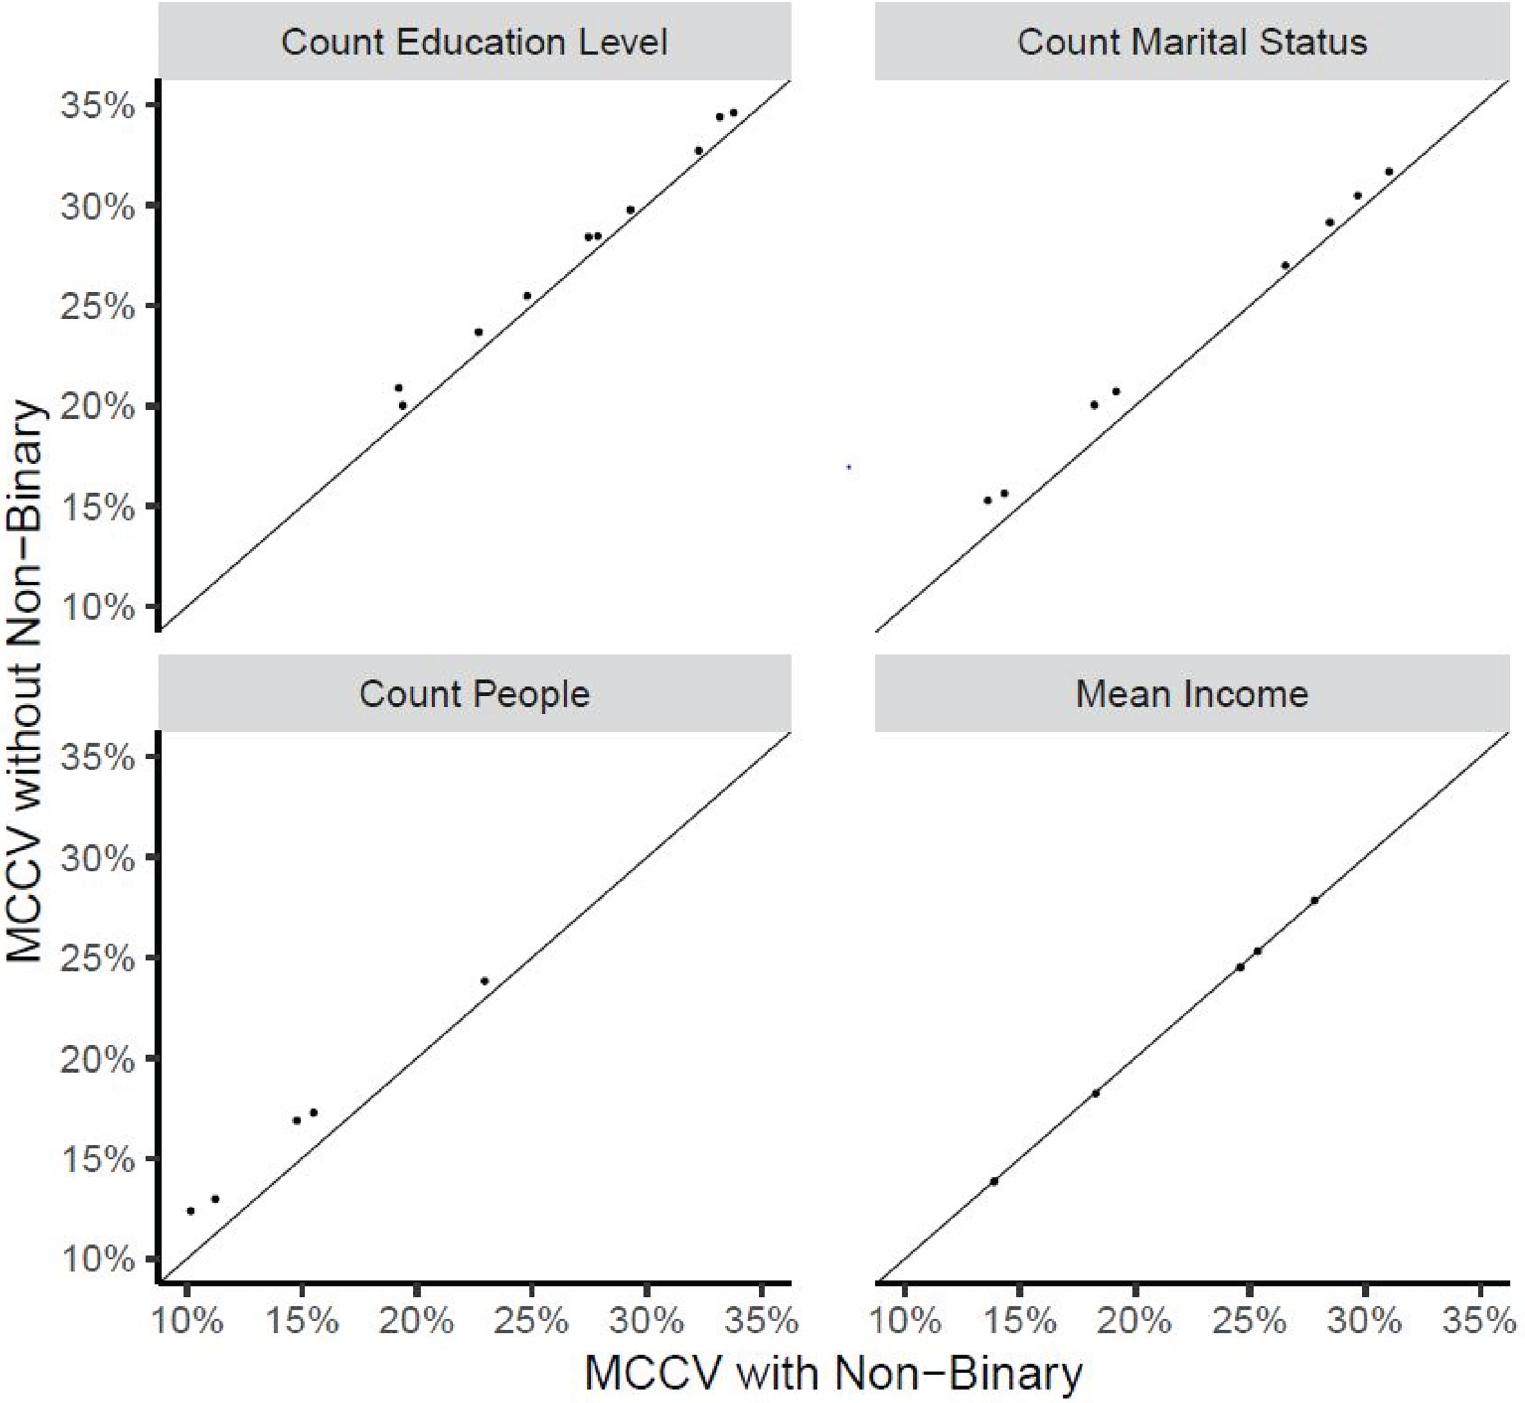
MCCV of point estimates: with non-binary calibration plotted against without non-binary calibration at the SADA-level by estimate type.
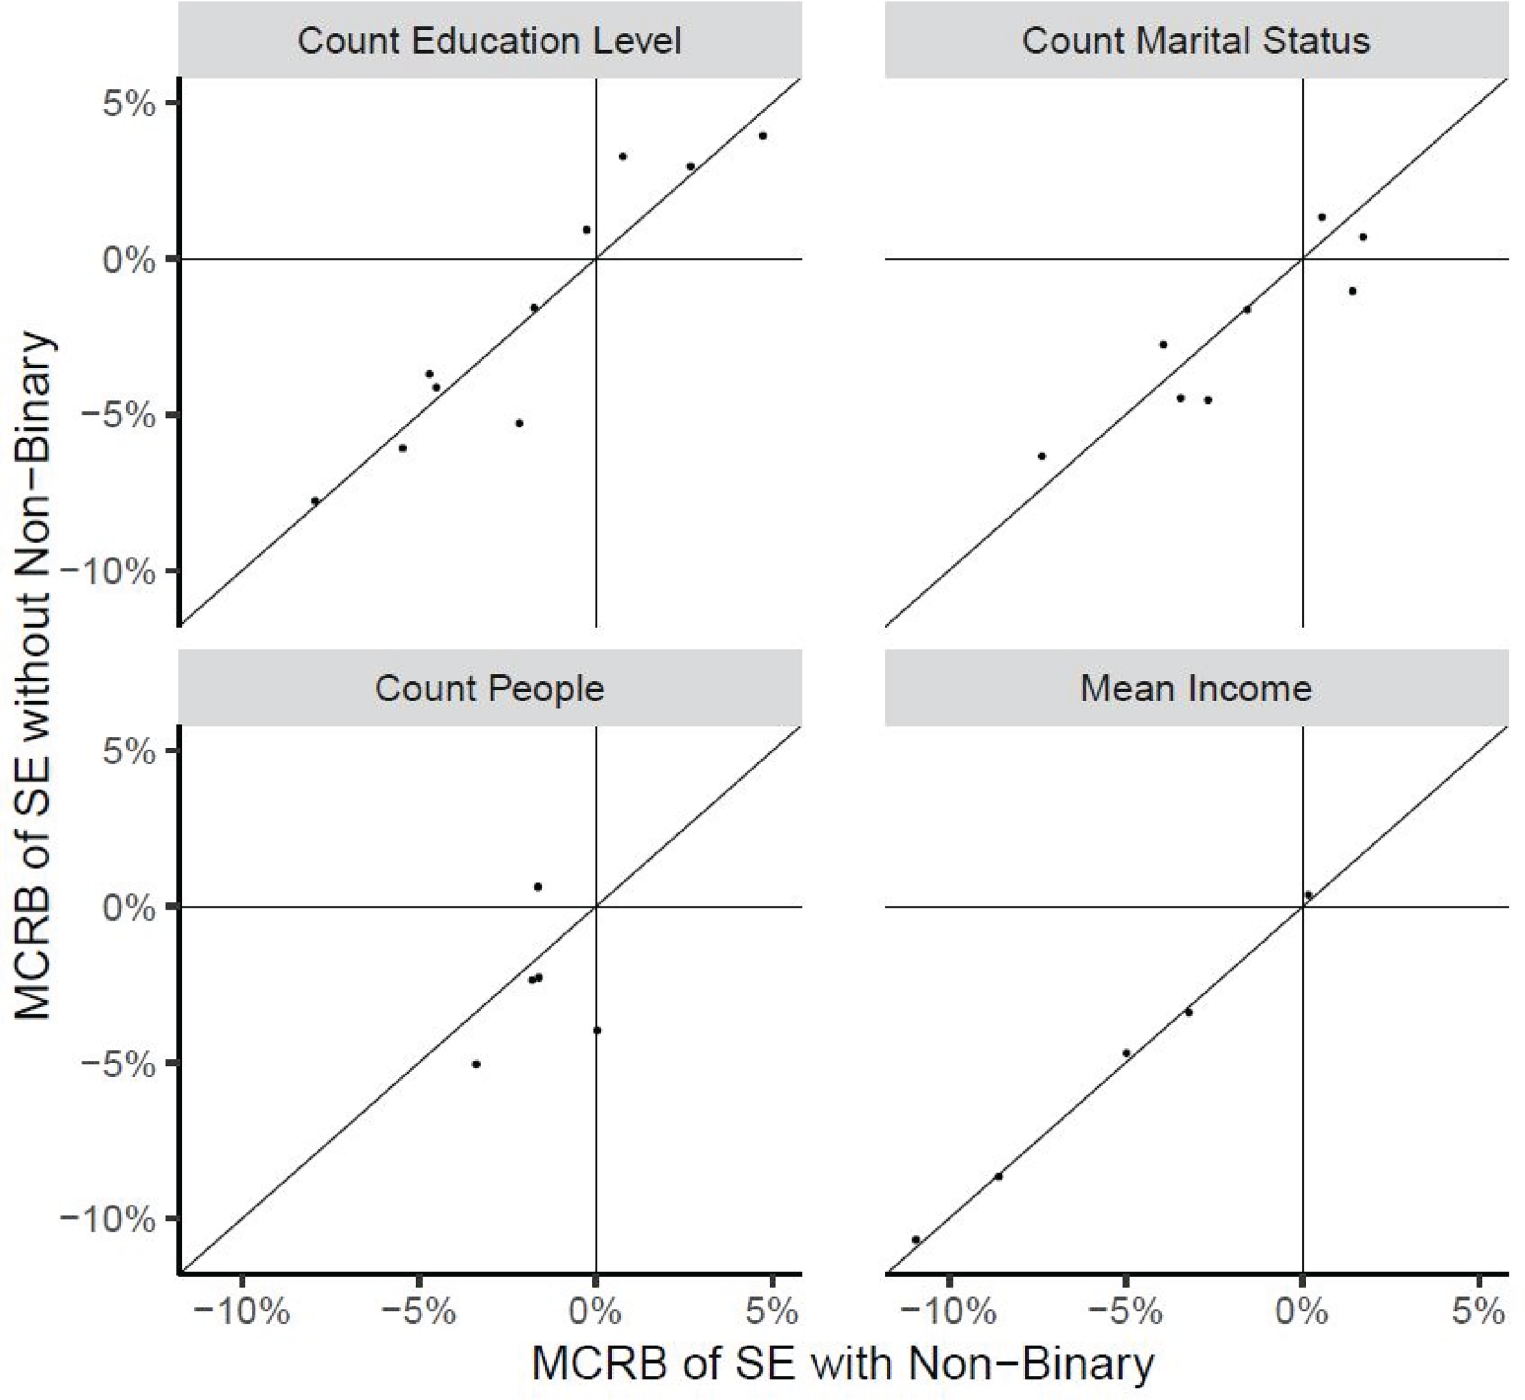
MCRB of estimated SEs: with non-binary calibration plotted against without non-binary calibration at the SADA-level by estimate type.
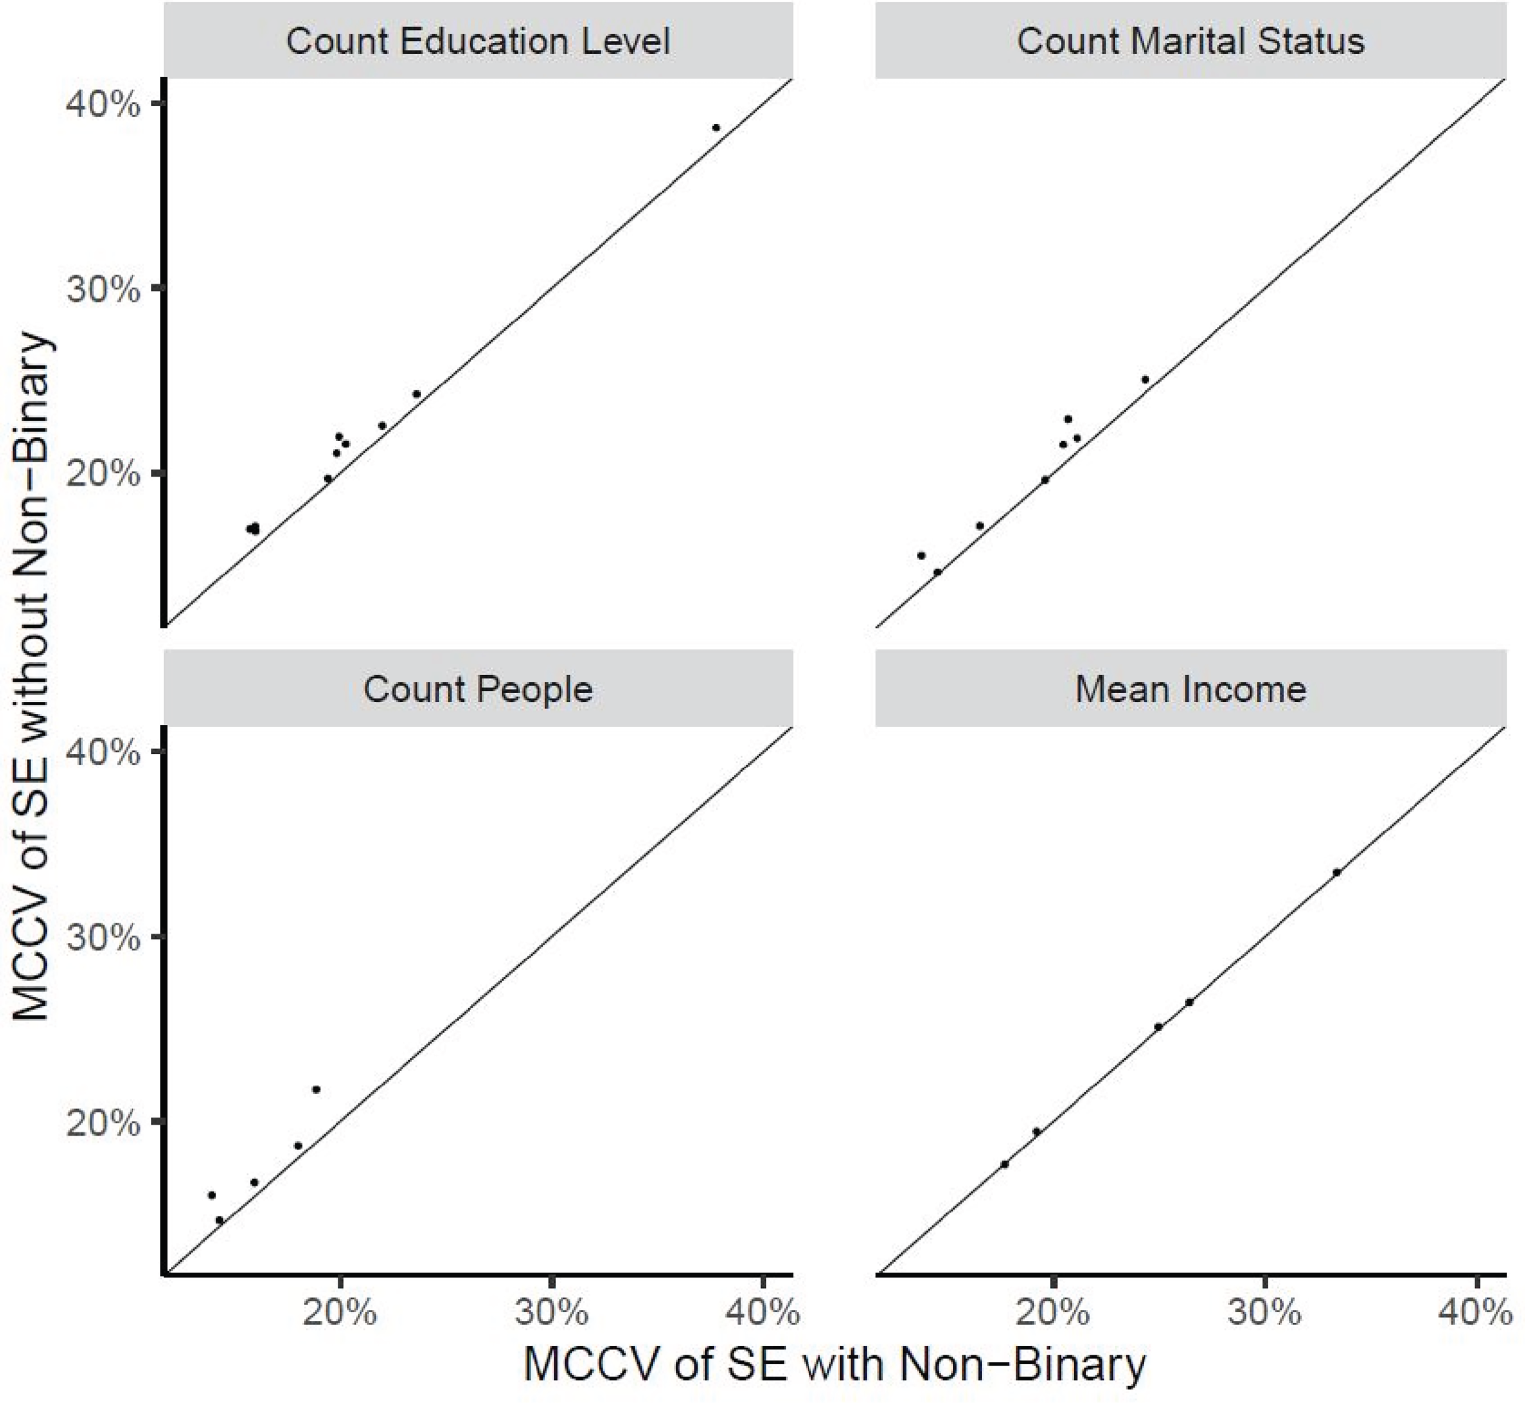
MCCV of estimated SEs: with non-binary calibration plotted against without non-binary calibration at the SADA-level by estimate type.
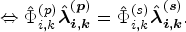
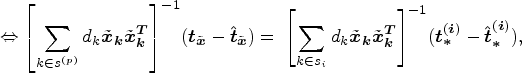
The derivation is carried out independently in each SADA by setting the solution to the calibration weights obtained from the SADA and provincial problems equal and then solving for


The alternative calibration strategy is characterized by the following steps.
Carry out the constraint selection process. Construct the vectors Compute For each SADA, augment the auxiliary and total vectors with the non-binary status variable and artificial total respectively. Use G-EST to solve the decomposed SADA calibration problems in parallel. Repeat steps 2-5 for each replicate weight used for variance estimation.
Steps 2–4 constitute the changes made to the usual calibration procedure which consists of some data pre-processing and a matrix algebra step. Step 5 involves solving for the calibrated weights and is the most time-consuming step. This step remains unchanged other than the addition of the artificial non-binary constraint, highlighting the smooth integration of the solution into the existing calibration procedure.
The alternative calibration procedure can be extended to use multiple small population constraints aggregated at the provincial level. In this scenario, the non-binary status variable
Monte Carlo simulation
A Monte Carlo (MC) simulation was carried out to study the impact on data quality of calibrating LF weights to non-binary population totals using the proposed method. The study focused on data quality in the non-binary person domain since the proposed calibration procedure will mostly affect the weights of these units. The impact outside the non-binary person domain was also studied to ensure the method did not interfere with the high degree of data quality produced from the usual LF calibration. These results are not presented however minimal impacts were observed.
Setup
The simulation study was based on a pseudo-province created using the responses to the 2021 LF sample obtained in the province of British Columbia. The construction of the pseudo province involved the creation of pseudo SADA, ADA and DA areas which were made to be representative of true SADA, ADA and DAs in the Canadian population. DAs are partitions of ADAs and are close in size and concept to CUs. For efficiency reasons, pseudo DAs were created instead of pseudo CUs. The pseudo-province contained five pseudo-SADA totaling 472,034 people in 190,909 households, making it roughly the size of the province of Newfoundland and Labrador. 500 MC samples were drawn from the pseudo-province using a stratified simple random sample of households without replacement (SRSWOR). The sample was stratified by pseudo-DA and a sampling fraction of 25% was used. This sample design is very close to the design of the LF sample however, non-response was not simulated since the goal of the final calibration step is to reduce variance due to sampling and ensure consistency with census counts. In each MC sample, two sets of calibrated weights were produced. One set was constructed by carrying out the usual LF calibration process. A second set of weights was produced by calibrating to the set of constraints selected by the usual procedure plus an artificial non-binary SADA constraint derived for each sample.
Each MC sample also underwent the creation of replicate weights corresponding to the Partially Balanced Repeated Replication-
Analysis
Various statistics of interest were computed using both sets of calibrated weights. The properties of counts were the focus of the study as these make up most of the statistics published from the LF sample. However, some means were included in the analysis. The following statistics were studied:
Count of people. Count of marital status (6 categories). Count of highest education level attained (6 categories). Mean income. Mean age (results not included).
The above statistics and their estimated SEs were computed for the non-binary person-level domain at the pseudo-province, pseudo-SADA and pseudo-ADA levels. To study the statistical properties of the point and SE estimates, the Monte Carlo Relative Bias (MCRB) and Monte Carlo Coefficient of Variation (MCCV) were used with results expressed as a percentage.
Results
Figures 2–5 display the MCRB and MCCV for the point and SE estimates. Only results at the pseudo-SADA level are presented however similar results were observed at the pseudo-province and pseudo-ADA levels. Categories of marital status and education with a population count less than 30 were excluded from the analysis. The x-axis of the plots corresponds to the alternative calibration strategy (with non-binary) and the y-axis corresponds to the usual LF calibration (without non-binary). A reference line corresponding to Both calibration procedures produced approximately un-biased point estimates. The alternative calibration procedure produced smaller MCCVs for counts and their estimated SEs. MCCVs of the mean (and its SE) were comparable between procedures.
Almost all points are above the reference line meaning the MCCVs associated with non-binary calibration are smaller than those without non-binary calibration. Both calibration procedures produce estimated SEs which have a small (negative) MCRB. The two procedures are comparable.
This paper presented an alternative LF calibration strategy which allows for small populations, such as the non-binary group, to be incorporated while mitigating the methodological concerns. The proposed strategy derives artificial SADA totals to facilitate the calibration of LF weights to provincial counts of non-binary persons – adding protection against variance inflation. The artificial totals allow for the decomposition of the resulting large provincial-level problem back into computationally feasible SADA-level problems resulting in minimal changes to the current calibration system. The use of standardized geographies in official statistics allow the proposed calibration strategy to be adapted to large-scale establishment surveys outside the context of the Canadian LF sample. NSOs can leverage hierarchical relationships between geographies to aggregate small population constraints to higher populated levels while implementing artificial totals, under the Chi-Squared distance function, to decompose the problem back to the original operational geography. The proposed calibration strategy is continuing to be evaluated for implementation in the 2026 LF sample and has received interest from the Agency's Demographic Microsimulation project.
The simulation study demonstrated the positive impact that non-binary calibration had on data quality for the non-binary person domain. Non-binary calibration resulted in increased precision of point and SE estimates for characteristics of the non-binary person domain compared to calibration without the non-binary constraint. We have shown that including such sub-populations in calibration can improve data quality for marginalized and vulnerable groups. This can directly aid decision makers when drafting data-driven policy to address known inequalities and create a more equitable future for all.
Footnotes
Funding
The author received no financial support for the research, authorship, and/or publication of this article.
Declaration of conflicting interests
The author declared no potential conflicts of interest with respect to the research, authorship, and/or publication of this article.
Appendix
From equations (9) and (10), for household k in SADA i,