
Abstract
The current computation of official employment and unemployment rates is based on the sharp distinction between employed and unemployed. In this study, employment and unemployment are not considered as attributes either present or absent, but it is assumed that everyone has some degree of both, ranging from 0 to 1. The number of hours worked and the individual's satisfaction with those hours are the key variables in determining the intensity of employment (and unemployment) for any individual in the labour force. Based on this assumption, we apply a fuzzy approach to derive fuzzy employment and unemployment rates. In particular, this study presents an application of the fuzzy approach to unemployment and compares official and fuzzy rates across a selection of European countries for the year 2023. Furthermore, the fuzzy results are discussed in relation to Eurostat's labour slack statistics on underemployment.
Keywords
Introduction
The 13th International Conference of Labour Statisticians (ICLS) 1 established the definitions of employment and unemployment that remain in use today. Under this framework, individuals of working age engaged in paid work during a short reference period are classified as employed, while those without work but seeking it are classified as unemployed. Although inclusive of irregular employment, the framework overlooks dimensions such as personal fulfilment and income adequacy, both of which affect well-being. Critics argue that this narrow definition obscures vulnerable groups and provides a limited view of unemployment.
To address these limitations, Hauser2,3 and Clogg 4 developed the so-called Labour Utilization Framework, incorporating elements such as low-paid employment and underemployment. Based on these advancements, the 18th ICLS 5 introduced a broader conceptualisation of employment that recognises a continuum spanning employment, unemployment, and persons outside the labour force.
This paper proposes a fuzzy approach 6 that integrates the official definitions with other information from the Labour Force Survey (LFS) with the aim of providing a complementary method for measuring employment and unemployment.7,8 Specifically, employment and unemployment are defined by incorporating both the hours worked and the satisfaction derived from those hours. This methodology enables a more nuanced classification of employment status, aligning with the concept of a continuum between employment and unemployment.
The primary motivation for this paper is social rather than economic. We do not focus on unexploited labour capacity and any inefficiencies in terms of productivity that it may generate. Instead, our concern lies with workers’ dissatisfaction arising from working fewer hours than they would like, not because of a lack of will or motivation, but because of structural barriers, restrictive contracts, or employer decisions. Reframing underemployment as a social issue requires a change in policy orientation: from a predominant focus on optimising aggregate labour utilisation to promoting individual agency and realising individual work preferences.
The proposed approach is applied to European Labour Force Survey (EU LFS) data from 30 countries. The resulting fuzzy unemployment rates are then compared with Eurostat's official measures.
Employment, unemployment and underemployment in European official statistics
According to the International Labour Organization, 1 the working-age population (individuals aged 15 and over) is divided into three mutually exclusive groups: employed, unemployed, and persons outside the labour force.
The EU LFS identifies these groups using a hierarchical approach. A person is considered employed if, during the reference week, they worked for at least one hour for pay, profit, or family gain, or if they were temporarily absent from a job or business. Individuals are classified as unemployed if they had no work during the reference period, were available to start working, and had recently taken active steps to find a job. Those neither employed nor unemployed are considered outside the labour force.
One commonly debated limitation of this approach is the low threshold of work required to be classified as employed. In fact, it is evident that someone working only a few hours—insufficient to meet their needs—is still counted as employed.
Another weakness is the blurred boundary between the unemployed and the persons outside the labour force. If a person has not taken any job search measures during the reference period, he or she is classified as outside the labour force rather than unemployed. The same applies if the person is not available for work within a short period of time. In both cases, however, the person is effectively out of work and could reasonably be regarded as unemployed.
To account for these forms of employment and unemployment that escape the official rates, the 18th ICLS asked national and international producers to go beyond the simple unemployment rate and to devise statistics that would also capture time-related underemployment and the presence of potential additional labour force. 5 In response to the ICLS 18th recommendations, Eurostat 9 published in 2011 three new experimental indicators beyond traditional unemployment. The first indicator, underemployed part-time workers, covers people employed part-time who want to work more hours and are available to do so. The second indicator encompasses individuals who are actively seeking employment but cannot begin work within the reference period and are therefore classified as out of the labour force rather than unemployed. The third indicator refers to persons who are available to start work on short notice yet are not conducting an active job search, a category that includes discouraged workers and others marginally attached to the labour force. The sum of persons underlying the last two indicators identifies the potential additional labour force. Interestingly, Eurostat 9 shows that the three new indicators capture a spectrum of decreasing labour market attachment. At one end are the fully employed, followed by underemployed part-time workers and the unemployed. Labour market attachment declines further among those seeking work but not immediately available, then among those available but not actively seeking, and finally among the persons fully outside the labour force, who are neither seeking nor available. Each step marks a weaker link to the labour market, forming a continuum from full integration to complete detachment.
The 19th ICLS (2013) subsequently codified the indicators on underemployment and potential additional labour force as international standards. 10 Eurostat then removed the “experimental” label and began disseminating them—combined with unemployment under the heading labour-market slack—as official EU statistics. 11
Labour market slack refers to all unmet employment needs and comprises the four components of unemployment described above: (1) the unemployed, as defined by the ILO; (2) underemployed part-time workers; (3) people who are actively seeking work but are not immediately available; and (4) people who are available but not actively seeking work. Alongside the concept of labour market slack, international standards introduced the notion of extended labour force. This expands the traditional labour force (employed and unemployed) to include the additional potential labour force—specifically, groups 3 and 4. Labour market slack and its components are expressed as a percentage of the extended labour force, allowing for meaningful comparisons across countries.
In the context of unemployment statistics, we propose a fuzzy unemployment rate that incorporates underemployment directly into the calculation. While this relates to group 2 of labour market slack, our definition of underemployment differs from that used by Eurostat. In fact, we focus only on involuntary part-time workers and additionally include full-time workers who work fewer hours than the median and would like to work more. This definition reflects our interest in workers’ own perspectives, particularly their dissatisfaction with their working hours, which often signals income insufficiency. In contrast, Eurostat's group 2 includes all part-time workers who would like to work more hours, regardless of whether their part-time status is voluntary.
Methodology
The basic assumption of our proposal 7 is that workers are employed to a certain degree, represented by a membership function µE in the fuzzy subset E of the employed. This function ranges from 0 (no membership) to 1 (full membership).
Contextually, the membership function µU in the fuzzy subset U of the unemployed is defined. Assuming that the fuzzy set U of the unemployed is the complement of the fuzzy set E of the employed in the space of the labour force, the membership function in the fuzzy set U is given by µU = 1 − µE.
For persons outside the labour force, the membership functions µE and µU are set equal to 0.
Figure 1 illustrates how the entire set of employed is divided into five groups and how the µE membership function is derived for each group. The membership function depends on the number of hours usually worked by the individuals and their satisfaction with those hours. An upper threshold for worked hours is established, serving as a limit based on statutory or collectively agreed standards. This threshold corresponds to the median number of hours usually worked by full-time employees, calculated in each country, separately for self-employed persons, employees in the private sector and employees in the public sector.
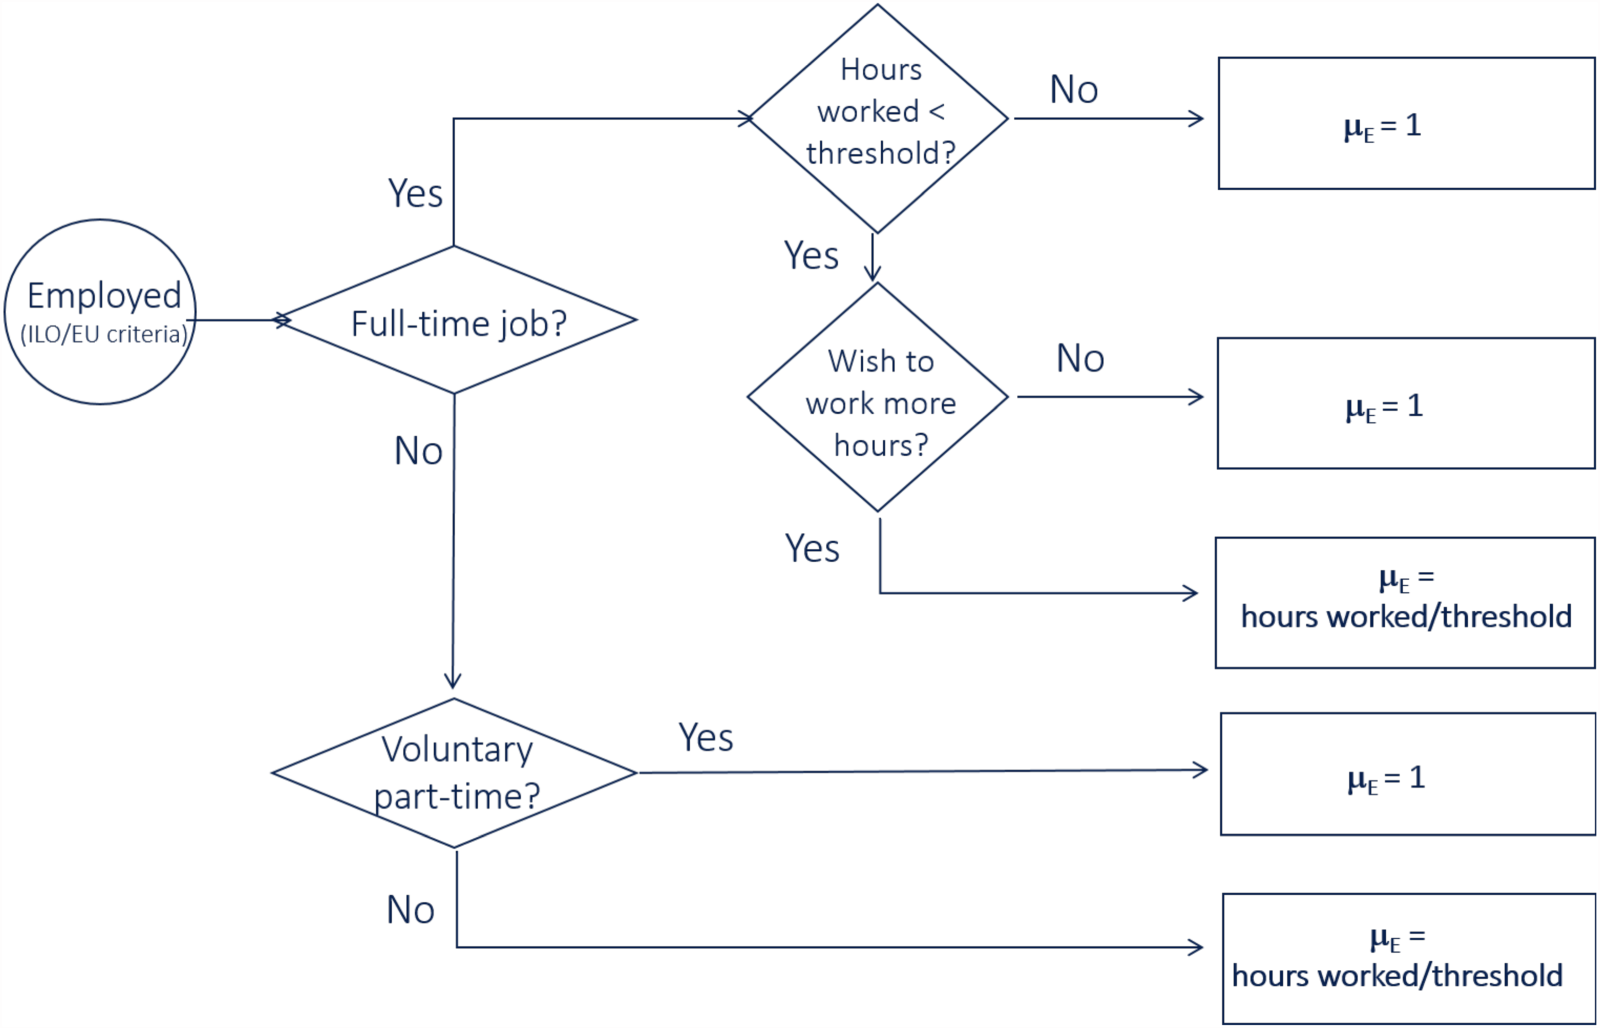
Specification of the membership function µE for individuals who are employed according to the ILO/EU criteria, Source:. 7
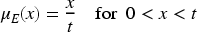
Denoting by x the number of hours worked and by t the threshold, the membership functions µE and µU are defined as follows.
Full-time workers who work a number of hours equal to or greater than the threshold (x ≥ t). Full-time workers who do not wish to work additional hours, even if they work fewer hours than the threshold (x < t). Voluntary part-time workers (x < t).
Involuntary part-time workers (x < t) Full-time workers who work below the threshold and wish to work additional hours (x < t).
This segment of the labour force represents the most vulnerable group of workers. These individuals are likely facing economic difficulties, as they have expressed a willingness to work additional hours. For this category of workers, the value of the membership function µE is calculated as the ratio of the number of hours worked to the threshold value, as follows:
Once each member of the labour force has been assigned their respective µE and µU values, we can proceed to calculate the fuzzy employment and unemployment rates.
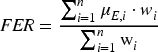
The fuzzy employment rate (FER) is calculated as the weighted arithmetic mean of individual membership values µE,i with weights wi representing the sample weights from the survey providing the employment data:
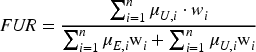
The weighted mean of the µU membership function across the sampled individuals yields the fuzzy unemployment rate (FUR), which can be directly compared to the official unemployment rate for the same age group.
Application to EU-LFS data
We applied the fuzzy approach to data from the EU-LFS for the reference year 2023 (The responsibility for all conclusions drawn from the data lies entirely with the authors). The analysis includes 30 European countries: 27 EU countries plus Switzerland, Norway and Iceland.
We used the survey information, with reference to the following sets of questions, as reported in the EU LF survey database user guide
12
: - FTPT and FTPTREAS, for the identification of voluntary and involuntary part-time workers; - HWUSUAL (or CONTRHRS or else HWACTUAL, if HWUSUAL was not available) for the number of hours usually worked or the hours indicated in the work agreement or else the hours worked on average in the last month; - WISHMORE for investigating the willingness to work more hours.
Finally, for deriving the threshold, we have drawn on the following variables: - STAPRO for the status in employment in the first job; - NACE2_1D for the economic activity. This variable served to distinguish between the public and private sectors. By assumption, the public sector includes Administrative and Support Service Activities (code O), Public Administration, Defence, and Compulsory Social Security (code P), and Education (code Q).
More specifically, the steps for classifying the workers into the five categories mentioned in Section 3 and depicted in Figure 1 are reported in Table 1.
Procedure for classifying the employed into separate categories.
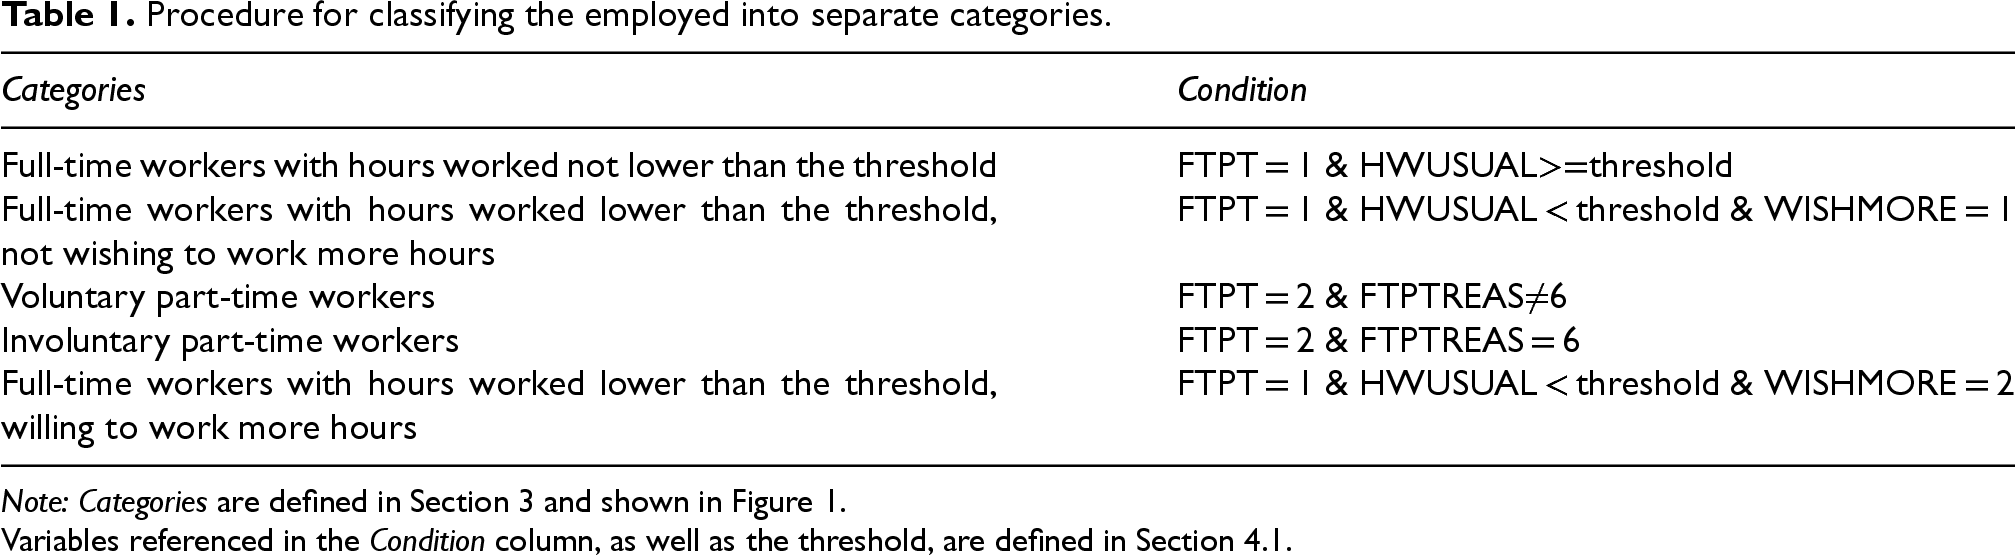
Procedure for classifying the employed into separate categories.
Note: Categories are defined in Section 3 and shown in Figure 1.
Variables referenced in the Condition column, as well as the threshold, are defined in Section 4.1.
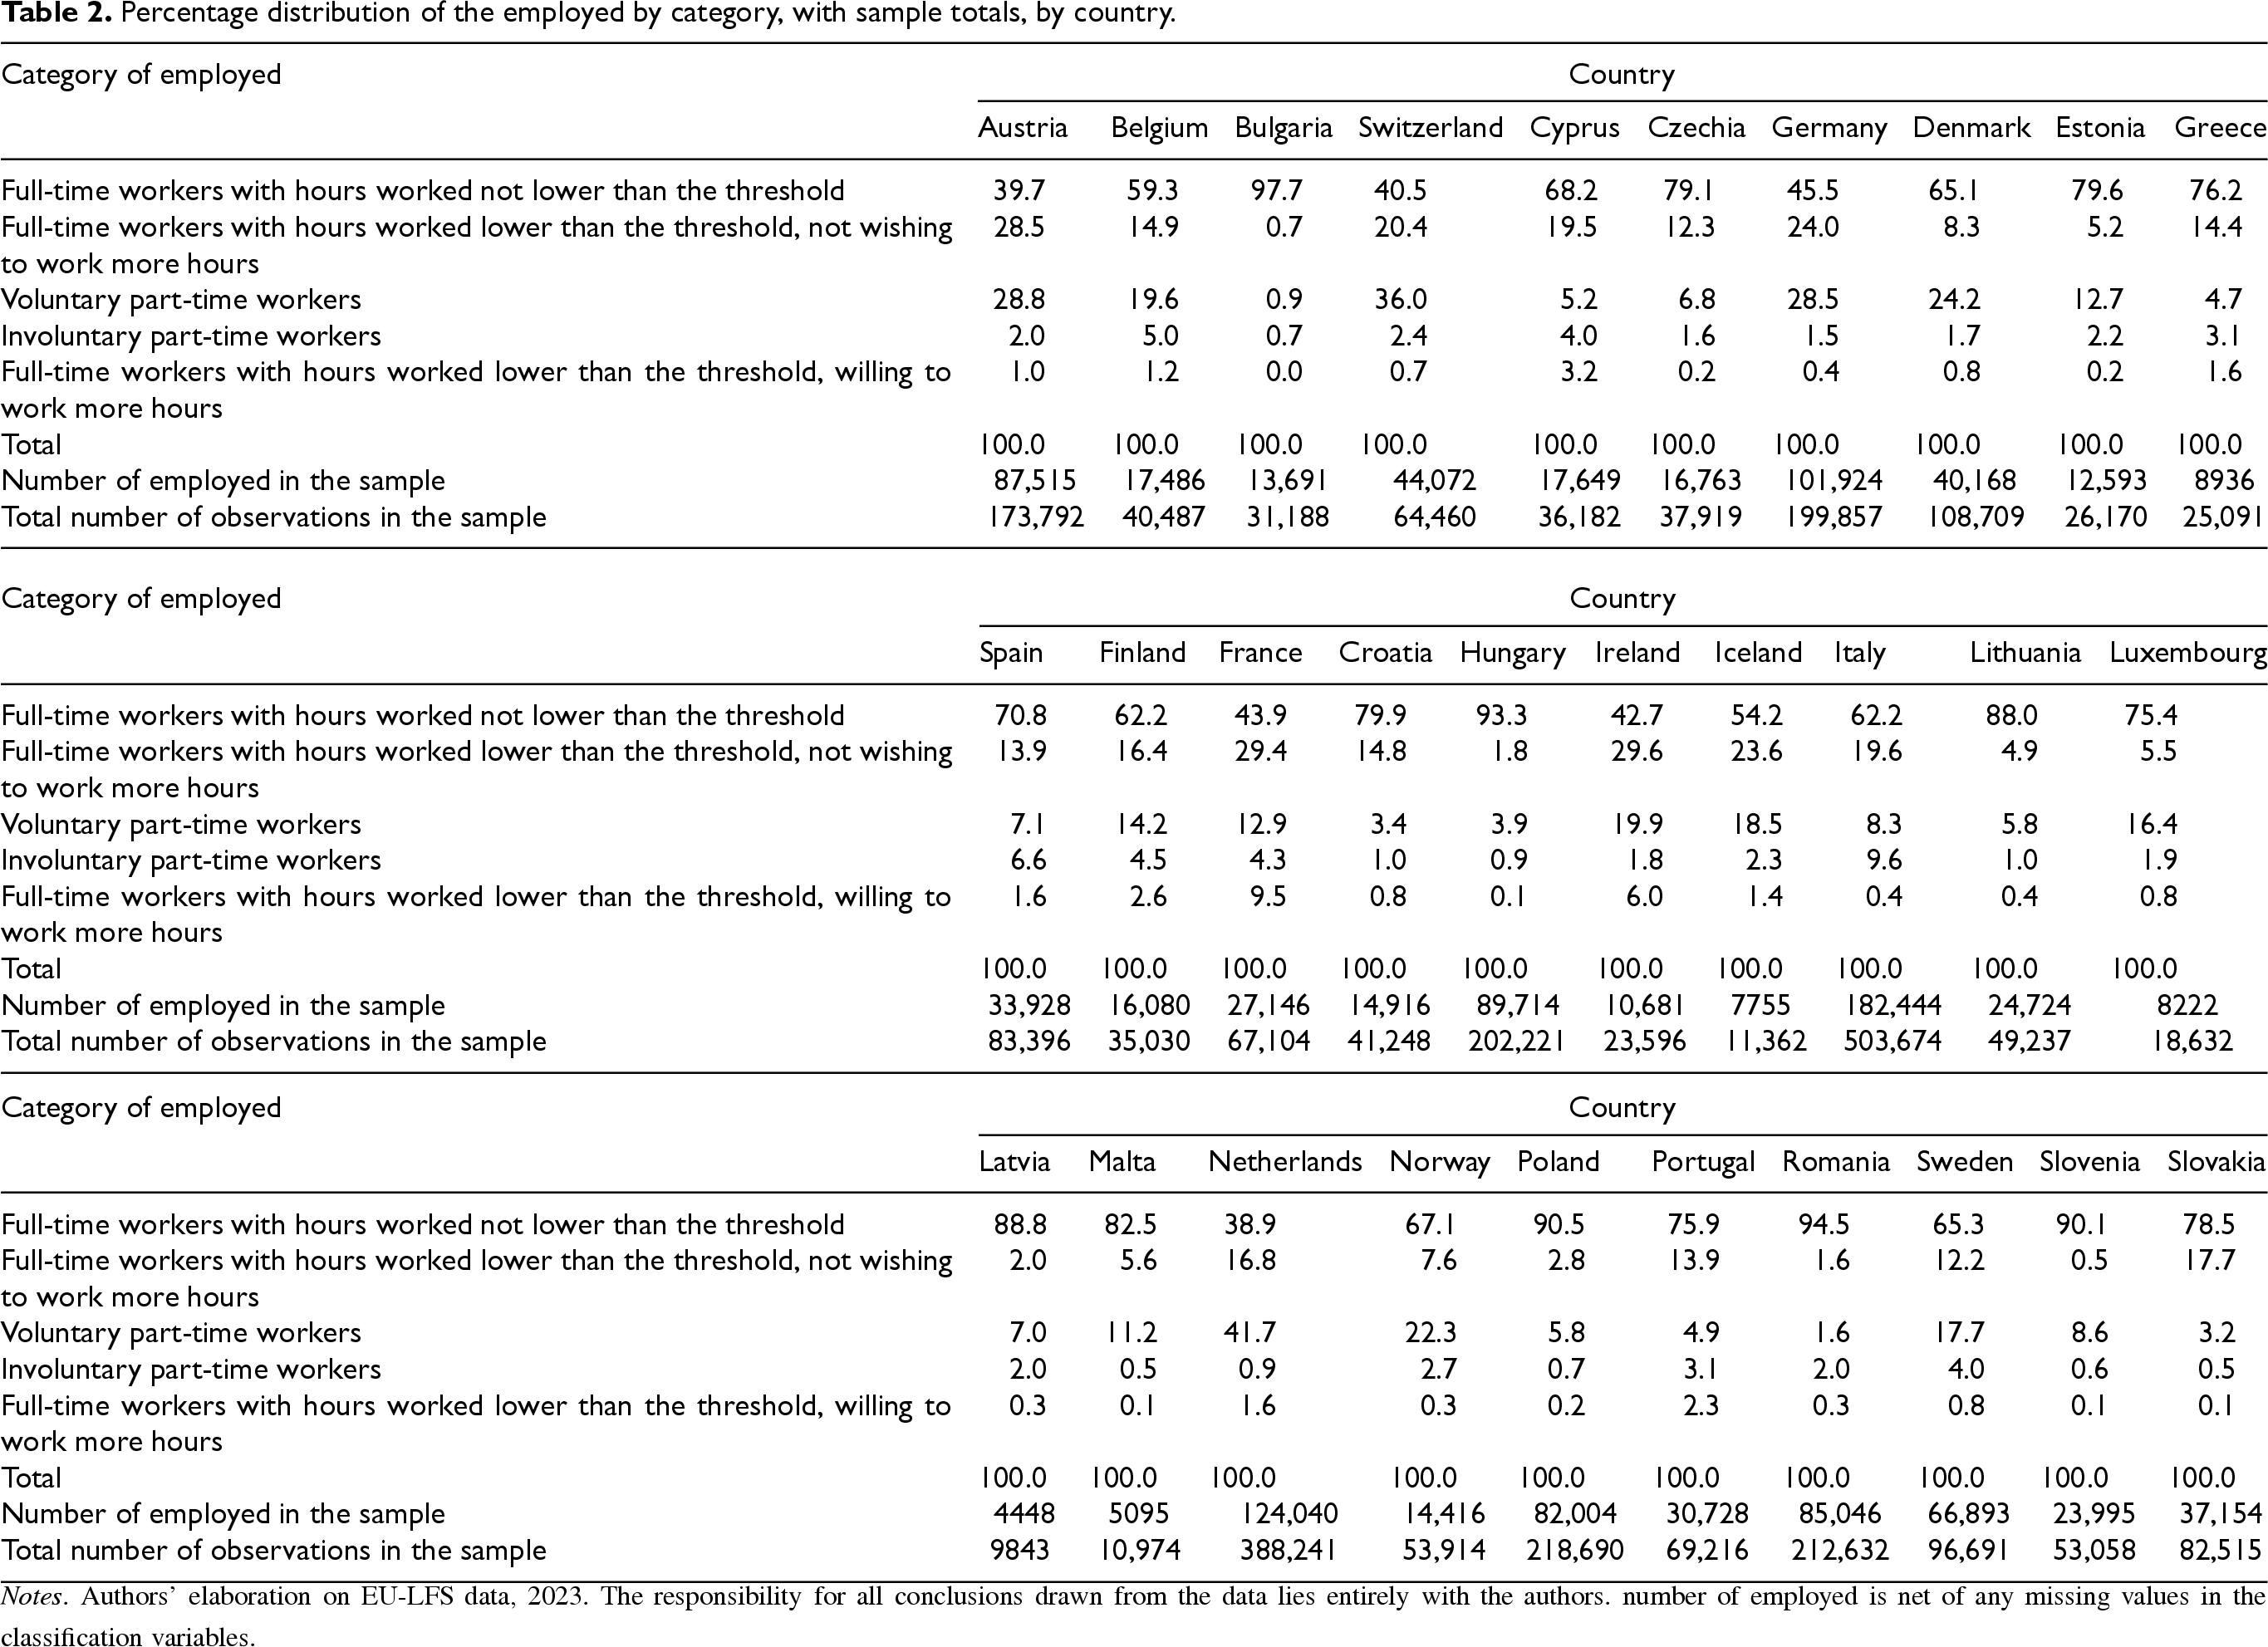
Table 2 reports the percentage composition of workers in each country across the five categories.
Percentage distribution of the employed by category, with sample totals, by country.
Percentage distribution of the employed by category, with sample totals, by country.
Notes. Authors’ elaboration on EU-LFS data, 2023. The responsibility for all conclusions drawn from the data lies entirely with the authors. number of employed is net of any missing values in the classification variables.
Full-time workers whose hours worked meet or exceed the threshold account for more than 90% of all workers in Hungary, Poland, Romania, and Slovenia and reach around 98% in Bulgaria. In these countries, the low share of part-time contracts is accompanied by a low variability of hours worked by full-time workers.
Part-time work as a choice to reconcile work and private life is widespread in many central European countries: the Netherlands and Switzerland stand out with the highest percentages, 41.7% and 36% of the total employed, respectively. They are followed by Austria and Germany, where low-intensity contractual forms such as German mini-jobs are widespread.
Involuntary part-time jobs generally account for a smaller share than voluntary ones. Italy is an exception, with 9.6% of employed people working part-time because they cannot find full-time work, compared to 8.3% of part-time workers who have chosen this type of employment. Other Mediterranean European countries, such as Spain, Cyprus and Portugal, have lower percentages of involuntary part-time workers than Italy, and these percentages are lower than those of voluntary part-timers.
Finally, the share of full-time workers with hours worked below the threshold who wish to work more hours is generally low across countries. In France and Ireland, however, it reaches 9.5% and 6% of the total number of employed persons, respectively.
The proportion of workers who are only partially employed (i.e. those included in the groups of involuntary part-time workers and full-time workers who work below the threshold and wish to work more hours) varies considerably across countries.
In most European countries, the proportion is relatively low, at around 5%. The shares are above 6% and below 10% for Spain, Ireland, Cyprus, Finland, and Belgium, while they reach 10% in Italy and 13.8% in France. In countries with higher shares, the shift from official to fuzzy measures will lead to a greater reduction in employment and consequently, a greater increase in unemployment than in other countries.
Figure 2 compares the official unemployment rate and the fuzzy rate for each country. Countries are ranked by decreasing values of the official rate, from Spain (12.2%) to Czechia (2.6%).
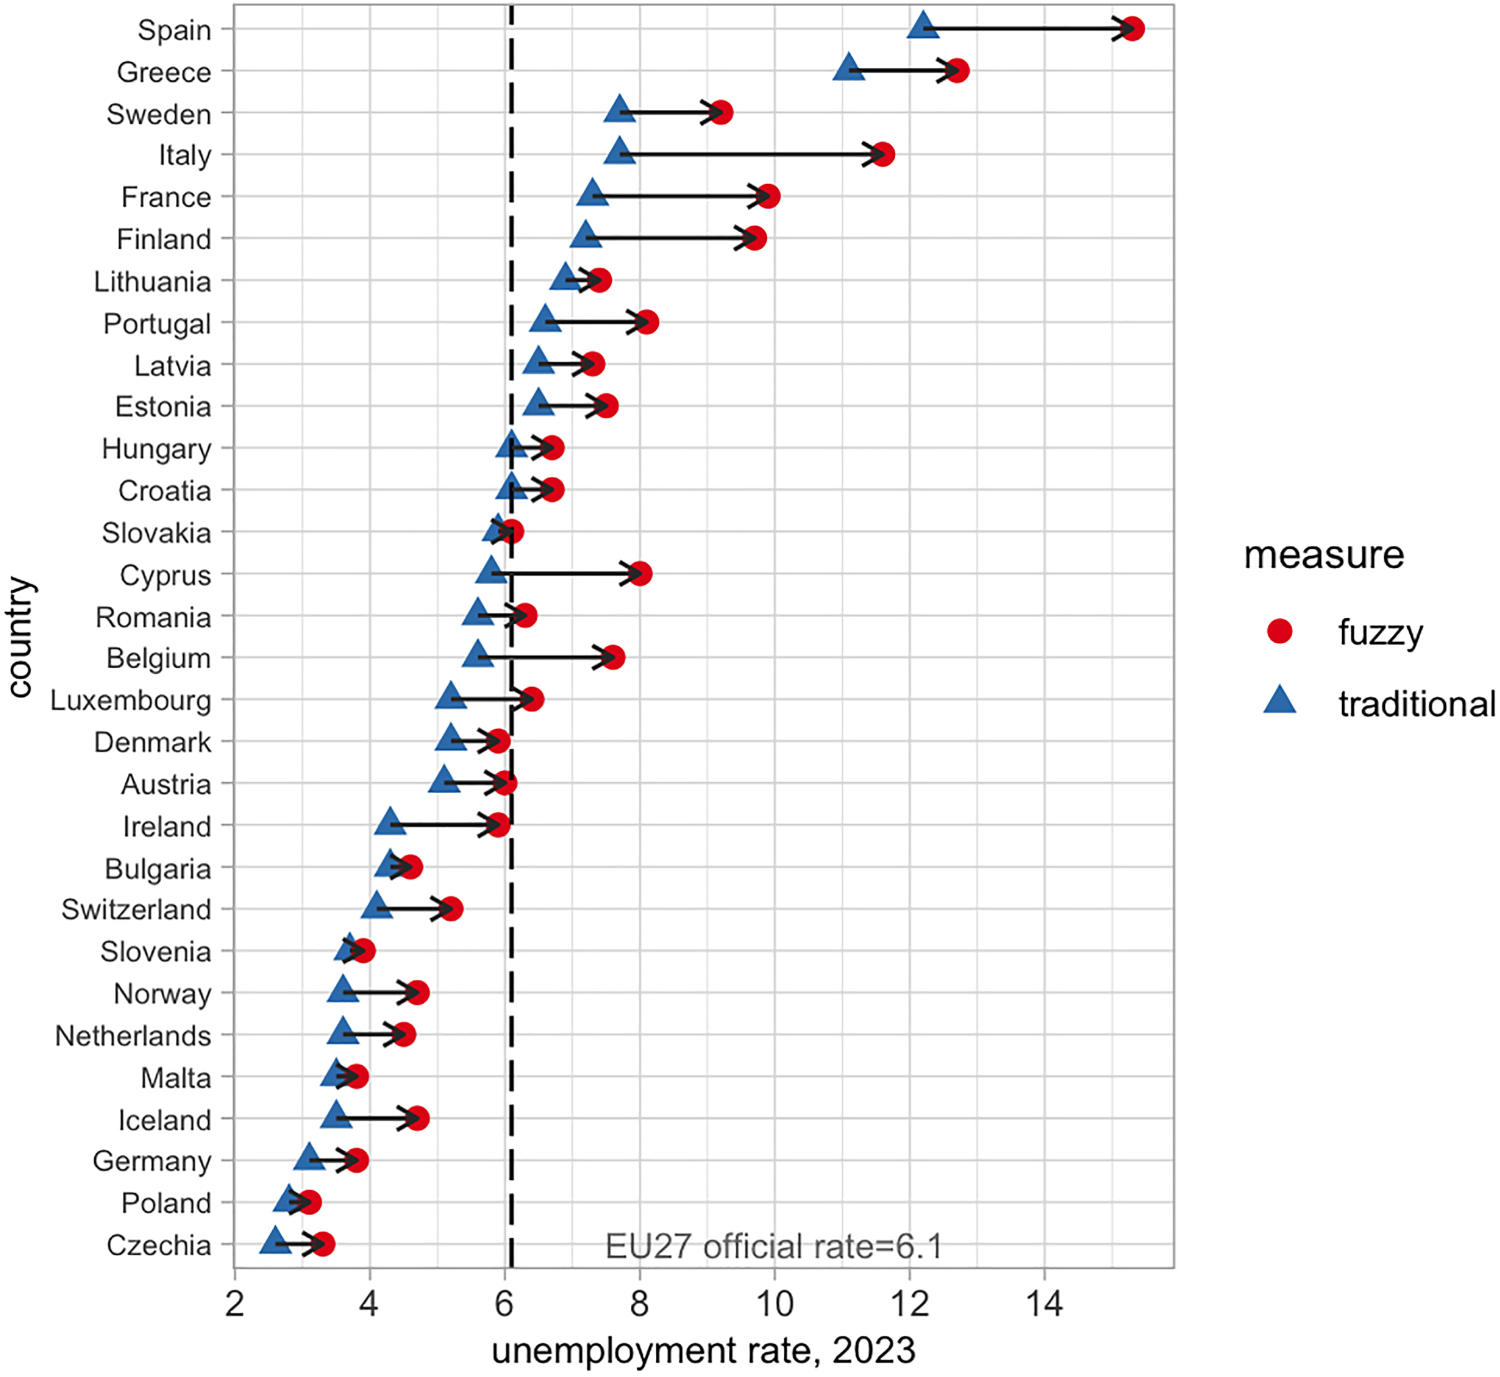
Comparison between official and fuzzy unemployment rates (15–74 years) by country - year 2023. Note: Authors’ elaborations on EU-LFS 2023 data.
The most considerable changes from the official to the fuzzy unemployment rate concern Italy and Spain (with differences of more than 3 percentage points) and France and Finland, where the fuzzy rate exceeds the official rate by more than 2.5 percentage points. These countries also have a higher official unemployment rate than the EU27 average . In the four mentioned countries, fuzzy unemployment rates rise most—compared to official rates—for women, youth under 30, migrants, and the least educated (Table 3).
Unemployment rate. Traditional and fuzzy indicators, by personal characteristics of the worker, 2023.
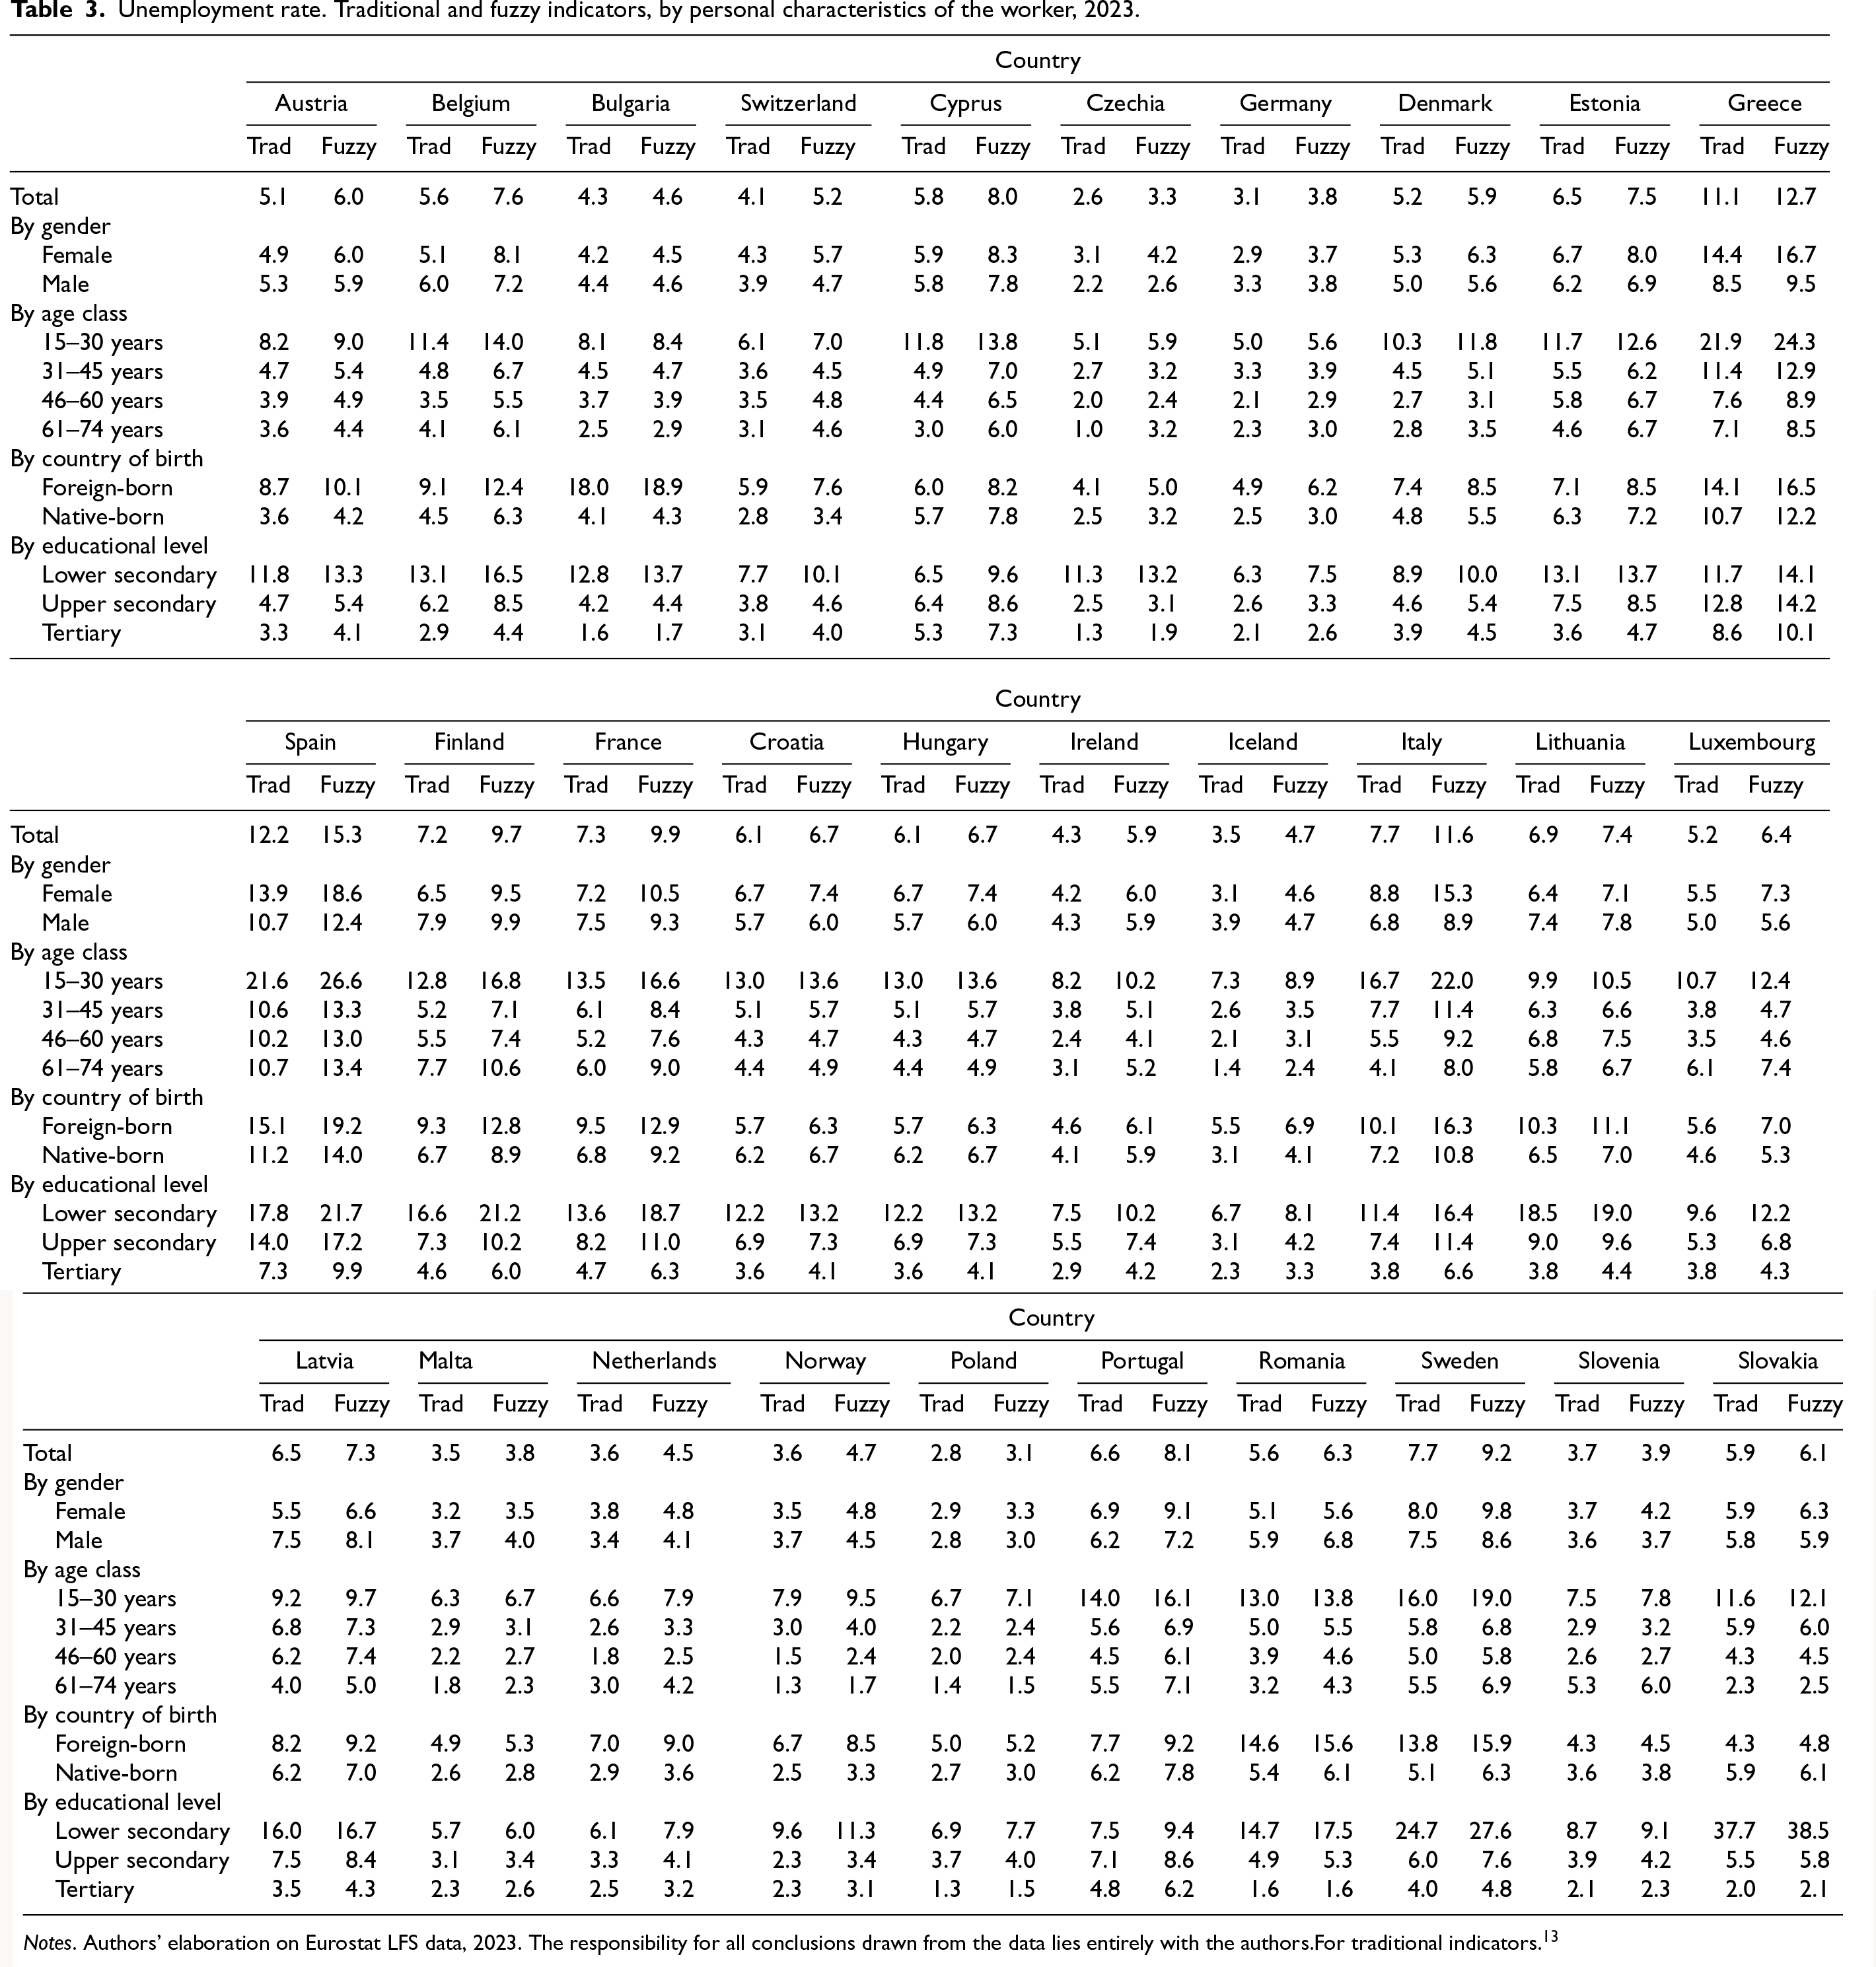
Notes. Authors’ elaboration on Eurostat LFS data, 2023. The responsibility for all conclusions drawn from the data lies entirely with the authors.For traditional indicators. 13
The fuzzy unemployment rate proposed in this study explicitly incorporates underemployment into its calculation, treating it as a partial form of unemployment. While the official unemployment rate does not reflect underemployment, Eurostat addresses it separately within its labour market slack statistics (see Section 3). Thus, both approaches consider underemployment, but with different connotations: in our fuzzy framework, it directly shapes the unemployment rate, whereas in Eurostat's framework, it is reported as a distinct component of labour market slack.
As previously discussed in Section 2, the definition of underemployment used by Eurostat differs from the one adopted in our approach. This section provides a more in-depth examination of these definitional differences and presents the results of a comparative analysis.
Figure 3 displays the segment of underemployed individuals identified according to the Eurostat definition, alongside those captured by our approach, clearly highlighting the areas of overlap.
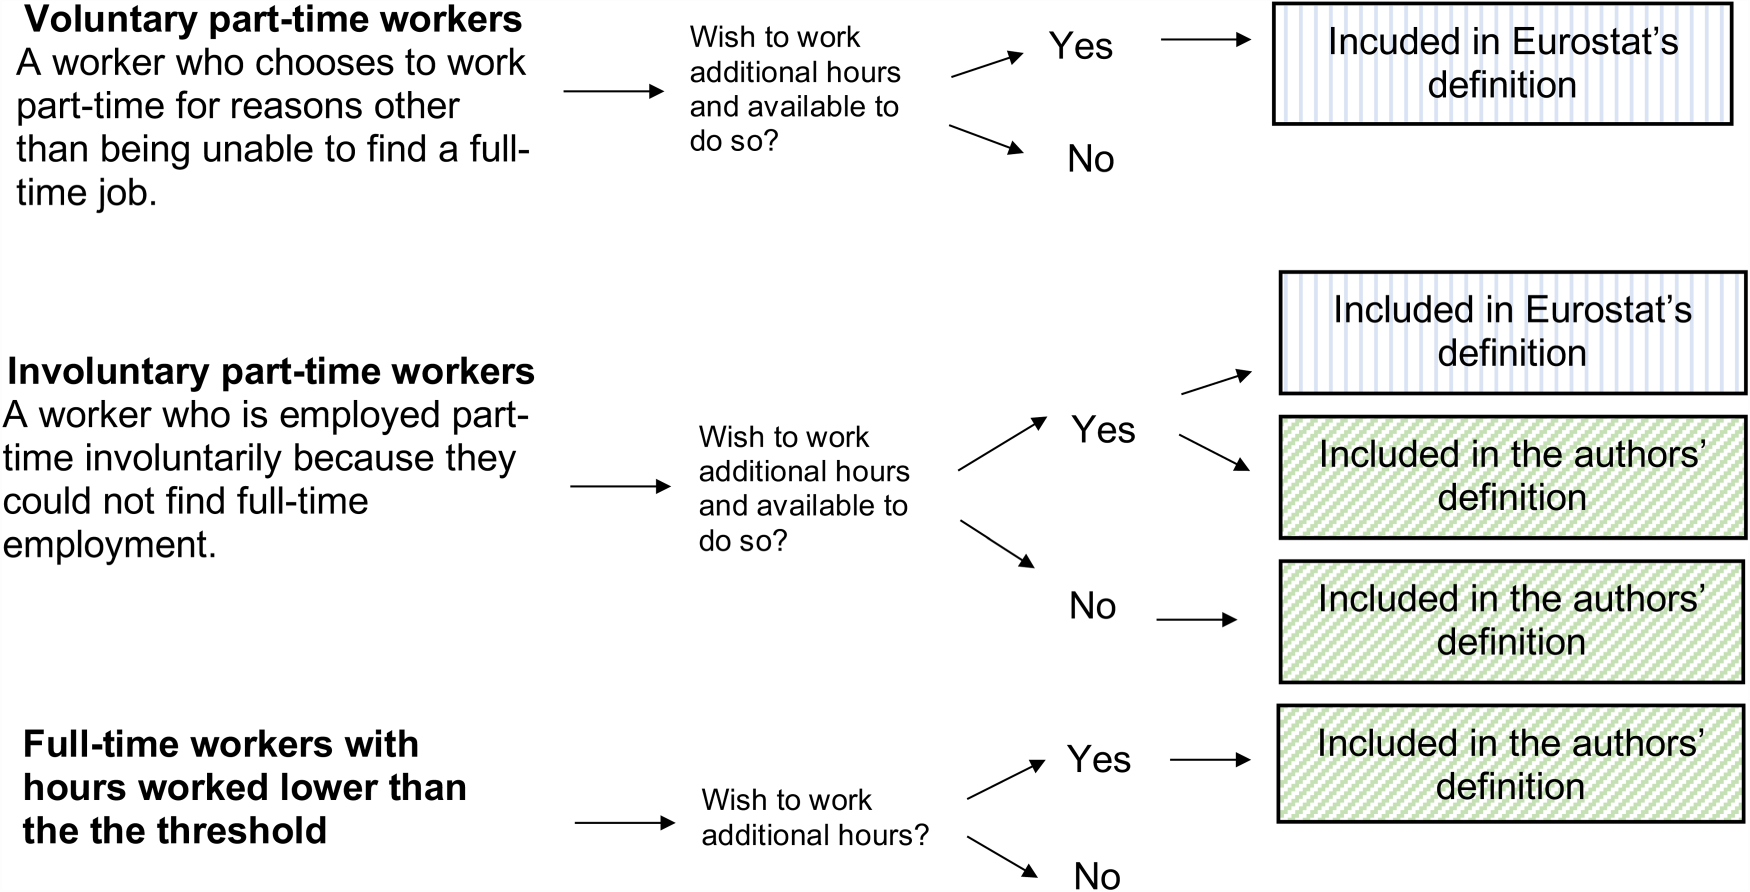
The definition of underemployment in Eurostat's Slack Statistics versus the authors’ definition.
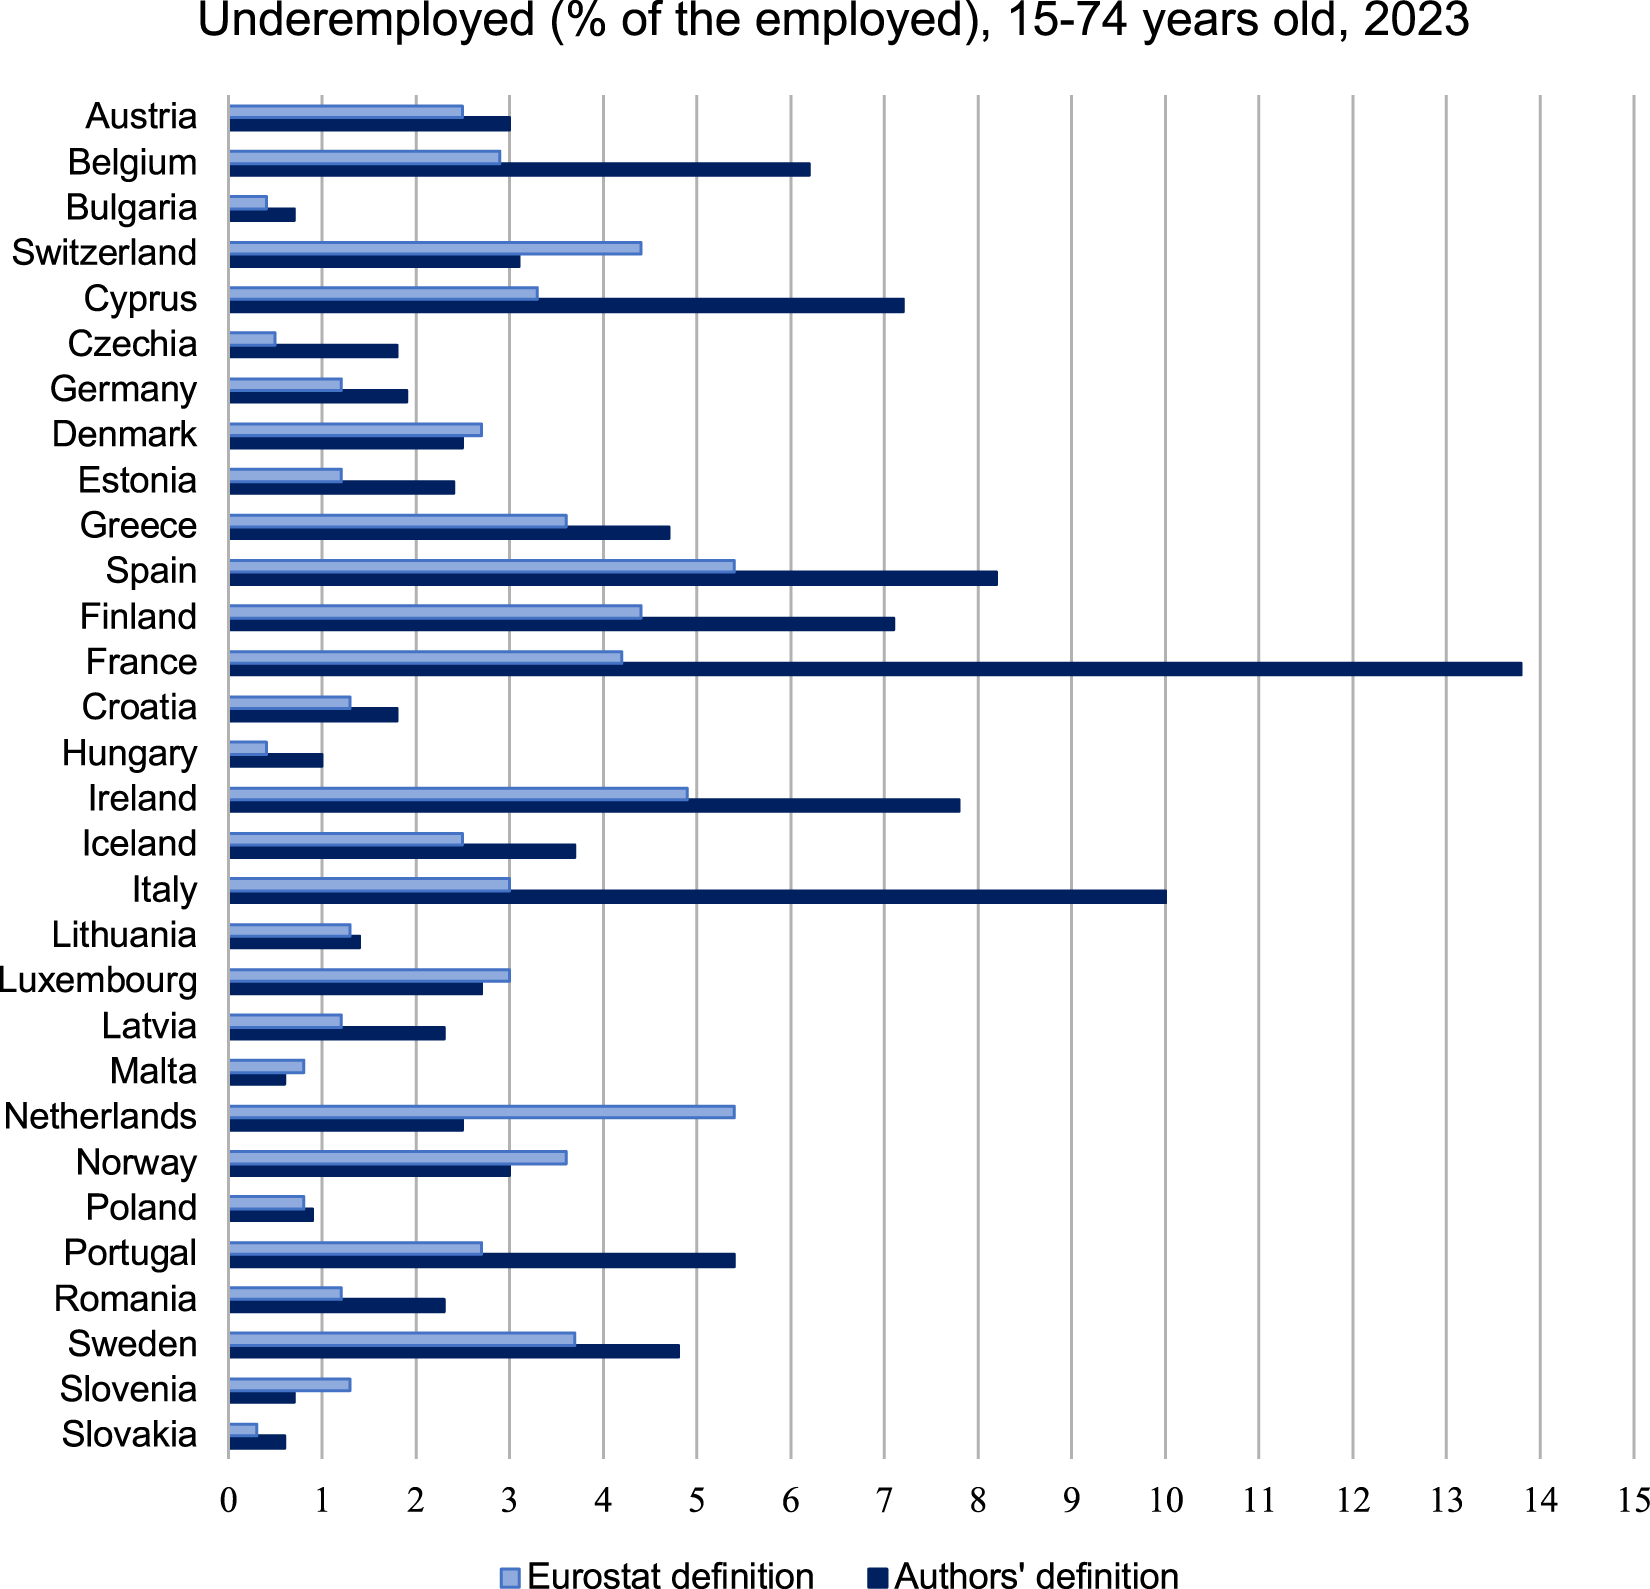
Comparison of underemployment according to Eurostat and the authors’ definitions. Note: Underemployment is expressed as a percentage of the total employed population aged 15–74. Authors’ elaborations on EU-LFS 2023 data.
Eurostat's definition of underemployment covers part-time workers who wish to work more and are available to do so, regardless of their choice to work part-time rather than full-time. Furthermore, according to Eurostat's definition, full-time workers are not considered to be potentially affected by underemployment.
In this study, we classify all involuntary part-time workers as underemployed, as they explicitly state in the LFS that they accepted part-time work only because they were unable to find full-time employment. Furthermore, we add full time workers who work fewer hours than the median and state in the LFS that they would like to work more.
The two definitions capture slightly different aspects of underemployment. Their intersection consists of involuntary part-time workers who both want to work more hours and are available to do so.
Figure 4 shows underemployment as a percentage of the total employed population aged 15–74, based on both the Eurostat definition and the definition used in this study. The differences are particularly significant in France and Italy, where our definition yields rates that are 9.6 and 7 percentage points higher, respectively. In France, this is largely due to the large number of full-time workers working fewer hours than the median who wish to work more. In Italy, the gap is driven by the prevalence of involuntary part-timers, who are all considered underemployed in our approach, whereas Eurostat includes only those who explicitly state a desire to work more hours.
Underemployment as defined in our study exceeds 5% and is higher than the Eurostat figure in Cyprus, Belgium, Ireland, Spain, Portugal, and Finland. Conversly, Eurostat reports higher rates than ours in the Netherlands and Switzerland, largely because these countries have many voluntary part-time workers, who are excluded from our definition of underemployment but included in Eurostat's.
Analysing the proportion of underemployed (based on our definition) by some characteristics of the worker and the work performed (Table 4), it can be seen that Italy, together with Spain and Belgium, show the most pronounced gender gap: women are over twice as likely to be underemployed as men. In most countries, underemployment affects younger workers more severely: in France and Italy, the highest percentages are observed for workers up to 30 years of age, 20.4% and 15.3%, respectively.
Underemployment according to the authors’ definition (as a % of employed), 2023.
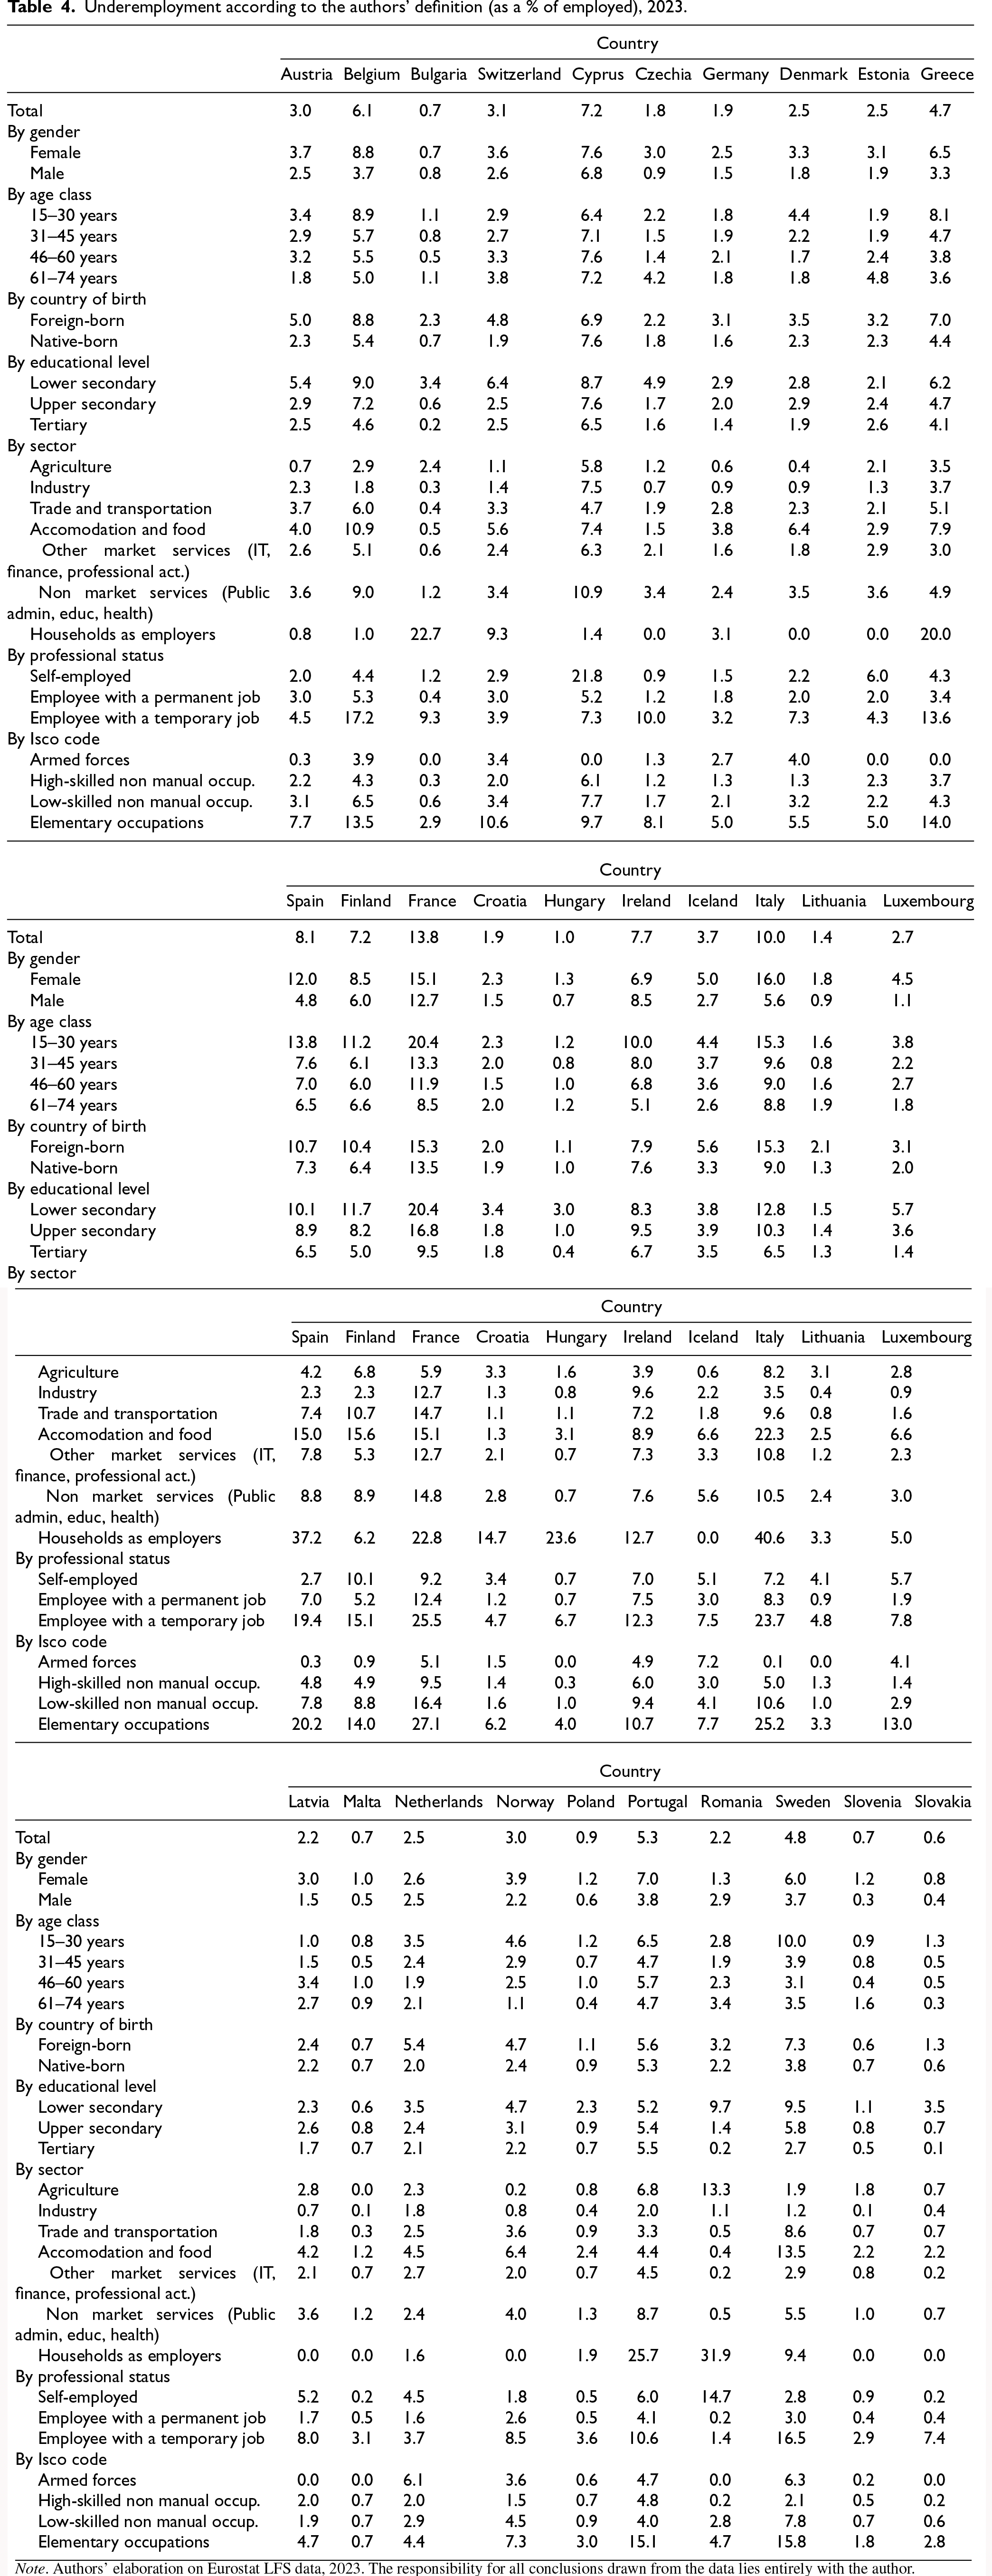
Note. Authors' elaboration on Eurostat LFS data, 2023. The responsibility for all conclusions drawn from the data lies entirely with the author.
Generally, those with lower educational qualifications, temporary contracts, and elementary employment have a higher risk of being underemployed. In particular, the percentage of underemployed workers in elementary occupations reaches 27.1% in France and 25.2% in Italy.
In most countries, the highest percentage of underemployment is observed among those working in the accommodation and food sector, public administration, education and health (non-market services), and among staff employed by households for domestic or personal care activities. Notably, 22.3% of Italian workers in the accommodation and food sector are underemployed. Among domestic helpers and caregivers, 37.2% of workers in Spain and 40.6% in Italy are underemployed.
In this study, we do not consider employment and unemployment as two distinct categories, but rather as conditions that individuals experience to varying degrees. In our fuzzy approach, a worker dissatisfied with their working hours is considered only partially employed (thus reducing the number of employed individuals) and, at the same time, partially unemployed (thus increasing the number of unemployed individuals). Indeed, in our view, underemployment is a form of poor employment and consequently a kind of unemployment.
The resulting fuzzy employment and unemployment rates may differ from the official ones to the extent that underemployment is prevalent. Precisely because they incorporate underemployment, these rates provide more informative insights than official statistics. As the analysis presented in the article shows, similar official unemployment rates can conceal significantly different realities in terms of underemployment. For instance, both Italy and Sweden recorded an official unemployment rate of 7.7% in 2023, yet their fuzzy unemployment rates were 11.6% and 9.2%, respectively, pointing to a more critical situation in Italy. Fuzzy unemployment rates are significantly higher in countries such as Italy, Spain, France, and Finland, particularly among vulnerable groups including women, young people, immigrants, and individuals with lower levels of education.
We argue that acknowledging underemployed and dissatisfied individuals behind the seemingly reassuring label of “employed” is crucial for developing effective policy interventions. This need is underscored by our findings, which reveal that fuzzy unemployment rates are particularly elevated among the most vulnerable segments of the labour force.
Future research will seek to extend the fuzzy approach to the boundary between unemployment and being outside the labour force, based on the premise that these are not strictly mutually exclusive categories. This blurred area is occupied by the additional potential labour force: individuals who are officially classified as being outside the labour force but who demonstrate a clear interest in employment. Unlike those unwilling or unable to work, they may be regarded as partially unemployed and, therefore, part of the fuzzy set of the unemployed. Extending the fuzzy approach to both boundaries of unemployment would allow the construction of a fuzzy unemployment rate that captures two important phenomena: involuntary underemployment among the employed, and discouragement or barriers to job search among individuals outside the labour force (e.g. family responsibilities or limited access to employment services). The main challenge for this extension lies in identifying suitable indicators to measure the degree of unemployment among individuals belonging to the additional potential labour force.
Footnotes
Funding
The authors received no financial support for the research, authorship, and/or publication of this article.
Declaration of conflicting interests
The authors declared no potential conflicts of interest with respect to the research, authorship, and/or publication of this article.