
Abstract
ESCO skill classifiers, which scan job ads to identify skills at the finest level of the taxonomy, are widely used in international statistical projects and by national employment agencies. However, to our knowledge, no systematic evaluation of these classifiers has been conducted across large sets (i.e., thousands) of ESCO skills. We introduce a method for evaluating ESCO skill classifiers, addressing two key challenges: the large number of skills (up to around 14 000) and severe class imbalance. Our approach relies on matrix sampling of skills and job ads, with clustering and stratification, and uses bootstrapping to estimate standard errors for classifier comparisons. We apply the method to three classifiers using a sample of Luxembourgish IT and finance job ads. Our results indicate that the classifiers achieve acceptable accuracy despite low recall. Notably, the text matching classifier performs competitively, even against methods based on large language models.
Introduction
Data on job advertisements have become increasingly available over the last decade. These data are considered the main source of information on skill demand across economies.1,2 Therefore, statisticians, data scientists and researchers across academia, public and private institutions and international organisations have developed a variety of skill classifiers. A skill classifier, in this paper, is defined as an algorithm that automatically reads job ads and identifies the skills contained therein. In this way, it is possible to produce statistics on how many job ads require certain skills in given economies or data sources. Skill classifiers usually classify skills according to existing taxonomies. In this paper, we focus on the most granular level of the European Skills, Competences, Qualifications and Occupations (ESCO) skill taxonomy,3,4 which is widely used in skill statistics. Our contribution is to introduce an evaluation methodology for skill classifiers operating at the most granular level of the ESCO taxonomy.
Skill data can be used for many applications, for example for labour market analysis or matching algorithms.5–8 For these applications, it is necessary to evaluate the classifiers. However, skill classifier evaluations are uncommon in practice and in the literature. In 2021, a comprehensive literature review on skill classifiers 2 dedicated only a short section to classifier evaluation, with only one referenced paper. 9 The authors of that paper evaluate only what they call “recall-oriented” metrics based on model positives (i.e., skills found by the algorithm); this means that their evaluation does not address the problem of skills not found by the algorithm. Some recent papers have made important advances in the field of evaluating skill classifiers, but they still fall short of the needs of potential users of such algorithms – such as public employment services, training institutes and labour market statisticians. For example, a recent study 10 evaluates skills classifiers based on a more specific skill taxonomy, much smaller than ESCO. Another study 11 makes available an annotated dataset of job ad sentences and ESCO categories, but it focuses on the highest level of the ESCO hierarchy, distinguishing only between “skills” and “knowledge” (and not on which specific skill or knowledge it is, for example “English”, “SQL”, etc.).
A crucial challenge in evaluating classifiers across all skills is the wide and detailed coverage of the ESCO skill taxonomy (with around 14 000 different skills). One implication is that such a large taxonomy is inevitably affected by some inconsistencies commonly found in semantic models,
12
which experts evaluating the classification must learn to deal with. In addition, there are two other important implications: An ESCO skill classifier is essentially a collection of thousands of individual skill classifiers, making it difficult to evaluate them all simultaneously. Skills are often narrowly defined, leading to class imbalance. Most skills are completely absent even from large databases, while relatively common ones appear only in a small percentage of ads. This makes evaluating individual skills difficult, as reviewing even several hundred ads (a time-consuming task) may yield only a few instances of a given skill.
An alternative solution in the academic literature11,13 is to classify skills at a higher level of the ESCO hierarchy, substantially reducing the number of classes. However, this is not the direction in which leading projects in this field, like Eurostat's Web Intelligence Hub 14 or the European Data Space for Skills 15 are moving. The reason is probably that, on the labour market, skill demand tends to be specific rather than general. For example, an employer is more likely to require “Python (computer programming)” or “English” (most granular level of the hierarchy) than “software and applications development and analysis” or “languages” (second-most granular level of the hierarchy).
The contribution of this paper is to present two novel methods to evaluate ESCO skill classifiers while overcoming the problems posed by the large number of skills and class imbalance. These methods are based on expert annotation of skill-ad couples, in which experts evaluate whether a certain job ad requires a given skill. A sampling strategy involving careful stratification and clustering across skills and ads helps keep annotation work manageable while ensuring a comprehensive evaluation. When standard errors are needed, they are calculated using bootstrapping. A major limitation of this strategy is that it is based on the results of the classifier(s) under evaluation. This implies that the annotation data is tailored to the specific evaluation exercise, and cannot be used to repeat the same evaluation on other models.
Our results suggest that the accuracy of our classifiers is overall satisfactory. However, the three classifiers that we evaluate produce a large proportion of false negatives, i.e., skills that are demanded by job ads but they are not able to detect. This result is consistent with previous attempts to identify ESCO skills in job ads. 12 One reason could be the inherent difficulty in identifying a large number of skill requirements: we estimate that a job ad requires 262 ESCO skills, on average across our sample of job ads in IT / finance in Luxembourg. The text matching algorithm tends to outperform classifiers based on large language models for the most common skills, while no significant differences are observed for other skills (possibly due to insufficient statistical power). Finally, we observe that each classifier identifies a very different set of skills.
However, it is important to note that our results are specific to the set of skills and ads assessed in the paper. The ads were sampled from ADEM's database and are all from the Luxembourgish IT and finance industry. The choice of the skill sampling scheme was driven by the practical needs of the database users and developers, as explained in Section 3.
The next section presents three different skill classifiers developed by the authors. Section 3 describes the method to evaluate a single ESCO classifier across skills, and applies it to our text matching classifier. Section 4 discusses the extension of this methodology to compare classifiers, with a focus on the comparison between our text matching classifier and another classifier developed by us using a pre-trained large language model (GPT-4o). Section 5 draws some conclusions.
Skill classifiers
The classifiers evaluated in this paper have been developed by the authors based on a review of the literature and best practices. Luxembourg's Public Employment Service (ADEM) has two classifiers in place developed by the authors from ADEM, both using methods common in the literature 2 : we will call them the text matching classifier and the sentence embedding classifier. In addition, a classifier using GPT-4o (hereafter referred to as the GPT4 classifier) was set up by the authors of this paper at LIST. These three classifiers are briefly described below.
The text matching classifier
The text matching classifier associates a list of tags (or keywords/labels) to each skill and performs a fuzzy search for these keywords in the text of the ads (broadly following the “ontology matching” approach1,7). It is multilingual, supporting French, English and German, the three main languages of the Luxembourgish labour market. The algorithm performs a first cleaning of the text, particularly through the removal of a list of stopwords originally scraped from Wikimedia
16
and augmented by the authors based on inspection of ADEM's job ad database. The text matching classifier, implemented in R,
17
uses different matching rules based on the length and complexity of the tag: Tags no longer than 4 characters (e.g., “R”, “SQL”) are matched exactly through a case-sensitive search. Single-word tags between 5 and 11 characters (e.g., “geomatics”) are matched in the text as they are, but without case sensitivity. Multi-word tags and tags longer than 11 characters (e.g., “demonstrating leadership”) are matched after stemming, i.e., reducing all words contained in the tags and the job ad to their semantic roots using the Snowball algorithm.
18
The list of tags is based on the “preferred labels” and “alternative labels” provided by ESCO. The labels have been modified based on data inspection and on identifying potentially equivalent tags. Potentially equivalent tags have been identified through our previous experience with labour market data and also through the use of Word2Vec 19 to find words in ADEM's job ad database that are associated with ESCO labels. For example, the label “Scrum” has been added to the skill “Agile project management”. In addition, we removed ambiguous and misleading labels through a systematic cleaning process – for example, “equipment” was an alternative label for “compile airport certification manuals”, but it was removed because it was considered too vague. The algorithm was run repeatedly on samples of 10 000 job ads (and finally on the full population of job ads at ADEM), and after every run, we inspected the matched labels of the 100 most frequently found skills. The process was repeated until the two authors who performed the cleaning agreed that the results for none of the top 100 skills were grossly affected by some ambiguous or misleading label.
The sentence embedding classifier
Some contributions in the literature20,21 propose to use models of the BERT family 22 to identify skills at the sentence level. Following this approach, our sentence embedding classifier starts by calculating an embedding vector for every skill in the ESCO classification and for three languages (French, English and German). This is done by concatenating the ESCO description and preferred and alternative labels, using a word (“meaning”, or its French/German equivalent) to connect the two. For example, description and labels of the skill “write Finnish” are concatenated into “Compose written texts in Finnish, meaning write Finnish, correspond in written Finnish, writing Finnish or show competency in written Finnish”. The embedding vector is calculated using a transformer model of the BERT family (s-BERT) which is fine-tuned to embed sentences 23 (the exact model used is “all-mpnet-base-v2”).
Job ads that need to be classified are split into sentences using a simple sentence-splitting rule that breaks texts at full-stops, like breaks, colons, question and exclamation marks; and, for sentences that after this are still longer than 150 characters, it also uses commas and semi-colons by splitting at every third of these characters. The cosine similarity between each ESCO skill and each sentence is then calculated; if this similarity is higher than a given threshold, then the skill is considered as required by the job ad.
To identify the cosine similarity threshold, we annotated data on around 300 sentence-skill couples, recording if the skills were effectively required in the sentences. Then, we ran a logit model with the skill requirement variable as dependent variable, and the cosine similarity between skill and sentence as the only explanatory variable. The cosine similarity threshold was chosen as the cosine similarity value for which the predicted probability that the skill is effectively required by the sentence is 50%.
GPT4 classifier
Building on previous work on applying very-large language models (LLMs) to skill extraction,11,24 we designed a two-step classification approach exploiting generative AI and knowledge engineering techniques. The first step consists of identifying the skills demanded in each job ad through a prompt in natural language to ChatGPT-4o (see Figure 1).
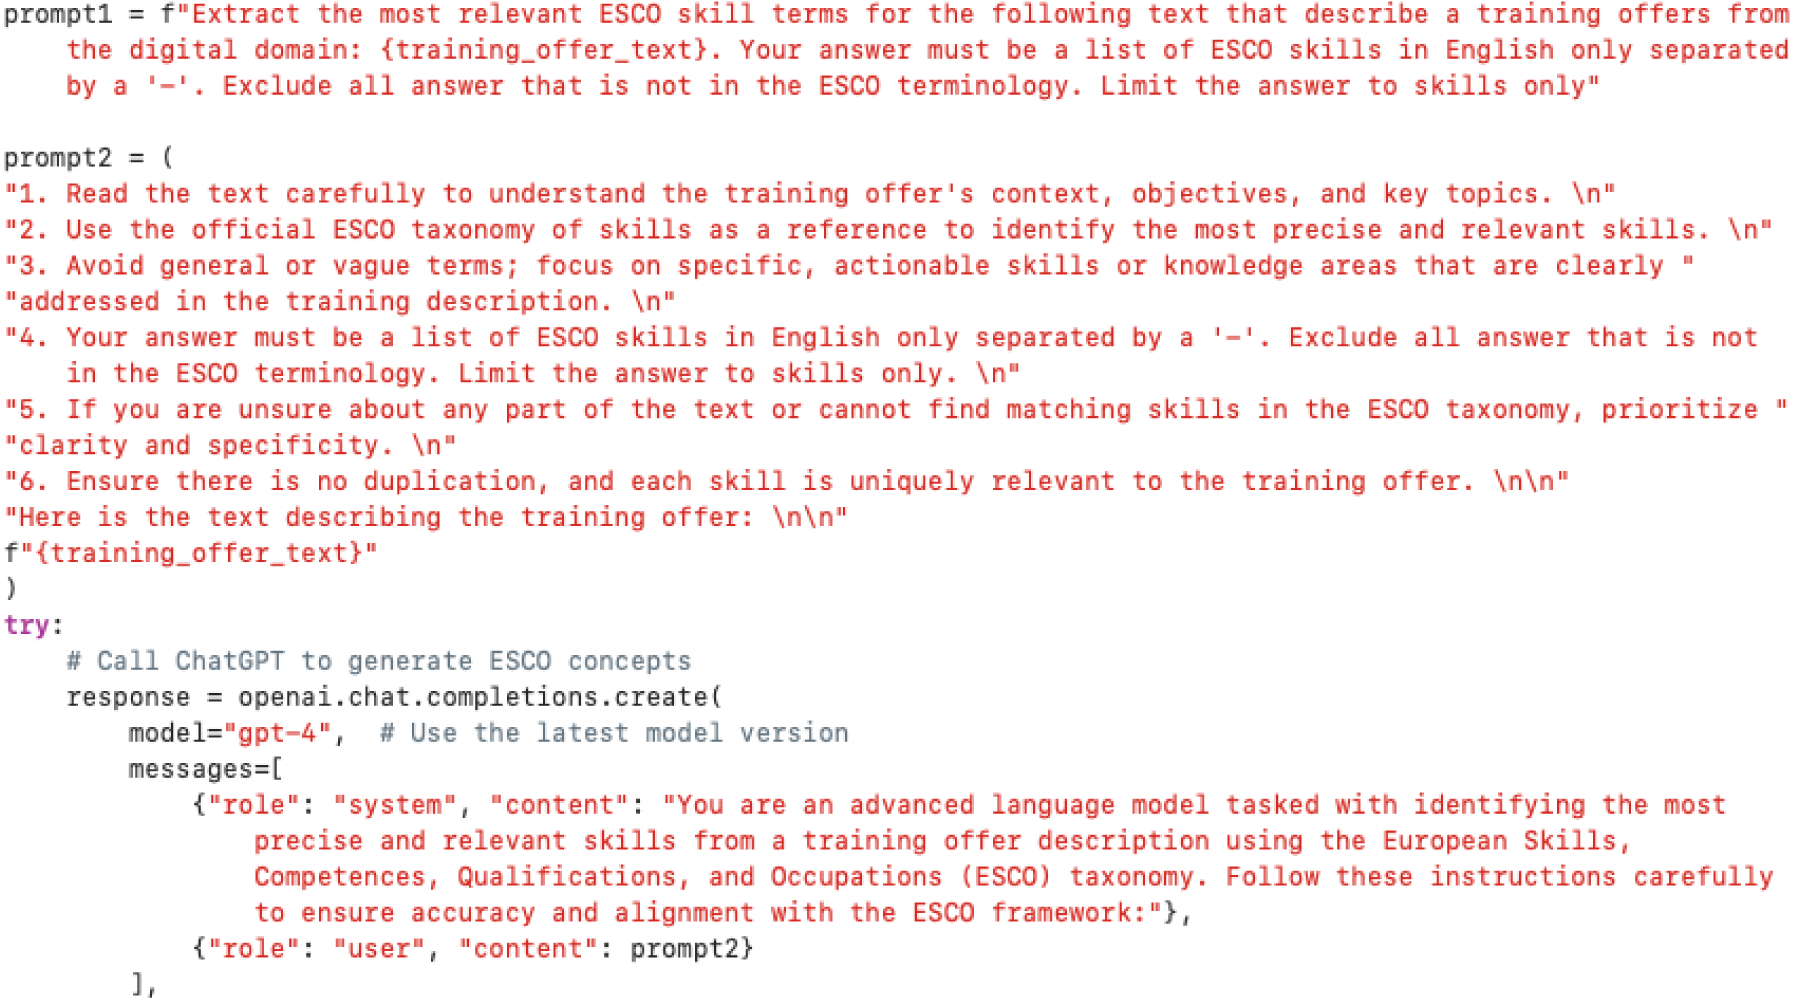
Prompts given to GPT-4o.
However, due to current limitations of LLMs, the extracted skills did not always perfectly match the skill labels used in the ESCO taxonomy. For example, ChatGPT may generate “Programming with Python” instead of the ESCO preferred label “Python (computer programming)”. To ensure alignment, we perform annotation normalization, replacing LLM-generated labels with their closest ESCO counterparts. This is achieved by computing the cosine similarity between the LLM's embedding of the LLM-generated annotation; and the embedding of the ESCO preferred labels. The GPT4 classifier (currently only tested for English) has been described in greater detail elsewhere. 8
Our work on evaluating a skill classifier started from the need to evaluate the data on skills produced through the text matching algorithm, before its publication in early 2024 through a public report, 25 a public dashboard 5 and open data. 26 This section describes the methodology we devised to evaluate a single classifier; and summarises the results for the text matching classifier. This provides the basis for understanding the more complex methodology for evaluating multiple classifiers, which is explained later.
Defining the objective of the evaluation
Evaluating an ESCO skill classifier means, in fact, evaluating a very large number of distinct classifiers, each classifying a specific skill. It is nearly impossible to report robust evaluation statistics for each single skill. What we would like to obtain is an aggregate measure of performance of the ESCO skill classifier for groups of skills of interest (with the union of these groups ideally covering the whole collection of ESCO skills). These groups act as the basis for sampling stratification, so that groups of greater interest are evaluated with greater precision.
In our case, the most relevant skills are those most frequently detected by the classifier, as they are more visible and therefore more widely used both inside and outside the organisation. For instance, ADEM's management often relies on our skill data to inform internal and external strategic and policy discussion. However, it only considers “positive” evidence on the skills for which we identify a robust or emerging demand. ADEM's management is aware that many skills go undetected, either due to poor skill definitions or algorithmic limitations. Therefore, it never focuses on evidence of “absence” of a skill in our database. While the skills of greatest interest are those that are most often detected, the other skills are also worth examining. This is essential for improving the algorithm: we need to understand whether certain skills are missing because they are genuinely not in demand in the Luxembourgish labour market, or simply because the classifier fails to capture them.
The reasoning in the previous paragraph leads us to define three key indicators for our evaluation, that focus on skills with a different level of prevalence in our data: The average accuracy of the algorithm in finding the 102 most-often-found skills (hereafter, “top 102 skills”) in the dataset. This gives us a way to establish the accuracy of our classifier for the skills that are most relevant for the users of our statistics. The average accuracy for skills in positions 103–306 (the 103rd to 306th). The average accuracy of the algorithm for ESCO skills beyond the 306th most-frequent skill. This ensures that we can gain some knowledge about our classifier's performance across rarely-found skills.
The focus on these three groups reflects our belief that the evaluation of an ESCO skill classifier must be able to capture performance within groups of skills of interest. This enables us to provide users with meaningful information, and developers to gain useful knowledge on the working of the algorithm. The calculation of an “overall metric of performance” across all ESCO skills is also technically possible based on the formulas provided in Section 3.3, but it is not necessarily useful, so its results are not discussed in this paper.
Sampling
Ideally, we would have access to a large sample of annotated data, in which the presence of every ESCO skill has been assessed for at least one hundred job ads. However, such a dataset is not available and, based on our experience, it would be extremely time-consuming to produce it. Therefore, we designed a sampling scheme that, through careful clustering and stratification, allows us to obtain useful performance metrics with a reasonable amount of effort. The stratification is based on the model's results. While we believe that adequate formulas can take sampling stratification and clustering into account (see Section 3.4), a major drawback is that our annotated data cannot be used to evaluate another model. This is why, for example, we needed to annotate new data to evaluate the GPT4 classifier (Section 4).
We aim at having some performance information on all the top 102 skills, on 102 of the following 204 skills, and on 102 of the remaining skills. In this way, we will be able to produce the most robust accuracy statistics for the top 102 skills, slightly less robust for the top 306, and again slightly less robust for the full population of skills. Therefore, we randomly select our “skill sample”, made of 102 + 102 + 102 = 306 skills. The skill sampling frame of the first annotation task, from which this sample of skills is extracted, is ESCO's Digital Skill Collection (1 201 skills, compared to 13 355 for the second annotation task which uses the full ESCO Skill Collection).
In addition, we carry out a stratified sampling, with one stratum being model positives (i.e., ad-skill couples for which the classifier predicts that the skill is required by the ad), and one stratum being model negatives (i.e., ad-skill couples for which the classifier predicts that the ad does not require the skill). Stratification by class (positive vs negative in the case of binary classification) and other variables is standard in machine learning evaluations,27,28 as well as the practice to use a model's results to improve the relevance of annotation samples. 29 In our case, there is not an available annotated dataset on which to evaluate our classifiers, so we use stratification based on the model's results to improve the efficiency of sampling and create a suitable dataset.
The decision to evaluate 102 skills per stratum, rather than 100, was made to simplify the annotation process: since 102 is divisible by 3, each skill can be assessed against at least three model negatives, ensuring that every skill included in the analysis yields some practically useful insights, even if not statistically robust (e.g., a result of 0/3 already signals potential issues). To implement this, we applied matrix sampling, drawing a random sample of 102 job ads and, for each ad, randomly selecting 9 skills from the evaluation set (see Annex I for details). This produced 918 ad–skill pairs, providing the required three model negatives for each of the 306 skills (Due to a labelling problem, 19 out of the 918 ad-skill couples were in fact model positives and had to be discarded, adapting accordingly the weights in the formulas – see next sections and Annex II). The ads were drawn from IT job ads in French, English, and German sent by employers to ADEM between 2015 and 2023.
In addition, we expanded the evaluation sample by including all the skills identified by the algorithm in the 102 ads composing the sample, ensuring that 100% of model positives were represented. This added 719 model positives to the annotation data. When calculating performance statistics, these model positives are not pooled together with the sampled model negatives; instead, they are assigned to a different stratum and weighted accordingly (see next section).
Before concluding this section, it must be noted that our sampling strategy is design-based, even though the model's results have been used in designing it. Following a design-based approach, 30 we assume that the population is fixed; and we assign to each sampled unit a sampling probability, taking into account the stratum that contains it. Our classifier is not considered as a data-generating stochastic process, as in model-based approaches. Instead, the classifier's results act as an auxiliary variable in our stratification. An auxiliary variable is a “variable about which information is available prior to sampling” and “assists in the estimation of a study variable [ 31 , p.219], including by acting as a basis for constructing strata. In our case, the study variables are the proportions of ad-skill couples correctly classified by the model (i.e., the accuracy and recall rates).
An implication of our methodology is that the model's own classification results are used as auxiliary variables in the sampling scheme underlying the estimation of its performance metrics. Based on our review of the relevant literature, we believe this does not compromise our ability to recover unbiased estimates of the metrics of interest. Nonetheless, further research could provide additional clarity on this point.
How to evaluate a skill classifier: intuition
Our evaluation strategy relies on calculating a performance measure for every skill independently, and then aggregating the performance measures for groups of skills of interest. The performance metrics of the individual skills are not robust, because they are based only on a small sample of ads (the sampling design described above implies that every skill is evaluated only on a small part of the sample of ads). Nonetheless, the aggregate measure across the group of skills of interest is robust.
In practice, the performance measures in which we are interested are the accuracy and recall rates. The choice of these measures reflects their widespread use and their ease of interpretation, also related to communication with management and stakeholders. In the future, our framework could be adapted to include other performance measures, such as balanced accuracy rates. To calculate accuracy and recall rates, the most important ingredients are the estimated numbers of true positives and negatives in the population of ads. We obtain these by counting the number of true positives and negatives found in our sample; and weighting them according to our sampling strategy.
Our cross-skill aggregation function is the arithmetic average. This means that our performance metrics are interpretable as “average accuracy rate” and “average recall rate” across a group of skills of interest. By properly weighting the skills according to the formulas presented in the next section, it is also possible to estimate an average measure of performance across all ESCO skills. However, this extrapolation is not particularly useful for our use case, and therefore we will not present results for all ESCO skills combined.
How to evaluate a skill classifier: formulas
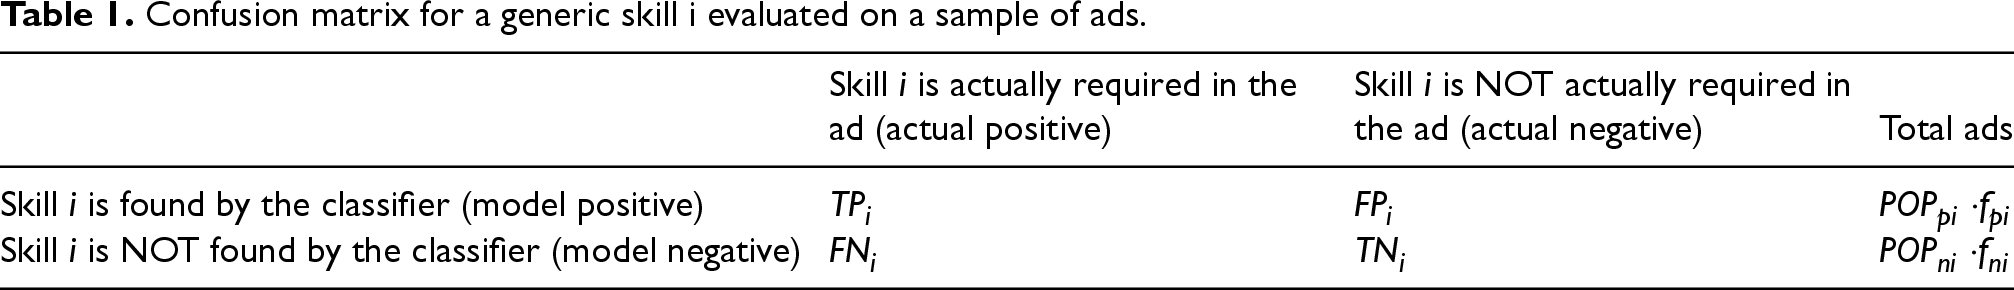
To generalise the intuition given in the previous subsection, consider the following confusion matrix for a skill i and a sample of ads drawn from the population of ads (Table 1):
Confusion matrix for a generic skill i evaluated on a sample of ads.
Confusion matrix for a generic skill i evaluated on a sample of ads.
Where: i is a skill like “communication”, “SQL”, etc. TPi / FPi / FNi / TNi is the number of sampled true positives / false positives / false negatives / true negatives POPpi is the total number of ads in the population in which the skill was found by the classifier (“model positives”) POPni is the total number of ads in which the skill was NOT found by the classifier (“model negatives”) fpi is the fraction of model positives in the evaluation sample fni is the fraction of model negatives in the evaluation sample
In the remainder of the paper, we will refer to ad-skill couples in which the ad requires the skill (according to annotating experts) as “actual positives”; and to ad-skill couples in which the classifier predicts that the ad requires the skill as “model positives”. We will make the same distinction between “actual negatives” (based on the annotators’ opinion) and “model negatives” (based on the models’ predictions).
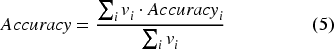
Given the notation above and the proportion of model positives and negatives that we wish to sample, we can derive the following formulas for the accuracy and the recall rates:
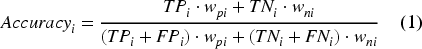
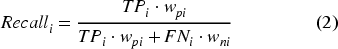
Where the weights wpi and wni are inversely proportional to the proportion of model positives and negatives included in the sample (fpi and fni):


To grasp the intuition behind the equations above, consider Equation (1). Its denominator is equal to the size of the population from which the sample has been drawn, which in our case is the population of IT jobs in Luxembourg. The numerator is equal to the weighted sum of the count of true negatives and true positives found in the sample. The weights reflect the number of ads in the population represented by each true positive and true negative case, a standard practice in the calculation of sample-based descriptive statistics. 32 More details, and some practical examples, on the calculation of accuracy at the skill level can be found in Annex II (the same logics applied to the calculation of recall).
The overall evaluation metric across skills can be calculated as a weighted average of the metrics of each skill, where the weights are inversely proportional to the probability of sampling each skill:
Where vi is the weight of skill i, equal to the inverse of the probability ri of sampling skill i:

Only the first author annotated the data for the first annotation task. For every ad-skill couple that was sampled, the annotator established if the ad required the skill or not, based on the text of the ad and on the ESCO skill metadata (skill description and labels). For every ad, the annotator considered a random sample of 9 skills that were not found by the classifier, and all skills that were found by the classifier. Therefore (as implied by the previous discussion) not all skills were annotated for every ad.
Annotation is always to some extent subjective,29,33 so having a single annotator carries the risk of transferring the annotator's bias into the evaluation data. To assess the extent of this risk, around one fifth of the dataset of this annotation task was independently annotated by one of the co-authors who participated in the second annotation task described below (see Section 4.4). The second annotator annotated all the skills for a random sample of 20 ads, for a total of 294 ad-skill couples (i.e., 18% of all valid ad–skill pairs). The interannotator agreement rate, calculated between the first and second annotators, was 92%, and very similar across the sample of model negatives (92%) and of model positives (91%).
The following rules were used to decide when a skill was required or not: Skills explicitly mentioned in the job ad are marked as required. For example, if the ad contains the text “knowledge of R/Python is a plus”, R and Python are considered required skills. Skills not explicitly mentioned in the job ad, but necessarily implied by a task explicitly mentioned in the job ad, are also marked as required. For example, if the ad contains the text “Foster a collaborative and high-performance team culture”, then the skill “cooperate with professionals” is considered required. Skills not explicitly mentioned in the job ad, and not necessarily implied by any task explicitly mentioned in the job ad, are not marked as required (even though, in some cases, they may be implicitly required by the ad). For example, in ADEM's database there are brief ads advertising for a “maçon polyvalent” (“multi-task construction worker”) without any further detail. In these cases, no skill can be considered as required by the annotator, even though evidently many are actually required by the job.
Results from the first evaluation of the text matching classifier
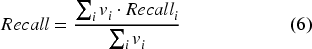
As could be predicted, based on the annotation exercise we can estimate that there is a poor balance between actual positives and negatives in the population, with the latter representing over 80% of all ad-skill couples (Table 2). Table 2 also reports the accuracy rate of a hypothetical random-guessing classifier, which classifies ad-skill couples at random, conditional on the overall distribution of the target variable. This is calculated following the literature 29 as the sum of the squares of the proportions of actual negatives and actual positives (see Annex III), and it is a useful benchmark to compare with the performance of actual classifiers. 29
Estimated proportion of actual negatives and positives in the population of IT job ads.
Estimated proportion of actual negatives and positives in the population of IT job ads.
Note: More details on calculation of these indicators can be found in Annex III.
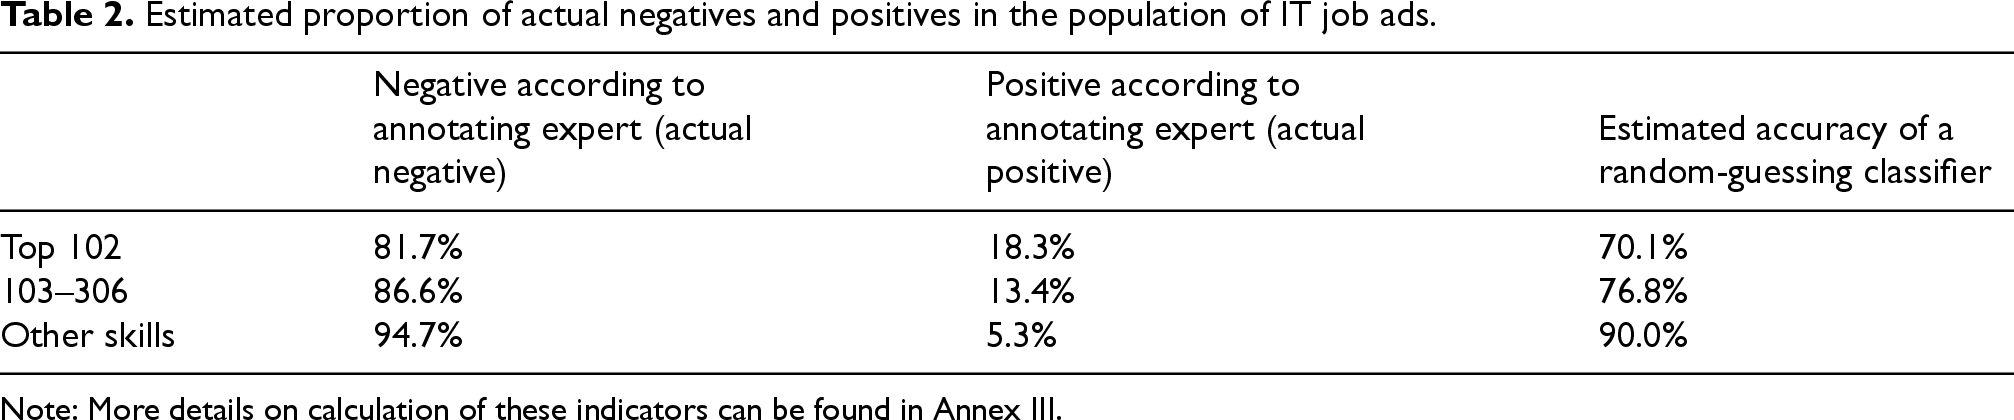
The evaluation of the text matching classifier (Table 3) shows that, among the top 102 extracted skills, the average accuracy is satisfactory at 87.3%. Figure 2 compares its accuracy with that of a random-guessing baseline (see Table 2 and accompanying explanation). Overall, the evaluation of the text matching classifier convinced us of the robustness of the data: after label cleaning, the classifier demonstrates strong precision in identifying skills – at least for those most frequently detected.
Comparison of model accuracy (text matching) with a hypothetical random-guessing classifier.
Estimated cross-skill average of the accuracy and recall rate (text matching).
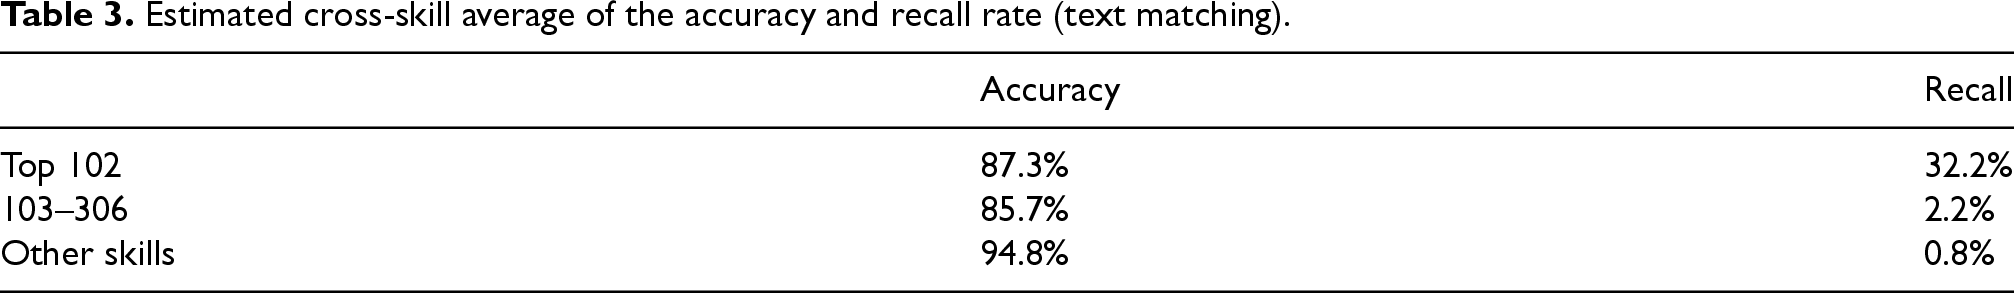
However, the recall rate was less than ideal, even among skills in the top 102 (32.2% – see Table 3). In this group of skills, the main reasons for the relatively low recall rate were that while more technical skills like “Python (computer programming)” or “SQL” were detected by the text matching classifier with very high recall (nearly 100% of the time they are requested), more transversal or generic skills like “use IT tools” or “project commissioning” had much lower recall rates (typically, less than 10%). Skills that are less often found by the classifier tend to have even lower recall rates (Table 3). This is not surprising, since at least a part of the skills that are not found, are probably not found because of an inadequate set of tags. In other words, there are skills that are relevant to the labour market, but are assigned verbose labels and/or descriptions, with only a limited number of synonyms or alternative expressions. 12
The low recall of ESCO classifiers working at the finest level of the taxonomy is known in the literature. It is sometimes stated based on direct experience 12 ; and sometimes indirectly, by noticing that the large majority of ESCO skills are never found by skill classifiers even in the most comprehensive databases. 34 Our evaluation method allows us to quantify this “recall problem”, and motivated us to develop new classifiers based on different classification logics (the sentence embedding and the GTP4 classifiers).
The development of new ESCO skill classifiers introduced a key challenge: how to compare different classifiers. The methodology outlined in this section relies on classifier-specific sampling, since skills are selected based on their detection frequency and ads are stratified according to whether they are predicted to require each skill. In the next section, we build on the methodology presented above to address the need for comparing different ESCO classifiers.
This section presents our methodology to compare two different classifiers: the text matching and the GPT4 classifiers. An extension to the comparative evaluation of a third classifier (the sentence embedding one) is briefly attempted at the end of the section.
How to comparatively evaluate two skill classifiers?
The comparison of different classifiers presents some challenges that are addressed in this section. If we were to evaluate the GPT4 classifier based on the annotated data presented in the previous section, we would get biased results. This is because that data has been sampled based on the results of the text matching classifier. Therefore, the GPT4 classifier would be evaluated on skills that are more frequently found by a different algorithm; in addition, the stratification between model positives and negatives would be based on what is “positive” for a different algorithm.
To solve the problem of classifier-specific sampling, we made two modifications to our sampling of skills and ads: We sampled skills based on how frequently they were found by both the text matching algorithm and the GPT4 algorithm. This ensures that the evaluation data represents a “level playing field” for the comparison of the two algorithms. We annotated every skill in the sample for all ads, thereby avoiding the problem of stratification between positives and negatives (note that this means annotating more ads for every skill, compared to what was done in the previous section).
With this design, the accuracy and recall for each skill are still based on Equations (1) and (2), but without the need of including the weights related to the stratification between model positives and negatives, wpi and wni. The calculation of the average accuracy and recall rates is still based on Equations (5) and (6).
Sampling
35 job ads were sampled for the evaluation task. All these ads were posted in 2023 in English and concerned jobs in finance and IT. Ads in French and German were excluded because the GPT4 classifier has been developed based on English-language data and only tested for English so far.
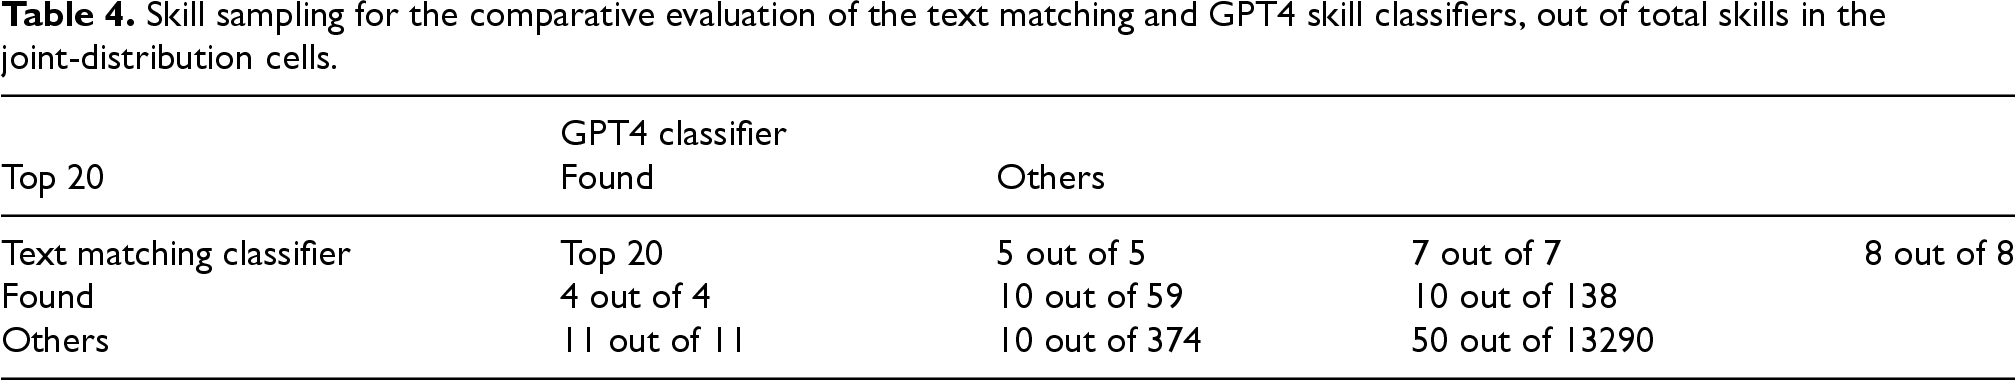
When comparatively evaluating two skill classifiers, the skill sampling is not stratified across 3 categories (e.g., “top 102”, “103–306” and “other skills”) as in the case of the single-classifier evaluation. It is now stratified across 9 categories, representing the joint distribution of skill prevalence across the two classifiers. This is shown in Table 4. The table shows that for both classifiers, we included in the evaluation sample all the 20 skills that were most frequently found in the sample of 35 ads. This ensures that the two classifiers can be evaluated on a selection of skills that are surely relevant for the users of our statistics (because they tend to be demanded often in the labour market).
Skill sampling for the comparative evaluation of the text matching and GPT4 skill classifiers, out of total skills in the joint-distribution cells.
Skill sampling for the comparative evaluation of the text matching and GPT4 skill classifiers, out of total skills in the joint-distribution cells.
In addition, we took a sample of all skills that have been found at least once by each classifier. We sampled 10 skills for each cell of the joint distribution matrix (see Table 4) representing skills found by at least one classifier (and outside the top 20 of each classifier). Finally, we took a sample of 50 skills that have never been found by either classifier. This ensures that we are able to give an indicative answer about the performance of our classifiers across all skills, even those that our classifiers cannot find.
Note that our sampling design, together with Equations (5) and (6), implies that if we were to evaluate performance across all skills, the results would be driven by the skills that are less frequently found. These skills have a much lower probability to be sampled, and therefore a much larger weight (Figure 3). For example, the 50 skills sampled from those that have never been found by any classifier will receive a weight of 13 290 / 50 = 265.8 for the calculation of accuracy across all skills, whereas skills in the top 20 of a classifier will receive a weight of 1. Because of this reason, we prefer to report results on accuracy and recall separately for three groups: skills in the top 20 of at least one classifier; skills found by at least one classifier, but in the top 20 of none; and skills not found by any classifier.
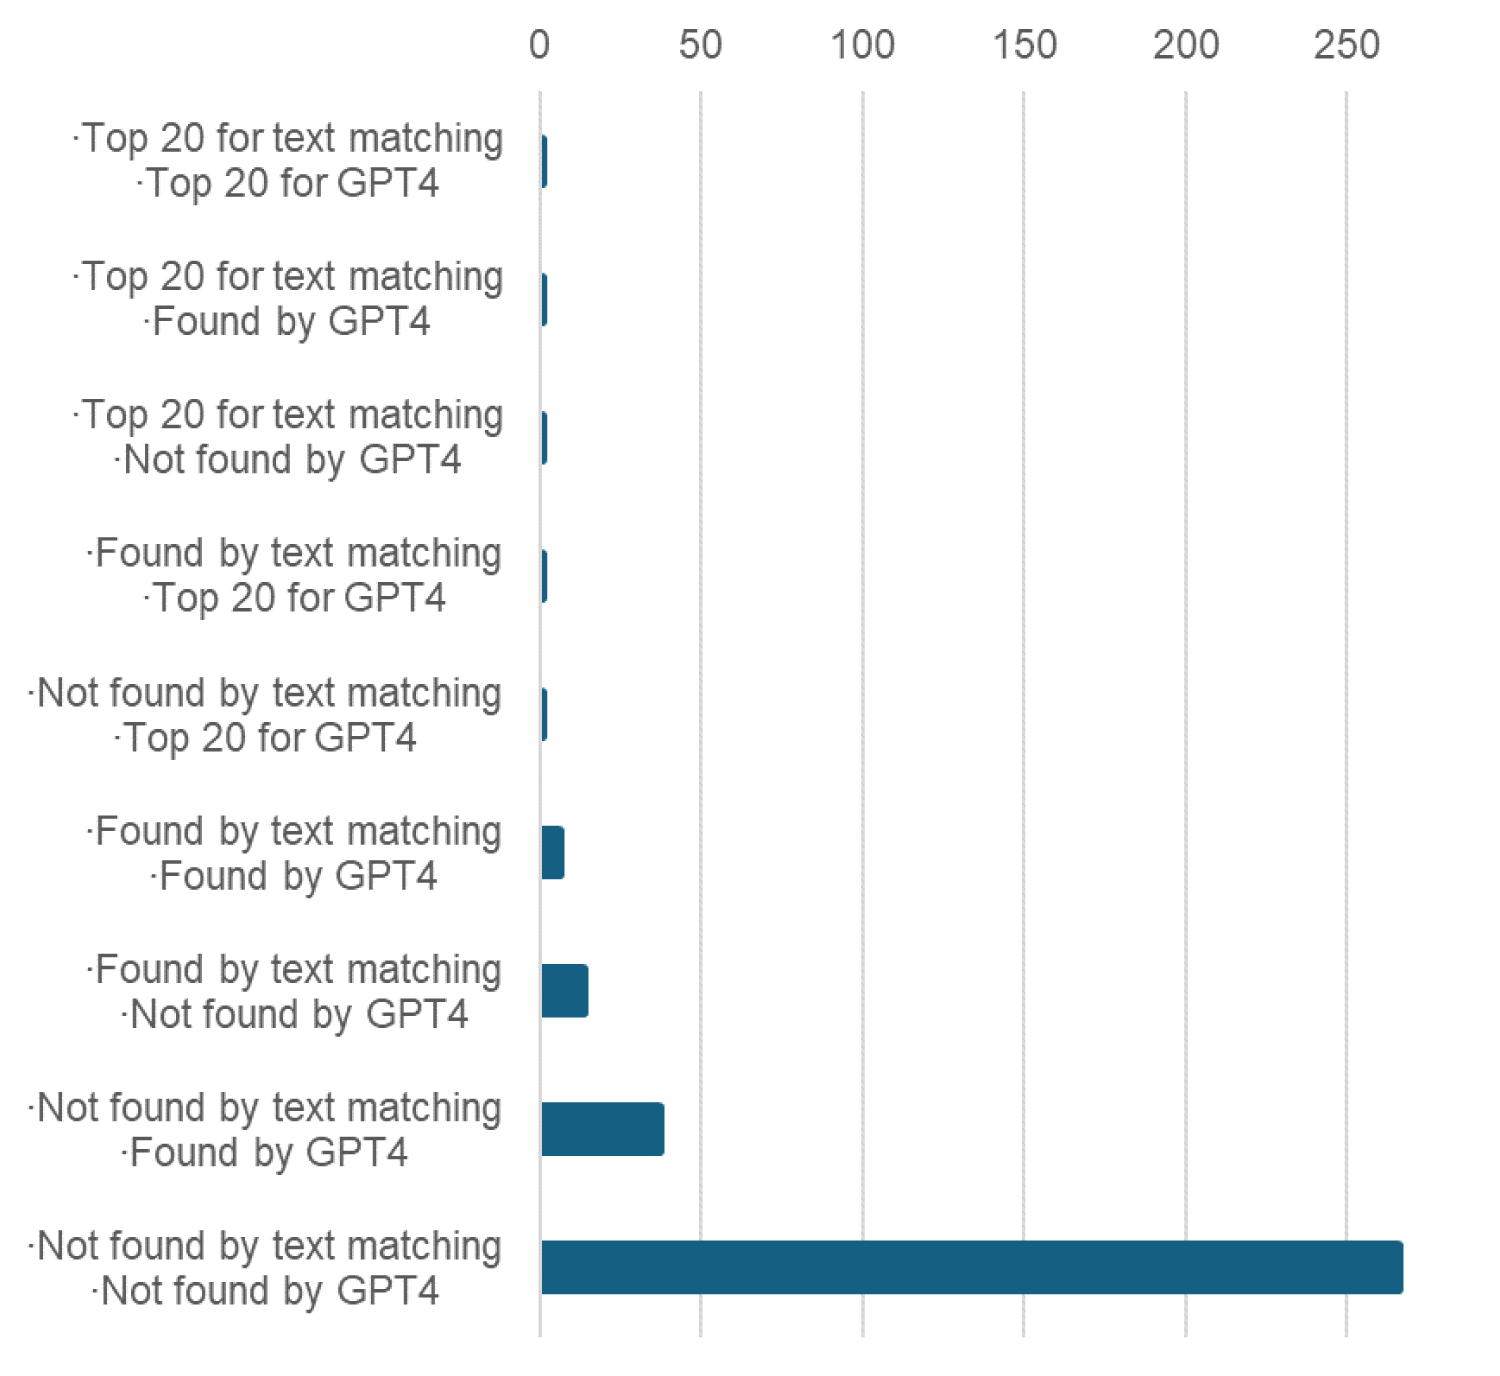
Weights assigned to skills in the different strata of Table 4.
Since the goal of the evaluation is to compare two different classifiers, it is essential to be able to calculate standard errors for the performance measures used in the evaluation. In our case, we would like to know whether the cross-skill averages of the accuracy and recall rates are significantly different between the text matching and the GPT4 classifier. For this purpose, we use bootstrapping. Bootstrapping is a very flexible way to calculate standard errors for various types of estimators, with a proven ability to deal with clustered data.35,36 In our case, we need to consider clustering of the standard error at the skill and at the job ad level. In essence, we re-sample our ads and our skills with replacement 500 times from our actual sample, clustering by ads and by skills, and we estimate the average accuracy and recall rate. The standard deviation of this estimate across the 500 replications is the standard error of our estimate.
Annotation methodology
Three experts (the “annotating experts”) annotated each skill-ad couple for a sample of 115 skills and 35 job ads, evaluating whether the skill was required by the ad, following the same annotation guidelines as described in the section on the evaluation of the text matching classifier. This yields a considerable number of skill-ad couples (4 025) to carry out the comparative analysis.
The three annotators were the first author and two of the authors from LIST. There was a fairly high degree of agreement among the annotators, with agreement rates between 87% and 90% between them (the interannotator agreement was calculated as the proportion of skill-ad couples that were annotated in the same way by the two annotating experts). A gold standard was generated through voting, meaning that a skill was considered required by an ad if at least two annotators shared that opinion.
Results
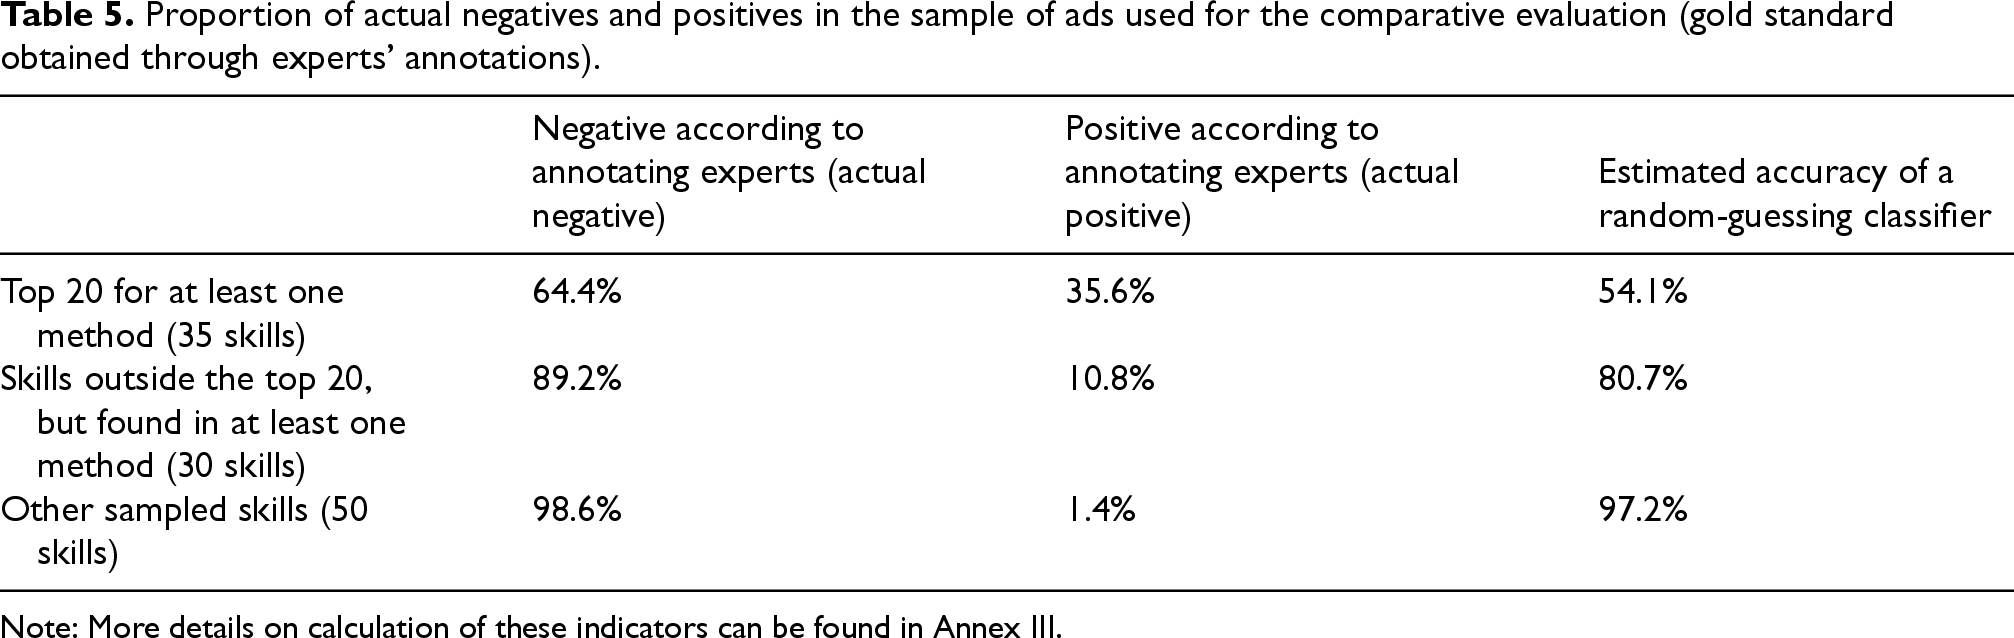
Before discussing the performance of the different classifiers, Table 5 reports some descriptive statistics from our gold standard, showing the degree of class imbalance in the sample annotated by the experts. The proportion of actual positives (i.e., ad-skill couples in which the ad requires the skill according to the annotating experts) is 35.6% for the skills that are found most often by the classifiers. For skills that were found by the classifiers but less often, it was much lower (10.8%). Finally, for skills that were not found by any of the two classifiers, the proportion of positive ad-couples was very low (1.4%).
Proportion of actual negatives and positives in the sample of ads used for the comparative evaluation (gold standard obtained through experts’ annotations).
Proportion of actual negatives and positives in the sample of ads used for the comparative evaluation (gold standard obtained through experts’ annotations).
Note: More details on calculation of these indicators can be found in Annex III.
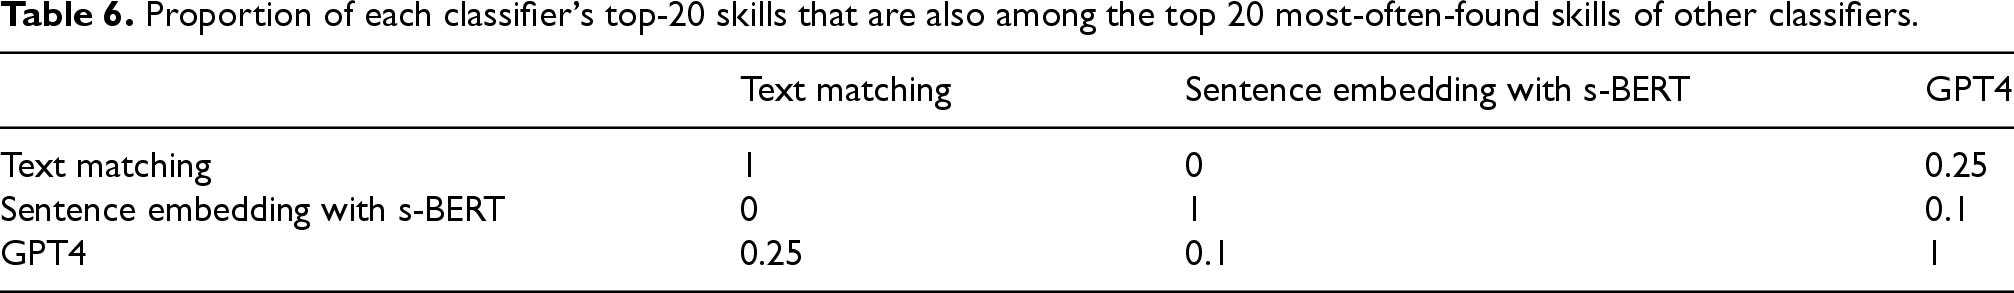
In the comparative evaluation of different classifiers, the first striking finding is the extent of divergence in their results for the sample of 35 ads. Table 6 reports the proportion of skills appearing in the top 20 of each classifier that also appear in the top 20 of another, while Figure 4 illustrates these overlaps with a Venn diagram. The text matching and sentence embedding classifiers share no common skills in their top 20. The GPT4 and sentence embedding classifiers overlap on only two skills, while the text matching and GPT4 classifiers show slightly more similarity, with five skills in common (25%).
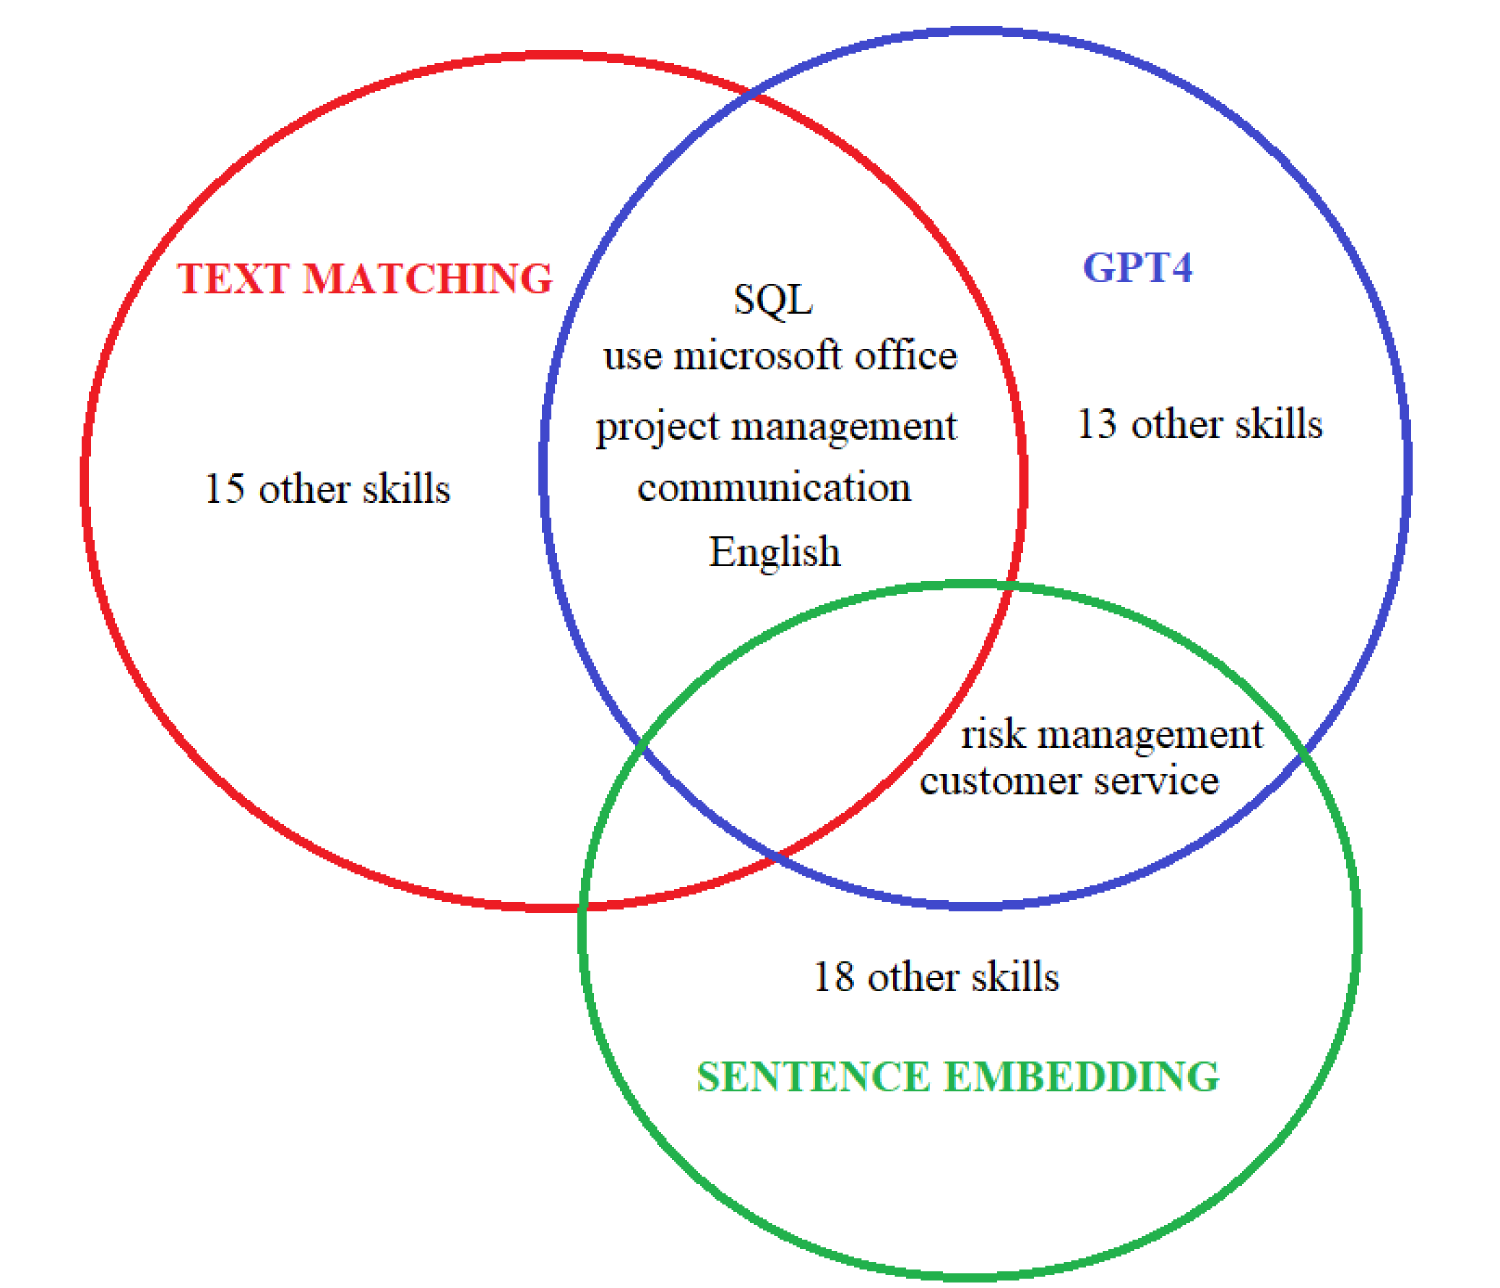
Venn Diagram representing the overlap among the top 20 skills most often found by the three classifiers in the sample of ads.
Proportion of each classifier's top-20 skills that are also among the top 20 most-often-found skills of other classifiers.
We deem our classifiers to be satisfactorily accurate (see below), so we interpret the poor overlap between their results as suggesting that they are able to capture different sets of actually required skills. This could be a reason to explore the use of ensemble models in the future.
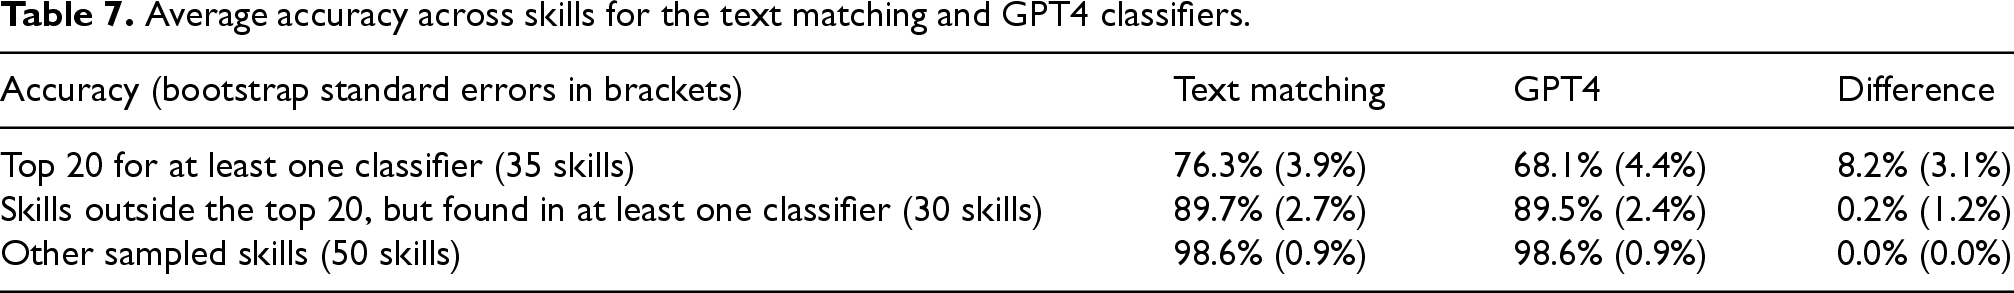
Table 7 and Table 8 show the results on the relative performance across the text matching and GPT4 classifier. The results show that text matching was significantly more accurate than the GPT4 classifier among the 35 skills that ranked in the top 20 for at least one classifier; and that there was no significant difference among skills that were found less frequently.
Average accuracy across skills for the text matching and GPT4 classifiers.
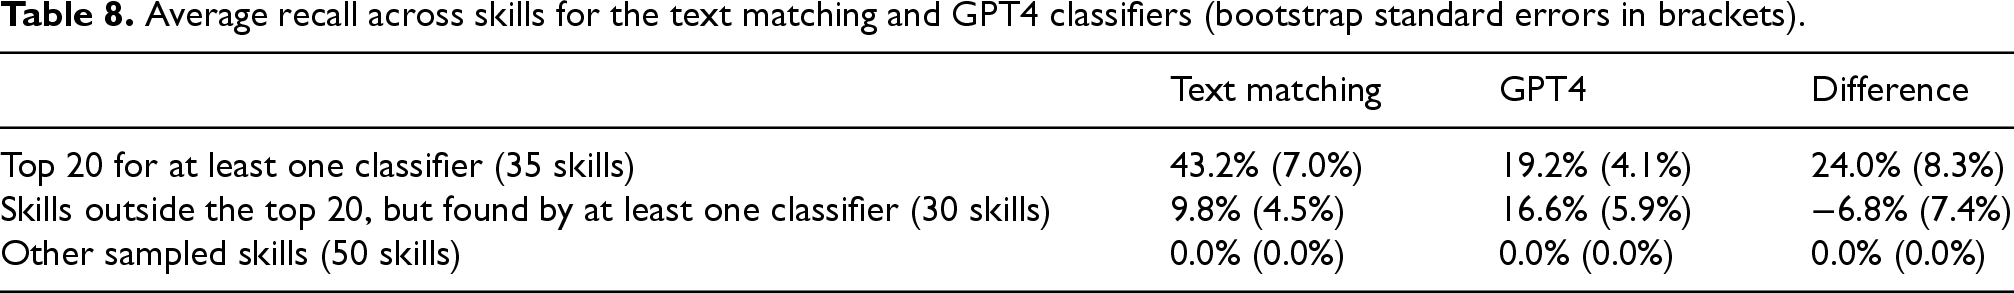
Average recall across skills for the text matching and GPT4 classifiers (bootstrap standard errors in brackets).
We would like to stress that our results do not imply that, in general, text matching classifiers perform better than large language models in the task of ESCO skill classification. Instead, our results could suggest that the crucial factor driving the results is the amount (and type) of fine-tuning the classifier receives. As described in Section 2, the text matching algorithm was fine-tuned through an iterative (and time-consuming) procedure of cleaning the tags of the 100 skills that are most often found across the full population of ads. The GPT4 classifier did not receive this specific type of fine-tuning, which ensures a relatively high level of accuracy among all the most commonly-found skills. As an example, one of the top 20 skills for the GPT4 classifier was “engage in citizenship through digital technologies”, a skill that is clearly related to IT but rarely required in job ads. Such rarely occurring skills are very unlikely to be found frequently by the text matching algorithm, because of the tag cleaning procedure described above. This is probably why the text matching classifier was more accurate in identifying the most commonly found skills.
In Figure 5 we compare the accuracies of our classifiers with the accuracy of a hypothetical random-guessing classifier (see Table 5). For both models, the larger gain in accuracy is obtained for the skills that are found most often, indicating a good level of precision once a skill is identified.
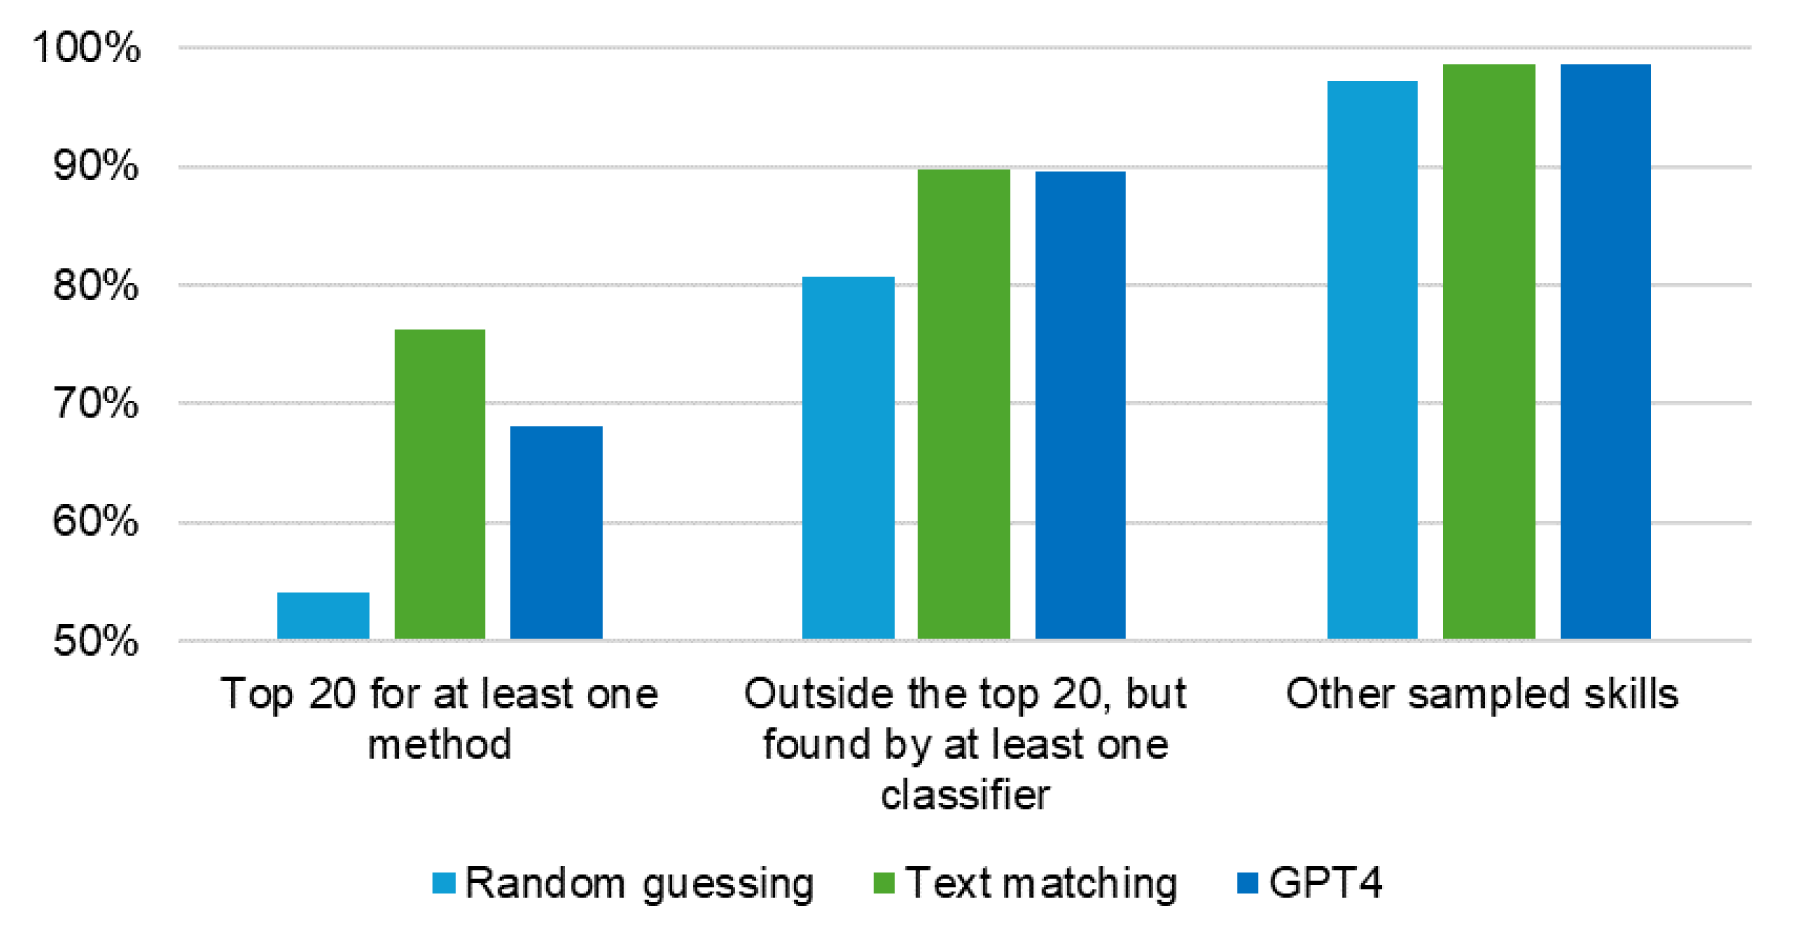
Comparison of model accuracies with a hypothetical random-guessing classifier.
Table 8 shows that recall is significantly higher for the text matching classifier than for GPT4, when considering only skills that appear in the top 20 of at least one method. This result was somewhat unexpected, since low recall was the main motivation for developing classifiers beyond text matching. Interpreting the behavior of black-box models such as GPT4 is inherently difficult, 37 but one possible explanation for its low recall is that the model prioritizes identifying only the most essential skills. Detecting a large number of skills may be computationally expensive for GPT4 or may result in an unacceptably high rate of false positives. On average, job ads in our sample contain 262 ESCO skills (with a lower confidence bound of 80; see Annex III for details). The large estimate of the number of skills required by the ads in our sample appears to result from two main factors: partial skill overlap and the presence of generic skills. For instance, within our sample of skills, “ICT project management methodologies”, “project commissioning” and “project management” show some overlap; similarly, “SQL”, “database”, “use databases” and “use query languages” overlap, since requiring SQL usually implies all the the four. As examples of generic skills, consider "computer technology”, “use IT tools”, “plan”, “demonstrate professional attitudes to clients”, which are likely to be relevant, to some extent, in almost any IT job.
The large number of ESCO skills in job ads affects not only the recall of the GPT4 classifier but also the text matching model. Improving the text matching classifier relies on adding carefully selected labels for each skill relevant to the labour market. This task becomes increasingly challenging as the number of skills to detect grows.
For skills outside the top 20 of either classifier, the recall rates decrease further, particularly for the text matching algorithm (the difference between the two classifiers is not significant outside the top 20). As mentioned above, the problem of low recall when searching for granular ESCO skills is known from previous literature,12,34 even though formal evaluations had been lacking until now. Finally, Table 8 shows that the recall is 0 for both models among the other sampled skills (this is because, by the construction of the sample, these skills have never been found by either of the two classifiers).
Based on the annotated data, we can also attempt a comparative, preliminary evaluation of the text matching and sentence embedding classifier. To ensure a level playing field, we can use only the skills in GPT4's top 20, since they are sampled independently from the classification of the text matching algorithm.
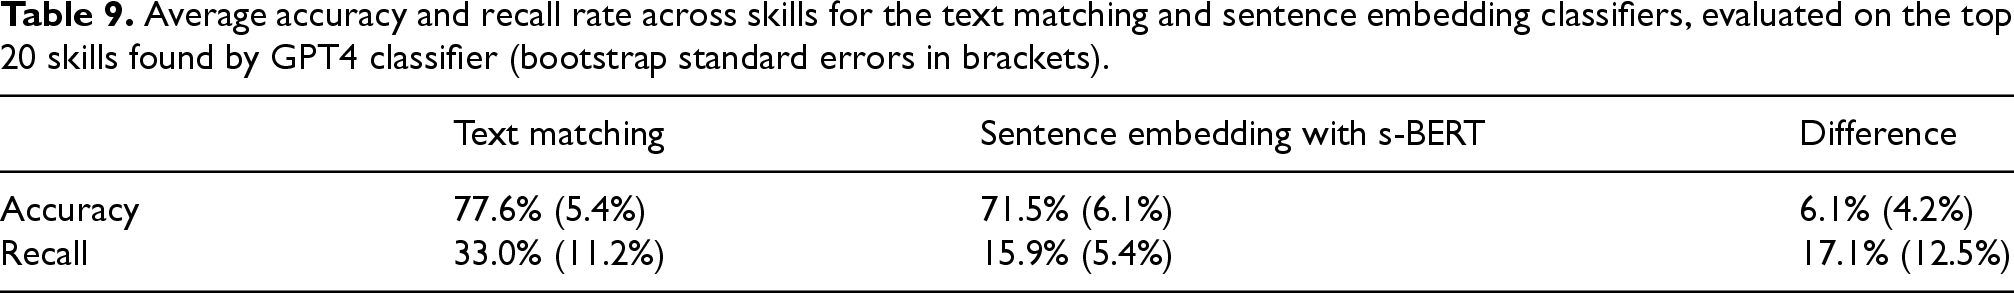
The text matching algorithm seems more accurate than the sentence embedding classifier among skills that are often found by the GPT4 classifier. However, the difference is not significant, also due to the low level of precision that we can obtain by evaluating only 20 skills (remember that standard errors are clustered both at the ads and at the skill level) (Table 9).
Average accuracy and recall rate across skills for the text matching and sentence embedding classifiers, evaluated on the top 20 skills found by GPT4 classifier (bootstrap standard errors in brackets).
Finally, a note of caution is warranted given the selection of skills and ads. The job ads used for this evaluation are drawn from a specific population, as they cover only IT and finance jobs and are all in English. The classifiers’ relative performance depends on the amount and type of fine-tuning they received, and it could change with further fine-tuning of one or the other model. In addition, even though we can draw our conclusions from a large annotated dataset with 4 025 annotated ad-skill couples, there are only 35 ads in this sample. By comparison, in Section 2, with a more sophisticated stratification, we evaluated 102 ads in English, French and German.
The evaluation of ESCO skill classifiers (at the finest level of the taxonomy has not yet been discussed in detail in the literature. We attribute this to two problems that makes this evaluation challenging: the large number of skills to evaluate and the class imbalance in the data. We developed a method to evaluate our text matching ESCO-skill classifier while dealing with these problems, through a stratified matrix sampling of skills and ads; we also developed a method to compare performance across different classifiers.
Our sampling scheme is based on practices that are standard in machine learning: stratifying by class; and using a model's results in order to increase the relevance of annotation data. However, the use of a model's results as an auxiliary variable to create an evaluation dataset for the same model has received little attention in the literature so far. Further research could look more closely at the implications of this practice for potential bias and estimator variance in light of sampling theory. In particular, research could shed further light on the potential for selective bias of classifier-dependent sampling in the context of evaluation methodologies such as the one presented in this paper.
In addition, a major limitation of this methodology is that the annotated data used to evaluate one model (or to compare two models) cannot be re-used to properly evaluate other models. This prevents the development of large, shared annotated datasets on which to evaluate new models. To overcome this limitation, future research could find ways to make the sampling design independent of the classifier.
In terms of results, our text matching classifier presents a satisfactory average accuracy of 87.3% across the top 102 skills, which led ADEM to publish the skills extracted with this algorithm as open data. 26 However, our evaluated algorithms all fail to find many skills that are actually required in the job ads. When compared with another classifier based on GPT4, the text matching classifier was more accurate than the one based on GPT4 among the skills detected most frequently, while the performance was similar across other skills.
The GPT4 classifier and the sentence embedding classifier based on s-BERT also suffered from low recall, i.e., missing many skills required by the ads. Increasing the recall would typically require improving the metadata used by the classifiers for each particular skill, for example by adding synonyms and improving descriptions. Given the large number of skills (262) that we estimated each ad requires, it remains an open question how feasible and even desirable it is to dramatically improve recall on the whole collection of ESCO skills. It could be more useful to focus on a subset of ESCO skills of particular interest, and develop accurate classifiers only for these skills, discarding the rest.
Another striking result is that the three classifiers we developed found very different skills from each other: not a single skill appeared in the list of the 20 most-commonly found skills of all three classifiers. This suggests that using a combination of different classifiers could be a good strategy to correctly identify more of the required skills in future applications.
While the results presented above are interesting within the context of our database and of the models we evaluated, it is important to stress that our primary contribution is to present a methodology to evaluate skill classifiers covering a large number of skills. The results of the evaluations carried out in this paper are not generalizable to classifiers (including the amount and type of fine-tuning they received) different from those described in the paper; to skills outside the ESCO skill groups analysed in this paper; and to populations of job ads different from those from which the samples have been drawn.
Supplemental Material
sj-zip-1-sji-10.1177_18747655251395229 - Supplemental material for Evaluating ESCO skill classifiers
Supplemental material, sj-zip-1-sji-10.1177_18747655251395229 for Evaluating ESCO skill classifiers by Gabriele Marconi, Inès Baer, Marcos Da Silveira, Marie Gallais and Cédric Pruski in Statistical Journal of the IAOS
Footnotes
Acknowledgements
We are grateful to Mauro Pelucchi, Simone Perego and Fabio Mercorio for sharing their knowledge on skill classifiers with ADEM; to Andrea Tettamanzi and Célia da Costa Pereira for their contributions to the project in which the GPT-4 classifier was developed; to participants to the NTTS conference 2025 and two anonymous reviewers for their comments on the paper.
Funding
The authors received no financial support for the research, authorship, and/or publication of this article.
Declaration of conflicting interests
The authors declared no potential conflicts of interest with respect to the research, authorship, and/or publication of this article.
Supplemental material
Supplemental material for this article is available online.
Annex I Examples of annotation used for the evaluation
The first annotation task was performed on a table in an Excel file containing 102 rows (one per sampled ad) and 32 columns (enough to cover all the sample skills for every ad). For clarity, this annex splits the annotation table into two parts, Table I 1 and Table I 2, which together illustrate the task setup. Both tables contain real annotation data for a subset of 9 job ads. Table I 1 contains the 9 model negatives, randomly sampled for each job ad, while Table I 2 shows the skills detected by the model in the ad, all of which were evaluated. Each row corresponds to a job ad, which the annotator had to read. Each cell contains the preferred label of an ESCO skill, that had to be evaluated for the job ad in the respected row. The annotator's task was to delete the skill label in the cell, if the skill was not required by the ad. An R program then compared the annotated file with the original, identifying the deleted cells and coding the information accordingly. The sampling scheme, described below, gave particular attention to the efficient annotation of model negatives, which for each ad form a much broader and more varied set than model positives.
Annotating an ad-skill couple is a complex task, and thousands of such pairs must be annotated before the results can be used for statistical purposes. Annotators need to thoroughly understand the scope of each skill, including its alternative labels, description, and associated occupations, while also carefully reading the job ads, which in our dataset average 2 379 characters and may describe professional contexts unfamiliar to them. To ease this burden, the annotation task should be designed with care, ideally informed by direct hands-on experience. In our case, the authors from ADEM developed such expertise through annotation rounds used for cleaning and fine-tuning the algorithms, as well as through participation in international projects. This experience yielded several important lessons for structuring the annotation task.
First, determining the appropriate number of skills to evaluate per ad is essential for reducing the annotation effort while ensuring the construction of a meaningful dataset. For efficiency, the effort of reading a job ad should be distributed across multiple skills, producing several ad-skill pairs from the same ad. However, annotating too many skills for a single ad is counterproductive, as it reduces the number of ads that can be processed in a day, limiting the diversity of the final sample. These considerations guided our decision on how many model negatives to evaluate for each skill (the number of model positives is less critical, as it is always much smaller than the number of model negatives). Drawing on our previous experience, we allocated the effort of reading an ad across 9 randomly sampled model negatives.
Second, statistics by skill group are more robust when skills from each group are evaluated for every ad. This approach ensures that the entire sample of ads contributes to the performance indicators of each skill group (in our case: top 102, ranks 103–306, and all remaining skills). In other words, the skill strata are mixed within the evaluation of each ad. Accordingly, as shown in Table 1 1, sampled skills 1–3 were drawn from the top 102 skills, sampled skills 4–6 from ranks 103–306, and sampled skills 7–9 from the remaining set. Each skill was included in the random sample for exactly three different ads.
Finally, reading and understanding skill definitions and labels is more time-consuming than it may initially seem. Moreover, an annotator typically retains a clear understanding of a skill's scope for only some minutes, after which the skill's metadata must be revisited. For this reason, it is more efficient to annotate the same skill across multiple ads while its definition remains fresh in memory. To account for this, we sampled fixed sets of nine model negatives (three per skill stratum, as discussed above) and evaluated them as a “package” across three different job ads. This design implied that annotators could review the nine skills before beginning the annotation of the three ads; and then assessed the three ads consecutively while the skill definitions were still readily accessible in memory.
The parameters of the sampling design (3 ads annotated per skill, 3 skills per skill group annotated per ad) were determined based on the first author's prior annotation experience, with the aim of maximizing efficiency. ADEM's management emphasized the need for accurate data at least for the top 100 skills, as these are expected to be relevant for internal and external discussions. Consequently, the size of the first stratum was set at 102 skills, balancing the requirement to provide reliable data on the “top 100” skills with the practical constraint that the number of sampled skills per stratum had to be divisible by three. Similarly, the number of sampled offers was chosen to be large enough (at least 100) to allow an excellent degree of representativity of the dataset, while also respecting the requirement that, under the sampling scheme, the total number of ads be divisible by three.
Table 1 2 shows, for the same offers displayed in Table I 1, the model positives (truncated at 10 positives in the table, for the sake of convenience), which were also annotated within the same annotation task. The sampling design for the stratum of model positives is much simpler, because all model positives were sampled for every ad. This posed less concerns in terms of annotation efficiency, because model positives are less numerous than model negatives. Again, the task of the annotator was to delete skills from the cells if they were not required by the offer in the corresponding row.
For the second annotation task, the design of the annotation task was simpler, because all the sampled skills were annotated for all the sampled ads. The annotated data for the second task (without job descriptions), as well the script used to generate the annotation sample and analyse the results, are provided together with this paper as supplementary material.
Annex II the calculation of skill-specific accuracy rate in the context of the specific sampling design used in this paper
Equation (1) can be simplified, given our specific sampling scheme for the first annotation task, by multiplying both the numerator and the denominator by the ratio of the ad sample size to the ad population size. To understand this, we consider what happens after this multiplication to the three main components of Equation (1): the denominator (a), the weighted sum of true positives (b), and the weighted sum of true negatives (c).
With the notation as in Equation (1).
To start with, the denominator (a), after being divided by itself (population size) and multiplied by the ad sample size, simply equals the ad sample size (in our specific case, 102).
Concerning the weighted count of true positives (b), it is important to remember that, by sampling all model positives for skill i within the ad sample, we automatically include all true positives (since true positives must be model positives). Because the probability of sampling model positives is 100%, the weight wpi becomes 1 when divided by the ratio of sample to population size. The intuition for this is that, since all true positives are included in the sample, one true positives represents only itself in the ad sample for skill i.
In contrast, for each skill i, out of all the ad-skill couples for which the model predicted a negative (i.e., model negatives), only 3 were randomly chosen for evaluation. This implies that each evaluated model negative had a probability of being evaluated equal to the ratio of 3 to the number of negatives; and therefore a weight equal to the inverse of this ratio. (As explained in Section 3.2, some skills only had 2 negatives in the sample; in such cases, the formula was modified to use the ratio of 2 to the number of negatives). Consequently, Equation (1), given our sampling scheme, can be simplified for the typical skill to the following formula:
With ModelNegativesi being the number of model negatives in the sample of ads for skill i; and the rest of the notation as in Equation (1). Equation (A4) is the algebraic equivalent of Equation (1) under our sampling scheme.
As a first practical example, consider the skill “hardware components”. For this skill, it is straightforward to calculate the accuracy rate, because it has no model positives. Therefore, only 3 model negatives, chosen at random from all ads, were evaluated for this skill. Each of these model negatives received a weight equal to 102/3 = 34. Out of the 3 model negatives, 2 were true negatives, and 1 was a false negative. Therefore, we estimate that, had we evaluated “hardware components” for the full sample of 102 ads, we would have found 2·34 = 68 accurate predictions. The estimated accuracy rate is two thirds (68/102≈66.7%). This is a relatively low accuracy rate, which could be expected, because “hardware components” is a broadly defined skill which could mean very different things (e.g., mice, printers, screens) and it is therefore difficult to capture with a small set of keywords. It is important to note that, as this accuracy rate is derived from only three ad–skill pairs, it does not carry statistical significance by itself. Instead, it functions as a preliminary component in the construction of a robust performance metric across multiple skills.
As another example, consider “SQL Server”. This skill was predicted by the model in 5 out of the 102 sampled ads. Of these, 4 were true positives, meaning the annotator considered them actually required by the ad. The skill was not predicted by the classifier (i.e., it was a model negative) in the remaining 97 sampled ads. Out of these 97 ads, 3 were randomly chosen for evaluation, and all were found to be true negatives. Each of the model negatives received a weight of 97/3≈32.33. Therefore the estimated number of correct predictions in the sample of ads is 4 + 3·32.33≈101. The accuracy on this skill was therefore estimated as very high (101/102≈99.0%), as expected because “SQL Server” is a narrowly-defined skill on which we expect that the model makes very few mistakes. As we did for the previous example, we would like to emphasise that, since this accuracy rate is calculated from only eight ad–skill pairs, it has no statistical significance on its own. Rather, it serves as a preliminary measure used to construct a robust performance indicator across many skills.
Finally, before closing this annex, it should be noted that the problem of calculating accuracy at the skill level is greatly simplified for the second annotation task, described in Section 4. In that case, there is no stratification for model positives and negatives and every skill is evaluated on all the 35 sampled ads. Therefore, wpi and wni simplify to 1 and the accuracy rate of a skill is simply the sum of true negatives and true positives for that skill, divided by 35.
Annex III The calculation of the average number of required skills per ad and of the proportion of actual positives
Based on the annotated data, we know which sampled ad actually requires which sampled skill. This allows us to estimate the number of ESCO skills in each ad in the sample, provided that we assign the correct weight to each skill. No additional weighting is needed, because no stratification for model positives/negatives is applied in the sampling scheme of the second annotation task.
The weights of the skills are defined conceptually in Equation (7) and implied by the sampling frequencies in Table 4. For example, a skill found by the text matching classifier but not by GPT4 has a weight of 138/10 = 13.8. It should be noted that the average estimate largely depends on the sample of skills that have not been found by any classifier (called “others” in Table 4), because these skills are very numerous (13 290). Therefore, despite the relatively large number of skills sampled from this group, the weight of each skill is still very large (13 290/50 = 265.8 – See Figure 3). Nonetheless, the inclusion of skills found by the two classifiers play a larger role in determining the lower boundary of the confidence interval.
For each sampled ad, the total number of required skills is equal to the estimated number of actual positives. The average per ad is derived by summing up this number across ads and dividing by 35 (the number of sampled ads). This is summarised in the equation:
With AvgSkillsPerAd being the average number of skills per ad; Iad,i a binary indicator equal to 1 if the ad-skill couple [ad,i] is an actual positive (i.e., an ad-skill couple in which the ad requires the skill according to the annotating experts); vi the weight of skill i as defined in Equation (7); and nads the total number of ads in the sample. Bootstrapping allows us to calculate the 95% confidence interval for this indicator (79.6–517.4), as well as the average (261.7) and quartile estimates (174.6, 245.3 and 330.9).
The formula used for calculating the proportion of actual positives among ad-skill couples in Table 5 is a slight modification of the formula above:
With PropPos being the proportion of actual positives (as reported in Table 5); and Σvi the sum of all skill weights, which in turn equals the total number of ESCO skills.
The case of the proportion of actual positives in Table 3 is slightly more complicated, because in the first annotation task there is stratification for model positives/negatives. In that case, we first calculate the proportion of ads for which a skill is an actual positive. We do this by adapting Equation (1), relying on the fact that the sum of actual positives is equal to the sum of true positives and false negatives as defined in Table 1:
With PropPosi being the proportion of ads for which skill i is an actual positive; and all other notation as in Equation (1).
To obtain the average proportion of actual positives across skills and ads, we compute the weighted average of PropPosi across skills, adapting Equation (5) as follows:
With PropPos being the proportion of actual positives (as reported in Table 2); PropPosi defined in Equation (A7); and all other notation as in Equation (5).
Finally, once PropPos has been calculated, it is straightforward to calculate the accuracy of a hypothetical random-guessing classifier. This classifier predicts a positive with probability equal to the proportion of actual positives; and a negative otherwise. The hypothetical accuracy rate of such a classifier is therefore the sum of the squares of the proportions of actual negatives and of actual positives
29
:
With AccuracyRandClas being the accuracy of the hypothetical random classifier. It should be noted that this classifier is purely theoretical. Unlike the text matching, GPT4, and sentence embedding classifiers, it does not classify all skills independently for all ads. Its “accuracy” represents the expected accuracy of randomly guessing whether a single hypothetical skill – whose class imbalance matches the average across all sampled skills – would be required in the population of ads. Although hypothetical, this random-guessing classifier serves as a useful benchmark for assessing the performance of our classifiers relative to the level of class imbalance they encounter.
References
Supplementary Material
Please find the following supplemental material available below.
For Open Access articles published under a Creative Commons License, all supplemental material carries the same license as the article it is associated with.
For non-Open Access articles published, all supplemental material carries a non-exclusive license, and permission requests for re-use of supplemental material or any part of supplemental material shall be sent directly to the copyright owner as specified in the copyright notice associated with the article.