






Abstract
Mobile Network Operators (MNO) data are increasingly investigated by National Statistical Institutes as complementary data sources to be integrated into traditional statistical production processes, due to their timeliness and high spatial granularity. In this work, we produce flash estimates of tourist overnight stays in Emilia-Romagna at the municipal level by integrating MNO and survey data through augmented and transfer learning approaches. Prior to the application of the learning methods, an adjustment procedure is applied to the MNO data in order to obtain a more reliable proxy variable. For each approach, several model variants are tested and compared within a random forest framework. Learning-based estimates are also compared with predictions obtained from a traditional univariate time series model (TRAMO) for selected municipalities. Despite relying on a more limited amount of data, learning-based approaches yield satisfactory results compared to time series models, even outperforming them in specific settings and municipalities. A scalability analysis is conducted by progressively increasing the number of municipalities whose survey observations are replaced by proxies in the learning process. The results show that both augmented and transfer learning scale well and are effective in reducing the structural bias of MNO data with respect to the survey data they aim to approximate. These findings suggest promising directions for fully transductive learning solutions, which could bypass the need for early respondent data during the training phase.
Keywords
Introduction
Providing timely estimates is one of the key challenges currently faced by official statistics. Early and provisional statistical information can be particularly valuable for gaining a better understanding of the dynamics of economic activities and social behaviors, allowing policymakers and other stakeholders to confirm or reassess preliminary perceptions and to support decision-making processes while awaiting definitive results from traditional official statistical surveys. In many fields such as tourism and commuting, a growing number of experiments are investigating the potential of Mobile Network Operators (MNO) data to approximate survey-based indicators produced by National Statistical Institutes.1–3 In such experiments, augmented and transfer learning techniques are widely used to integrate survey data, which are generally delayed, with recent near-real-time MNO data.
In this work, we integrate survey data with their MNO counterparts to provide flash estimates for the nights spent by tourists (overnight stays) at municipality level, by using augmented learning (AL) and quasi-transfer learning (QTL) approaches. 4 These techniques assume the availability of survey data from a subset of “early respondent” units at the time the flash estimate is produced, while proxy information is used for units that have not yet provided their data; in our case, the proxy consists of MNO data or past observations. AL and QTL fit models using the full set of municipalities, rather than only the early respondents, and use these models to predict the target variable for units where only the proxy is available, in a nowcasting setting.
Learning-based approaches can be formulated in different ways, depending on how the available variables are used and which proxy is chosen.
The goal of this paper is to assess whether some formulations (“variants”) perform better than others and whether these approaches are competitive with traditional ones. To evaluate the effectiveness of the learning-based approaches, we compare them with a “baseline” model relying exclusively on early respondent data (referred to also as “simplistic” in Zhang and Haug 4 ) and with forecasts obtained from traditional univariate time series models. We also examine how performance depends on the proportion of early respondents. Given the experimental nature of learning-based methods in official statistics, where the literature often emphasizes theoretical aspects, this work also aims to provide operational guidance on their implementation and testing.
It is worth noting that the flash estimation problem presented so far could also be reframed in a setting where survey data are collected for a limited sample of municipalities and used to adjust MNO-based estimates for the remaining ones.
The remainder of the paper is organized as follows. Section 2 describes the data, while Section 3 presents the methodological framework. The experimental setup is detailed in Section 4, and the results are discussed in Section 5. Concluding remarks are provided in Section 6.
Data
In the field of tourism statistics, a key indicator is the total number of nights spent by tourists in accommodation establishments. In Italy, this information is collected at the municipal level (Local Administrative Unit) on a monthly basis through a dedicated official survey. The exploratory analysis focuses on the Emilia-Romagna region in Northern Italy, a territory of 330 municipalities characterized by diverse tourism profiles and varying levels of supply and demand. Emilia-Romagna region exhibits a highly diversified tourism structure, shaped by the coexistence of different territorial and functional tourism profiles. Coastal municipalities along the Adriatic coast, and in particular the Romagna Riviera, represent the core of summer seaside tourism, characterized by very high tourist volumes and marked seasonal concentration during the summer months. Beyond the summer season, given their strong tourism-oriented vocation, these destinations also host a wide range of cultural and recreational events throughout the rest of the year. In addition to coastal tourism, the region hosts important thermal destinations, located mainly in the Apennine area, as well as large urban municipalities that attract tourism related to cultural heritage, business activities and events. Mountain and hilly municipalities are associated with nature-based and leisure tourism, generally characterized by lower volumes and different seasonal patterns, while a residual group of municipalities presents more heterogeneous and less specialized tourism profiles. Several classifications of the municipalities by tourism profile are available. In this paper, we adopt the one defined by the Emilia-Romagna Region, 5 which identifies six tourism areas reflecting the prevailing tourism characteristics of the territory: coastal municipalities, thermal areas, large municipalities, Apennine municipalities, hilly areas and other areas. Figure 1 shows their spatial distribution across the regional territory.

Municipalities of Emilia-Romagna by touristic vocation.
The main survey-based data set consists of monthly time series of overnight tourist stays at the municipal level, covering the period from August 2022 to October 2023. As is standard in official tourism statistics, these data are released with an approximate two-month delay due to data collection and validation procedures. In parallel, aggregated Mobile Network Operator (MNO) data are available at the municipal level and provide near real-time proxies for tourist presence, expressed as estimates of overnight stays derived from device counts and adjusted using market share information. Section 2.1 details the procedure used to obtain these data from mobile phone contact signals. Temporally, the MNO data cover monthly observations from August 2022 to October 2023 for all municipalities. Table 1 shows the different volumes of tourism in the various geographical zones and the percentages with respect to the regional totals. A two-sample Kolmogorov-Smirnov test confirmed that the distributions of the two data sources are statistically different (
Distribution of municipalities by tourism area and percentage of overnight stays according to survey and MNO data.

The last column reports the signed percentage difference between MNO-based and survey-based shares.
It should be noted that the MNO data time series available for this study are relatively short (14 months), a limitation that is beyond our control and reflects the experimental nature of the topic. Consequently, the present work is limited to an exploratory analysis designed to be as robust as possible with respect to this constraint. The availability of longer time series in the future would enable a more thorough validation of the proposed methodology and the exploration of alternative approaches.
In addition to these sources, for a selected group of ten municipalities, namely Alto Reno Terme, Bologna, Ferrara, Forlì, Modena, Parma, Piacenza, Ravenna, Riccione, and Rimini, longer monthly time series of survey data are available, starting from January 2015. This group includes large municipalities in terms of population size and degree of urbanization (Bologna, Piacenza, Ferrara, Forlì, Modena, and Parma), a major coastal municipality (Riccione), and an important thermal destination (Alto Reno Terme). Rimini and Ravenna can be classified both as a major coastal municipality and as a large urban municipality, according to the above definitions. This selection aims to reflect the main tourism profiles of the region while focusing on high-impact destinations and is used in Section 4.2 for the comparison between the learning-based and the time series approaches.
In this work, we rely on data provided by a single Mobile Network Operator, although several others operate within the region under examination. A brief description of how tourist overnight stays are computed from these raw MNO data is provided below; for further details on the algorithm, refer to TSS Multi-MNO project. 1
The algorithm processes raw data to assign each user to a municipality on an hourly basis, excluding movement hours and imputing nocturnal gaps caused by device switch-offs. A valid overnight stay is recorded when a user spends at least 6 hours in a given municipality during the 20:00-08:00 window. An overnight stay is classified as tourist if the municipality falls outside the user’s Usual Environment (the set of habitually frequented locations estimated over a 12 month window using frequency and duration thresholds). The number of tourist nights is then computed as the monthly count of all such valid tourist overnight stays: if a user spends multiple consecutive nights at a destination, each night contributes independently to the total count. Finally, all counts are scaled from the single operator subscribers to the full population using proprietary expansion factors that account for market share, demographics, and device availability.
Methodology
This section describes the methodological framework adopted to produce flash estimates of overnight tourist stays at the municipal level by integrating official survey data and Mobile Network Operator (MNO) information. The proposed approaches aim to exploit the timeliness of MNO data while preserving coherence with the official statistical benchmark represented by survey-based overnight stays.
The methodological framework considered in this study consists of four main approaches. First, a baseline model is used as a benchmark, relying on standard predictive modeling techniques trained on early respondent municipalities. Second, augmented learning (AL) is employed to enlarge the training set by incorporating proxy information from previous periods or alternative sources. Third, quasi-transfer learning (QTL) is introduced to exploit information transferred from models estimated on related temporal populations. Finally, the analysis includes a traditional time series approach based on ARIMA models implemented through the TRAMO framework, which is widely used in official statistics for modeling and forecasting seasonal economic and social time series.
Baseline, AL, and QTL are model-agnostic approaches and are therefore described independently of any specific model choice in this section. Implementation details, including the choice of the predictive function, are further presented in Section 4.
The following subsections describe in detail the bias adjustment applied to MNO data and the specification of each approach. Subsections are present to describe the transductive nature of the problem and the approach we used for testing.
MNO data adjustment
MNO data exhibit a bias with respect to survey data. To assess whether this bias behaves as a Gaussian white noise process in log-scale, and is therefore reducible to a level correction, or whether it also presents a time-dependent structure, we analyse the log-difference

We assess the white noise assumption of the bias through a set of complementary diagnostic tests: a 

If the white noise hypothesis is rejected, 
Let 


Augmented learning
Augmented Learning (AL) techniques aim at improving predictive performance by enlarging the effective training sample through the inclusion of proxy information for units whose response variable is not yet observed. In this work, we follow the implementation of Zhang and Haug. 4
To address the partial unavailability of the response variable at time 
Quasi-transfer learning
Transfer learning methods aim to enhance predictive performance by exploiting information from related models trained on different but comparable data sources. In this work, we adopt a quasi-transfer learning (QTL) approach, which takes advantage of auxiliary models estimated on similar populations to support the estimation of the target model.
Let
Let 
Our aim is to obtain the transfer schema described below, where the upper part represents the practical approximation obtained using the augmented sets 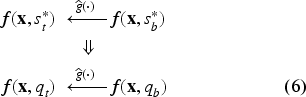
In the proposed implementation, the transfer function
In summary, the models
Alternative substitution strategies for missing responses, as well as different transfer schemes and transfer functions, may be considered depending on the application; a comprehensive discussion is provided in Zhang and Haug. 4 This approach allows us to exploit structural similarities across populations while accommodating differences in their underlying distributions.
Statistical learning methods are typically developed within an inductive framework, in which a model is trained on a set of labeled units and then generalized to unseen observations. Transductive inference, 6 on the other hand, operates on a fixed and finite population of units with partially observed labels, where the target units are known at training time. Rather than estimating a general predictive function, transduction exploits the known characteristics of the target units directly, making inference inherently tied to the specific population under study. AL and QTL methods belong to this category: the availability of proxy information for the dependent variable allows units with unobserved survey outcomes to be included in the training process. This distinguishes our framework from standard cross-sectional prediction, where out-of-sample units are genuinely unobserved during training.
In this sense, the augmented training set
Testing framework
To obtain robust and comprehensive performance metrics across different configurations of early respondents, we adopt a repeated
When partitioning the dataset into folds, units in the labeled folds are treated as early respondents and constitute the inductive component of the augmented training set
To reduce variability due to the random allocation of municipalities across folds, the procedure is repeated 50 times, each time with a different fold assignment. For each municipality 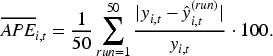
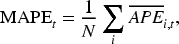
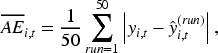
To account for heterogeneity in the scale of overnight stays, prediction performance is also evaluated using the weighted absolute percentage error (WAPE), obtained by weighting the averaged APEs by the observed number of overnight stays:
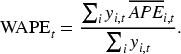
The labeled and held-out folds in the cross-validation were constructed to reflect the desired proportion of early respondent units. For example, to obtain a share of 10% early respondents, we adopted a 10-fold cross-validation scheme in which, at each iteration, one fold is treated as the labeled set (early respondents), while the remaining nine folds are assigned to the held-out set, with the target variable replaced by the proxy. To obtain a 50% rate of early respondents, we use a two-fold cross-validation scheme, with one fold composed of early respondent units and the other consisting of units for which the target variable was replaced by the proxy and used as the held-out set. In each iteration, predictions and error computations are restricted to units with unobserved survey outcomes. Overall, the aggregate error values obtained through the proposed simulation framework can be considered pessimistic, as in practice learning-based estimates would be released together with the observed data from early respondents, which are unaffected by prediction error.
In the limiting case where no early respondent units are available, inference would rely exclusively on proxy-based information observed on the full population. No inductive generalization would be involved, as predictions would be restricted to the same finite set of units entering the learning process, resulting in a fully transductive inference problem.
Univariate time series model: TRAMO
The TRAMO (Time series Regression with Arima noise, Missing observations, and Outliers) model
7
is a widely used univariate time series methodology for preprocessing in seasonal adjustment and for forecasting. In this work, we use its implementation in the
TRAMO models the observed series through a seasonal ARIMA (SARIMA) specification,
9
which extends the standard ARIMA framework by including additional seasonal autoregressive and moving average components operating at lag 
Model identification, outlier detection, and parameter estimation are handled automatically by the
The choice of a univariate time series model for this work fell on TRAMO due to its simplicity in estimation, manipulation, and interpretation, combined with the level of detail it provides in modeling (including automatic specification).
Experimental setup
Learning-based methods present numerous degrees of freedom in their implementation. To navigate this complexity, we propose a pragmatic strategy for exploring potential configurations:
exploring different model variants for the learning-based approaches using a fixed and representative number of early respondents. In the absence of full details, a 50% threshold of early respondents can be assumed as a baseline; once a promising variant is identified, comparing its (averaged) performance results, obtained in the previous step, with those of available time-series models; performing a scalability analysis by varying the number of early respondent units in the selected variant.
All experiments were carried out using a random forest model.10,11 This model class was selected for its ability to capture non-linear relationships and its natural capacity to produce non-negative forecasts of overnight stays. Furthermore, random forests are highly robust when trained on small datasets. This is particularly advantageous for the scalability analysis in Section 4.3, where the baseline approach is tested with low rates of early respondents (i.e. a small number of units for the training). Random forest models were fitted using the
We hypothesized a simplified scenario in which data from early respondents and MNO sources were available in the middle of the month following the reference period, whereas official survey data covering the full population are usually released about two months after the end of the reference month. This scenario is realistic for MNO data but slightly optimistic for official survey data, whose release may occasionally be delayed beyond two months.
Given these preconditions, some model variants relying on the one-month lagged survey variable
Considering the transductive nature of the problem, predictive performance was assessed through a simulation study based on repeated cross-validation, as described in Section 3.6.
We then compared the results obtained by AL and QTL, which exploited information from a large set of municipalities to generate predictions, with the TRAMO univariate time series forecasting approach. The latter did not rely on MNO data but fitted separate models for each municipality using long survey time series, learning unit-specific dynamics solely from past observations.
The scalability analysis was subsequently conducted by varying the number of early respondent units to evaluate the quality of the proxy information.
An alternative approach, in which MNO data are used as regressors in univariate time series models, would be both interesting and potentially effective; however, it was not feasible given the data currently available. The experiments conducted are nevertheless valuable, as they allow us to assess whether an approach that relies on shorter time series (requiring fewer models to estimate but exploiting more informative variables) can serve as a viable alternative to the traditional method, particularly in municipalities or situations where the latter proves less effective. The limited availability of MNO data is also typical of circumstances in which National Statistical Institutes must decide whether to acquire data from Mobile Network Operators, who generally provide only recent time series for evaluation purposes. In such cases, having a testing framework capable of assessing the predictive power of MNO data based on short time series can be highly beneficial.
In the following subsections, we describe the three experiments conducted according to the previously defined strategy: one with many model variants for each approach while keeping the number of early respondents fixed; a second in which we compared one of the best variants from the previous experiment with predictions from a TRAMO model; and a final experiment in which we performed the scalability analysis.
Experiment 1: Learning-based approaches and their variants
All analyses presented here were carried out on municipalities with a number of overnight stays above the median value computed across all municipalities and all available months (577 nights), resulting in a subset of 175 units. This selection excluded municipalities without a touristic vocation, which would mainly introduce noise into the estimates and were less likely to benefit from the production of flash indicators.
Rather than defining a strict a priori target, the selection process followed an initial exploratory phase. In the preliminary explorations, we observed that predicting the tourist’s overnight stays for municipalities with low tourism volumes was highly volatile and challenging. Consequently, we chose to focus our analysis on the most significant ones to ensure robust results.
At this stage, we fixed the proportion of early respondent municipalities to 50% of the units by adopting the two-fold repeated cross-validation testing framework, applied to multiple model variants for each approach. The observed share of early respondents is not systematically recorded by our institute at present. However, it is known that data from some municipalities could be made available earlier by reorganising the data collection process appropriately. In the absence of a precise estimate of this share, the 50% threshold was adopted as the baseline configuration. This threshold also corresponds to the share beyond which the MAPE of the baseline approach no longer improves with the addition of further early respondent units, as shown in the scalability analysis of Section 5.3. As proxy variables, we tested the number of overnight stays derived from MNO data in its adjusted form (
Regarding the features, we always included the one-month lagged survey variable (
It is worth noting that the inclusion of the lagged survey variable
In a fully transductive inference scenario, capable of operating without early respondent units, the learning-based models described above could produce a flash estimate as early as one day after the end of the target month, provided that MNO data are available in real time.
Experiment 2: Learning-based vs time series approaches
This experiment focused on comparing the adjusted MNO proxy, the learning-based approaches, and predictions obtained from univariate time series models estimated solely on survey data using TRAMO. The latter, hereafter referred to as the “time series approach”, relied on models fitted to approximately nine years of monthly survey data (starting in January 2015) for a limited set of ten municipalities.
In contrast, as in the previous experiment, the AL and QTL approaches were trained on much shorter time series, consisting of 12, 13 and 14 monthly observations for August, September and October, respectively, while exploiting cross-sectional information from a much larger set of 175 municipalities. This comparison allowed us to assess whether adjustment and learning-based methods leveraging rich cross-sectional information could compensate for the limited temporal depth of the available data. ARIMA-TRAMO models therefore provided a natural benchmark for evaluating the performance of more flexible learning-based methods in contexts where long time series are available.
MAE, MAPE, and WAPE for the learning-based approaches were derived from the
The baseline time series specification, whose results are denoted by
Experiment 3: Scalability analysis
A scalability analysis was performed for the baseline, AL, and QTL approaches by selecting a specific model variant from Experiment 1, namely the one using
Results and discussion
This section reports and discusses the results of the experiments presented above, mirroring the corresponding subsections.
Before presenting the results of the three experiments, we briefly discuss the outcomes of the preliminary MNO adjustment procedure introduced in Section 3.1, whose output was used as input across all experiments. Applying the white-noise diagnostic procedure to the period September 2022-August 2023, the white noise hypothesis for the log-difference between survey and MNO data was rejected for 168 out of 175 municipalities, which were accordingly adjusted using (4) to account for the resulting time-dependent bias.
The limited length of our available time series, combined with the requirements of the approaches we aimed to implement, only allowed us to evaluate flash estimates for August, September, and October, with August restricted to the adjusted MNO and AL methods only.
Figure 2 shows that, for September 2023, the adjusted MNO data counts by touristic zone approximated the corresponding survey counts more closely than the unadjusted MNO data.

Aggregated counts by tourism zone for survey (
Results for September and October 2023 are reported in Tables 2 and 3. In each table, the best-performing variant within each approach (Baseline, AL, and QTL) is underlined, while the overall best value for each metric across all approaches is highlighted in bold. When the two coincide, both formatting conventions are applied. In general, WAPE was consistently lower than MAPE across all approaches and variants, indicating that prediction accuracy tended to improve in municipalities with more intense tourist activity. Excluding cases in which
Performance indicators for different approaches and model variants, including the adjusted MNO proxy (
), September 2023.

Performance indicators for different approaches and model variants, including the adjusted MNO proxy (
Performance indicators for different approaches and model variants, including the adjusted MNO proxy (

The performance of
In summary, considering both MAPE and WAPE, AL was the best-performing approach. The Total Absolute Error, which is related to both metrics, confirmed this result. A strong model variant for forecasting, in terms of both MAPE and WAPE, in September and October, was the one using
These tests provided an example of how timeliness requirements and data availability can influence the choice of model specifications. It was noted that, in these examples, although adjusting MNO data was essential when they were used as proxies, this adjustment was not necessarily beneficial when MNO variables were employed as model features. This may have been due to the use of random forests, which are non-linear models, whereas the same effect might not hold for linear models.
Figure 3 shows the distribution of MAPE across municipalities for September 2023. To ensure a fair comparison, the MAPE scale was clipped at 50% in all scenarios. The maps clearly show that, in coastal municipalities and major urban areas, which were characterized by higher levels of tourist activity, both AL and QTL outperformed the baseline approach. In contrast, municipalities located in Apennine areas exhibited higher errors across all approaches.

Spatial distribution of Mean Absolute Percentage Error (MAPE), September 2023.
The results for September and October indicate that AL and QTL exhibit comparable performances, especially for some variants. Due to the shortness of the available survey time series, it was not possible to apply the QTL approach for August: doing so would have required observations of
Performance indicators for different approaches and model variants, including the adjusted MNO proxy (

Considering the quality of the results obtained using the adjusted MNO data as predictors, we also evaluated the performance of the raw MNO data instead. While the resulting WAPE was a reasonable 26%, the MAPE skyrocketed to around 330%, confirming that the adjustment procedure described in Section 3.1 is strictly necessary to make these data operationally useful when used as a standalone proxy.
Taken together, all these analyses suggest that the MNO data, when properly treated, are more effective in describing municipalities with high touristic activity, i.e., where the target value they aim to approximate exhibits a higher magnitude. In fact, the WAPE is consistently lower than the MAPE across all the considered months. This is particularly evident for August, the month with the highest tourist volumes, where the WAPE drops drastically and the adjusted MNO data alone achieve a lower Total AE than any other modeling approach.
The scenarios reported in Table 5 assume that survey data at
Accuracy measures for flash estimates of tourist overnight stays.

Accuracy measures for flash estimates of tourist overnight stays.
Comparison of time series, learning-based approaches, and the adjusted MNO proxy for August, September, and October in selected municipalities. Learning-based approaches use features
Accuracy measures for flash estimates of tourist overnight stays.

Comparison of time series models, learning-based approaches, and the adjusted MNO proxy for August, September, and October in selected municipalities, assuming that data for the month preceding the target period are not available. Learning-based approaches use features
If we consider all the accuracy measures together across the three months analyzed, the time series approach achieved the best performance. The time series approach did not significantly prevail in August when
Another consideration is that the “augmented” time series variant
Although the traditional time series approach generally appears to prevail when
Absolute percentage error (APE) by municipality and approach, including the adjusted MNO proxy (MNO

Learning-based approaches use features
Absolute percentage error (APE) by municipality and approach, including the adjusted MNO proxy (MNO

Learning-based approaches use features
Absolute percentage error (APE) by municipality and approach, including the adjusted MNO proxy (MNO

Learning-based approaches use features
This occurred in eleven municipalities across September and October, typically when the Absolute Percentage Error of the time series approach exceeded 10%. The only notable exceptions were Ferrara in October and Alto Reno Terme in September (where QTL exhibited performance comparable to TRAMO). For instance, in Ravenna in September, the time series approach yielded an APE of 12.8%, whereas QTL achieved a very small error of 0.4% and the adjusted MNO reached an even lower value of 0.1%. Similarly, in October in Riccione, the time series approach recorded a MAPE of 18.8%, compared with 10.8% for the AL approach. Although there were no municipalities in which a single approach consistently dominated the others in both September and October, these results opened up perspectives for hybrid solutions. In particular, when the time series approach struggles, for instance during periods of high uncertainty, MNO-based solutions, which incorporate near-real-time information, may represent effective alternatives. In August, when tourist overnight stays reach their overall peak, the adjusted MNO proxy always prevails in the most visited municipalities (where the number of overnight stays surpasses 50 000), with the sole exception of Riccione (despite its excellent APE of 3.1%). In these high-volume destinations, the AL approach also performs remarkably well.
Taken together, these findings further confirmed the informative value of MNO data, which could be exploited as external regressors in time series models such as TRAMO when longer MNO time series become available.
It is worth noting that a limitation of the present comparison between learning-based and time series approaches is its restriction to ten municipalities. In our case, the difficulty in retrieving long time series for all the municipalities is due to operational constraints linked to the volume of data involved and to changes in the administrative boundaries of municipalities over time, such as mergers and splits. This limitation, however, further highlights one of the advantages of the proposed MNO-based learning approaches when estimates are needed for a large set of municipalities. By combining MNO data with cross-sectional information, they can produce competitive estimates for all the municipalities while requiring a considerably smaller volume of historical data. This suggests that learning-based methods could represent a simpler yet effective alternative to traditional approaches in contexts where long time series are difficult to obtain or to handle, as well as a complementary source of estimates to be considered alongside traditional forecasts.
From the scalability analysis described in Section 4.3, we observed that MAPE remained stable for both AL and QTL approaches, while it deteriorated for the baseline approach, as shown in Figure 4. The results confirmed the effectiveness of the learning-based approaches and highlighted the relevance of the information contained in the proxy variables. Moreover, since predictive performance did not degrade even when only 10% of units provided early responses, these findings opened up perspectives for fully transductive learning solutions, where predictions could be based on proxy-dependent variables only, without relying on early respondent observations.

Performance of baseline approach, AL and QTL by varying the number of early respondents. Features:
In this work, we explored ways to exploit the information contained in MNO data to produce flash estimates at the municipal level. In doing so, we proposed a replicable framework for assessing the usefulness of short MNO time series in tourism statistics and in other domains characterized by similar dynamics. The framework included the construction of adjusted proxy variables, the specification and evaluation of alternative model variants for the considered approaches, and a scalability analysis with respect to the availability of early respondent units.
At present, MNO adjustment, augmented and quasi-transfer learning represent the only feasible options when working with short MNO time series. As additional MNO data are collected and longer series become available, these data could be incorporated as external regressors in time series forecasting models, offering a promising extension of the proposed framework. However, the approaches investigated in this study already proved to be competitive with traditional time series models. From this perspective, adaptive solutions could be envisaged, relying on MNO-based estimates when traditional time series approaches exhibit unstable or less reliable performance, for instance in periods of elevated uncertainty.
Our experiments also demonstrated that the precision of our MNO data in approximating the target variable increases with the volume of tourist overnight stays, proving more effective in municipalities characterized by higher target values. However, to achieve satisfactory results, MNO data alone are not sufficient: combining them with survey data, through the adjustment procedure and/or the learning-based approaches, is essential to fully exploit their informative potential.
As the experiments showed, the choice of the model variant of a learning approach should be made carefully evaluating the trade-off between the desired levels of accuracy and timeliness. AL and QTL clearly outperformed the baseline approach, with AL appearing slightly preferable, although there was no clear dominance. We therefore recommend a careful examination of MAPE, WAPE, and absolute errors to identify the best solution for the specific case.
In this work, we tested the proposed methodologies using random forest models with a limited set of features. Nevertheless, alternative modeling strategies could be explored, including the incorporation of additional covariates from administrative registers or spatial information.
Finally, the scalability analysis showed that the performance of the learning-based approaches did not deteriorate even when only a small number of early respondent units was available for training. Consequentially, a fully transductive learning approach relying exclusively on proxy target variables could be considered. Such an approach, which does not require early respondent observations, represents a potential enhancement and a crucial step toward making this methodology suitable for routine production of official statistics.
Footnotes

Funding
The author(s) disclosed receipt of the following financial support for the research, authorship, and/or publication of this article: This work was co-funded by the European Commission Project “MNO-MINDS” - 101132744 - 2022-IT-TSS-METH-TOO.
Declaration of conflicting interests
The author(s) declared no potential conflicts of interest with respect to the research, authorship, and/or publication of this article.