






Abstract
Background
Ovarian cancer remains one of the most lethal gynecological malignancies, largely due to delayed diagnosis and limited effectiveness of current biomarkers. Identifying candidate biomarkers through integrated gene expression analysis may enhance understanding of OC biology and support future diagnostic and prognostic investigations.
Methods
Four microarray datasets were retrieved from the Gene Expression Omnibus and analyzed using the limma package in R to identify differentially expressed genes (DEGs) through a bidirectional filter (|log2FC| ≥ 1.2). Overlapping DEGs across all four datasets were subjected to Gene Ontology and KEGG pathway enrichment analyses. Protein-protein interaction networks were constructed using the STRING database, and hub genes were identified by consensus across three centrality algorithms in Cytoscape. Prognostic significance was evaluated using Kaplan-Meier survival analysis via GEPIA2; diagnostic performance was assessed using Youden Index-based ROC analysis; and external validation was performed using an independent dataset.
Results
A total of 209 overlapping DEGs were identified, yielding 35 hub genes. Functional enrichment analysis implicated cell cycle dysregulation, metabolic reprogramming, and extracellular matrix remodeling as central biological processes. TRIP13, FGF13, and LYVE1 were significantly associated with overall survival, while ALDH1A1, GATA6, and WNT5A were associated with disease-free survival. KDR demonstrated the highest diagnostic accuracy, and external validation confirmed the generalizability of the diagnostic findings.
Conclusion
This study identifies a panel of candidate diagnostic and prognostic biomarkers in ovarian cancer, providing a molecular framework for future experimental validation and translational investigation.
Introduction
Ovarian cancer (OC) remains the most lethal gynecological malignancy worldwide, accounting for approximately 324,603 new cases and over 200,000 deaths annually.1,2 The disproportionately high mortality of OC relative to its incidence is largely attributable to the limitations in reliable and timely diagnosis, with over 70% of patients receiving their diagnosis at advanced stages III or IV, a clinical reality that has changed little over the past two decades despite considerable advances in cancer research.3,4 OC is an inherently heterogeneous disease, encompassing multiple histological subtypes each characterized by distinct molecular profiles, metastatic behavior, and therapeutic resistance.5,6 This intra- and inter-tumoral heterogeneity not only complicates clinical management but also undermines the ability of conventional biomarkers to capture the full molecular complexity of OC. 7 Given the persistent limitations of current diagnostic approaches and the continued clinical burden of OC, there is a critical need to identify novel candidate biomarkers for diagnosis and prognosis that can provide deeper insight into the molecular basis of OC and inform future translational and clinical investigations.
The current standard for OC diagnosis relies on cancer antigen 125 (CA125) and human epididymis protein 4 (HE4), both of which are limited by insufficient sensitivity in early-stage disease and lack of specificity, as elevated levels are observed in several benign gynecological and non-gynecological conditions.8–10 Although combined CA125-HE4 panels show better discriminatory performance than either marker alone, they are still insufficient as population-level screening tools and have not led to a significant decrease in OC-specific mortality.11,12 These limitations are further compounded by the molecular heterogeneity of OC, as no single protein biomarker can adequately reflect the diverse transcriptional alterations associated with different histological subtypes. Therefore, identifying gene-level signatures associated with OC across diverse patient populations represents a critical direction for biomarker discovery.
Microarray-based gene expression profiling has emerged as a well-established approach for characterizing transcriptional alterations that distinguish malignant from normal tissues, providing a comprehensive view of the molecular processes underlying tumor development, progression, and therapeutic resistance.13,14 In OC, this approach has contributed to molecular subtype classification, prognostic gene signature identification, and the elucidation of dysregulated biological pathways, highlighting the value of transcriptional profiling in uncovering disease-relevant mechanisms. 15 However, variability across studies due to differences in cohort composition, sample size, and analytical approaches may influence the consistency of reported gene signatures and pose challenges for their translational application.16,17,18
Despite advances in molecular profiling, the identification of candidate biomarkers with consistent diagnostic and prognostic relevance in OC remains a significant challenge. In this case, this study adopts an exploratory analytical approach to identify candidate biomarkers through the integrated analysis of multiple microarray-based gene expression datasets. By combining differential expression analysis, protein-protein interaction network construction, and clinical association analyses, this study aims to prioritize biologically relevant genes associated with OC. The identified candidates are intended to provide a foundation for subsequent experimental validation and future translational research.
Materials and methods
Data acquisition
In this study, microarray datasets (GSE14407, GSE18520, GSE26712 & GSE27651) were obtained from Gene Expression Omnibus (GEO). In selecting datasets for this study, we prioritized those generated using the Affymetrix Human Genome U133 Plus 2.0 Array (HG-U133_Plus_2) and the Illumina HiSeq 2000 platform. These platforms were chosen because they provide high-throughput, high-resolution sequencing data, ensuring data quality, consistency, and comparability. Datasets from these platforms were further selected based on the presence of both tumor and normal tissue samples. The overall workflow of the bioinformatics analysis for this study is summarized in Figure 1. Schematic workflow illustrating the bioinformatics analysis used in the study. The analysis involved data acquisition, pre-processing, differential gene expression analysis, functional enrichment analysis, protein-protein interaction network construction, and diagnostic and prognostic assessments.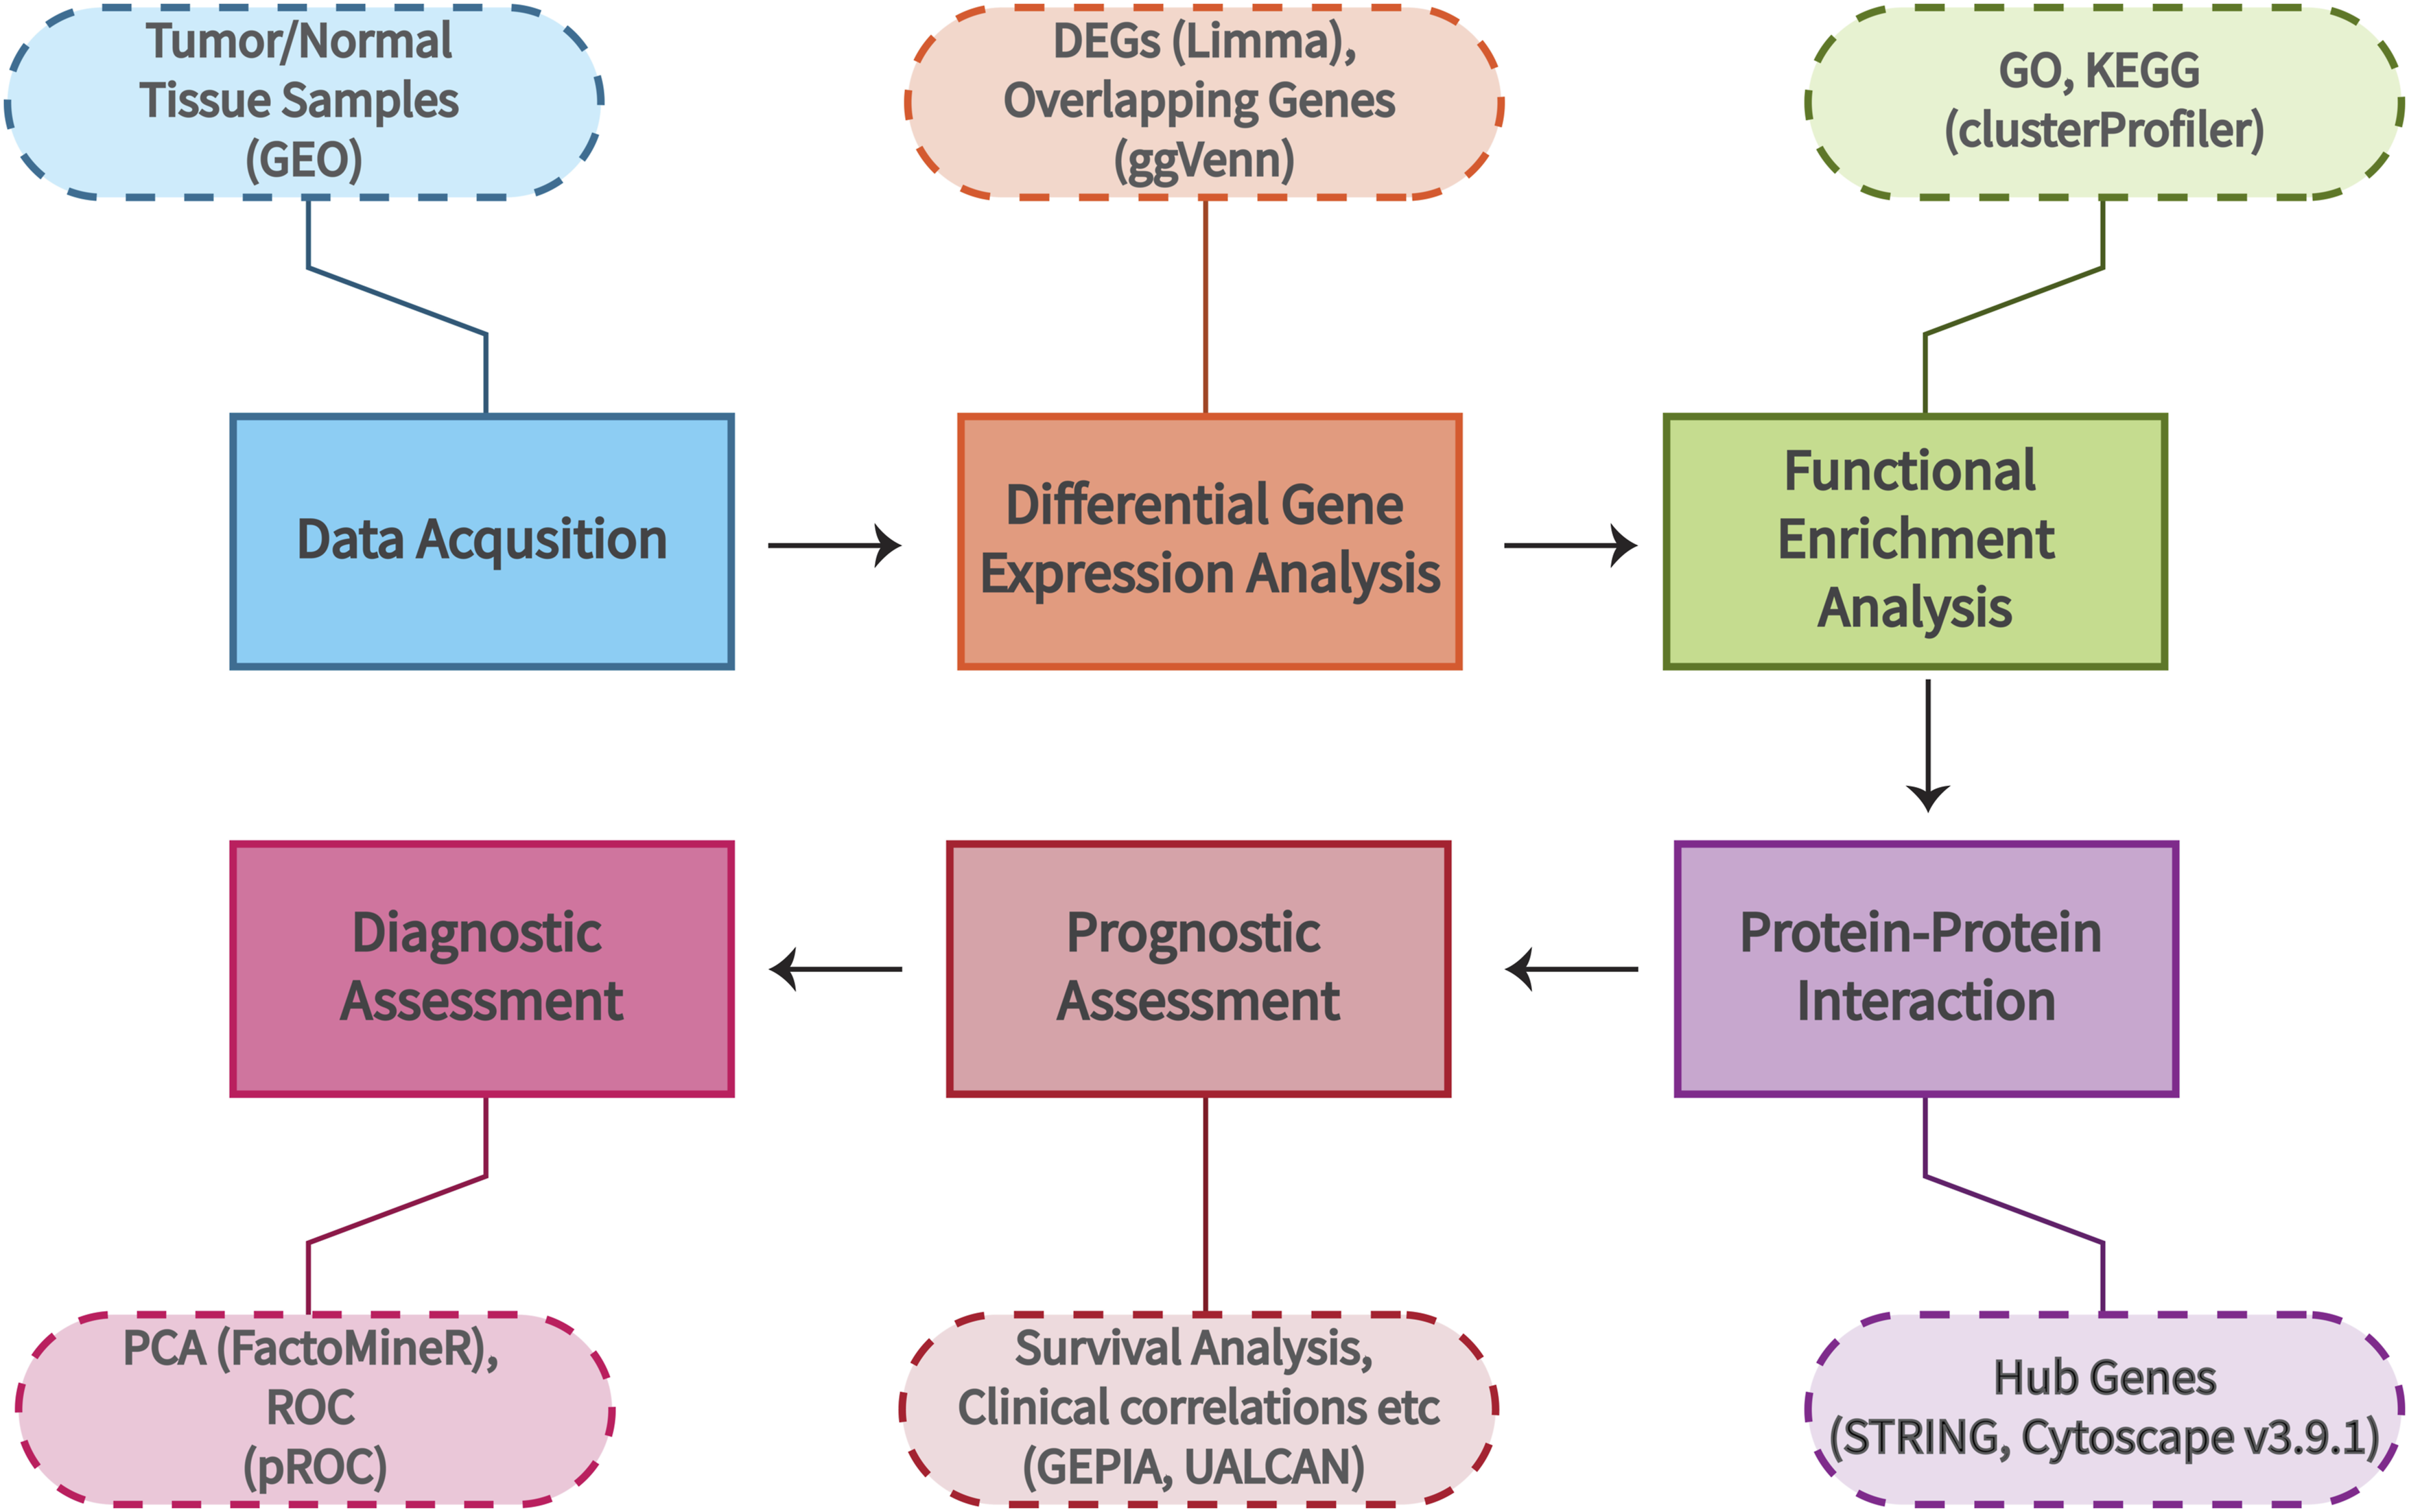
Differential expression analysis
DEGs between ovarian tumor and normal tissue samples were identified using the R software (version 4.5.1) with the limma package (version 3.66.0). 19 For each dataset, raw expression data were retrieved from GEO in Series Matrix format and imported into R using the GEOquery package. 20 Expression matrices were examined for scale consistency; datasets on a linear scale were log2 transformed before analysis, while those already on a log2 scale were used directly. Probe-level expression values were mapped to official gene symbols using platform annotation files. For probes mapping to multiple genes, indicated by “///” separators in the annotation, were excluded to ensure unambiguous gene-level quantification. Where multiple probes mapped to the same gene symbol, the probe with the highest mean expression across all samples was retained.
For each dataset, samples were assigned to two groups: normal ovarian tissue (Group 1, reference) and ovarian tumor tissue (Group 2, experimental). A design matrix was constructed accordingly, and differential expression was assessed using empirical Bayes moderated t-statistics. Multiple testing correction was applied using the Benjamini-Hochberg method to control the false discovery rate (FDR). Genes with an absolute log2 fold change (|log2FC|) ≥ 1.2 and an adjusted p-value < 0.05 were considered significantly differentially expressed. This threshold was selected to prioritize genes with biologically meaningful expression differences while minimizing noise-driven signals. Importantly, both upregulated (log2FC ≥ +1.2) and downregulated (log2FC ≤ −1.2) genes were retained for downstream analysis to ensure a comprehensive and biologically complete representation of the transcriptomic landscape of OC. Additionally, to identify genes consistently dysregulated across multiple independent datasets, overlapping DEGs were determined separately for upregulated and downregulated gene sets using Venn diagram analysis implemented in the ggvenn package in R. 21 Only genes present in all four datasets were carried forward for downstream functional enrichment, network construction, and clinical relevance evaluation. A total of 96 common upregulated and 113 common downregulated DEGs were identified, yielding a final set of 209 overlapping DEGs. Volcano plots were generated using ggplot2 to visualize the distribution of DEGs across each dataset.
Functional enrichment analysis
To explore the biological significance of the overlapping DEGs, functional enrichment analysis was performed separately for the common upregulated and common downregulated DEG sets using the clusterProfiler package (version 4.18.4) in R. 22 Before analysis, gene symbols were converted to Entrez IDs using the bitr () function with the human genome annotation database org. Hs.eg.db. 23 Genes that could not be mapped using current official symbols were updated to their most recent HGNC-approved gene symbols before remapping to ensure maximum gene coverage.
Gene Ontology (GO) enrichment analysis was performed independently for each DEG direction across three ontology categories: Biological Process (BP), Molecular Function (MF), and Cellular Component (CC). Similarly, Kyoto Encyclopedia of Genes and Genomes (KEGG) pathway enrichment analysis24,25 was conducted separately for upregulated and downregulated DEG sets to identify significant metabolic and signalling pathways associated with each expression direction. For both GO and KEGG analyses, the Benjamini-Hochberg method was applied to correct for multiple testing, and a false discovery rate (FDR) adjusted p-value threshold of < 0.05 was used to define statistically significant enrichment. For KEGG analysis, the organism code “hsa” (Homo sapiens) was specified, and gene symbols were converted from Entrez IDs to official gene symbols using the setReadable () function to improve biological interpretability. For visualization, the top 15 most significantly enriched terms were displayed for GO BP and CC categories. In contrast, all significant terms were displayed for GO MF and KEGG categories, given the smaller number of significant hits. Dot plots were generated using ggplot2, where dot size represents the number of enriched genes (Gene Count) and color intensity reflects the -Log10 transformed adjusted p-value. All figures were assembled using the cowplot package in R.
Protein-protein interaction (PPI) network construction
PPI networks were constructed separately for upregulated and downregulated gene sets using the STRING database (https://string-db.org) 26 with a minimum interaction confidence score of 0.4. Unconnected nodes were removed to retain only genes with at least one significant interaction. The resulting networks were imported into Cytoscape v3.10.4 for visualization and topological analysis.
To identify key regulatory genes (hub genes) within each network, three centrality-based algorithms, Maximal Clique Centrality (MCC), Degree, and Closeness, were applied independently using the CytoHubba plugin in Cytoscape. Each algorithm ranked genes based on their topological importance within the network: MCC identifies nodes belonging to densely connected subnetworks, Degree identifies the most highly connected nodes, and Closeness identifies genes most central to information flow across the network. The top 20-ranked genes from each algorithm were identified for both the upregulated and downregulated networks separately. Hub genes were defined as those appearing in the top 20 rankings of all three centrality measures simultaneously. The intersection of the three top 20 gene lists was determined using the Merge Networks function in Cytoscape with the Intersection operation, yielding a final hub gene panel for each expression direction. This multi-algorithm approach was adopted to reduce bias associated with any single centrality measure and to ensure the robustness and reproducibility of hub gene selection.
Gene expression validation and clinicopathological analysis
Gene expression validation
The expression profiles of the identified hub genes were validated using the Gene Expression Profiling Interactive Analysis 2 (GEPIA2) platform (https://gepia2.cancer-pku.cn/). 27 Expression levels of all 35 hub genes (comprising 17 upregulated and 18 downregulated) were assessed by comparing ovarian serous cystadenocarcinoma tumor samples (OV; n = 426) with normal ovarian tissue samples (n = 88) derived from The Cancer Genome Atlas (TCGA) and the Genotype-Tissue Expression (GTEx) databases. Box plots were generated using the log2 (TPM + 1) scale with median-centered normalization. Statistical significance was determined using a one-way ANOVA with a p-value threshold of 0.05. Hub genes were considered validated when their expression direction in GEPIA was consistent with the direction identified in the R/limma-based DEG analysis. That is, upregulated hub genes were expected to show significantly higher expression in tumor tissues, while downregulated hub genes were expected to show significantly lower expression compared to normal controls.
Pathological stage analysis
The association between hub gene expression and pathological disease stage expression analysis was performed using GEPIA2 (https://gepia2.cancer-pku.cn/). 27 Statistical significance across stages was evaluated using a one-way ANOVA with p < 0.05 as the significance threshold. Only major stages were included in the analysis to ensure adequate sample sizes per group and maximize statistical power. Hub genes showing statistically significant stage-dependent expression differences were identified and reported.
Clinicopathological association analysis
The associations between hub gene expression and clinicopathological features were further explored using the UALCAN web portal (https://ualcan.path.uab.edu/), 28 which utilizes TCGA ovarian serous cystadenocarcinoma (OV) data. For each of the 35 hub genes, four clinicopathological variables were examined. With respect to race and ethnicity, pairwise comparisons were performed between Caucasian, African American, and Asian patient groups, yielding three comparisons: Caucasian vs. African American, Caucasian vs. Asian, and African American vs. Asian. For age-related associations, patients were stratified into four age groups (21-40, 41-60, 61-80, and 81-100 years), and six pairwise comparisons were performed across all possible age group combinations. Tumor grade associations were assessed by comparing expression levels between Grade 2 and Grade 3 tumors; Grade 1 and Grade 4 comparisons were not available due to insufficient sample sizes for these grades in the TCGA OV dataset. Finally, given that TP53 is the most frequently mutated gene across multiple OC subtypes,29,30 expression differences between TP53 mutant and TP53 non-mutant OC samples were evaluated to assess the molecular relevance of hub genes in the situation of TP53 dysregulation. Furthermore, statistical significance was defined as p < 0.05 for all comparisons. The p-values obtained from UALCAN were recorded for all hub genes across all clinicopathological variables and visualized as significance heatmaps generated in R using the ComplexHeatmap package. 31 Separate heatmaps were generated for upregulated and downregulated hub gene panels, and for demographic associations (race and age) and clinical/molecular associations (tumor grade and TP53 mutation status), respectively. Cell color intensity reflected the magnitude of statistical significance, with deeper colors indicating stronger associations. Cells containing statistically significant associations (p < 0.05) were annotated with asterisks according to the following convention: * p < 0.05, ** p < 0.01, *** p < 0.001, **** p < 0.0001.
Survival analysis
The prognostic significance of the identified hub genes was evaluated using the GEPIA2 platform (https://gepia2.cancer-pku.cn/). 27 Kaplan-Meier (KM) survival curves were generated for both Overall Survival (OS) and Disease-Free Survival (DFS) using the ovarian serous cystadenocarcinoma (OV) dataset from TCGA. Patients were stratified into high- and low-expression groups using the median expression level of each hub gene as the cutoff. Statistical significance was assessed using the log-rank test, and hazard ratios (HR) with corresponding p-values were calculated to quantify the association between gene expression and survival outcomes. A p-value threshold of < 0.05 was applied to define statistically significant prognostic associations. Survival analysis was performed separately for the 17 upregulated and 18 downregulated hub gene panels. Hub genes demonstrating statistically significant associations with either OS or DFS were identified as potential prognostic biomarkers and are reported with their corresponding HR, p (HR), and log-rank p-values.
Principal component analysis (PCA) and hierarchical clustering
PCA and hierarchical clustering were performed to evaluate the ability of the identified hub genes to discriminate between OC and normal tissue samples. Expression data for the hub genes were extracted from all four GEO datasets and combined into a single integrated expression matrix comprising 331 samples, of which 293 were tumor samples, and 38 were normal samples. Before analysis, expression values were log2-transformed where necessary, and the highest-expressing probe per gene was retained to ensure one-to-one gene-to-probe mapping. Only genes present across all four datasets were included in the final analysis. PCA was performed using the FactoMineR package in R, 32 with expression values standardized by unit variance scaling before analysis. Three PCA scenarios were evaluated: all 35 hub genes combined, the 17 upregulated hub genes only, and the 18 downregulated hub genes only. For each scenario, principal component 1 (PC1) and principal component 2 (PC2) were plotted against each other with samples colored by group: tumor samples in red and normal samples in grey. 95% confidence ellipses were overlaid for each group to visualize the degree of separation between tumor and normal samples. Again, hierarchical clustering heatmaps were generated using the ComplexHeatmap package 31 in R to visualize gene-level expression patterns across all samples. Expression values were z-score scaled per gene before clustering to normalize for differences in expression magnitude across genes and datasets. Separate heatmaps were generated for the upregulated and downregulated hub gene panels. Both rows and columns were clustered using the Ward. D2 agglomeration method with Euclidean distance as the distance metric. Columns were split by sample group, tumor, and normal, to facilitate visual comparison of expression patterns between the two groups. A color scale ranging from blue (low expression) to white (intermediate) to red (high expression) was used to represent z-score normalized expression values.
Receiver operating characteristic (ROC) Analysis
ROC analysis was also performed to evaluate the diagnostic potential of the identified hub genes in discriminating OC samples from normal tissue samples. The analysis was conducted using the pROC package in R 33 on the integrated expression dataset comprising all four GEO datasets. Sample labels were encoded as a binary response variable with tumor samples assigned a value of 1 and normal samples assigned a value of 0. ROC analysis was performed separately for the 17 upregulated and 18 downregulated hub gene panels. For each hub gene, the area under the ROC curve (AUC) was computed as a measure of overall diagnostic performance, with higher AUC values indicating greater discriminatory ability. The 95% confidence interval for each AUC was calculated using the DeLong method. The optimal classification threshold for each gene was determined using the Youden Index, which maximizes the sum of sensitivity and specificity. Sensitivity and specificity values at the optimal threshold were recorded for each gene. Hub genes with AUC ≥ 0.9 were considered to have excellent diagnostic value, while those with AUC between 0.8 and 0.9 were considered to have good diagnostic value. Individual ROC curves were visualized in a grid layout with AUC, 95% CI, sensitivity, and specificity displayed within each plot. A summary table of all ROC statistics was compiled for all 35 hub genes.
External validation of the diagnostic performance of the hub genes
To further strengthen the robustness of our diagnostic findings and address the potential concern of overfitting inherent in analyses performed on differential expression analysis datasets, the diagnostic performance of the identified hub genes was independently validated using GSE69428, a publicly available gene expression dataset that was not used at any stage of the DEG analysis or primary validation pipeline. GSE69428 comprises laser capture microdissection (LCM) expression profiles of high-grade serous ovarian carcinoma (HGSOC) tissue samples and matched normal oviduct tissue samples generated on the Affymetrix HG-U133 Plus 2.0 platform (GPL570). Twenty samples were selected for external validation, comprising 10 HGSOC tumor samples and 10 normal oviduct tissue samples, while cell culture, immortalized, and xenograft samples present in the dataset were excluded to ensure biological relevance and consistency with the whole tissue design of the discovery cohort. To begin with, probe-level expression data were extracted from the GSE69428 series matrix file using the GEOquery package in R. Probe identifiers were mapped to official gene symbols using the hgu133plus2. db Bioconductor annotation package, which provides complete probe-to-gene mappings for the Affymetrix HG-U133 Plus 2.0 platform. Where multiple probes mapped to the same gene, the probe with the highest mean expression across all samples was retained. Expression values were log2-transformed where necessary before analysis. Again, differential expression of the hub genes between HGSOC tumor and normal oviduct samples was assessed using the Student's t-test, with Benjamini-Hochberg correction applied to control the false discovery rate. Hub genes with adjusted p-value < 0.05 were considered statistically significant. Directional consistency was evaluated by comparing the observed direction of expression change in GSE69428 with the expected direction based on the initial DEG analysis. Finally, ROC analysis was subsequently performed on the GSE69428 cohort using the same methodology applied in the initial ROC analysis. The AUC values obtained from the external validation cohort were compared with those from the initial cohort (datasets) to assess the consistency of diagnostic performance and evaluate the presence of overfitting. Hub genes with AUC ≥ 0.9 were considered to demonstrate excellent diagnostic performance in the external validation cohort.
Results
Dataset characteristics
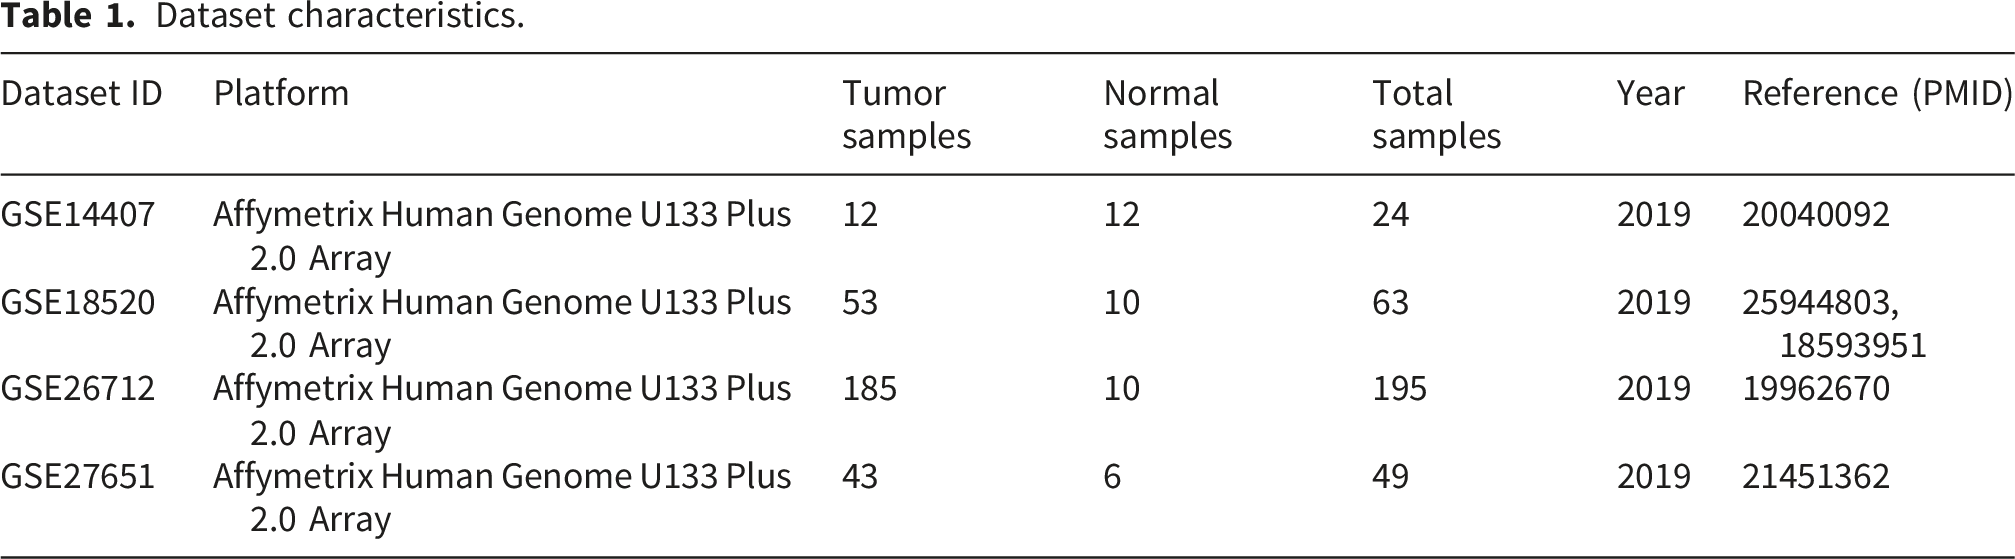
Dataset characteristics.
Identification of DEGs
In GSE14407, a total of 3,599 DEGs were identified, comprising 2,231 upregulated and 1,368 downregulated genes. In GSE18520, 2,366 DEGs were identified, of which 1,437 were upregulated, and 929 were downregulated. GSE26712 yielded 1,037 DEGs, with 359 upregulated and 678 downregulated genes. Again, GSE27651, 3,726 DEGs were identified, comprising 2,244 upregulated and 1,482 downregulated genes. The distribution of upregulated and downregulated DEGs across all four datasets is illustrated in the volcano plots presented in Figure 2. (a) Volcano plots of DEGs across four ovarian cancer GEO datasets. Red dots represent upregulated genes, blue dots represent downregulated genes, and grey dots represent genes that did not meet the significance threshold. Dashed vertical lines indicate the |log2FC| ≥ 1.2 threshold, and the dashed horizontal line indicates the adjusted p-value < 0.05 threshold. 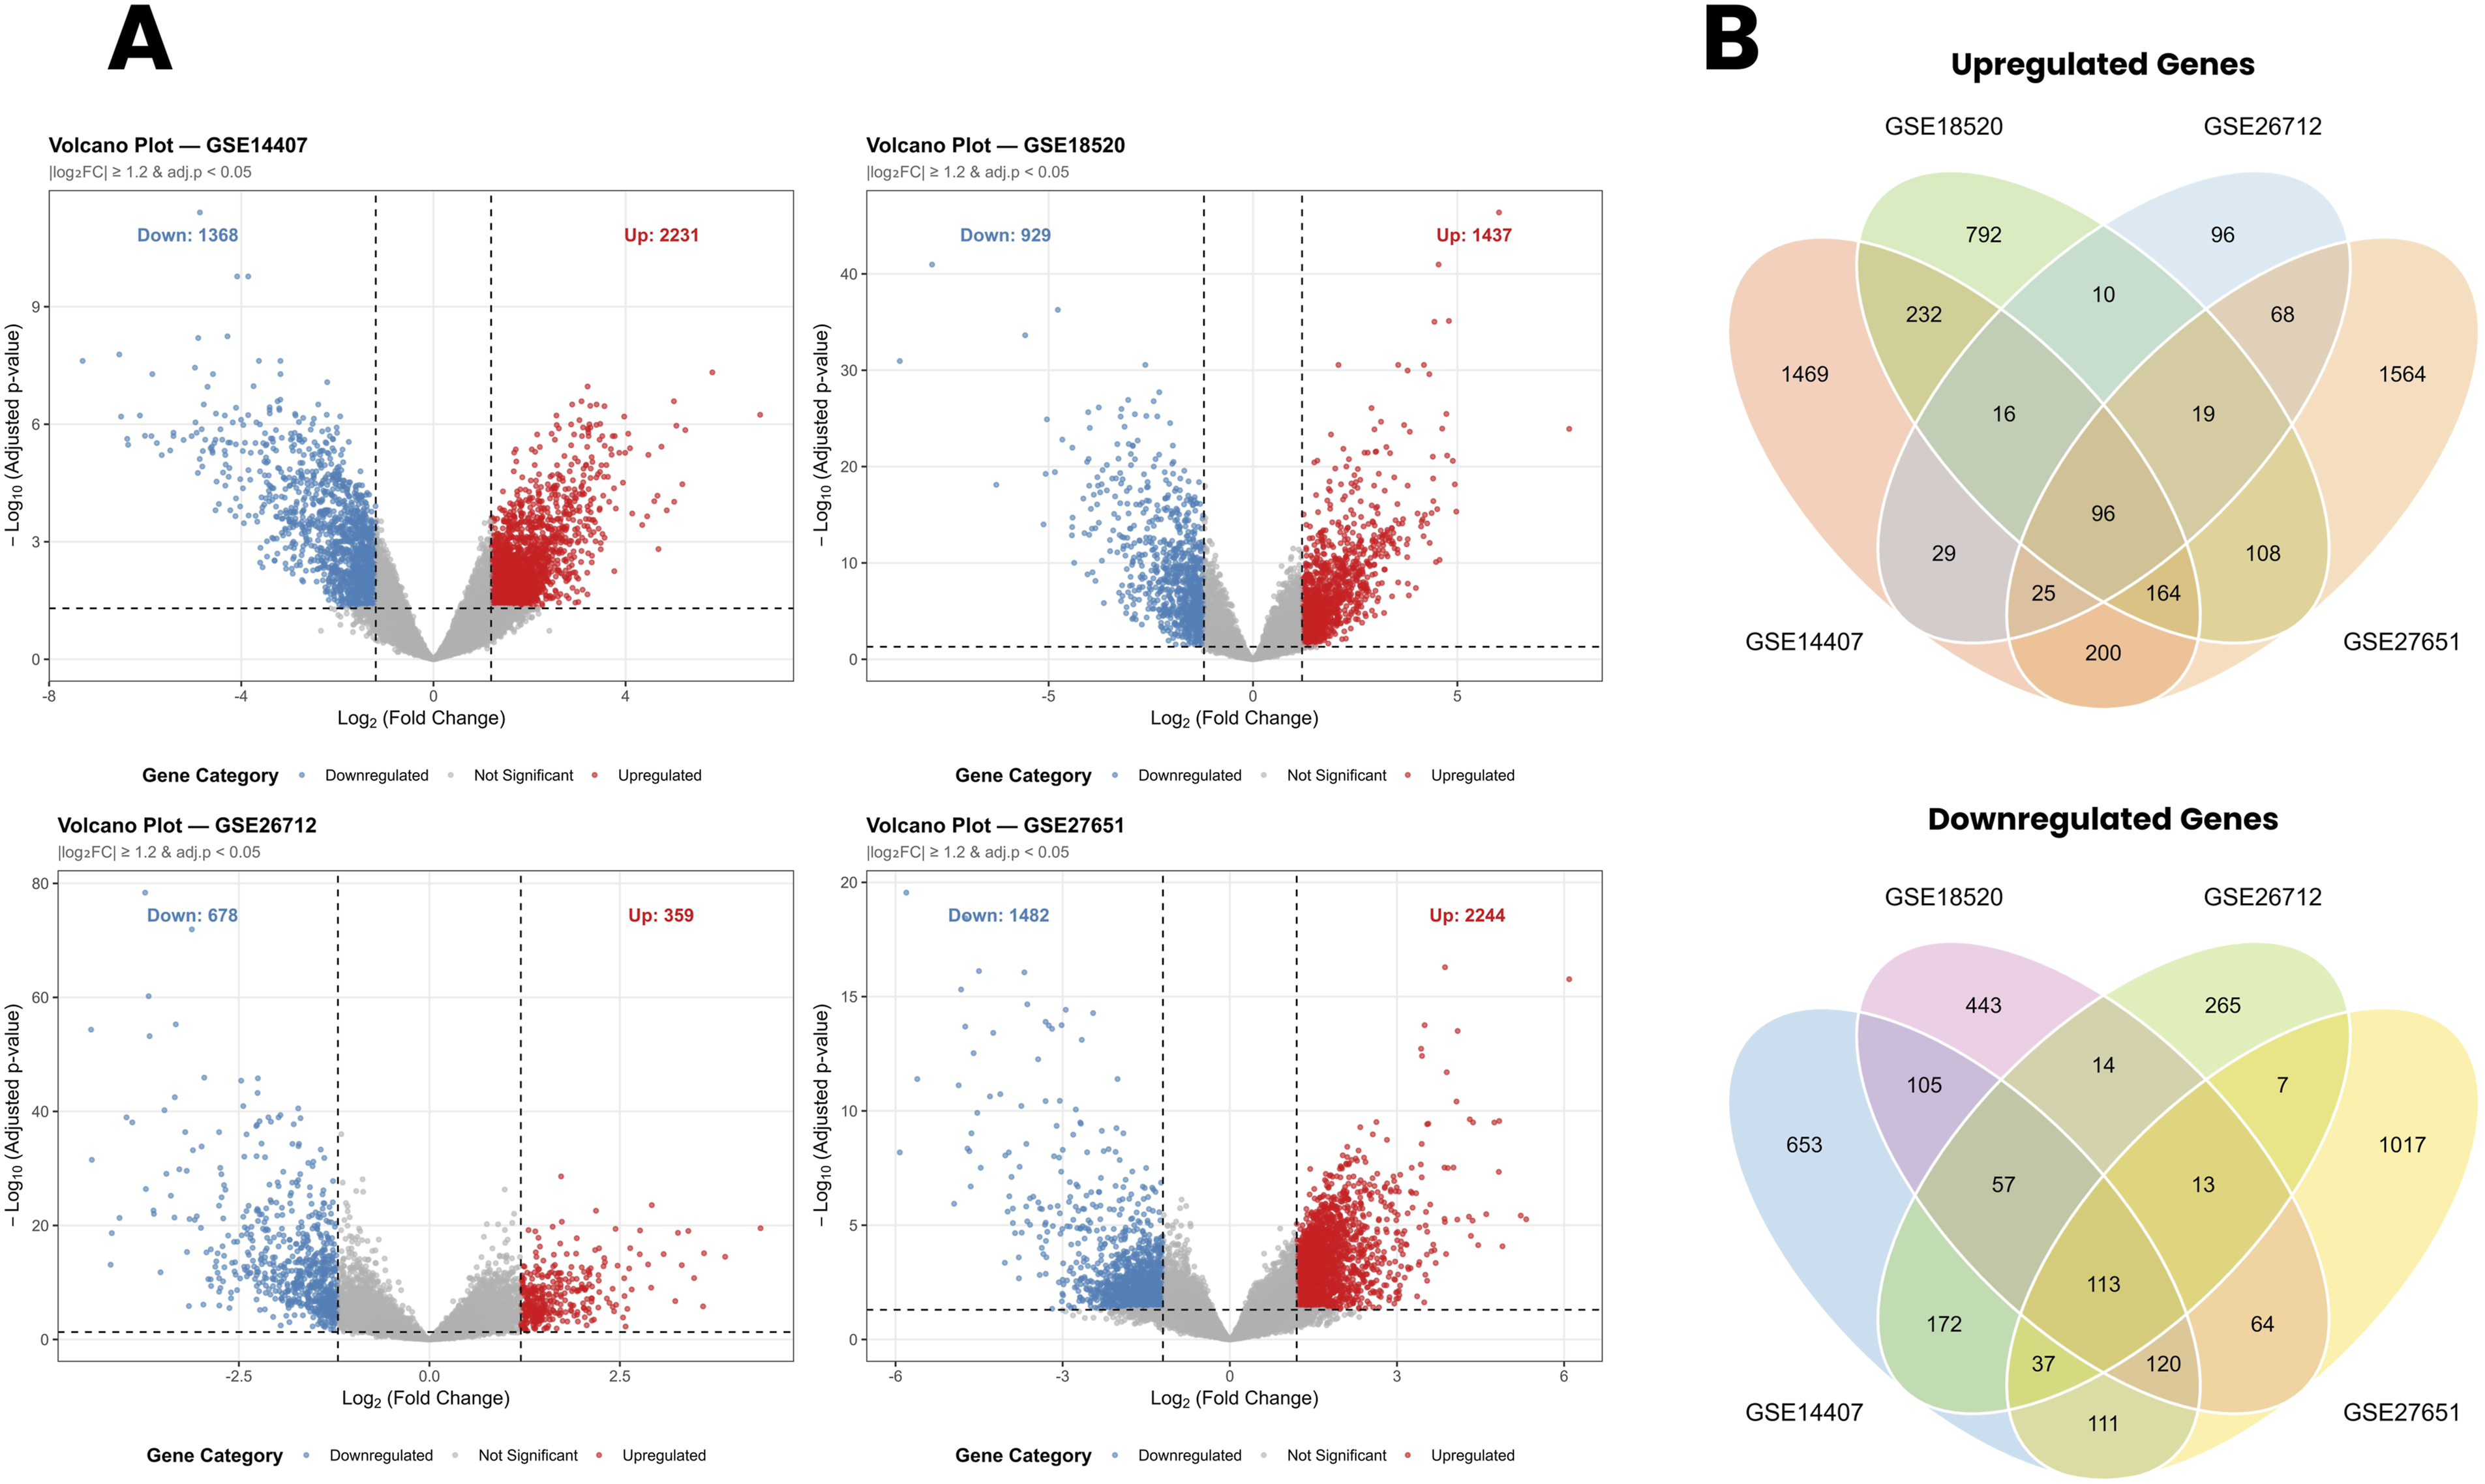
More importantly, to identify genes consistently dysregulated across all four independent datasets, overlapping DEGs were determined separately for upregulated and downregulated gene sets using Venn diagram analysis. A total of 96 genes were found to be commonly upregulated, and 113 genes were commonly downregulated across all four datasets, yielding a final panel of 209 overlapping DEGs for downstream functional enrichment and network analyses (Figure 2).
Functional enrichment analysis of overlapping genes
The GO enrichment analysis of the upregulated genes identified 240 significant BP terms, 33 CC terms, and 5 MF terms (adjusted p < 0.05). The top 15 most significantly enriched terms for BP and CC, and all significant MF terms, are presented in Figure 3. In the BP category, the most significantly enriched terms were predominantly related to chromosome segregation and cell cycle regulation, including chromosome segregation, nuclear chromosome segregation, nuclear division, and sister chromatid segregation (Figure 3(a)). Additional enriched terms included mitotic nuclear division, mitotic sister chromatid segregation, and metaphase/anaphase transition of the cell cycle, collectively pointing to dysregulation of mitotic processes as a hallmark of the upregulated transcriptomic signature in OC. In the CC category, the upregulated DEGs were predominantly enriched in components of the mitotic spindle apparatus and chromosomal structural elements, including the spindle, chromosomal region, condensed chromosome, chromosome centromeric region, midbody, and kinetochore (Figure 3(b)). The enrichment of genes within these cellular compartments is consistent with the BP findings and further supports active mitotic dysregulation in ovarian tumor cells. In the MF category, the most prominent enriched terms were microtubule binding, cyclin-dependent protein kinase regulator activity, and cyclin-dependent protein serine/threonine kinase regulator activity (Figure 3(c)). These molecular functions are directly implicated in cell cycle progression and mitotic spindle assembly, providing mechanistic support for the observed BP and CC enrichments. Dot plots illustrating the top enriched GO terms among the 96 common upregulated DEGs across all four GEO datasets. (a) Biological Process (BP) enrichment showing the top 15 significantly enriched terms. (b) Cellular Component (CC) enrichment showing the top 15 significant terms. (c) Molecular Function (MF) enrichment showing the top 5 significant terms.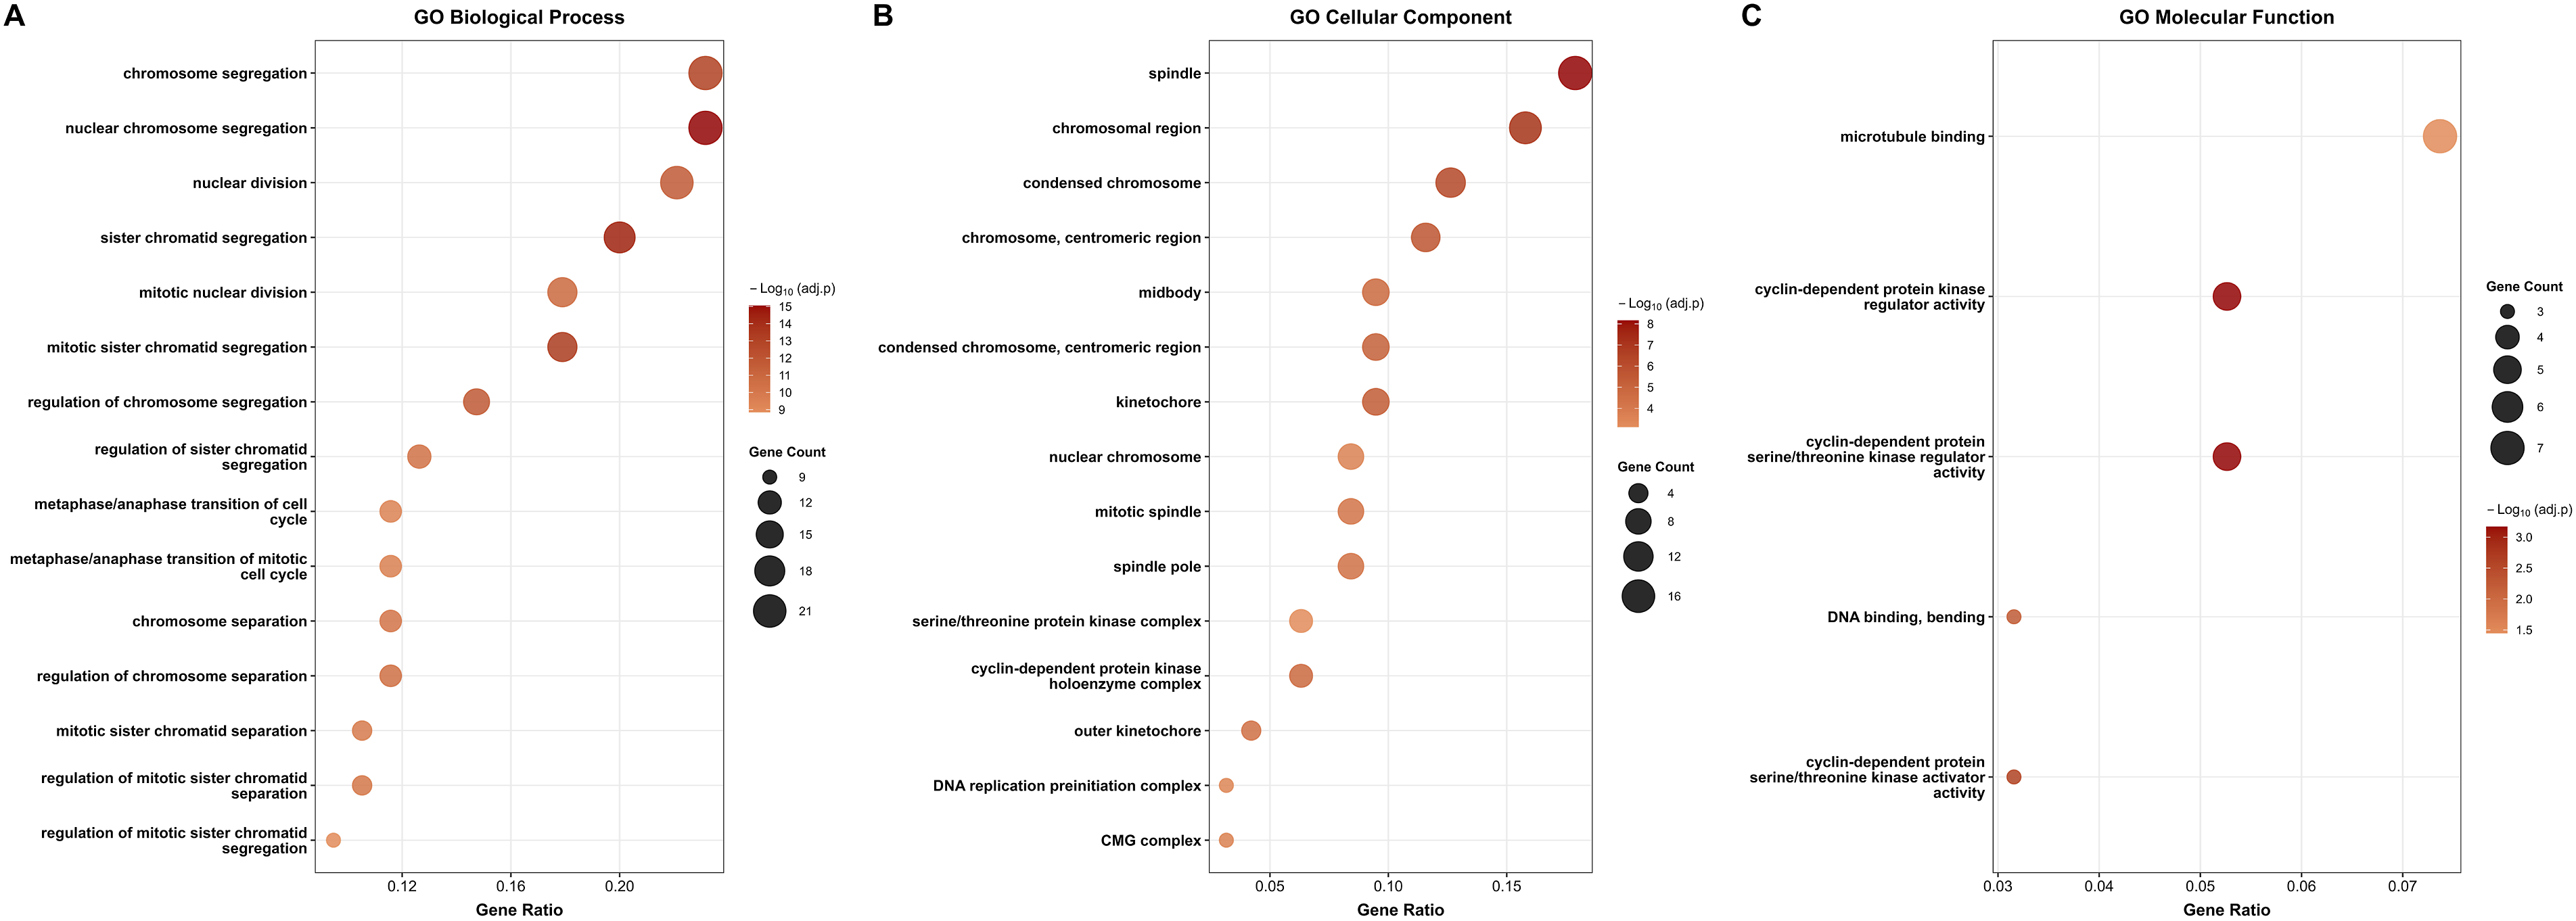
For the downregulated genes, the most significantly enriched term was hormone metabolic process, which showed the highest gene count and strongest statistical significance among all downregulated BP terms in the BP category (Figure 4(a)). Other highly enriched terms included connective tissue development, respiratory system development, and lung development. Notably, multiple terms related to BMP signalling were enriched, including cellular response to BMP stimulus, response to BMP, regulation of BMP signalling pathway, and negative regulation of BMP signalling pathway. Additionally, enrichment of steroid biosynthetic process and multiple metabolic terms, including isoprenoid, terpenoid, diterpenoid, retinoid, and retinol metabolic processes, highlights significant suppression of steroid hormone biosynthesis and lipid metabolism, which are known to play protective roles in normal ovarian tissue physiology.
34
Also, in the CC category, only 2 significant terms were identified (Figure 4(b)). Both terms had a notably high gene count of 14 (Figure 4(c)). Furthermore, in the MF category, the most prominently enriched terms were glycosaminoglycan binding, heparin binding, and sulfur compound binding, followed by extracellular matrix structural constituent, alcohol dehydrogenase (NAD+) activity, and all-trans-retinol dehydrogenase (NAD+) activity (Figure 4(c)). Dot plots illustrating the top enriched GO terms among the 113 common downregulated DEGs across all four GEO datasets. (a) Biological Process (BP) enrichment showing the top 15 significantly enriched terms. (b) Cellular Component (CC) enrichment showing the 2 significant terms identified. (c) Molecular Function (MF) enrichment showing all 6 significant terms.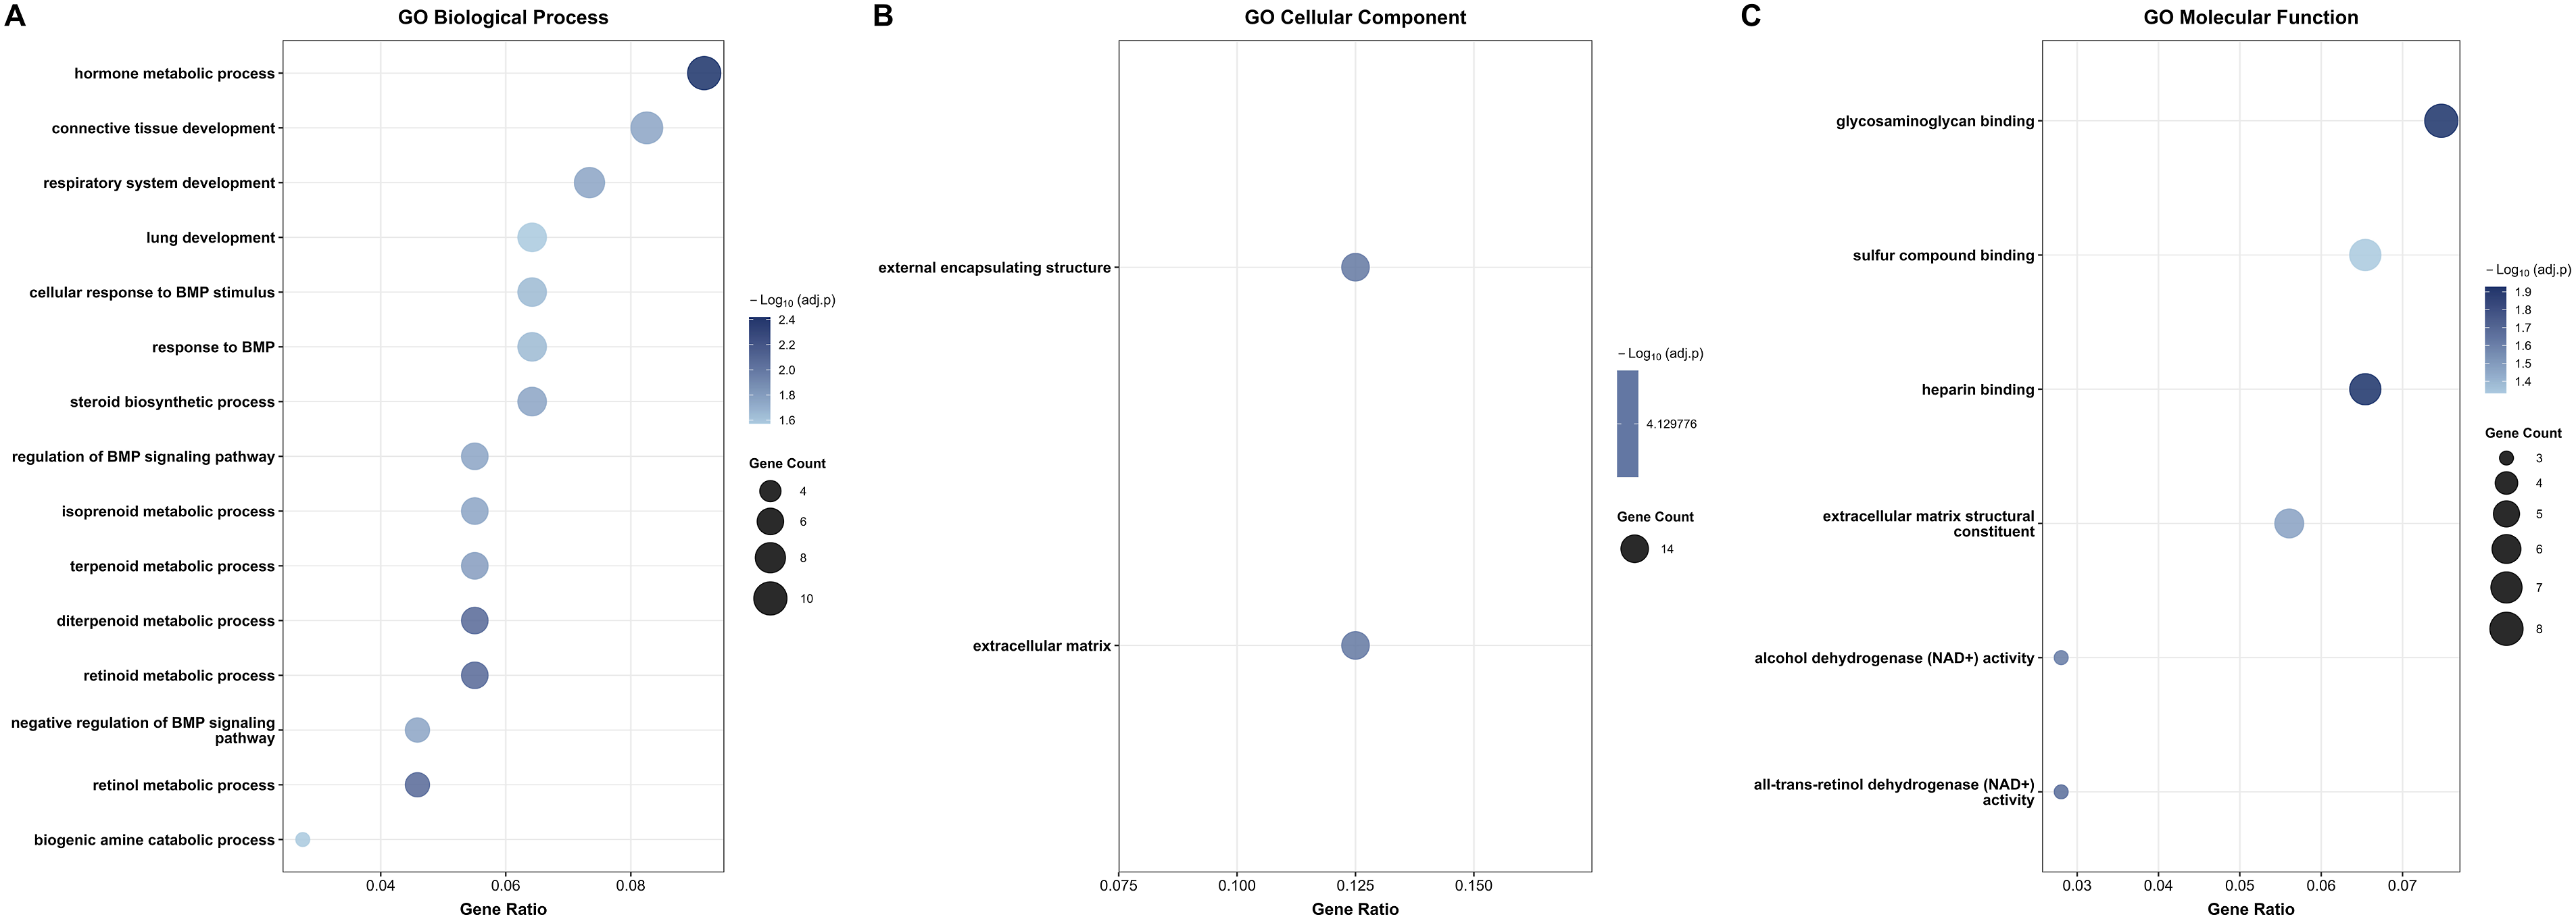
Moving on, KEGG pathway enrichment analysis identified 7 significant pathways among the upregulated DEGs and 4 significant pathways among the downregulated DEGs (adjusted p < 0.05) (Figure 5). For the upregulated DEGs, the most significantly enriched pathway was the cell cycle pathway, which exhibited the highest gene count (n = 11) and the strongest statistical significance (−Log10 adjusted p > 6) among all identified pathways (Figure 5(a)). Additional significantly enriched pathways included Human T-cell leukemia virus 1 infection and oocyte meiosis, both of which share mechanistic overlap with cell cycle regulatory genes and reflect the hijacking of proliferative machinery in tumor cells. The biosynthesis of amino acids and the p53 signalling pathway were also significantly enriched, with the p53 pathway being particularly noteworthy given its central role as a tumor suppressor. Furthermore, glycine, serine, and threonine metabolism and the one-carbon pool by folate pathways were enriched, which could reflect active metabolic reprogramming to support rapid tumor cell proliferation. Among the downregulated DEGs, the most significantly enriched pathway was retinol metabolism, which had the highest gene count and the strongest statistical significance among the downregulated pathways (Figure 5(b)). Drug metabolism via cytochrome P450 was the second most enriched pathway, reflecting suppression of xenobiotic-metabolizing enzymes. Tyrosine and histidine metabolism were also significantly enriched among the downregulated DEGs, consistent with the broader suppression of amino acid catabolic pathways observed in the GO enrichment analysis. Dot plots illustrating the significantly enriched KEGG pathways among the common DEGs across all four GEO datasets. (a) KEGG pathway enrichment of the 96 upregulated DEGs, identifying 7 significant pathways predominantly related to cell cycle regulation, amino acid biosynthesis, and cancer-associated signalling. (b) KEGG pathway enrichment of the 113 downregulated DEGs, identifying 4 significant pathways predominantly related to metabolic processes, including retinol metabolism, drug metabolism, and amino acid catabolism.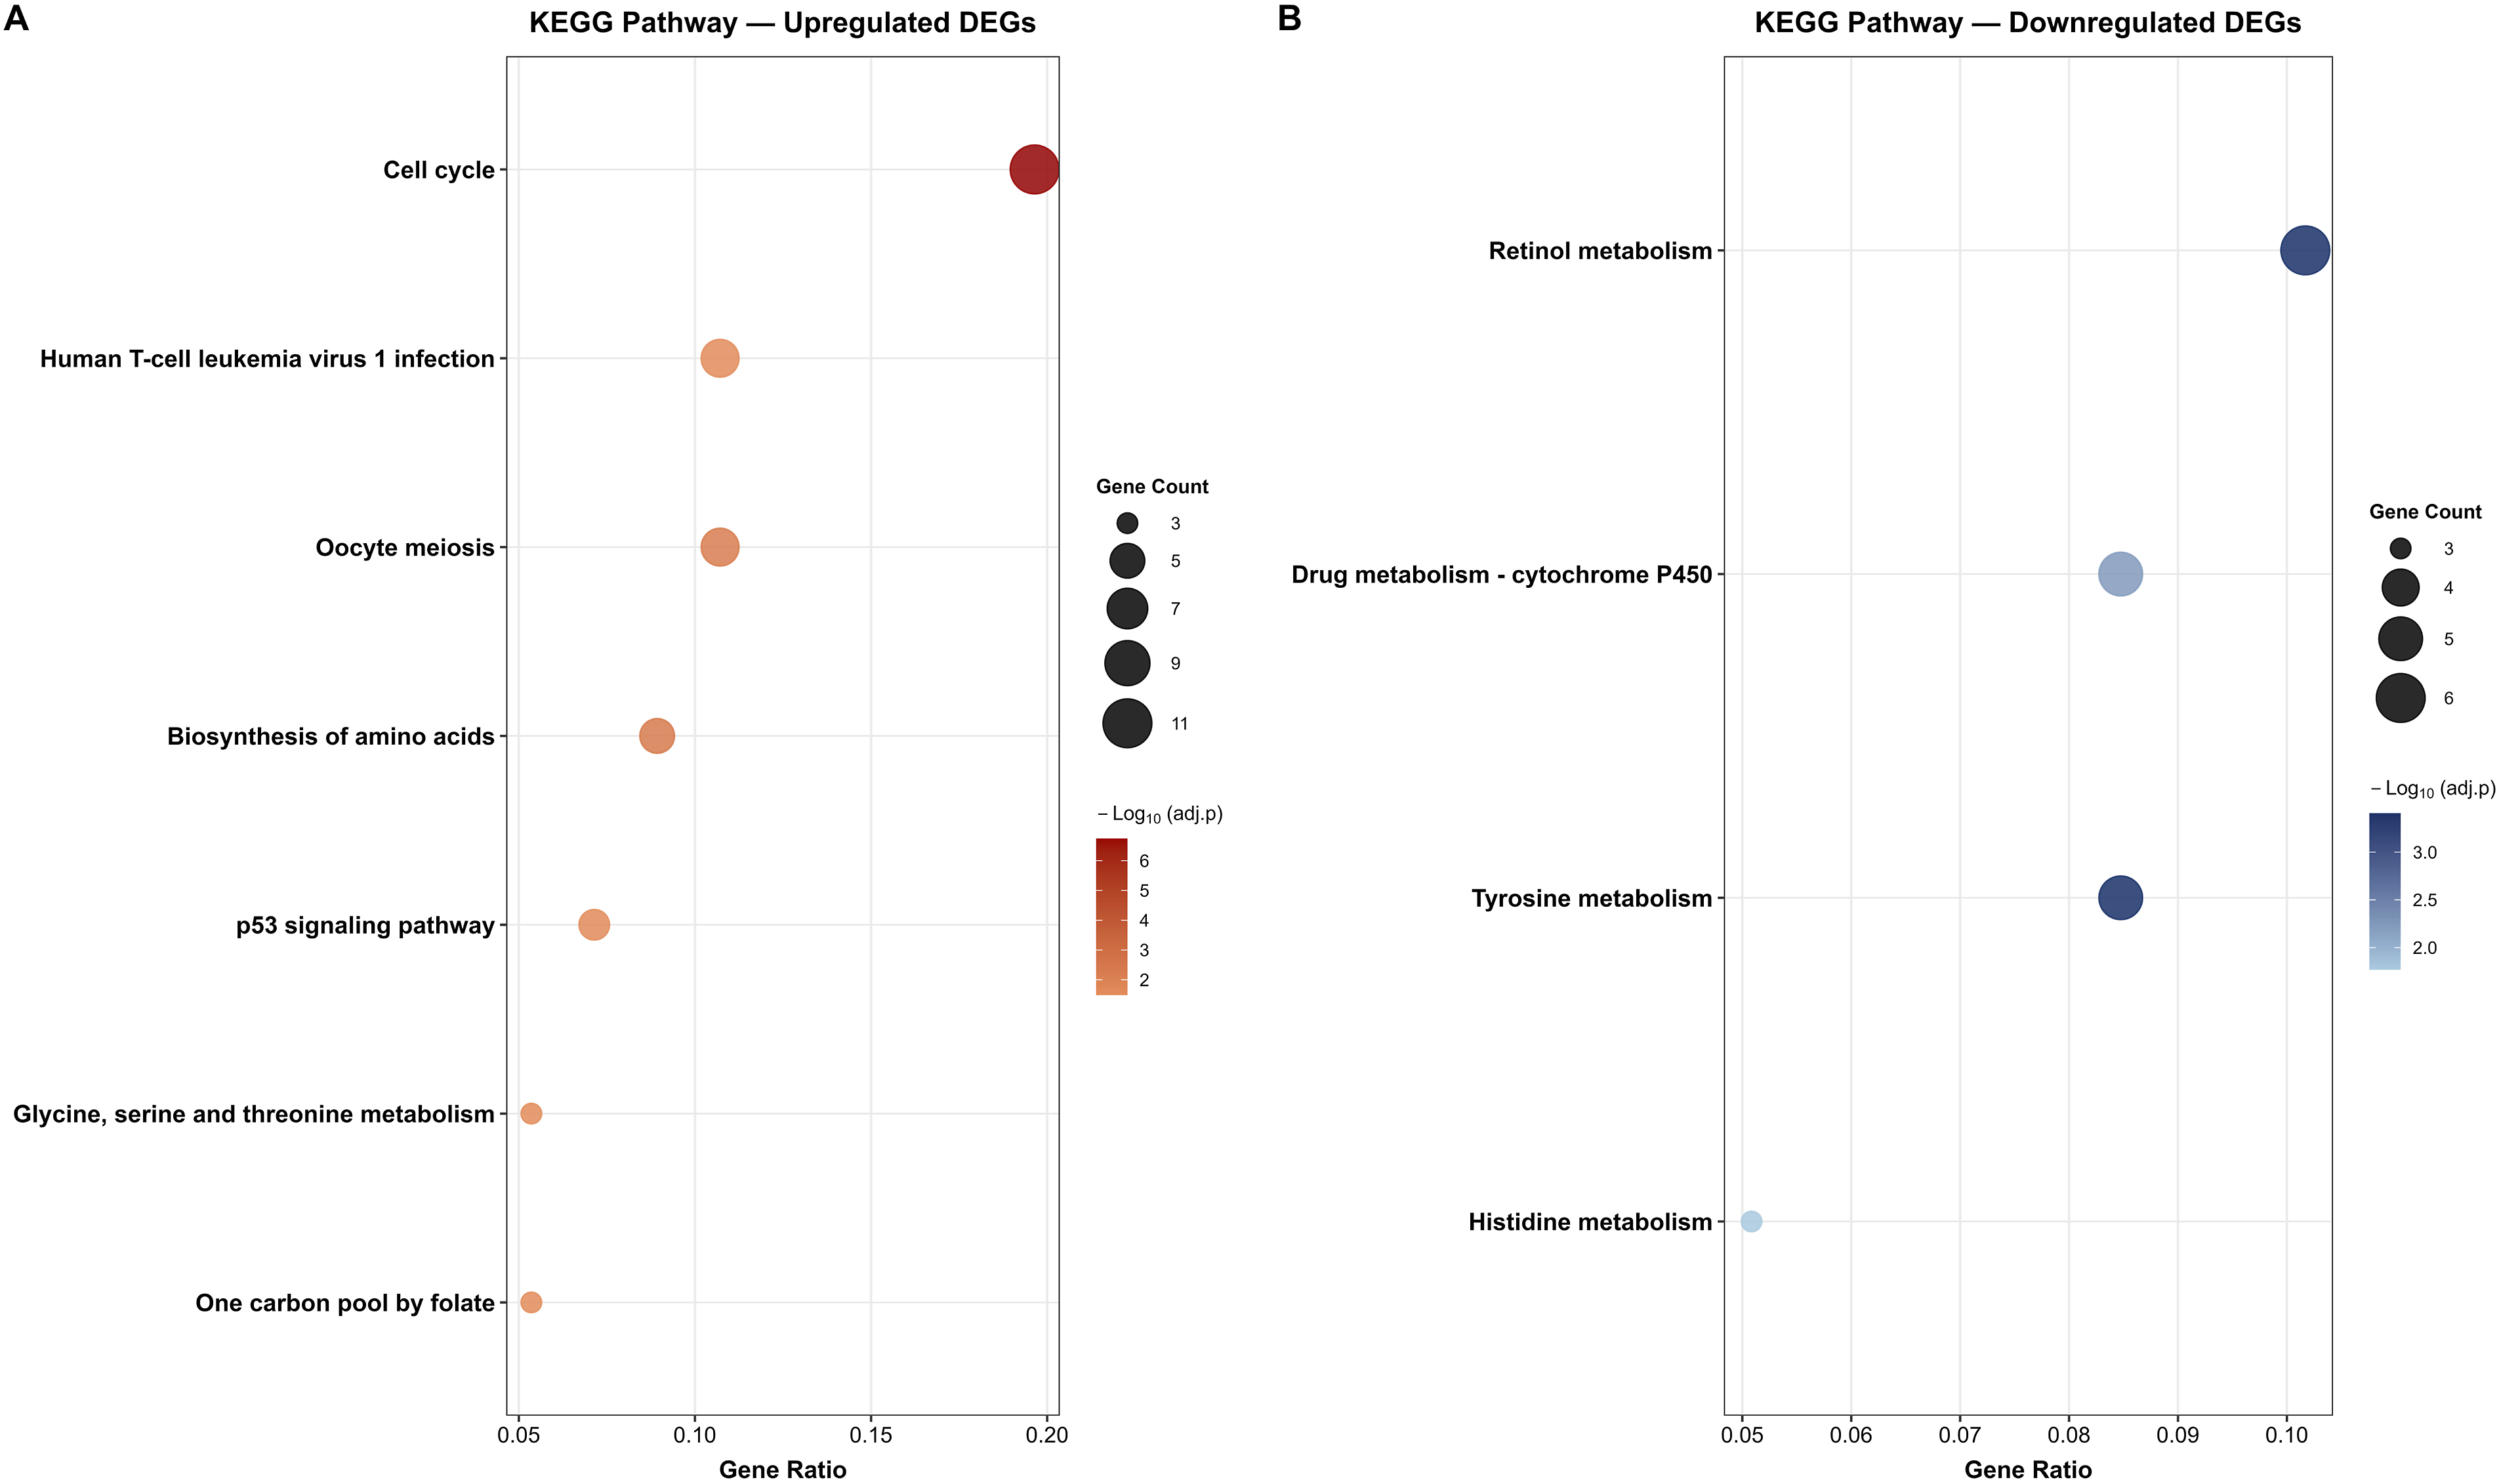
PPI network and hub gene identification
The STRING network of all the 96 upregulated and 113 downregulated DEGs is shown in Figure 6. For the upregulated DEG network, three centrality measures, MCC, Degree, and Closeness, were applied independently using the CytoHubba plugin, with the top 20 genes identified from each method (Figure 7). The MCC analysis identified genes predominantly associated with spindle assembly checkpoint regulation and mitotic progression, with CDK1, UBE2C, MAD2L1, CCNB1, TTK, CCNB2, KIF2C, BUB1B, TRIP13, MCM4, CENPF, and TOP2A among the highest ranked (Figure 7(a)). The Degree analysis identified CDK1 as the most highly connected node, followed by UBE2C, CCNB2, BUB1B, CCNB1, TOP2A, MCM4, TRIP13, KIF2C and TTK (Figure 7(b)). The Closeness analysis similarly ranked CDK1, BUB1B, UBE2C, TOP2A, CCNB1, and MCM4 among the top genes (Figure 7(c)). The intersection of all three methods yielded a final panel of 17 upregulated hub genes: BUB1B, CCNB1, CCNB2, CDK1, CENPF, KIF2C, KIF20A, MAD2L1, MCM4, NEK2, PBK, RACGAP1, TOP2A, TRIP13, TTK, UBE2C, and ZWINT (Figure 8(a)). These genes form a densely interconnected subnetwork, reflecting their functional cohesion within cell cycle regulatory pathways. PPI networks of overlapping DEGs in ovarian cancer were constructed using the STRING database. PPI networks constructed using the STRING database (confidence score ≥ 0.4) for (a) the 96 common upregulated DEGs and (b) the 113 common downregulated DEGs. Node colors represent interaction confidence, with edge colors indicating the type of interaction evidence. Hub gene identification from PPI networks of upregulated and downregulated DEGs using CytoHubba centrality measures. Hub genes identified from the upregulated (a–c) and downregulated (d–f) PPI networks using three centrality-based algorithms in cytoHubba: Maximal Clique Centrality MCC (a, d), degree (b, e), and closeness (c, f). The top 20-ranked genes from each method are highlighted. Node color intensity reflects the centrality score, with darker red indicating a higher ranking. Merged hub gene networks derived from the intersection of MCC, degree, and closeness centrality measures for upregulated and downregulated DEGs in OC. Merged PPI subnetworks showing hub genes identified consistently across all three CytoHubba centrality measures for (a) upregulated DEGs (17 hub genes, shown in green) and (b) downregulated DEGs (18 hub genes, shown in blue).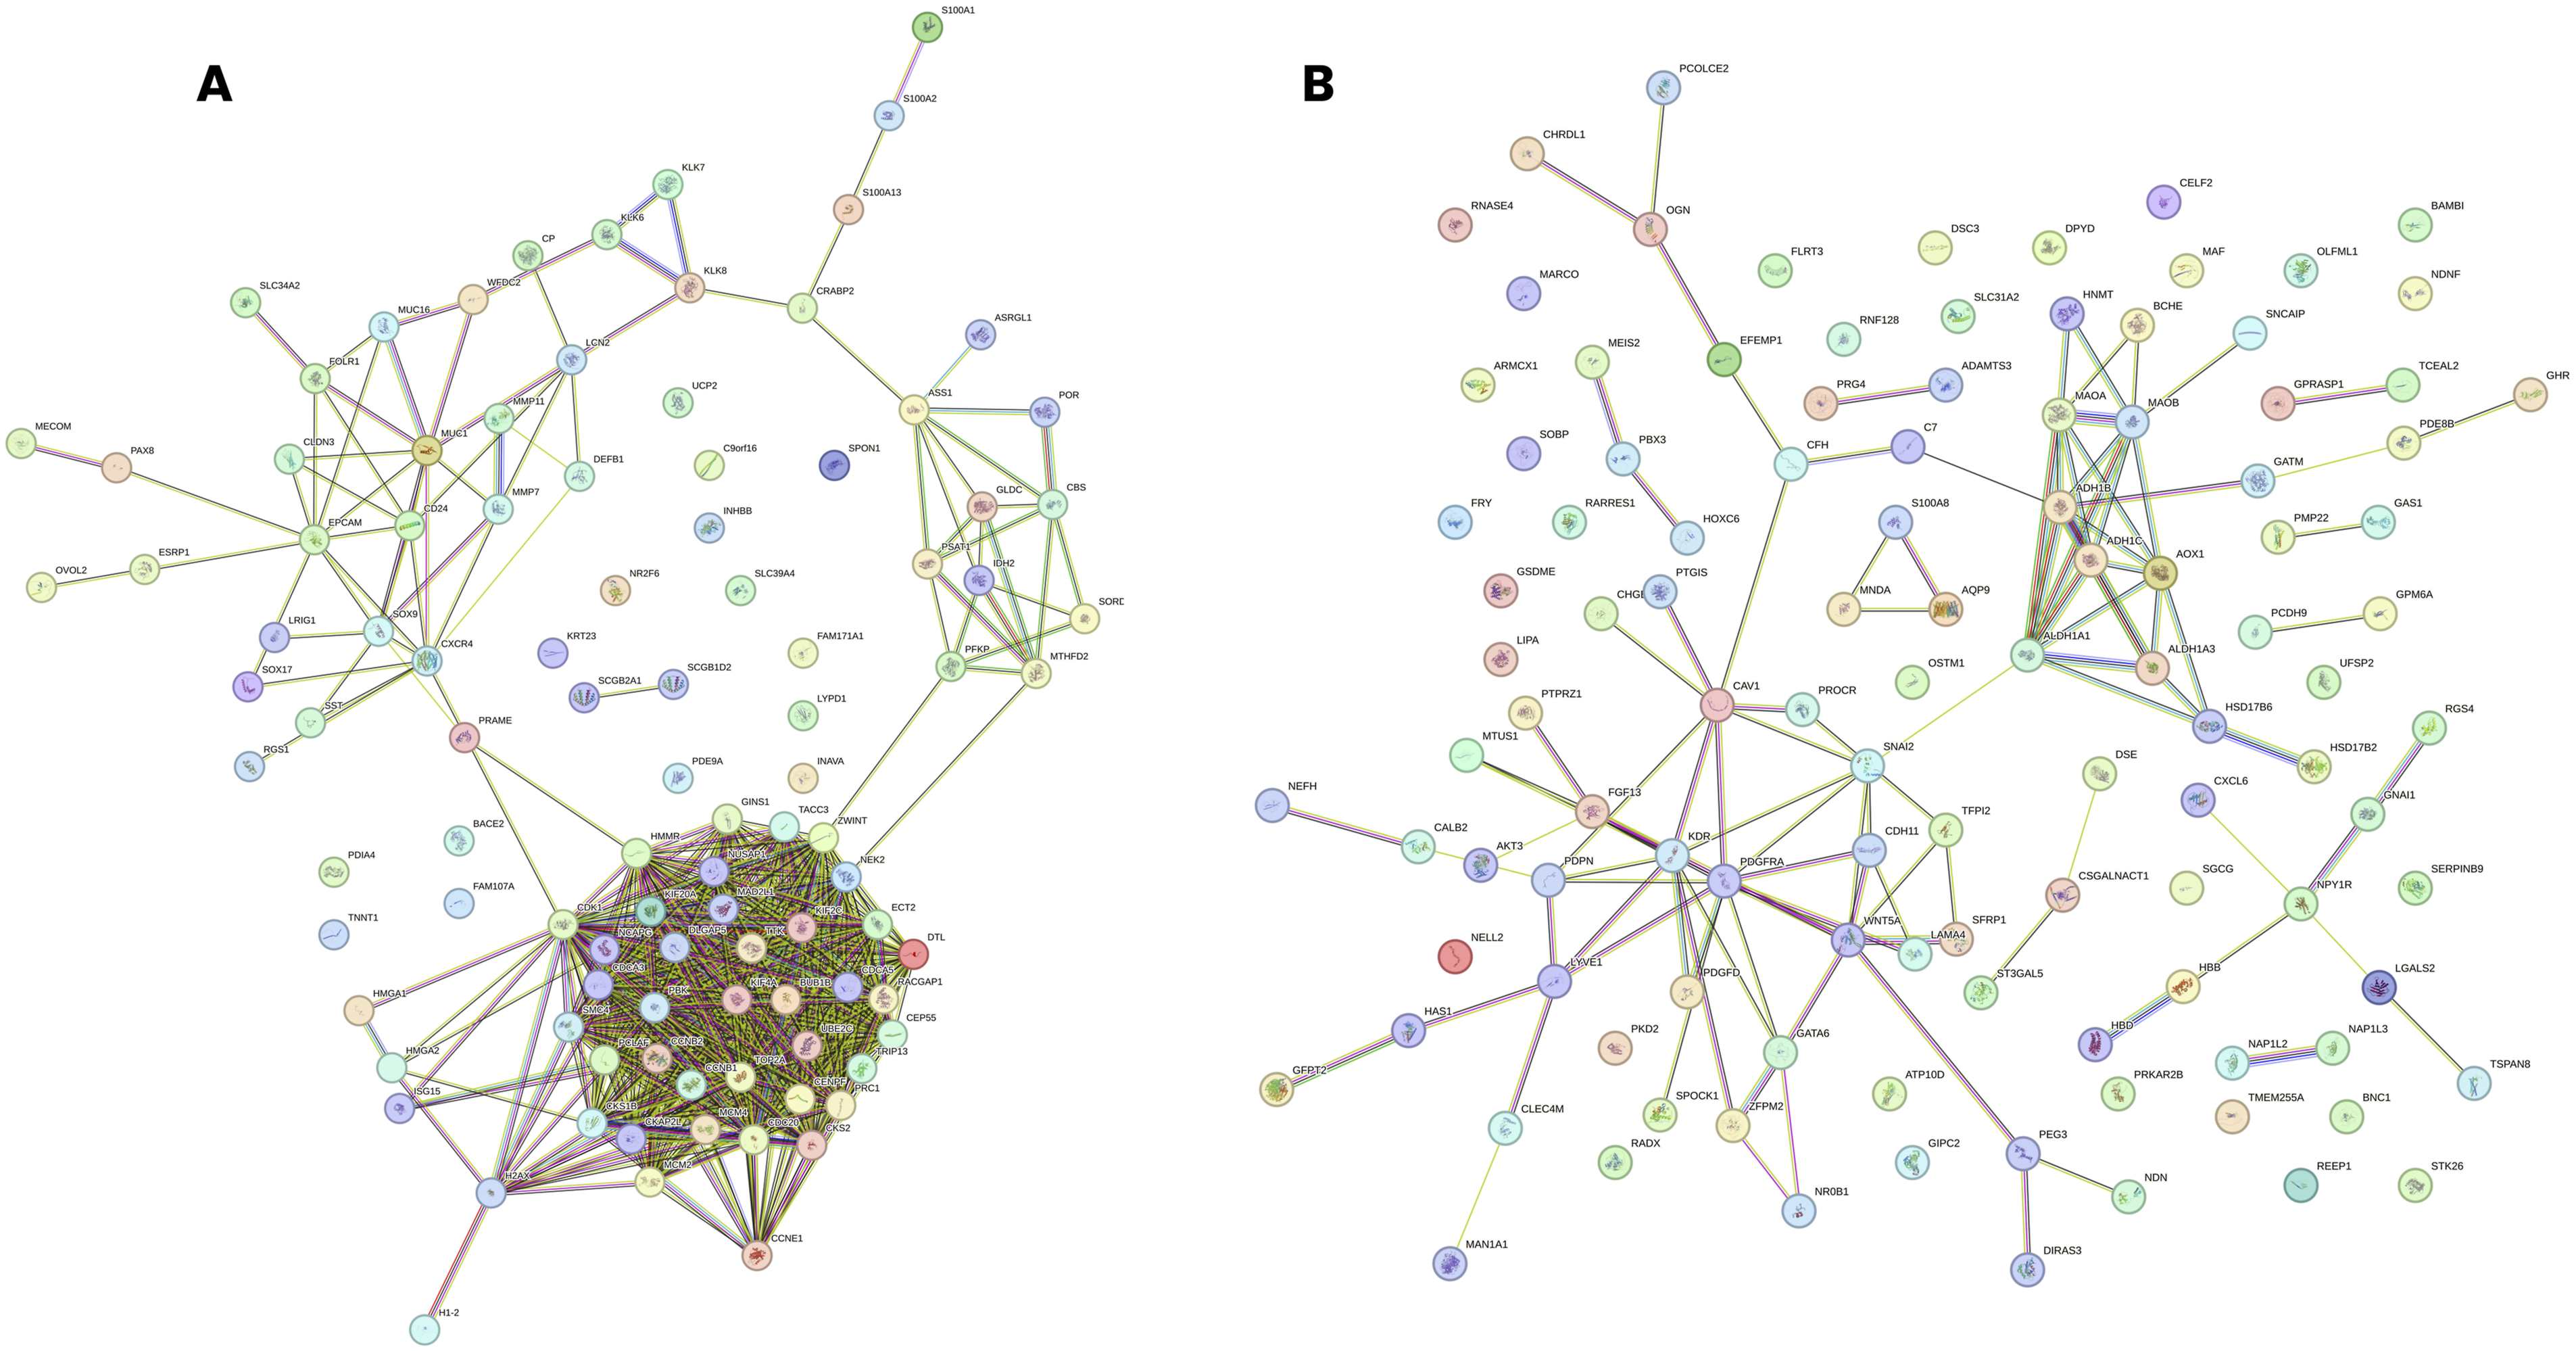
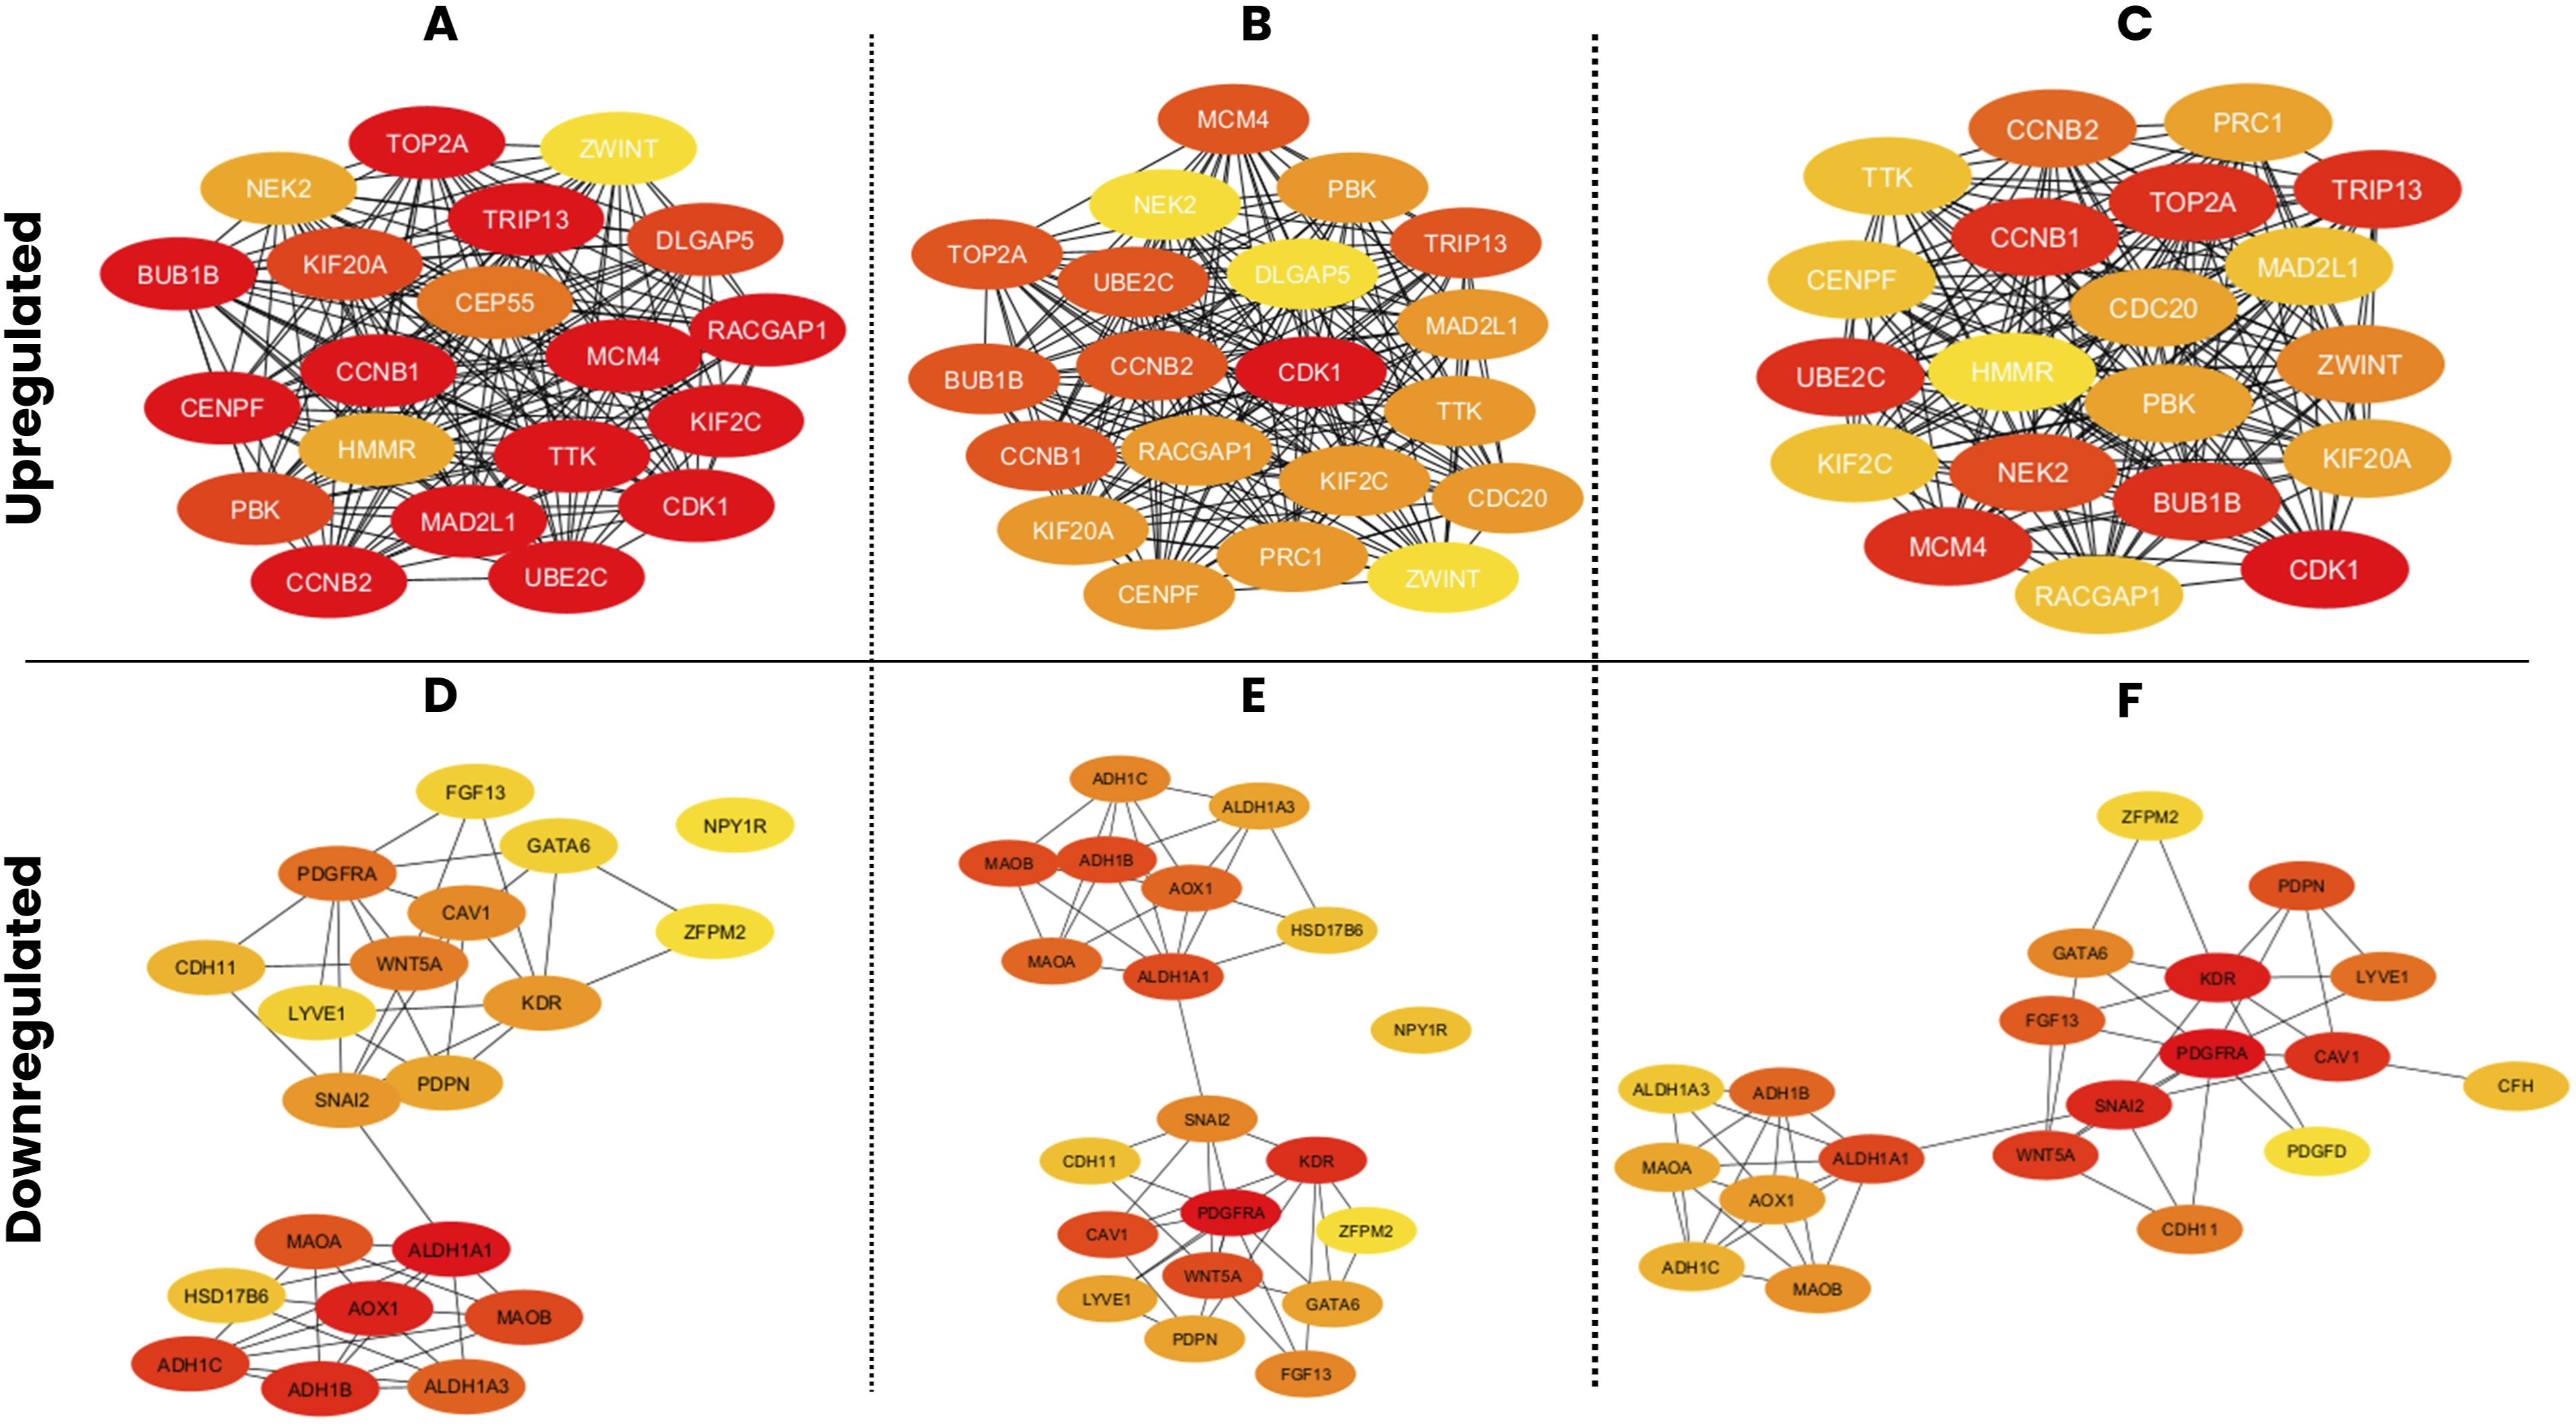
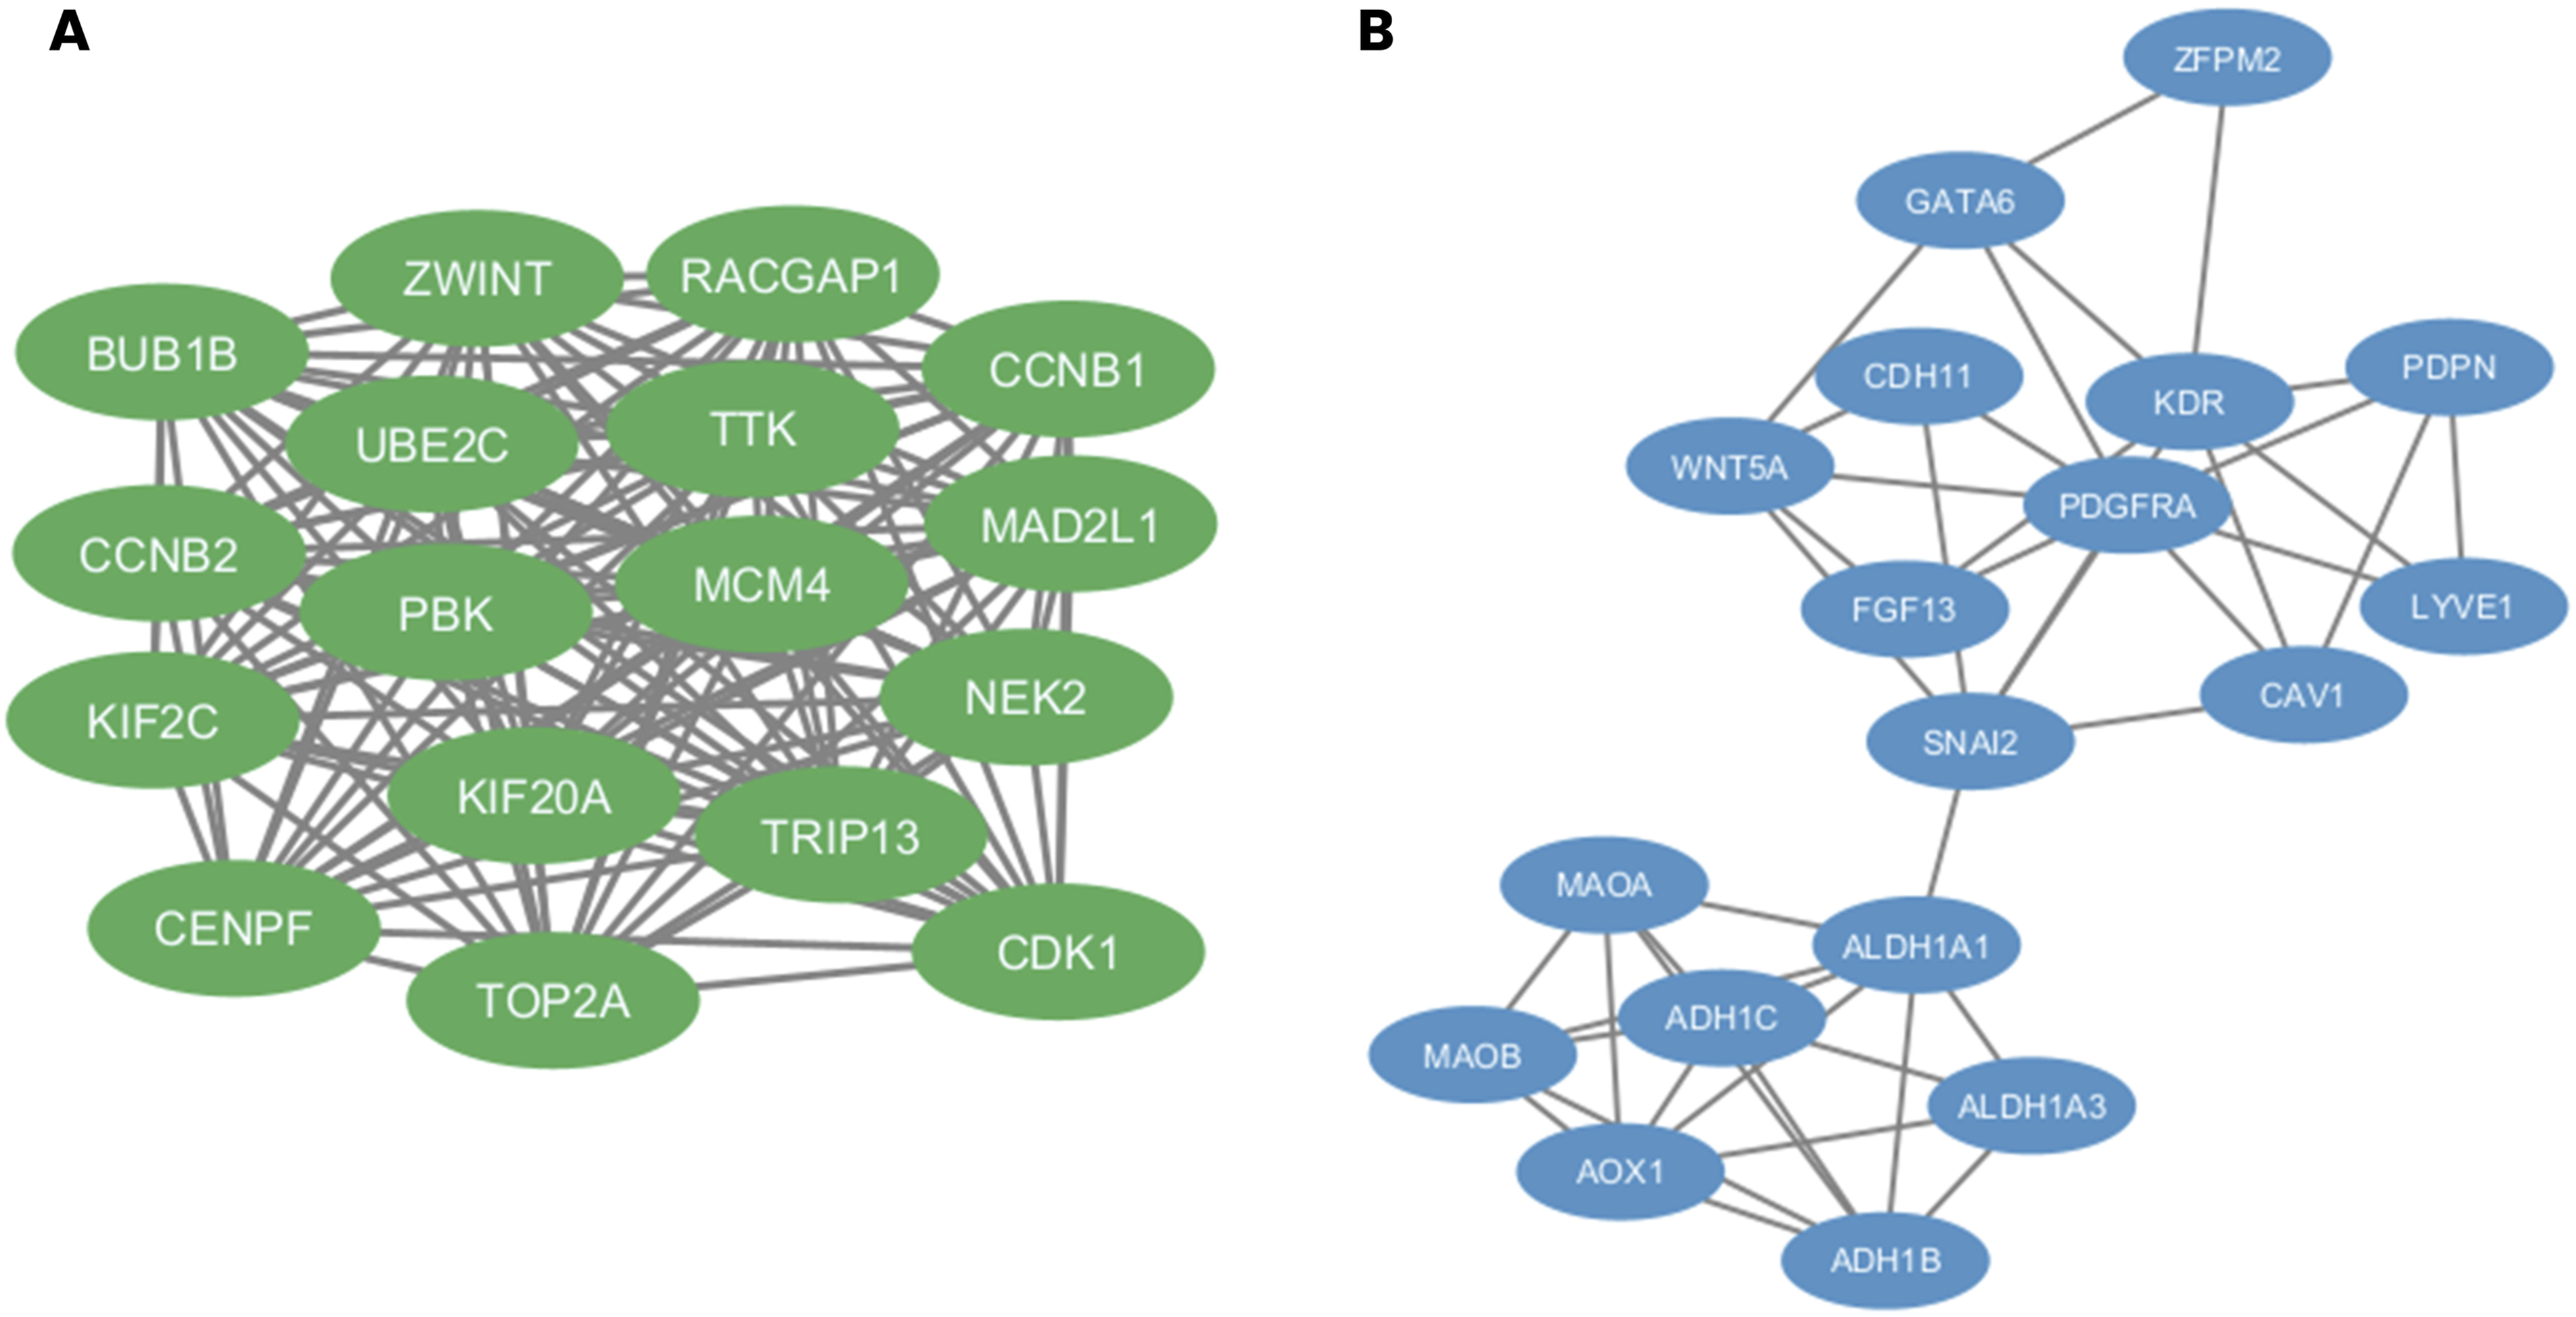
For the downregulated DEG network, the same three centrality measures were applied (Figure 7). The MCC analysis ranked ALDH1A1, AOX1, ADH1B, ALDH1A3, ADH1C, MAOB, and MAOA as the highest-scoring genes, followed by CAV1, KDR, PDGFRA, WNT5A, SNAI2, LYVE1, PDPN, CDH11, FGF13, GATA6, HSD17B6, NPY1R, and ZFPM2 (Figure 7(d)). The Degree analysis identified PDGFRA and KDR as the most highly connected nodes, with ALDH1A1, SNAI2, WNT5A, ADH1B, MAOA, AOX1, CAV1, and MAOB also among the top-ranked genes (Figure 7(e)). The Closeness analysis similarly identified SNAI2, PDGFRA, KDR, CAV1, WNT5A, ALDH1A1, ADH1B, FGF13, GATA6 and LYVE1 as the most centrally positioned genes (Figure 7(f)). The intersection of all three methods yielded a final panel of 18 downregulated hub genes: ADH1B, ADH1C, ALDH1A1, ALDH1A3, AOX1, CAV1, CDH11, FGF13, GATA6, KDR, LYVE1, MAOA, MAOB, PDGFRA, PDPN, SNAI2, WNT5A, and ZFPM2 (Figure 8(b)). The downregulated hub gene network comprised two distinct functional clusters: a metabolic enzyme cluster centered on aldehyde dehydrogenases and monoamine oxidases, and a signalling and ECM cluster centered on growth factor receptors, EMT regulators, and lymphangiogenic markers.
Gene expression validation
All eight selected upregulated hub genes, BUB1B, KIF2C, MAD2L1, MCM4, NEK2, TOP2A, TRIP13, and UBE2C, demonstrated significantly higher expression in OC samples compared to normal tissue (p < 0.01) (Figure 9). Among these, UBE2C showed the most pronounced upregulation with the greatest expression difference between tumor and normal samples, followed by MCM4, NEK2, and TOP2A. The consistent upregulation of these cell cycle regulatory genes across both the GEO microarray datasets and the TCGA RNA-seq cohort strongly supports their biological relevance in OC pathogenesis. Expression profiles of selected upregulated hub genes in ovarian cancer and normal tissue samples. Box plots illustrating the expression levels of eight selected upregulated hub genes in ovarian serous cystadenocarcinoma tumor samples (red, num(T) = 426) compared to normal tissue samples (grey, num(N) = 88) derived from TCGA and the Genotype-Tissue Expression (GTEx) databases. Expression values are presented on a log2 (TPM + 1) scale. The red asterisk (*) denotes statistically significant differential expression between tumor and normal samples (p < 0.01, one-way ANOVA).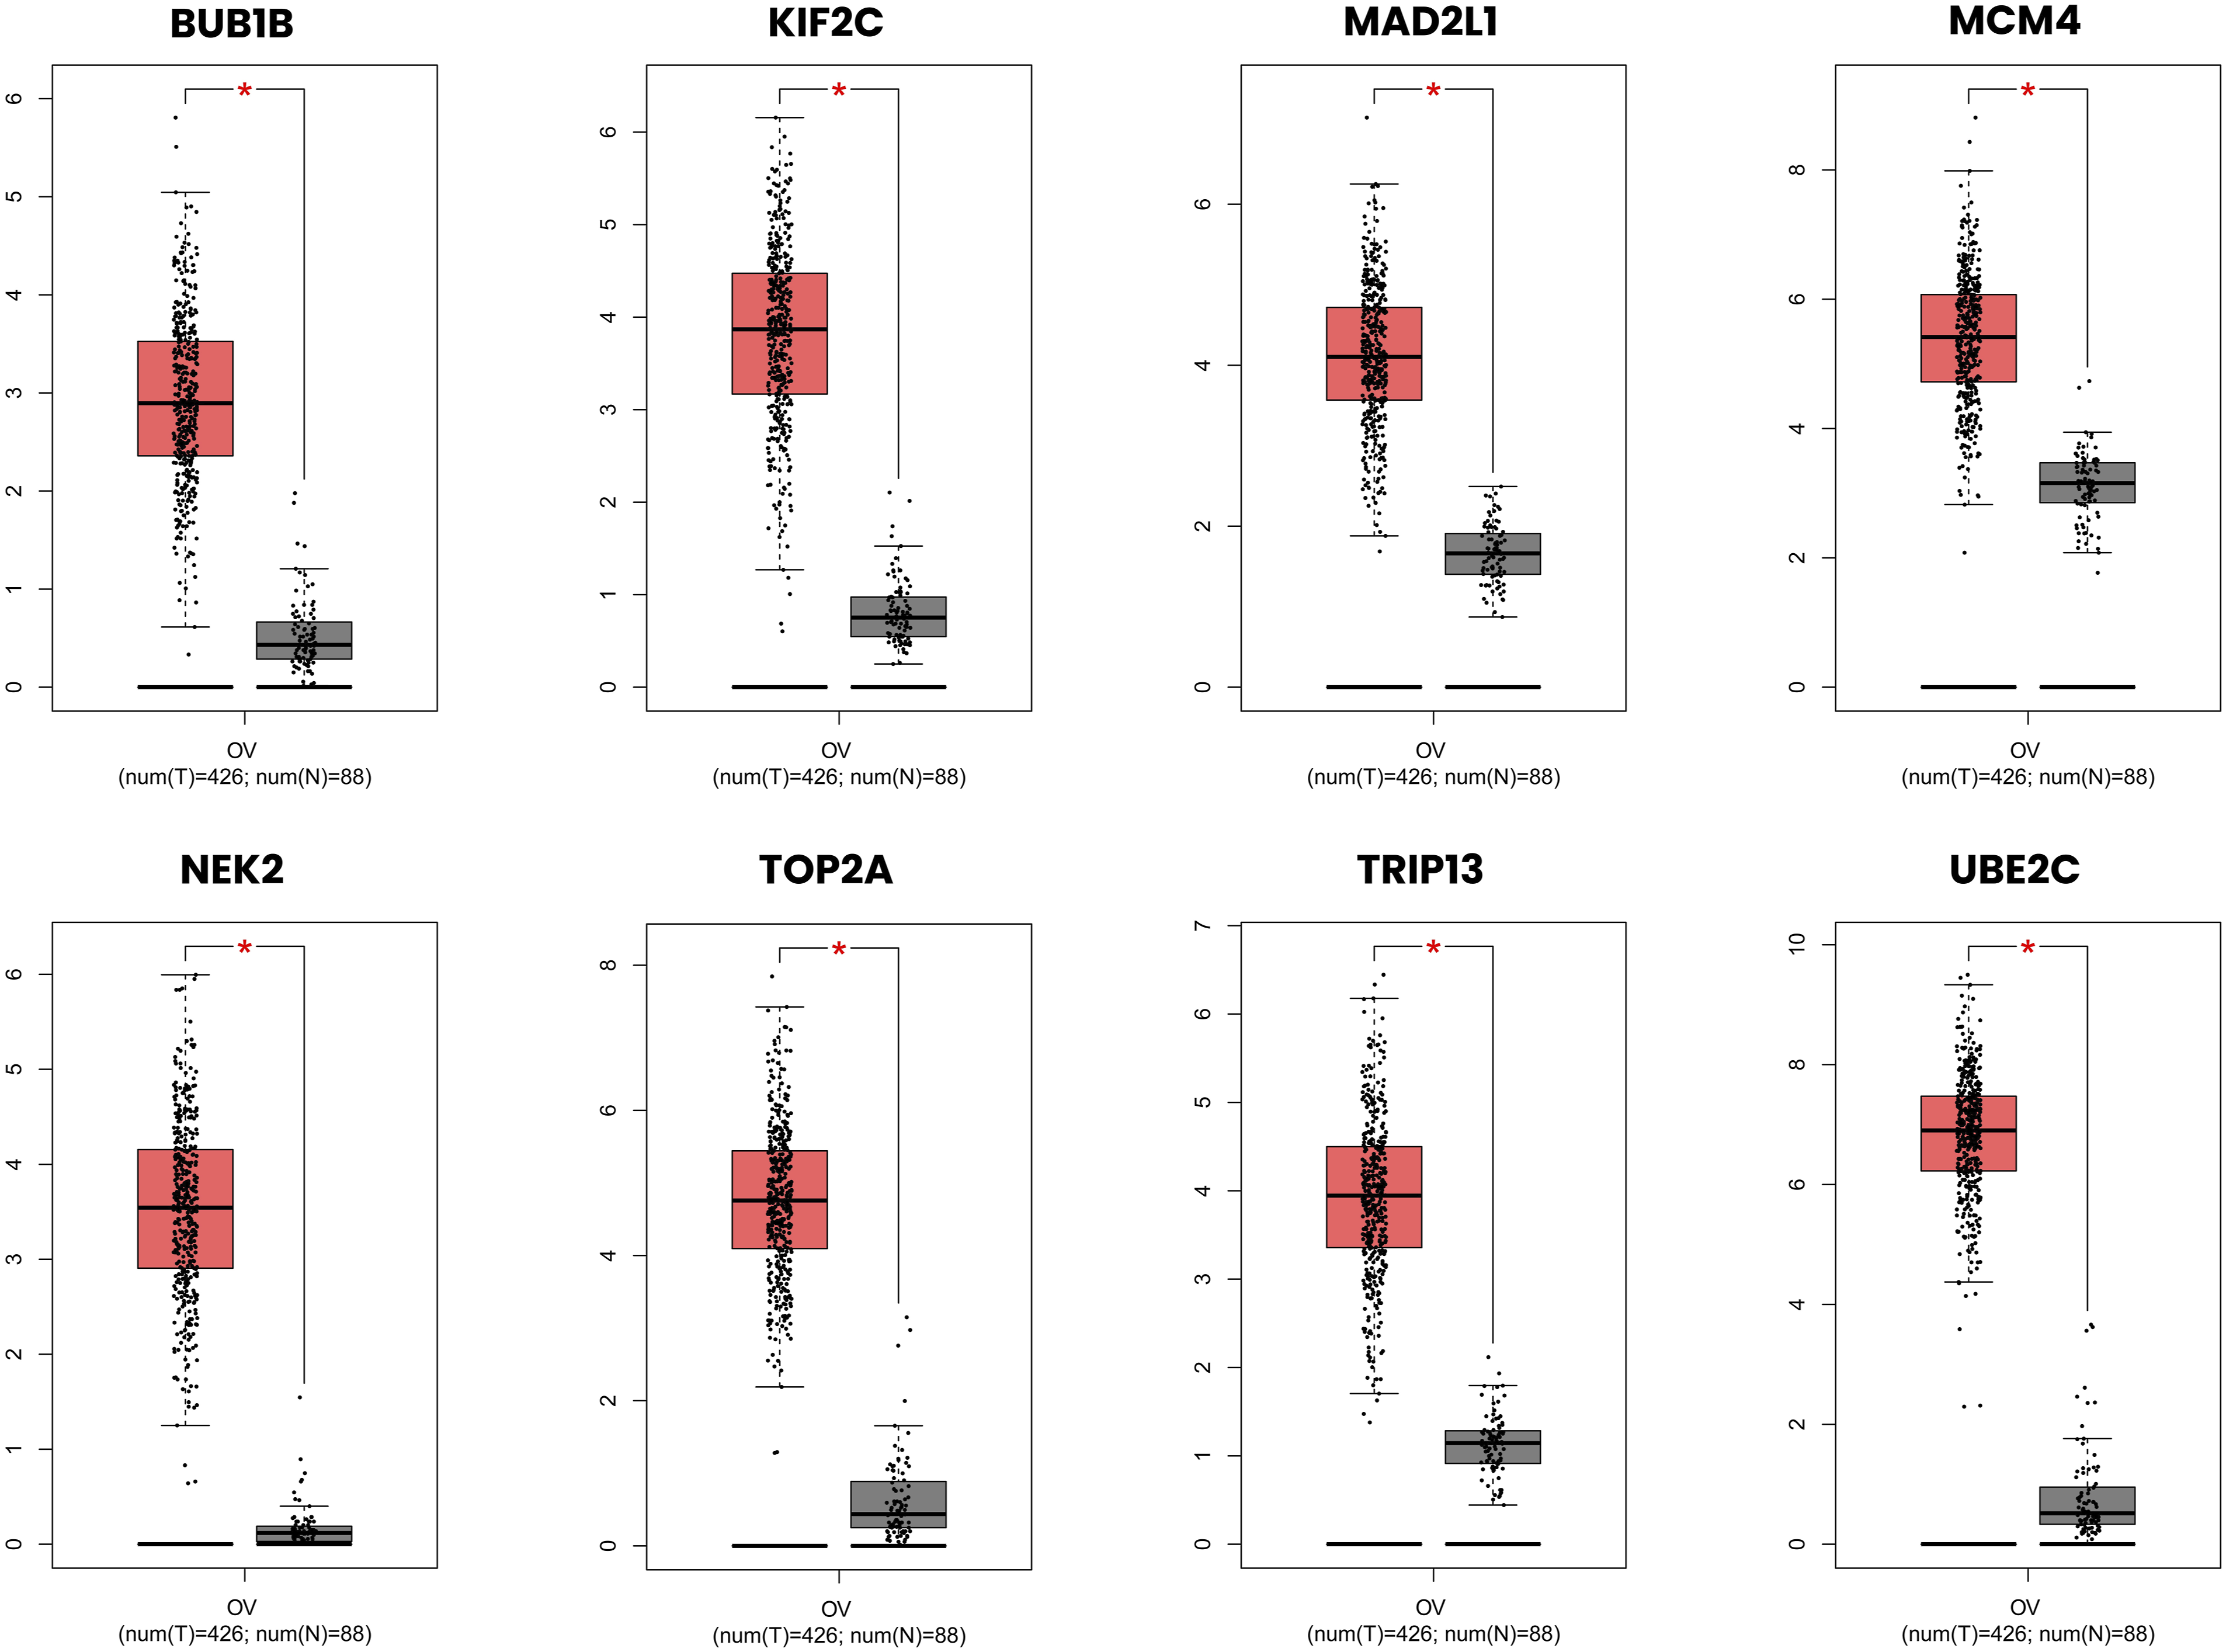
Among the eight selected downregulated hub genes, five, ADH1B, ALDH1A1, GATA6, LYVE1, and MAOA, showed significantly lower expression in OC samples compared to normal tissue (p < 0.01). ADH1B and MAOA demonstrated the most pronounced downregulation with near-complete loss of expression in tumor samples relative to normal tissue. Although KDR , FGF13, and WNT5A showed a consistent trend of lower expression in tumor samples, these differences did not reach statistical significance in the GEPIA analysis (p ≥ 0.01) (Figure 10). Expression profiles of selected downregulated hub genes in ovarian cancer and normal tissue samples. Box plots illustrating the expression levels of eight selected downregulated hub genes in ovarian serous cystadenocarcinoma tumor samples (red, num(T) = 426) compared to normal tissue samples (grey, num(N) = 88) derived from TCGA and the Genotype-Tissue Expression (GTEx) databases. Expression values are presented on a log2 (TPM + 1) scale. The red asterisk (*) denotes statistically significant differential expression between tumor and normal samples (p < 0.01, one-way ANOVA).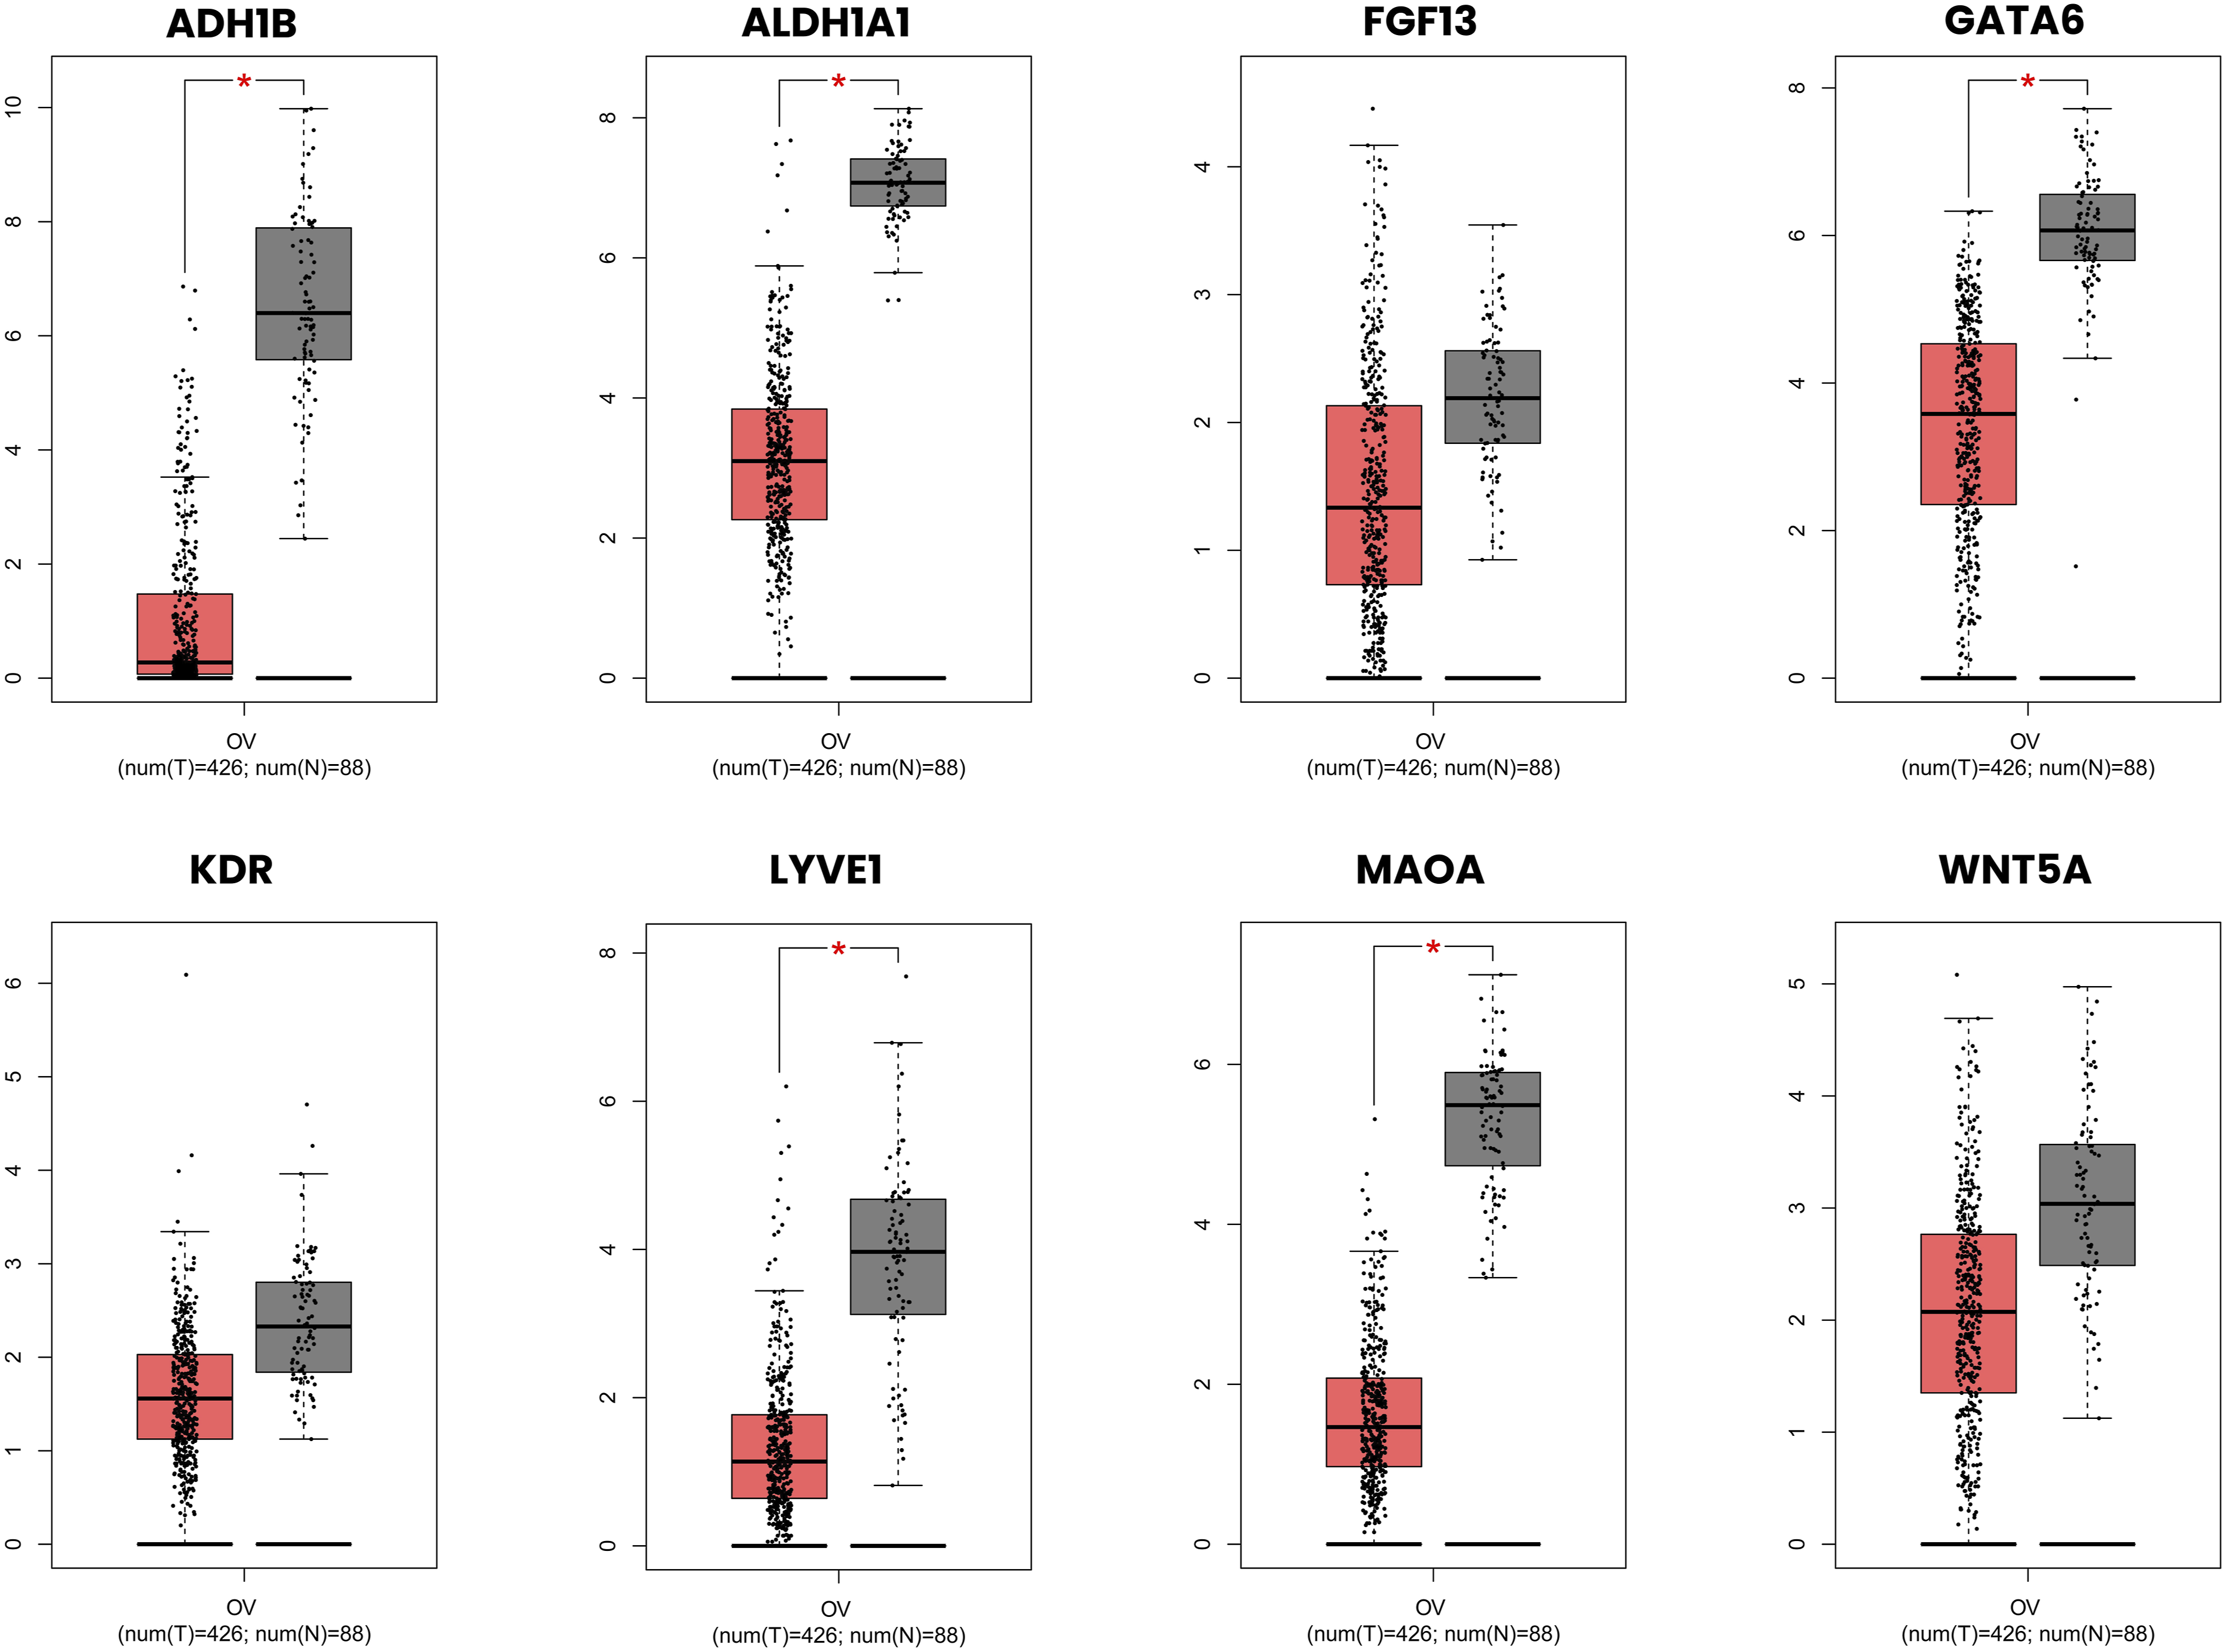
OS and DFS analysis
Kaplan-Meier survival analysis was performed to assess the prognostic significance of the 35 hub genes for both survival outcomes (OS and DFS). Among the 17 upregulated hub genes, only TRIP13 demonstrated a statistically significant association with OS (HR = 0.72, p = 0.0079), with high TRIP13 expression correlating with improved OS in OC patients (Figure 11(a)). None of the upregulated hub genes showed significant associations with DFS. Among the 18 downregulated hub genes, two genes, FGF13 and LYVE1, were significantly associated with OS. High FGF13 expression was associated with favourable OS (HR = 0.68, p = 0.0022), while high LYVE1 expression was associated with poor OS (HR = 1.4, p = 0.0076) (Figure 11(b)). For DFS, three downregulated hub genes demonstrated significant prognostic associations (Figure 11(c)). High ALDH1A1 expression was associated with improved DFS (HR = 0.78, p = 0.044), while high GATA6 expression was associated with shorter DFS intervals (HR = 1.3, p = 0.035). Additionally, high WNT5A expression was associated with improved DFS (HR = 0.77, p = 0.04). Kaplan-Meier survival analysis of significant prognostic hub genes in OC. (a) OS analysis of the upregulated hub gene TRIP13. (b) OS analysis of the downregulated hub genes FGF13 and LYVE1. (c) DFS analysis of the downregulated hub genes ALDH1A1, GATA6, and WNT5A. Dotted lines represent 95% confidence intervals.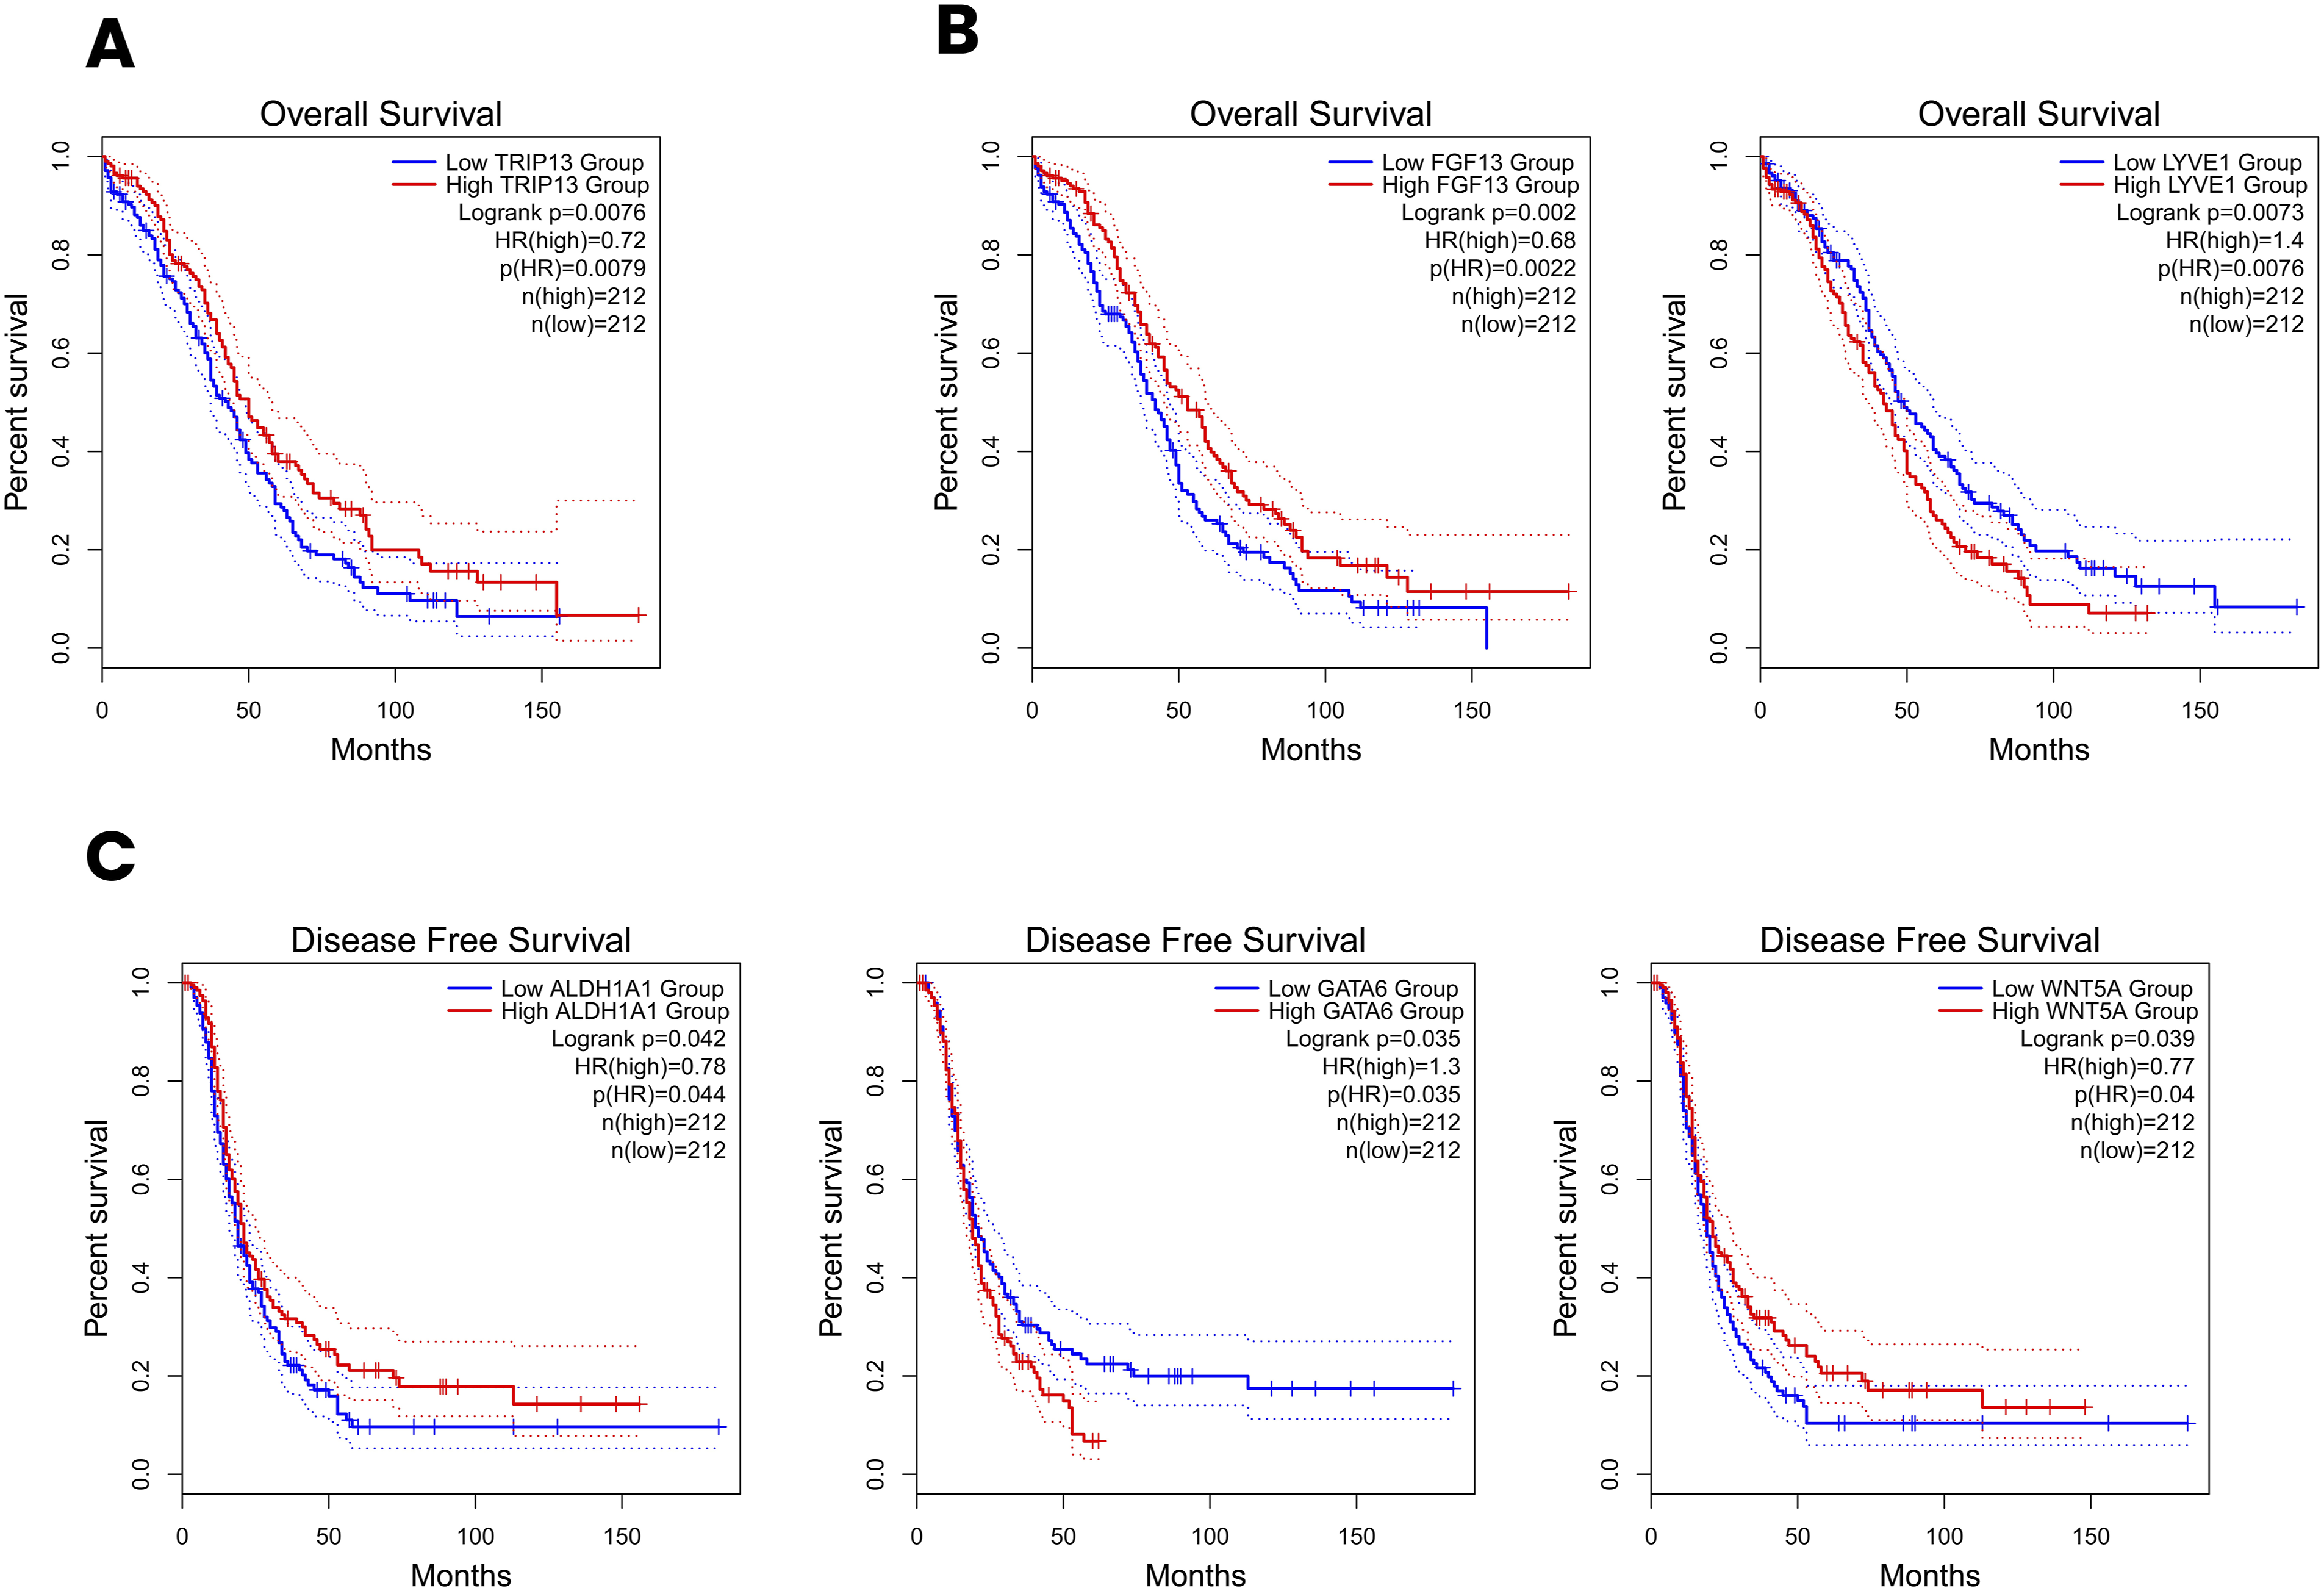
Association of hub genes with pathological stage, race, age, tumor grade, and TP53 mutation status
Pathological stage analysis
Pathological stage analysis using GEPIA revealed significant stage-dependent expression differences for 9 of the 17 upregulated hub genes and 1 of the 18 downregulated hub genes (p < 0.05) (Figure 12). Among the upregulated hub genes, BUB1B (F = 4.7, p = 0.00954), CENPF (F = 3.8, p = 0.0232), MAD2L1 (F = 5.48, p = 0.00446), MCM4 (F = 6.95, p = 0.00108), NEK2 (F = 5.36, p = 0.00502), RACGAP1 (F = 3.59, p = 0.0284), TRIP13 (F = 3.68, p = 0.026), TTK (F = 3.63, p = 0.0274) and ZWINT (F = 4.49, p = 0.0117) showed significant associations with pathological stage across Stage II, III and IV. Notably, MCM4 demonstrated the strongest stage-dependent expression among all upregulated hub genes (F = 6.95, p = 0.00108) (Figure 12(b)). Among the downregulated hub genes, ADH1B was the only gene significantly associated with pathological stage (F = 4.62, p = 0.0104), showing progressive expression changes across disease stages (Figure 12(a)). It is worth noting that Stage I samples were not represented in the GEPIA stage analysis for the TCGA OC dataset, likely reflecting the advanced stage at which most OC patients are diagnosed, which is a well-recognised limitation of population-based OC datasets. Pathological stage-dependent expression of hub genes in ovarian cancer. Violin plots illustrating the expression levels of hub genes across pathological stages (Stage II, Stage III, and Stage IV) in ovarian cancer using GEPIA. (a) Downregulated hub gene ADH1B showing significant stage-dependent expression differences. (b) Upregulated hub genes demonstrating significant stage-associated expression differences. Red violin plots represent upregulated hub genes, and blue violin plots represent the downregulated hub genes. The white dot within each violin plot indicates the median expression value, and the black bar represents the interquartile range.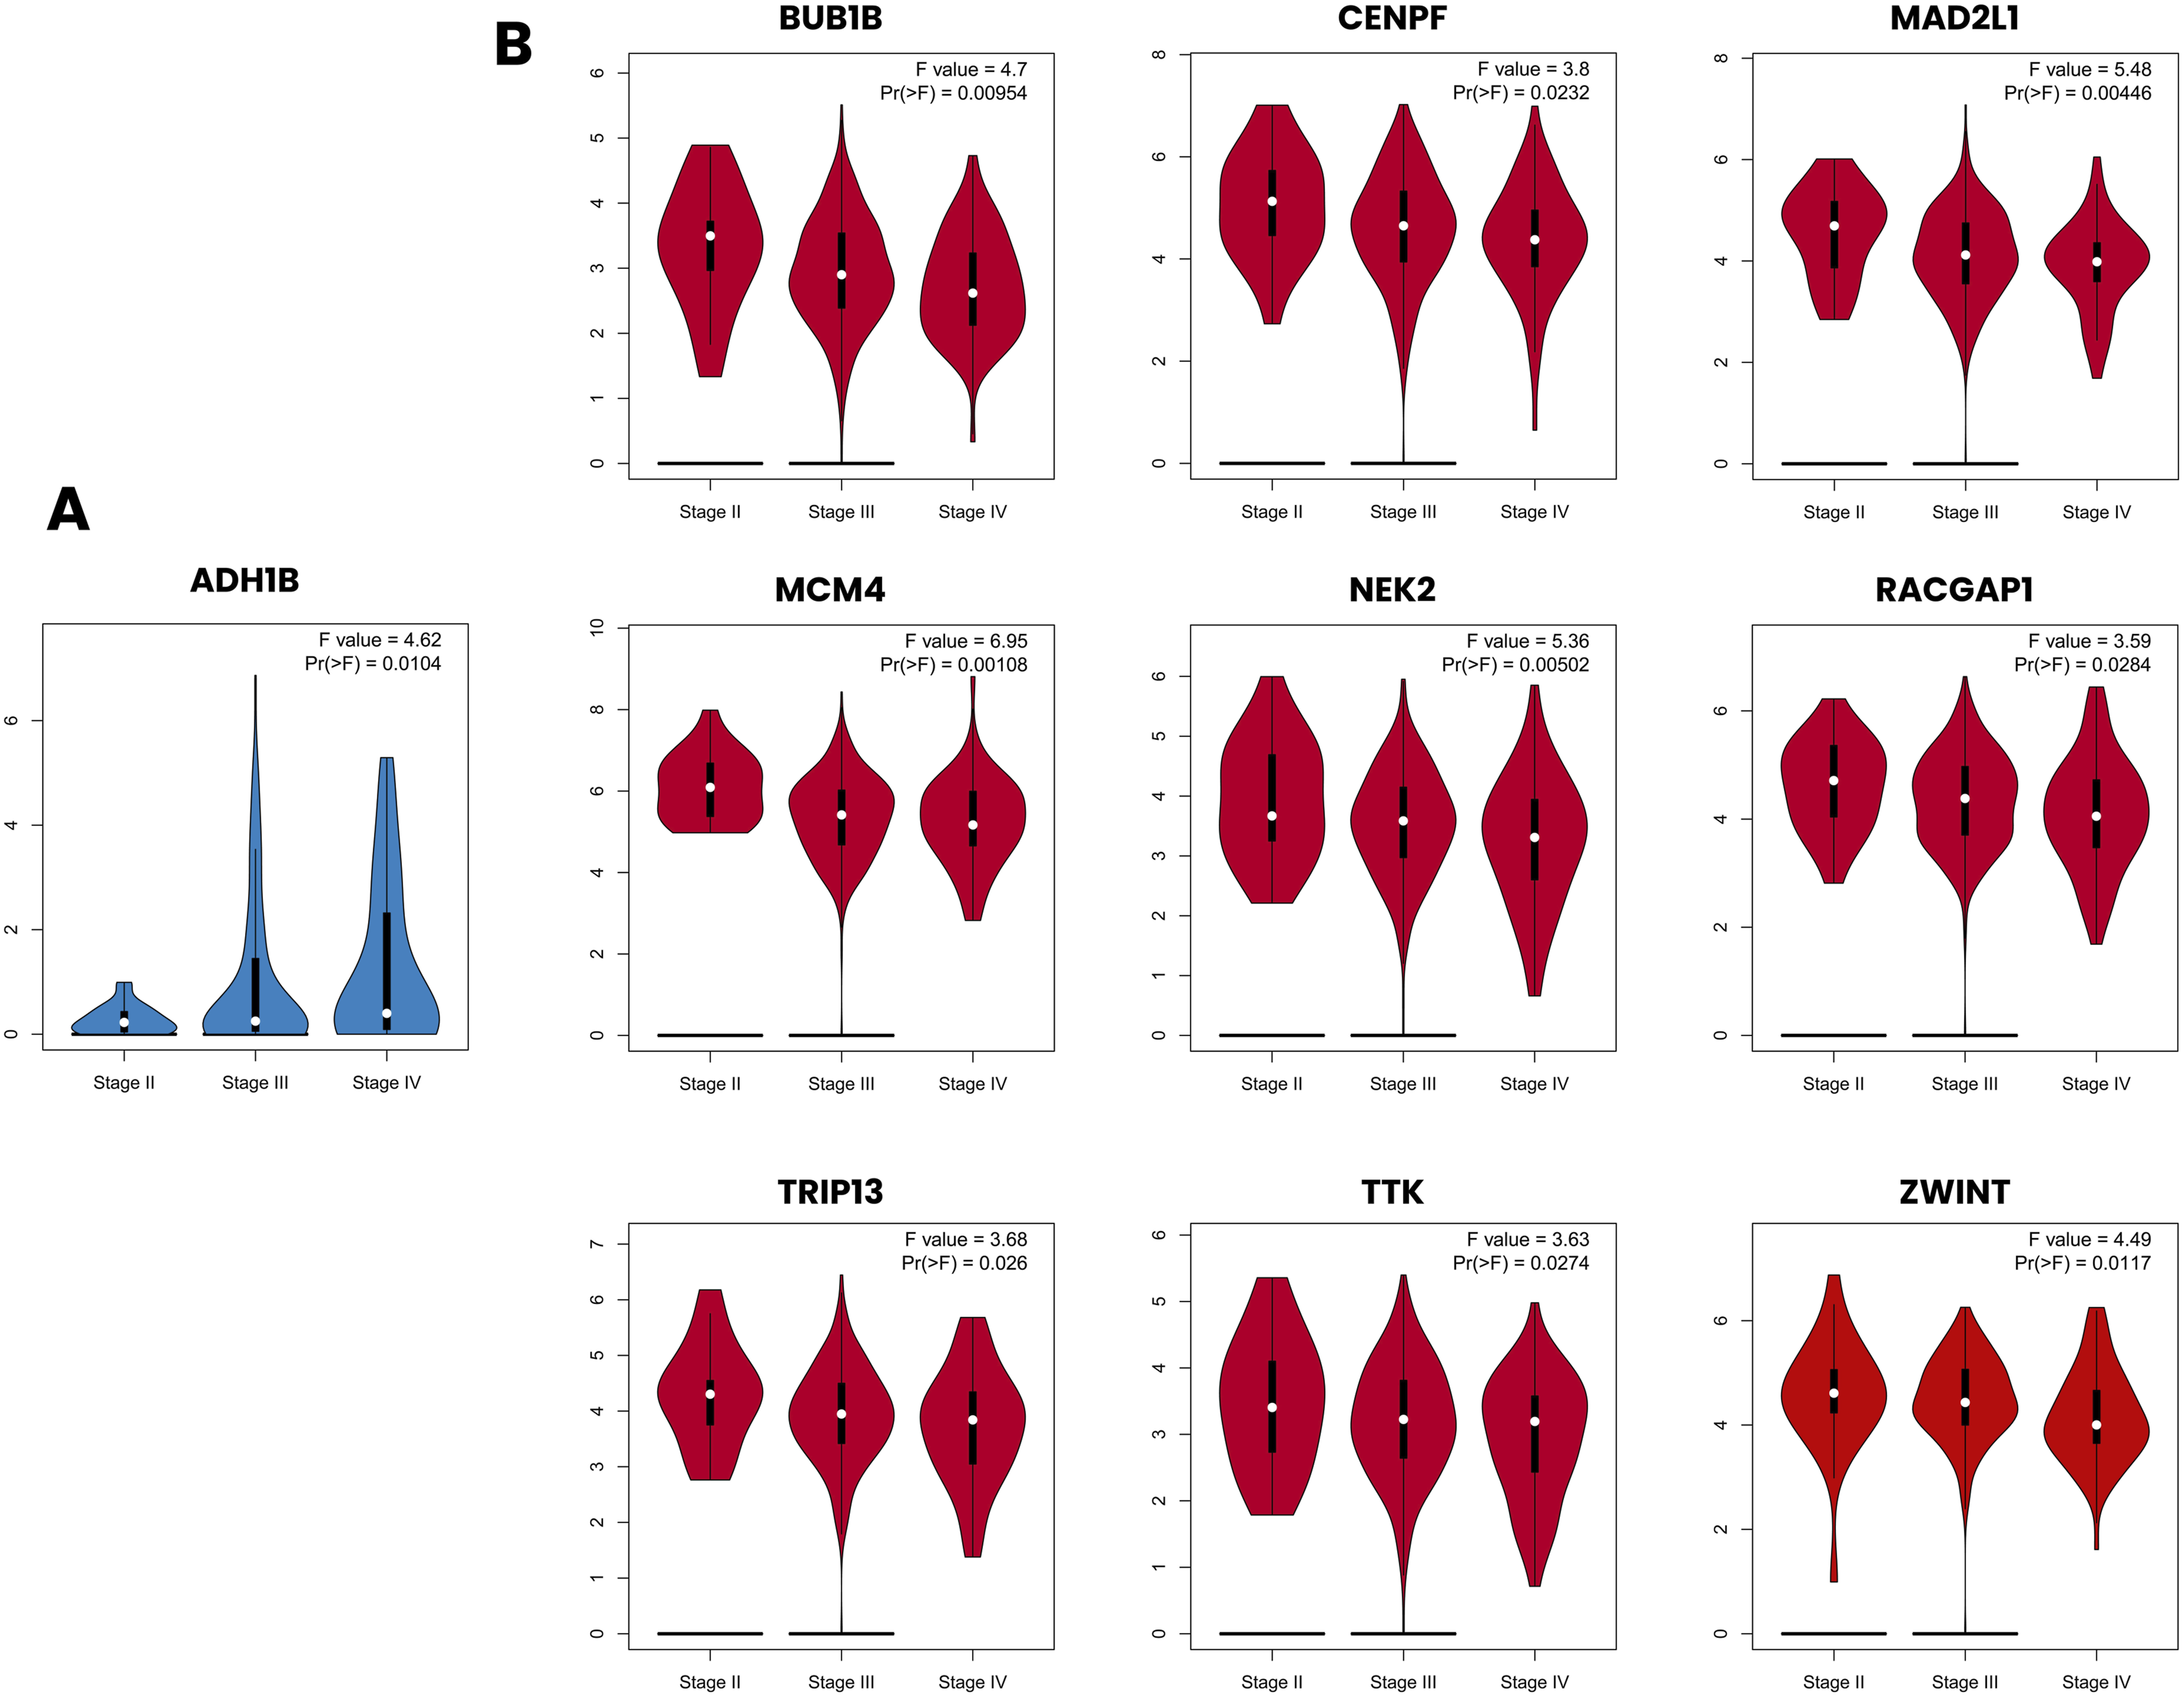
Age, race, tumor grade, and TP53 mutation status associations
Clinicopathological association analysis using UALCAN revealed distinct patterns of hub gene expression across tumor grade and TP53 mutation status (Figure 13). With respect to tumor grade, four upregulated hub genes, BUB1B (p = 0.010), CCNB2 (p = 0.010), KIF20A (p = 0.010), and RACGAP1 (p = 0.030), demonstrated significantly different expression between Grade 2 and Grade 3 tumors (Figure 13(a)). None of the downregulated hub genes showed significant grade-dependent expression differences (Figure 13(b)). Regarding TP53 mutation status, a notable pattern of association was observed among the upregulated hub genes, with 11 of the 17 genes exhibiting significantly different expression between TP53-mutant and non-mutant OC samples. The most strongly associated genes were CCNB1, KIF2C, MAD2L1, MCM4, and TOP2A, all of which demonstrated highly significant associations (p < 0.0001). Additionally, CDK1 (p = 0.030), PBK (p = 0.020), TRIP13 (p = 0.020), TTK (p = 0.020), UBE2C (p = 0.040), and ZWINT (p = 0.040) also showed significant differences in TP53-associated expression (Figure 13(a)). Among the downregulated hub genes, MAOA was the only gene significantly associated with TP53 mutation status (p < 0.0001) (Figure 13(b)). Clinicopathological associations of hub genes with tumor grade, TP53 mutation status, race, and age in ovarian cancer. Significance heatmaps illustrating the associations between hub gene expression and clinicopathological variables assessed using UALCAN with TCGA ovarian serous cystadenocarcinoma data. (a) Upregulated hub genes showing associations with tumor grade and TP53 mutation status (left panel) and demographic variables, including race and age (right panel). (b) Downregulated hub genes showing associations with tumor grade and TP53 mutation status (left panel) and demographic variables, including race and age (right panel). Cell color intensity reflects the magnitude of statistical significance, with deeper red indicating stronger associations in upregulated hub genes and deeper blue indicating stronger associations in downregulated hub genes. Non-significant p-values (p ≥ 0.05) are displayed in pale background cells. Asterisks denote the level of statistical significance: * p < 0.05, ** p < 0.01, *** p < 0.001, **** p < 0.0001.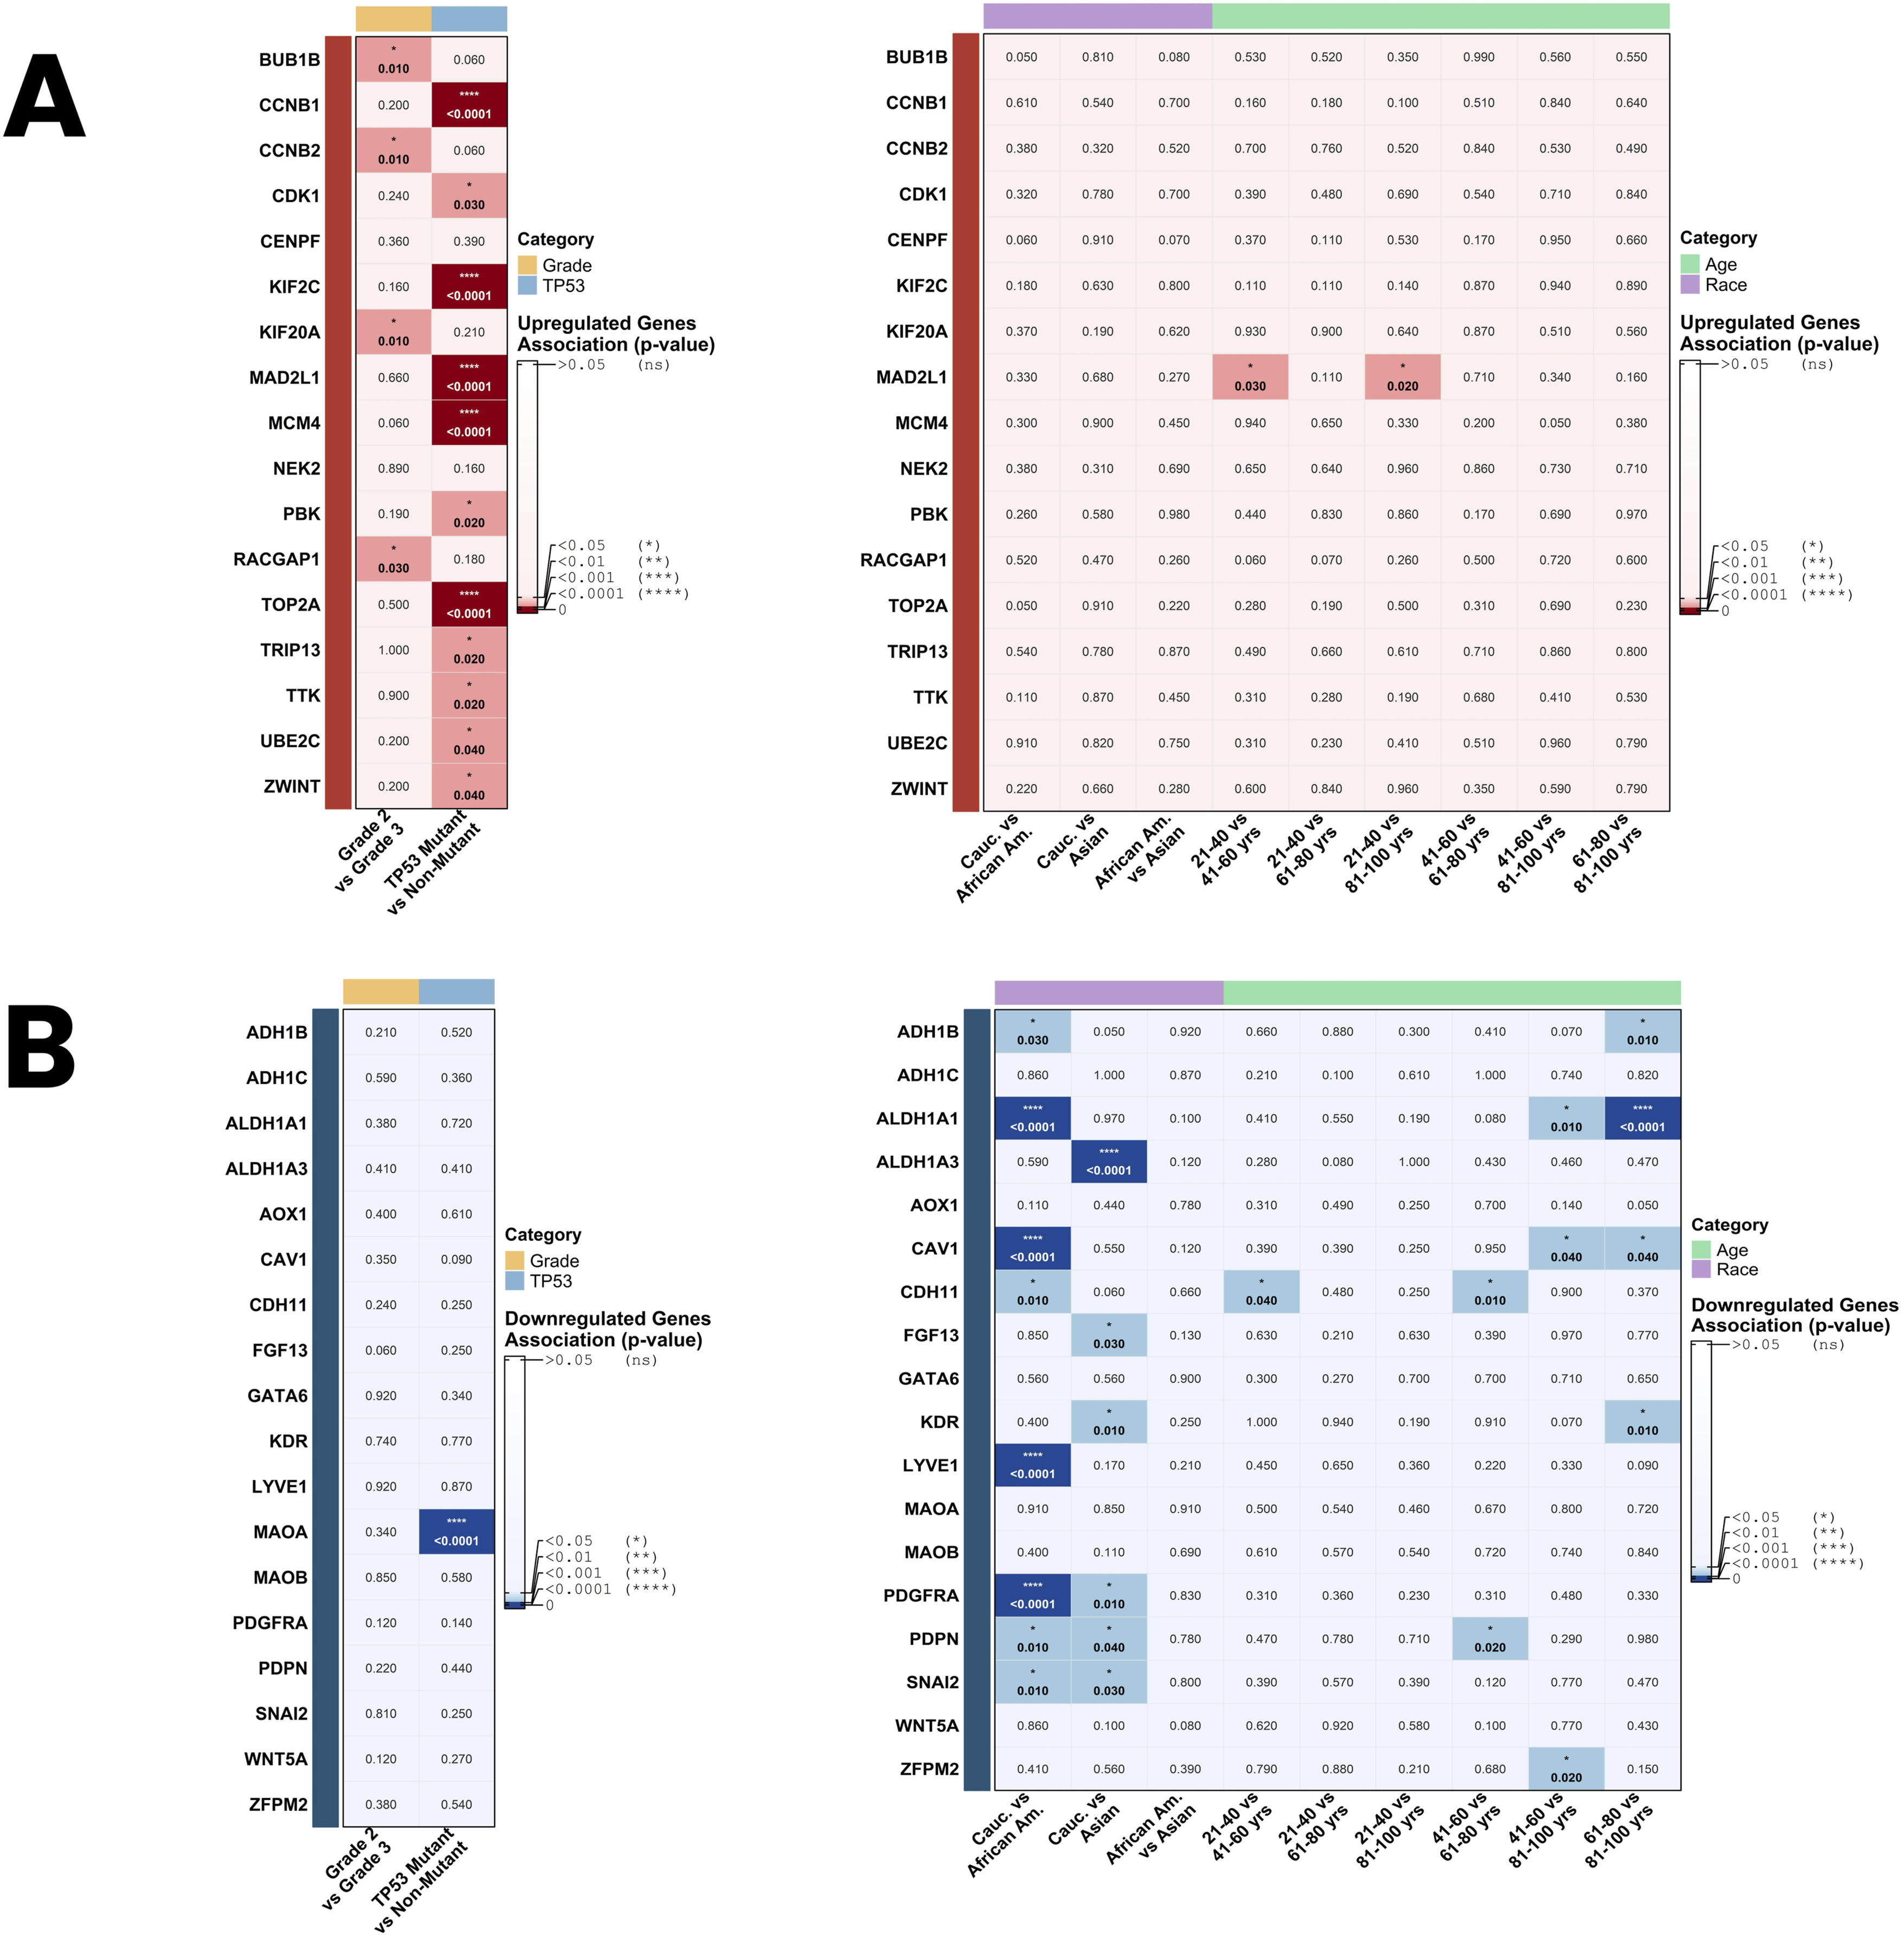
Again, race and ethnicity-based analysis revealed that the downregulated hub genes demonstrated substantially more race-associated expression differences than the upregulated hub genes (Figure 13). Among the upregulated hub genes, no significant race-associated expression differences were identified (Figure 13(a)). In contrast, among the downregulated hub genes, multiple genes showed significant expression differences between racial groups (Figure 13(b)). Comparing Caucasian and African American patients, eight genes, ADH1B (p = 0.030), ALDH1A1 (p < 0.0001), CAV1 (p < 0.0001), CDH11 (p = 0.010), LYVE1 (p < 0.0001), PDGFRA (p < 0.0001), PDPN (p = 0.010), and SNAI2 (p = 0.010), demonstrated significantly different expression levels. Comparing Caucasian and Asian patients, six genes showed significant differences; these include ALDH1A3 (p < 0.0001), FGF13 (p = 0.030), KDR (p = 0.010), PDGFRA (p = 0.010), PDPN (p = 0.040), and SNAI2 (p = 0.030). No significant expression differences were identified between African American and Asian patient groups for any hub gene.
Moreover, age-stratified analysis revealed limited but notable associations between hub gene expression and patient age groups (Figure 13). Among the downregulated hub genes, ALDH1A1 demonstrated the strong age-dependent expression differences, with significant reductions observed between the 41-60 and 81-100 age groups (p = 0.010) and a highly significant difference between the 61-80 and 81–100 age groups (p < 0.0001) (Figure 13(b)). CDH11 also displayed consistent, stepwise expression differences across consecutive age transitions, suggesting a gradual and sustained reduction in expression across the adult lifespan. Additionally, ADH1B and KDR each showed significant expression differences confined to the 61-80 versus 81-100 comparison (p = 0.010 for both). CAV1, PDPN, and ZFPM2 also demonstrated nominally significant differences across specific age group comparisons (p ≤ 0.040), though their patterns were comparatively less consistent. More importantly, it should be noted that the demographic and clinicopathological subgroup analyses presented here are based on TCGA OV data, which have unequal subgroup representation, particularly with respect to race and age. These findings should therefore be interpreted as exploratory observations rather than definitive clinical associations and require prospective validation in independent, adequately powered, and ethnically diverse cohorts.
Principal component analysis and hierarchical clustering
When all 35 hub genes were analysed together, PCA revealed clear separation between tumor and normal samples along PC1 (53.2%) and PC2 (27%), collectively explaining 80.2% of the total variance (Figure 14(a)). The 95% confidence ellipses for tumor and normal sample groups showed minimal overlap, demonstrating that the combined 35-gene hub gene signature robustly discriminates OC tissue from normal tissue. Analysis of the 17 upregulated hub genes alone yielded even stronger separation along PC1 (82.7%), with PC2 accounting for an additional 5% of variance, a total of 87.7%. The 18 downregulated hub genes similarly demonstrated clear tumor-normal separation, with PC1 explaining 73.4% and PC2 explaining 6.2% of total variance, a combined 79.6%. Across all three PCA scenarios, the tumor samples clustered tightly and distinctly from normal samples, confirming the strong discriminatory power of both the upregulated and downregulated hub gene panels individually and collectively (Figure 14(a)). Principal component analysis and hierarchical clustering of hub gene expression profiles in ovarian cancer. (a) PCA scatter plots showing the separation between tumor samples (red circles) and normal samples (grey triangles) based on the expression profiles of all 35 hub genes combined (left panel), the 17 upregulated hub genes only (middle panel), and the 18 downregulated hub genes only (right panel). Dashed ellipses represent 95% confidence intervals for each sample group. (b) Hierarchical clustering heatmaps showing z-score normalized expression profiles of the upregulated hub genes (left heatmap) and downregulated hub genes (right heatmap) across all samples.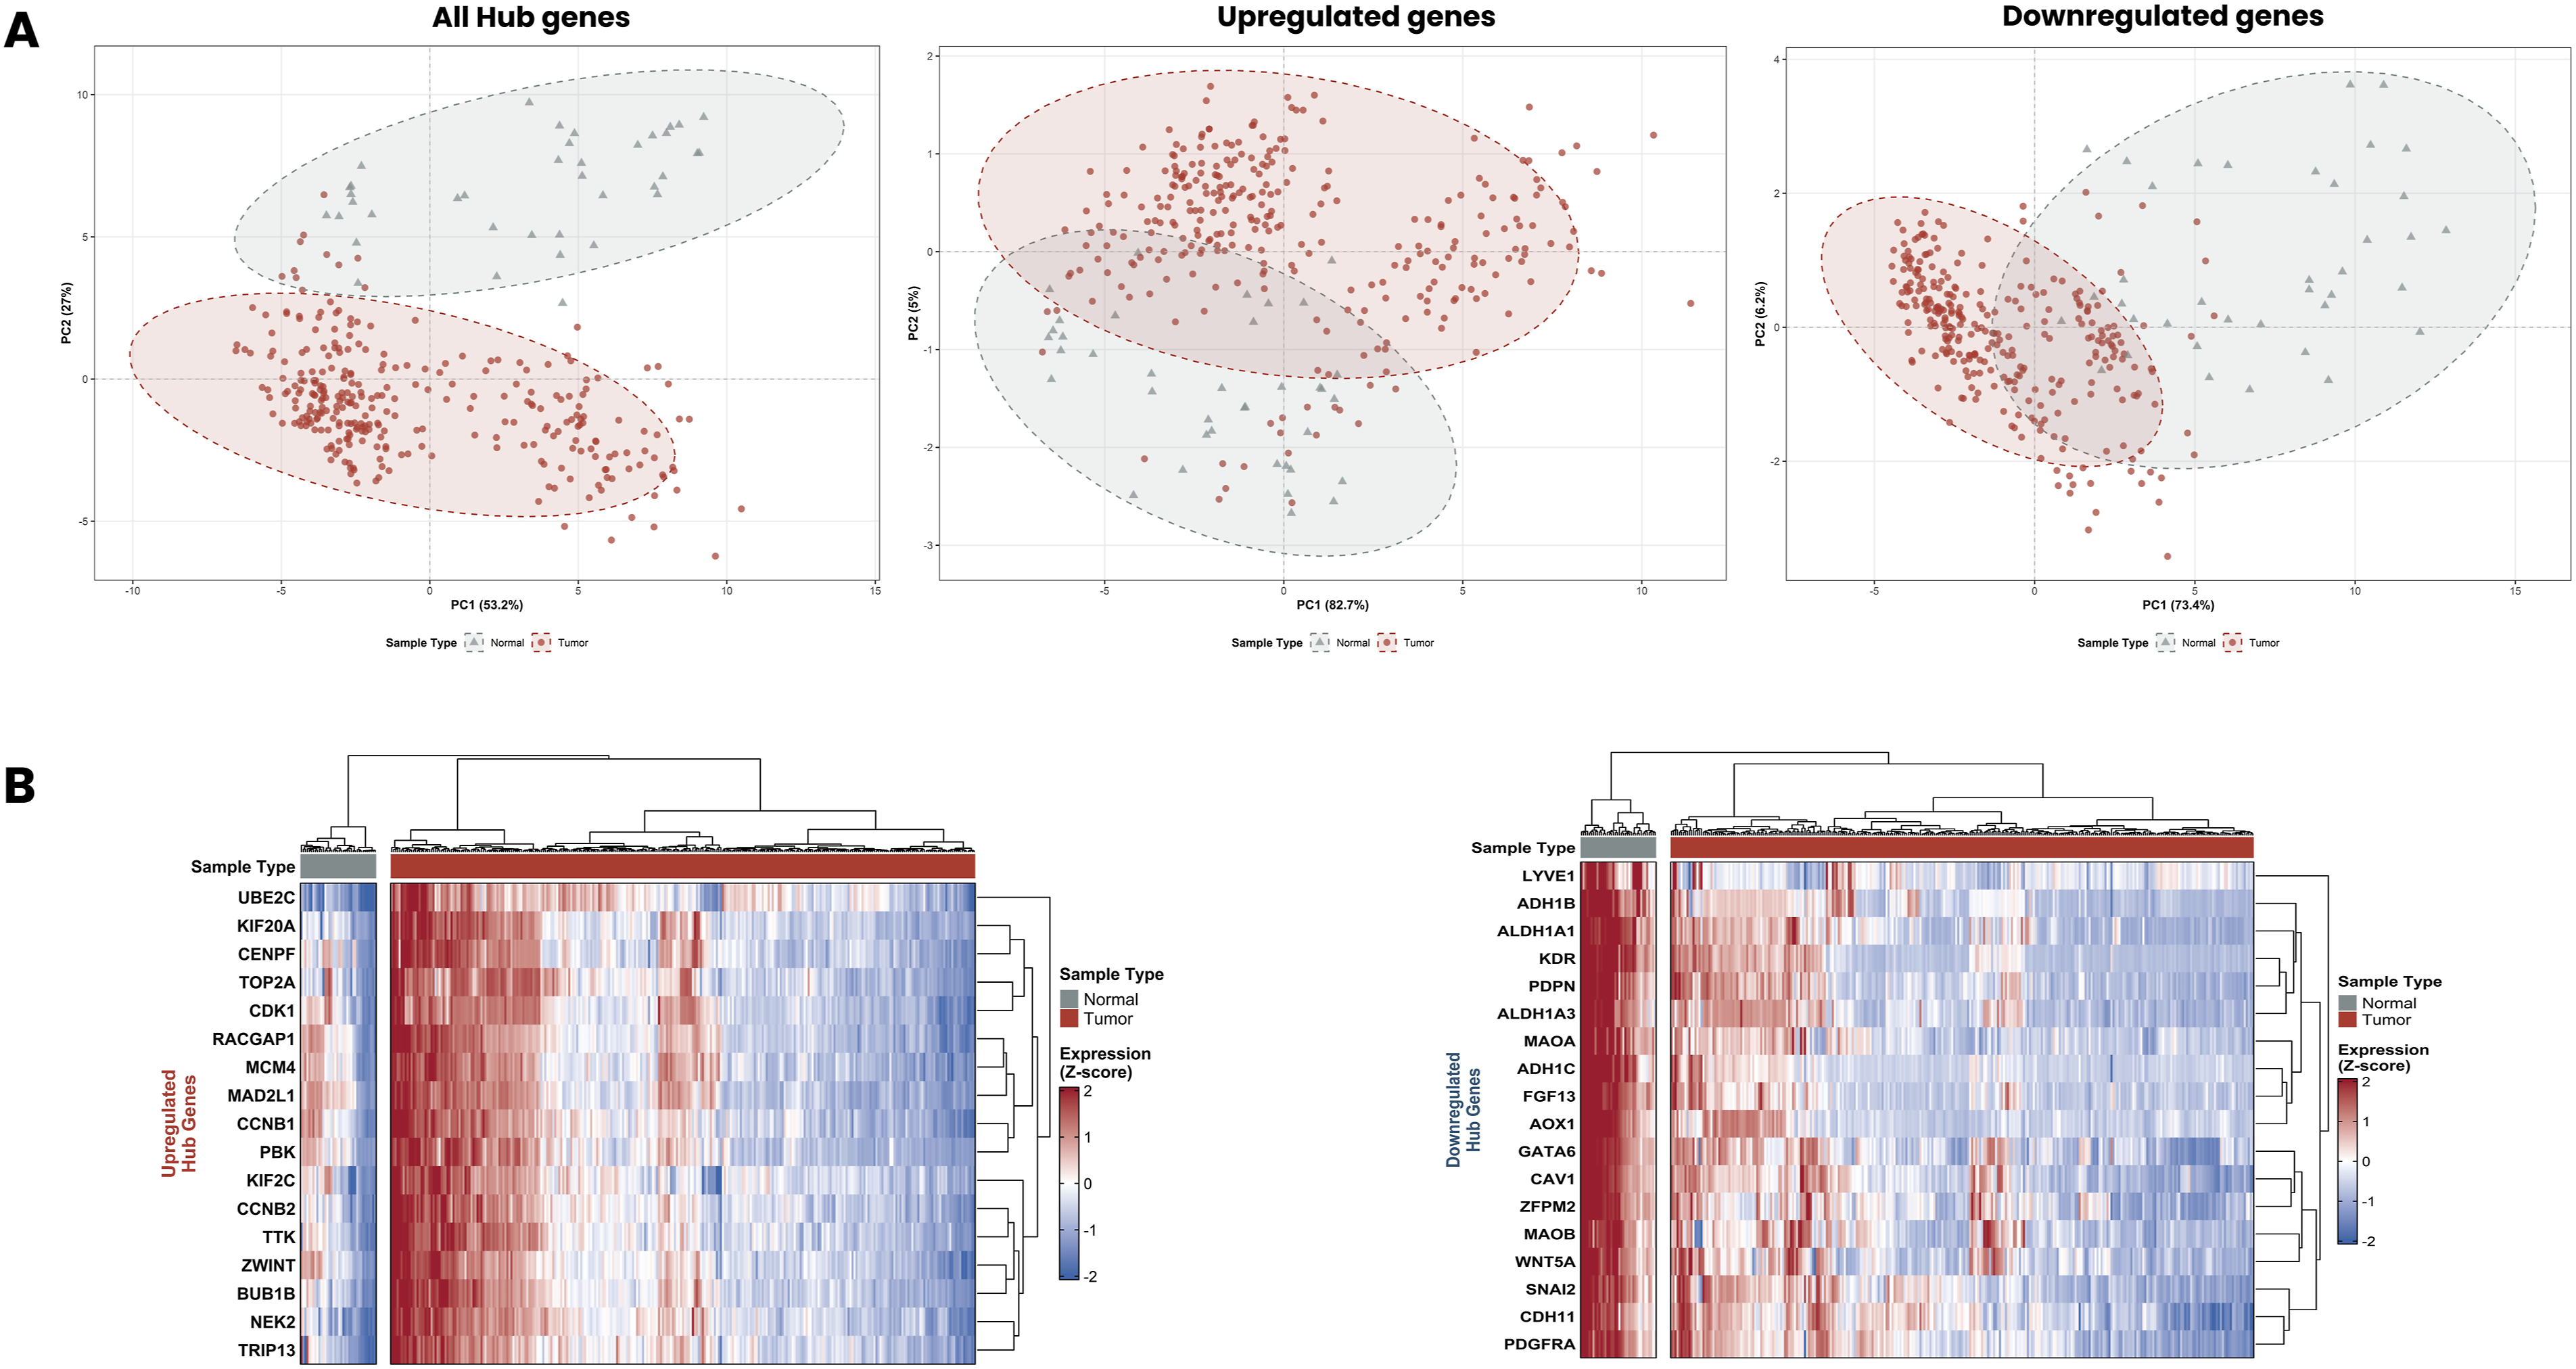
More importantly, hierarchical clustering heatmaps generated for the upregulated and downregulated hub gene panels further confirmed the expression patterns identified in the DEG analysis (Figure 14(b)). For the upregulated hub genes, unsupervised hierarchical clustering clearly segregated tumor samples from normal samples into two distinct clusters. All 17 upregulated hub genes showed consistently high expression (red) in tumor samples and low expression (blue) in normal samples, with a clear, sharp boundary between the two groups. For the downregulated hub genes, hierarchical clustering similarly separated tumor and normal samples into two well-defined clusters. All 18 downregulated hub genes demonstrated consistently low expression (blue) in tumor samples and high expression (red) in normal samples, confirming their transcriptomic suppression in OC.
ROC analysis
All 18 downregulated hub genes demonstrated excellent diagnostic performance with AUC values ranging from 0.859 to 0.964 (Figure 15). The top five performing genes were KDR (AUC = 0.964, 95% CI: 0.941-0.987), FGF13 (AUC = 0.963, 95% CI: 0.944-0.983), ADH1B (AUC = 0.962, 95% CI: 0.938-0.986), MAOA (AUC = 0.960, 95% CI: 0.939-0.981) and ADH1C (AUC = 0.953, 95% CI: 0.923-0.983). Notably, MAOA and PDPN achieved perfect specificity (specificity = 1.000) at their optimal Youden Index thresholds. The remaining downregulated hub genes, ALDH1A1 (AUC = 0.952), GATA6 (AUC = 0.930), LYVE1 (AUC = 0.928), CAV1 (AUC = 0.926), PDPN (AUC = 0.926), AOX1 (AUC = 0.943), ZFPM2 (AUC = 0.941), WNT5A (AUC = 0.910), MAOB (AUC = 0.905), SNAI2 (AUC = 0.906), ALDH1A3 (AUC = 0.902), PDGFRA (AUC = 0.914) and CDH11 (AUC = 0.859), all exceeded the AUC threshold of 0.85. The mean AUC across all 18 downregulated hub genes was 0.934. ROC analysis of downregulated hub genes for the diagnosis of ovarian cancer. For each gene, the AUC with 95% confidence interval (CI), sensitivity (Sen), and specificity (Spe) at the optimal Youden Index threshold are displayed within each plot.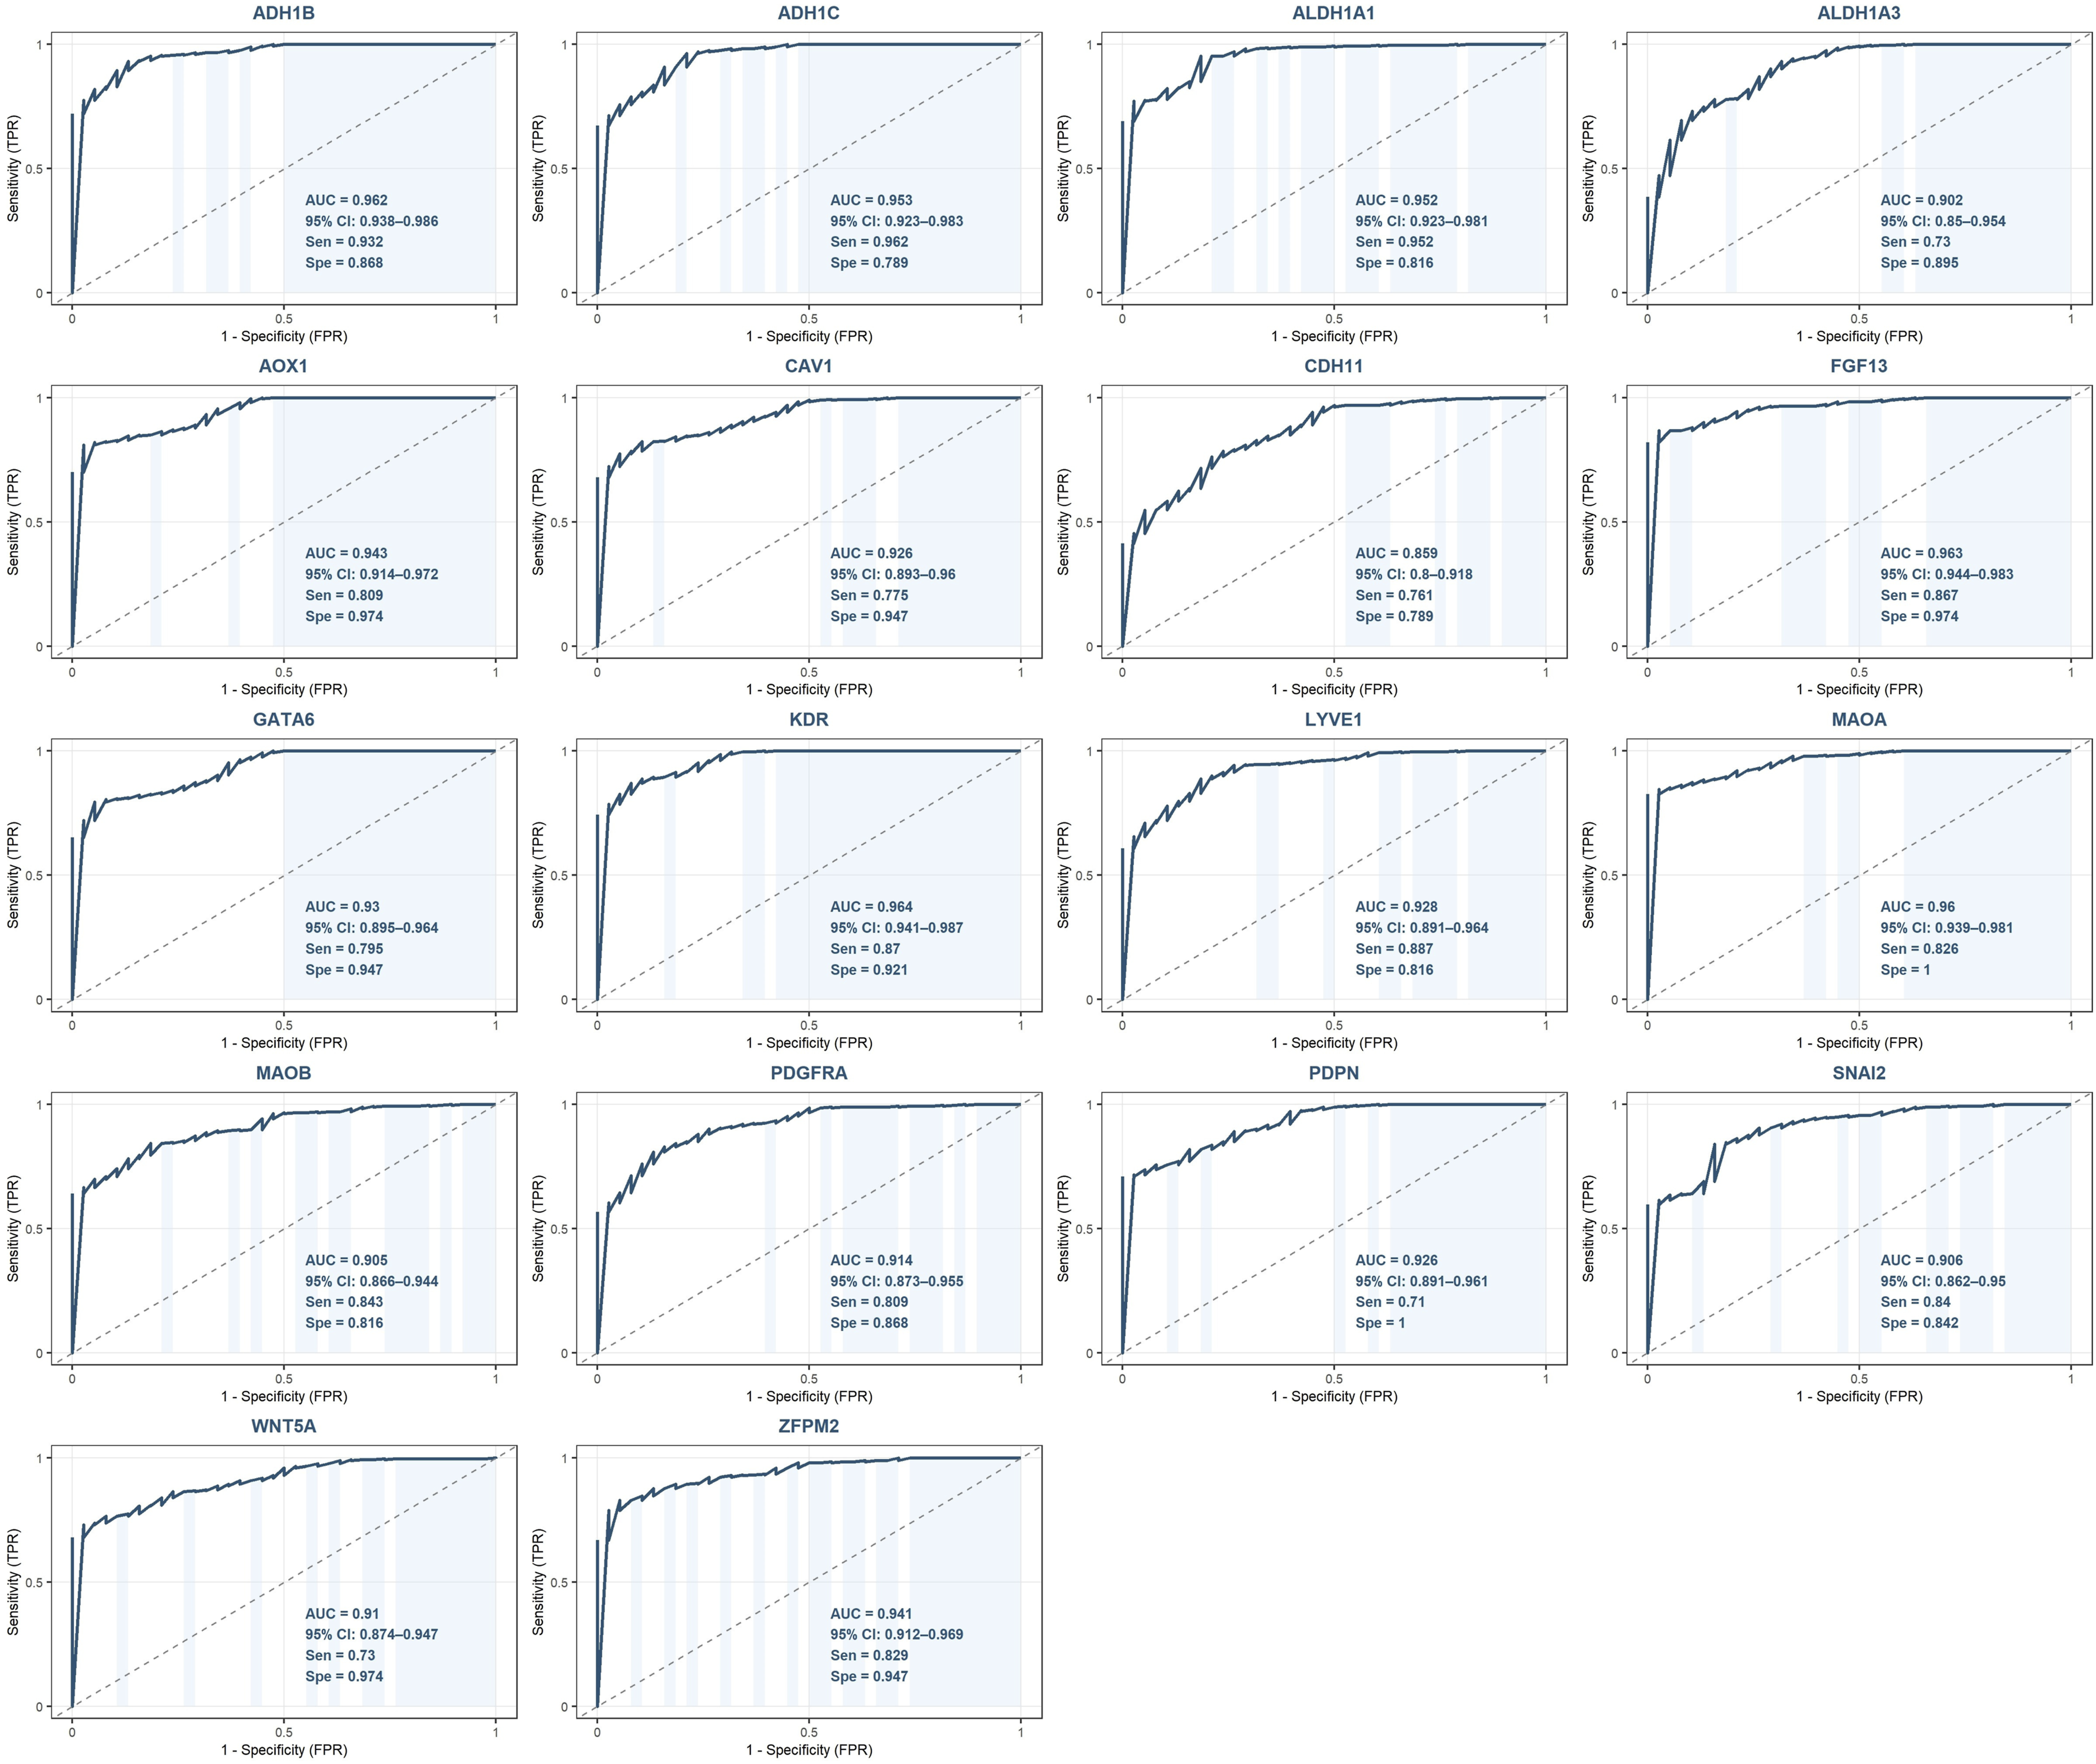
The upregulated hub genes demonstrated more heterogeneous diagnostic performance compared to the downregulated panel. UBE2C emerged as the strongest diagnostic biomarker among the upregulated hub genes with an AUC of 0.933 (95% CI: 0.903-0.962), sensitivity of 0.802, and specificity of 0.974, values comparable to the top-performing downregulated hub genes. NEK2 (AUC = 0.805, 95% CI: 0.732–0.879) and TRIP13 (AUC = 0.766, 95% CI: 0.677–0.855) also demonstrated good diagnostic performance. The remaining upregulated hub genes showed moderate to poor diagnostic performance with AUC values ranging from 0.422 to 0.710. Notably, CDK1 (AUC = 0.422), MCM4 (AUC = 0.450), and PBK (AUC = 0.451) showed AUC values below 0.5. The mean AUC across all 17 upregulated hub genes was 0.630. The combined ROC results are summarized in Figure 16. ROC analysis of upregulated hub genes for the diagnosis of ovarian cancer. For each gene, the AUC with 95% confidence interval (CI), sensitivity (Sen), and specificity (Spe) at the optimal Youden Index threshold are displayed within each plot.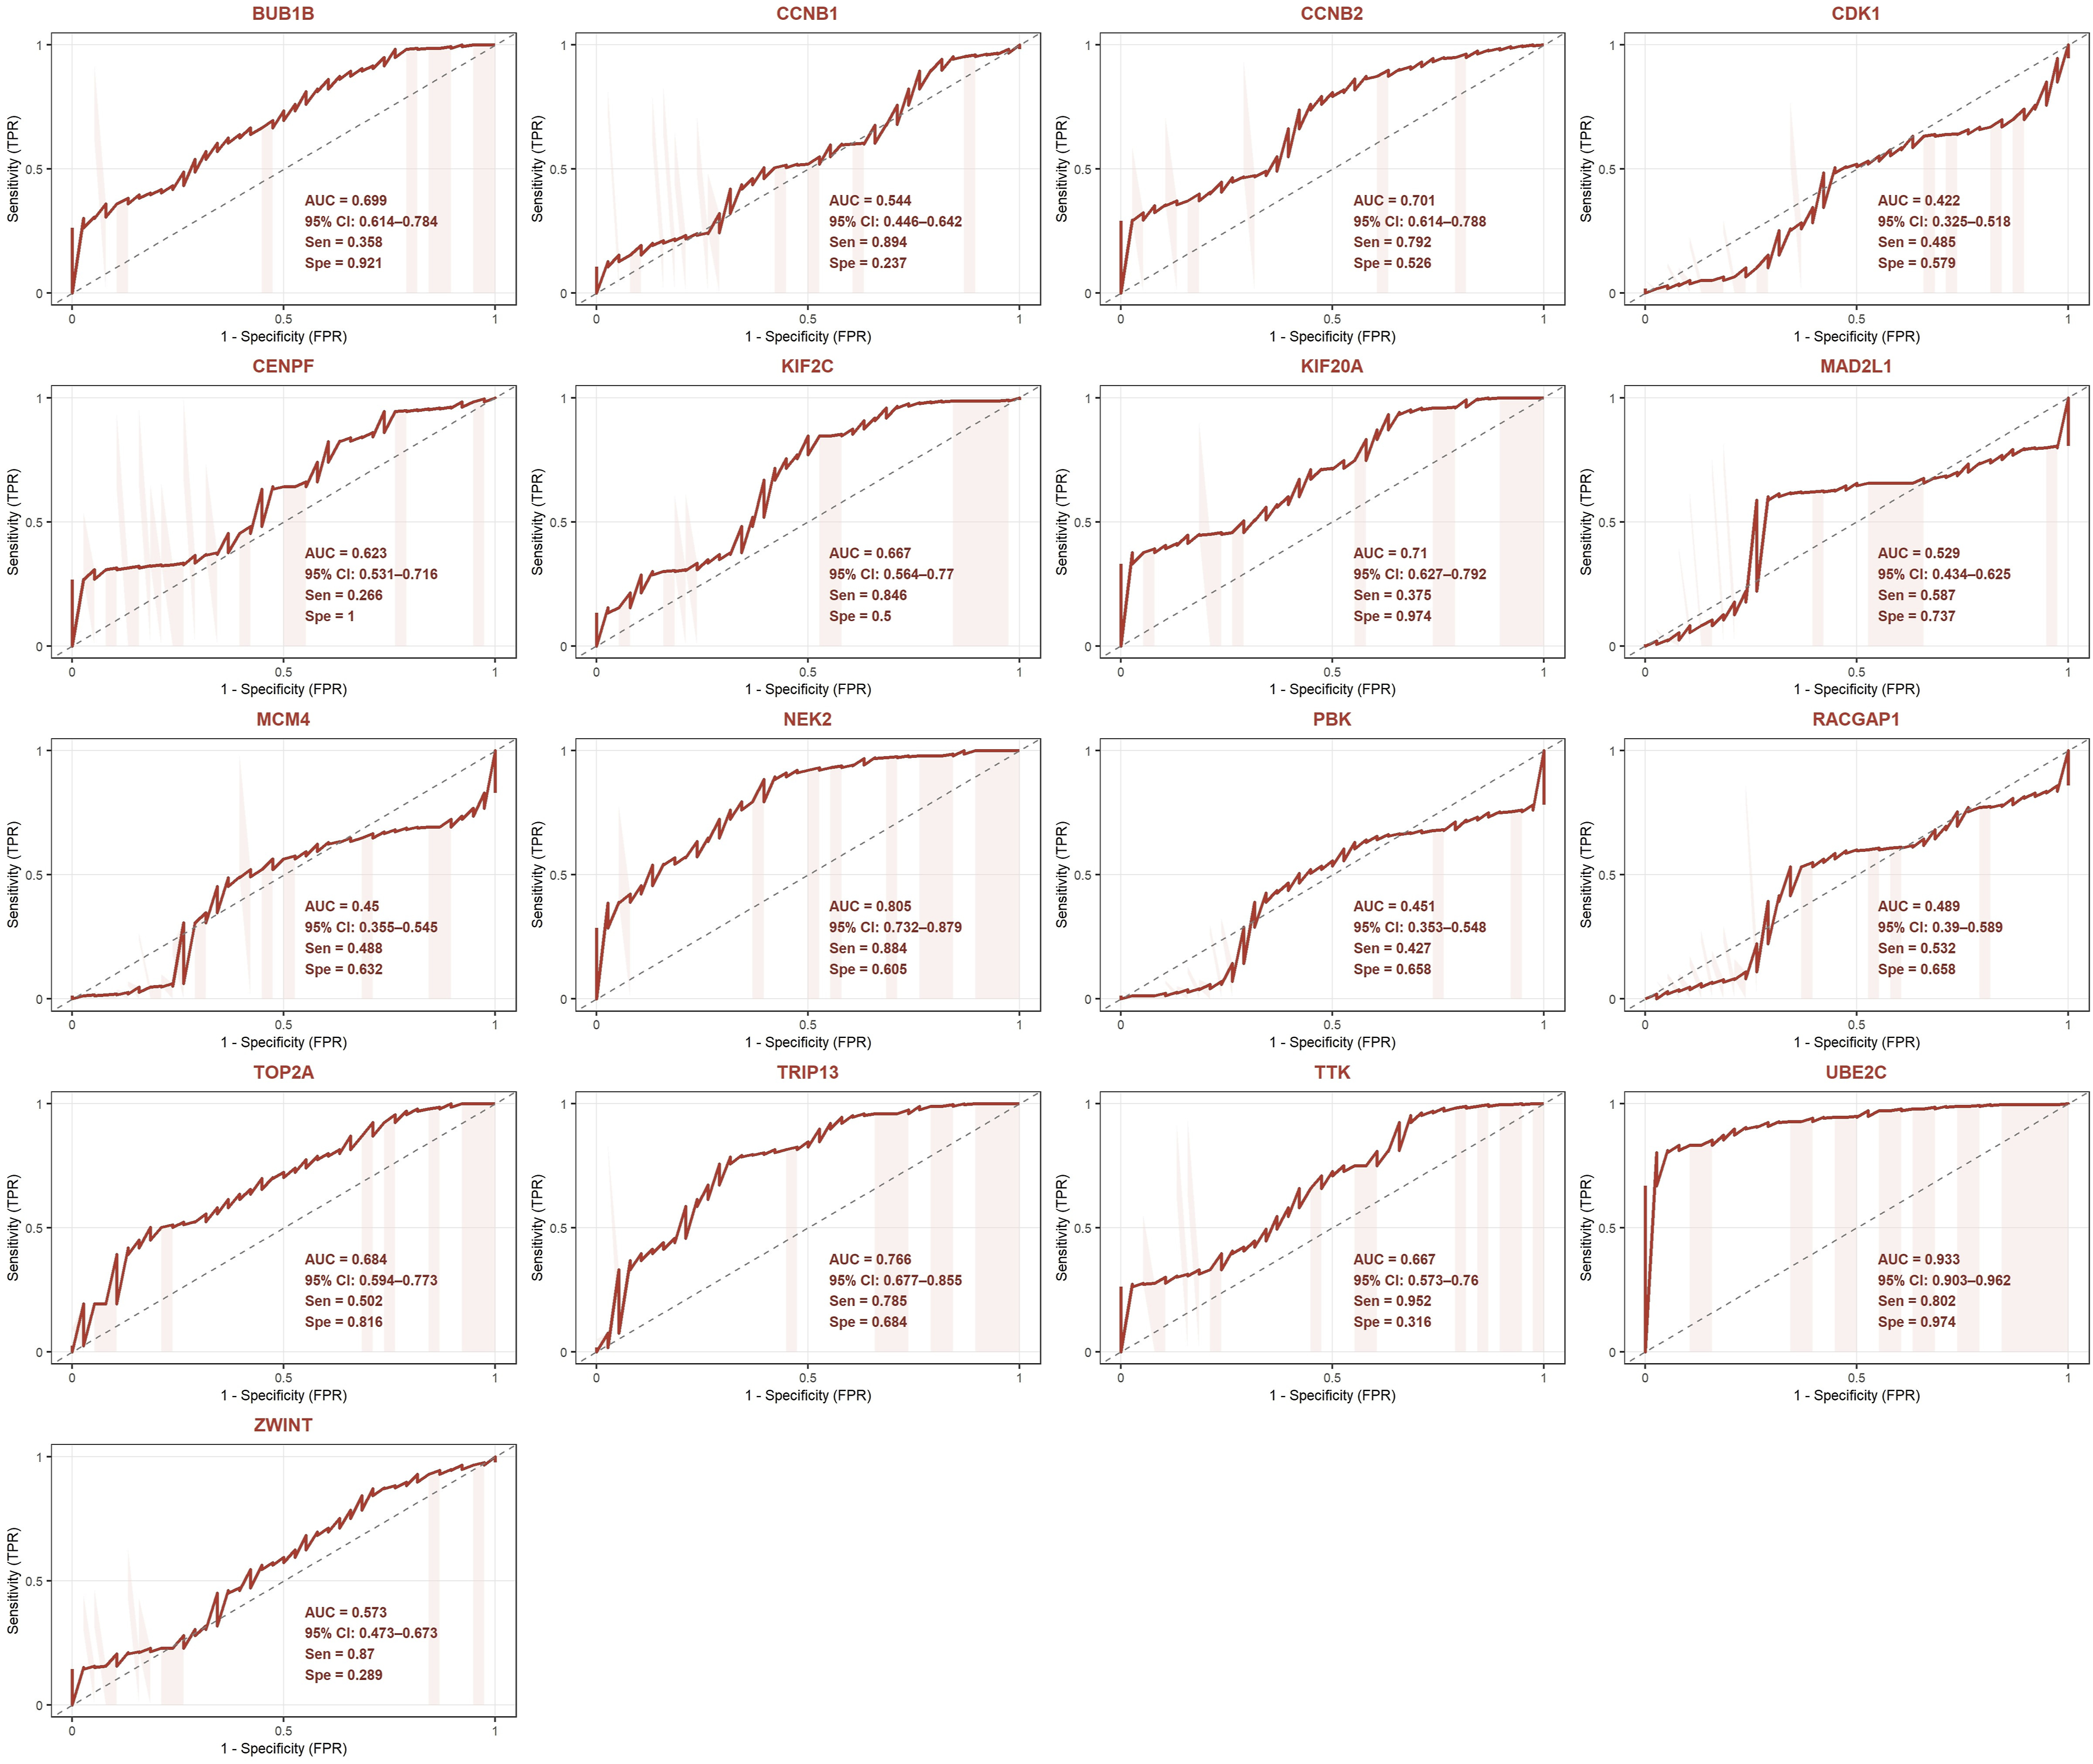
External validation of the diagnostic performance of the hub genes
The external validation ROC analysis demonstrated outstanding diagnostic performance for the upregulated hub gene panel in the independent external cohort (GSE69428) (Figure 17). Seven genes (CCNB2, KIF2C, KIF20A, TOP2A, TTK, UBE2C, and ZWINT) achieved perfect AUC values of 1.0 (95% CI: 1-1), indicating complete discrimination between HGSOC tumor and normal oviduct samples. Additionally, BUB1B (AUC = 0.99, 95% CI: 0.962-1), CCNB1 (AUC = 0.98, 95% CI: 0.933-1), RACGAP1 (AUC = 0.98, 95% CI: 0.933-1), PBK (AUC = 0.96, 95% CI: 0.875-1), MCM4 (AUC = 0.93, 95% CI: 0.82-1), CDK1 (AUC = 0.94, 95% CI: 0.841-1) and NEK2 (AUC = 0.91, 95% CI: 0.764-1) also demonstrated excellent diagnostic performance. CENPF (AUC = 0.76, 95% CI: 0.529-0.991) and MAD2L1 (AUC = 0.78, 95% CI: 0.564-0.996) showed good diagnostic performance, while TRIP13 demonstrated moderate performance (AUC = 0.69, 95% CI: 0.441-0.939). The mean AUC across all 17 upregulated hub genes in the external validation dataset was 0.938, a substantial improvement compared to the mean AUC of 0.630 observed in the primary ROC analysis. External validation of the diagnostic performance of upregulated hub genes using the independent GSE69428 dataset.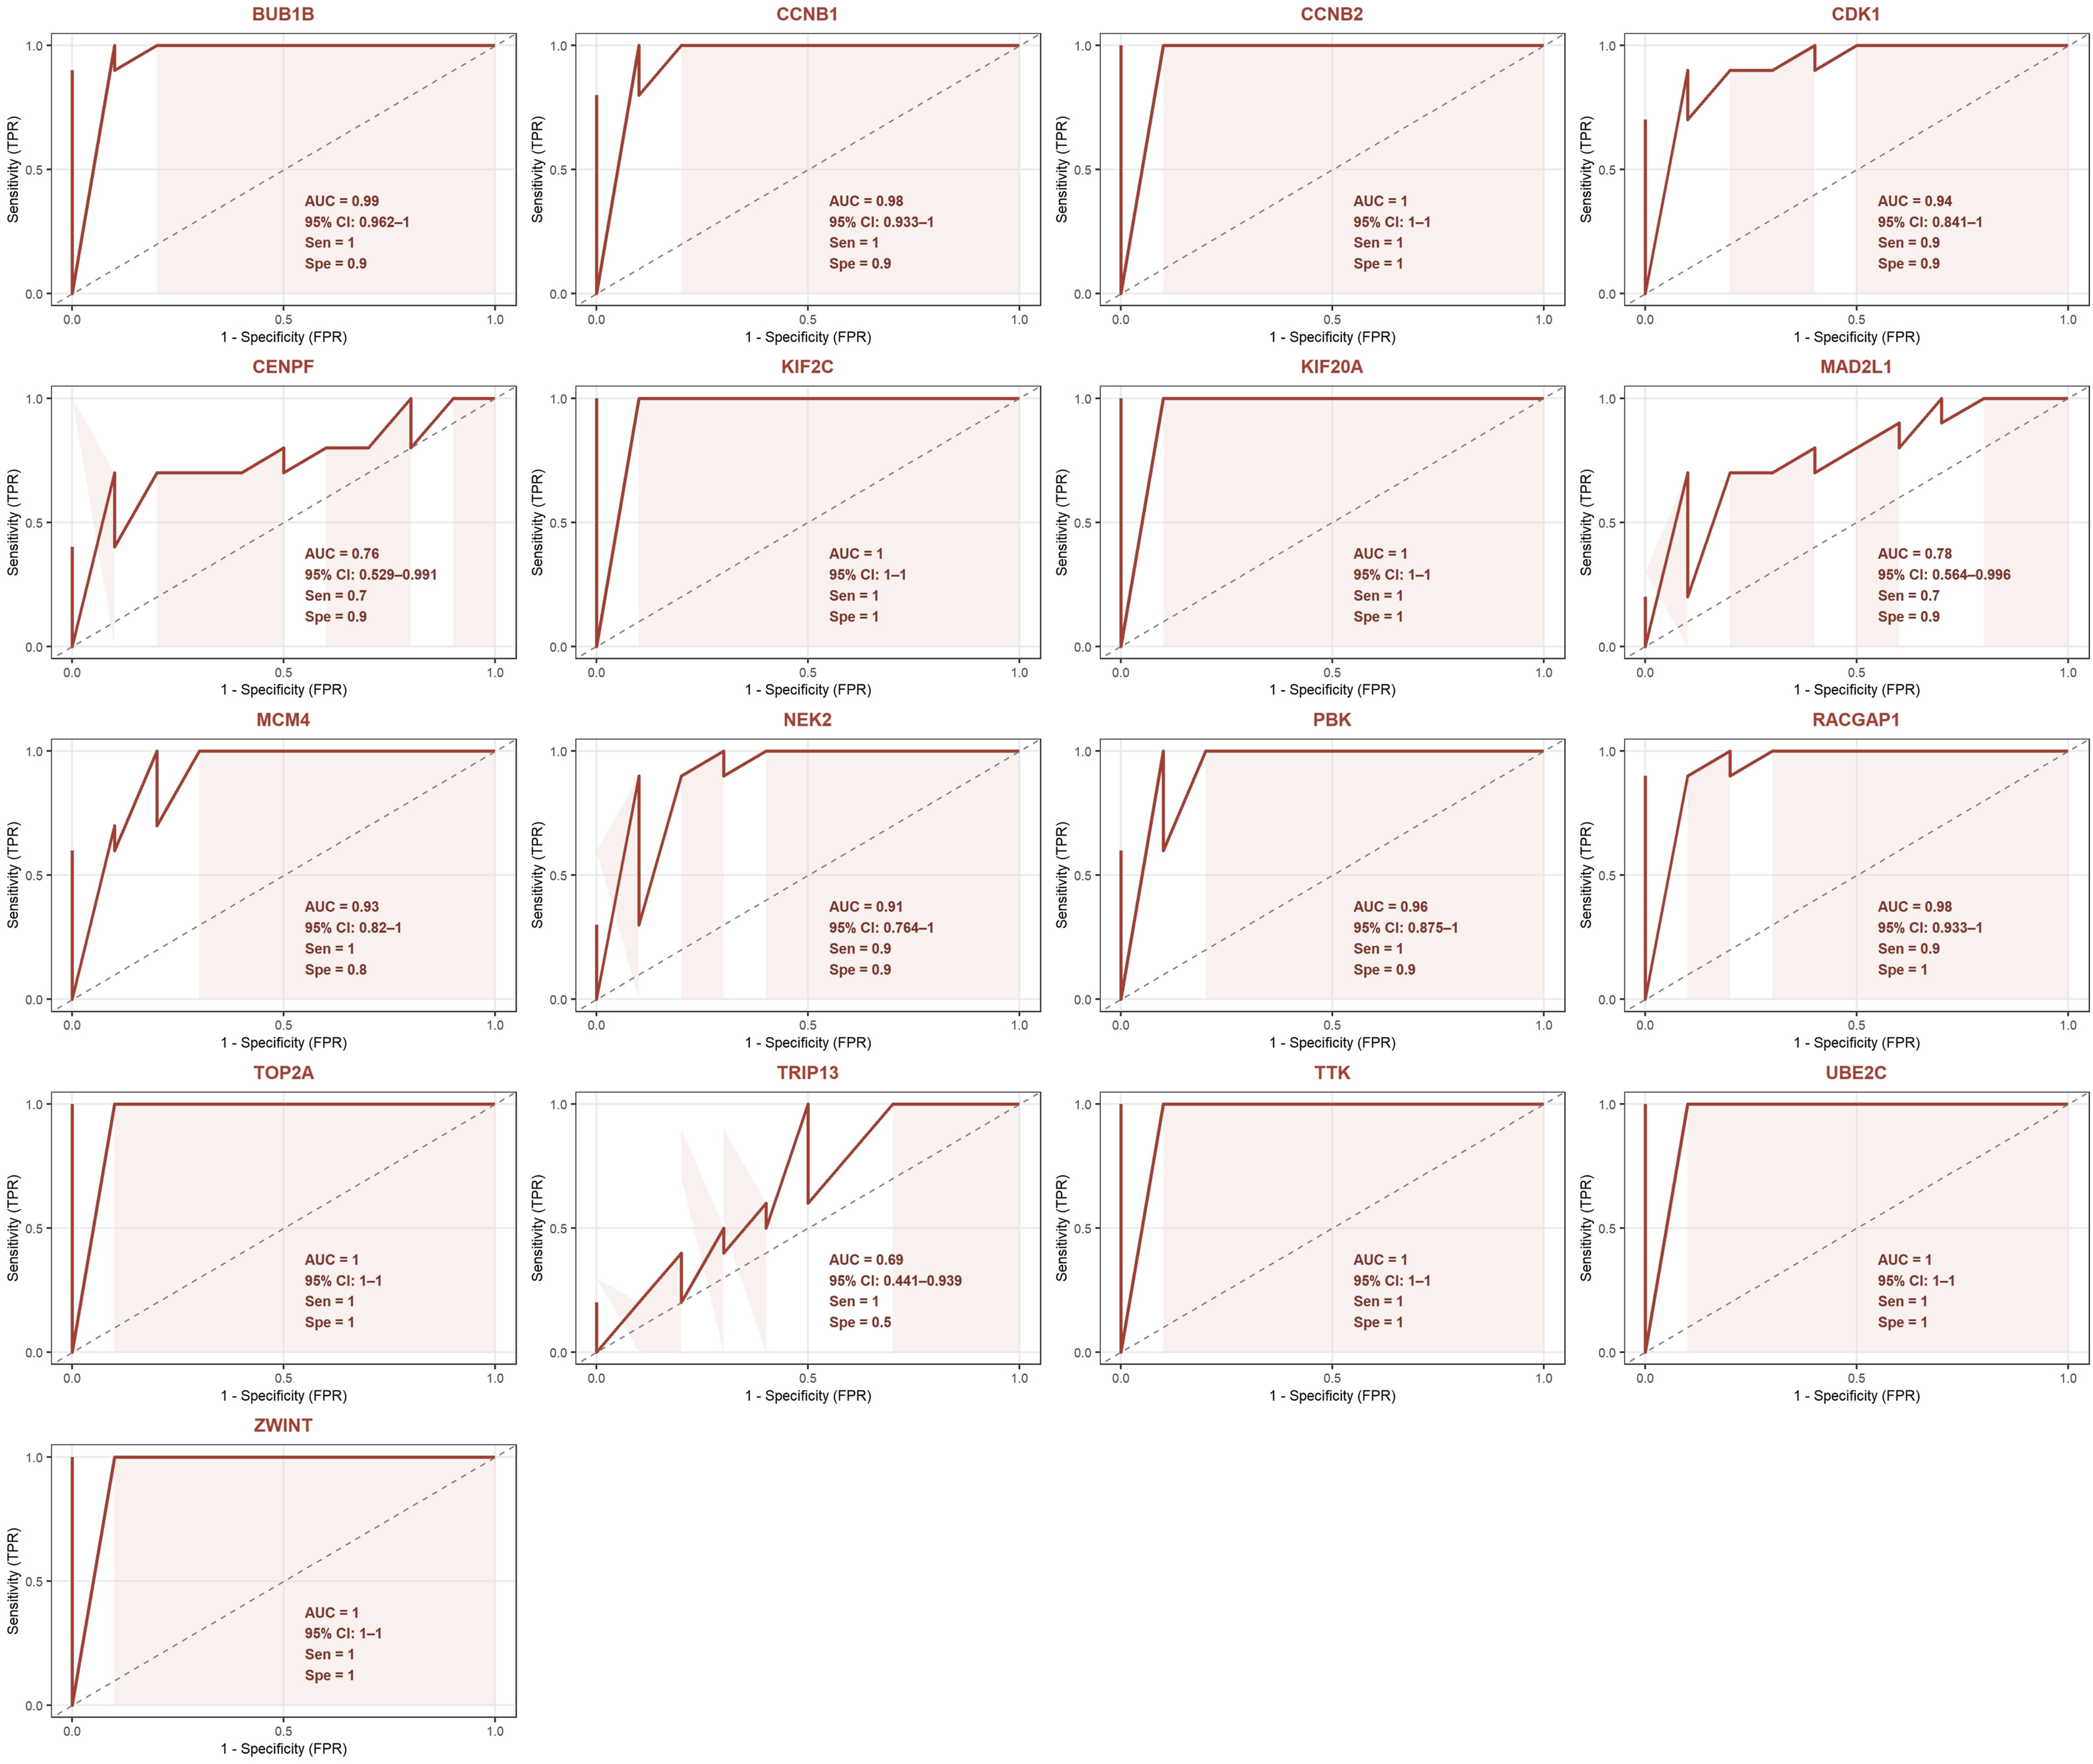
Among the downregulated hub genes, ALDH1A3 achieved a perfect AUC of 1.0 (95% CI: 1-1) in the external validation dataset, while ALDH1A1 (AUC = 0.99, 95% CI: 0.962-1), ADH1B (AUC = 0.95, 95% CI: 0.86-1), GATA6 (AUC = 0.92, 95% CI: 0.761-1) and ZFPM2 (AUC = 0.86, 95% CI: 0.681-1) demonstrated excellent diagnostic performance. MAOA (AUC = 0.82, 95% CI: 0.612-1), PDPN (AUC = 0.81, 95% CI: 0.612-1), SNAI2 (AUC = 0.75, 95% CI: 0.515-0.985), and ADH1C (AUC = 0.745, 95% CI: 0.523-0.967) showed good diagnostic performance. The remaining downregulated hub genes demonstrated moderate to poor diagnostic performance in the external validation cohort (Figure 18). The mean AUC across all 18 downregulated hub genes was 0.742. External validation of the diagnostic performance of downregulated hub genes using the independent GSE69428 dataset.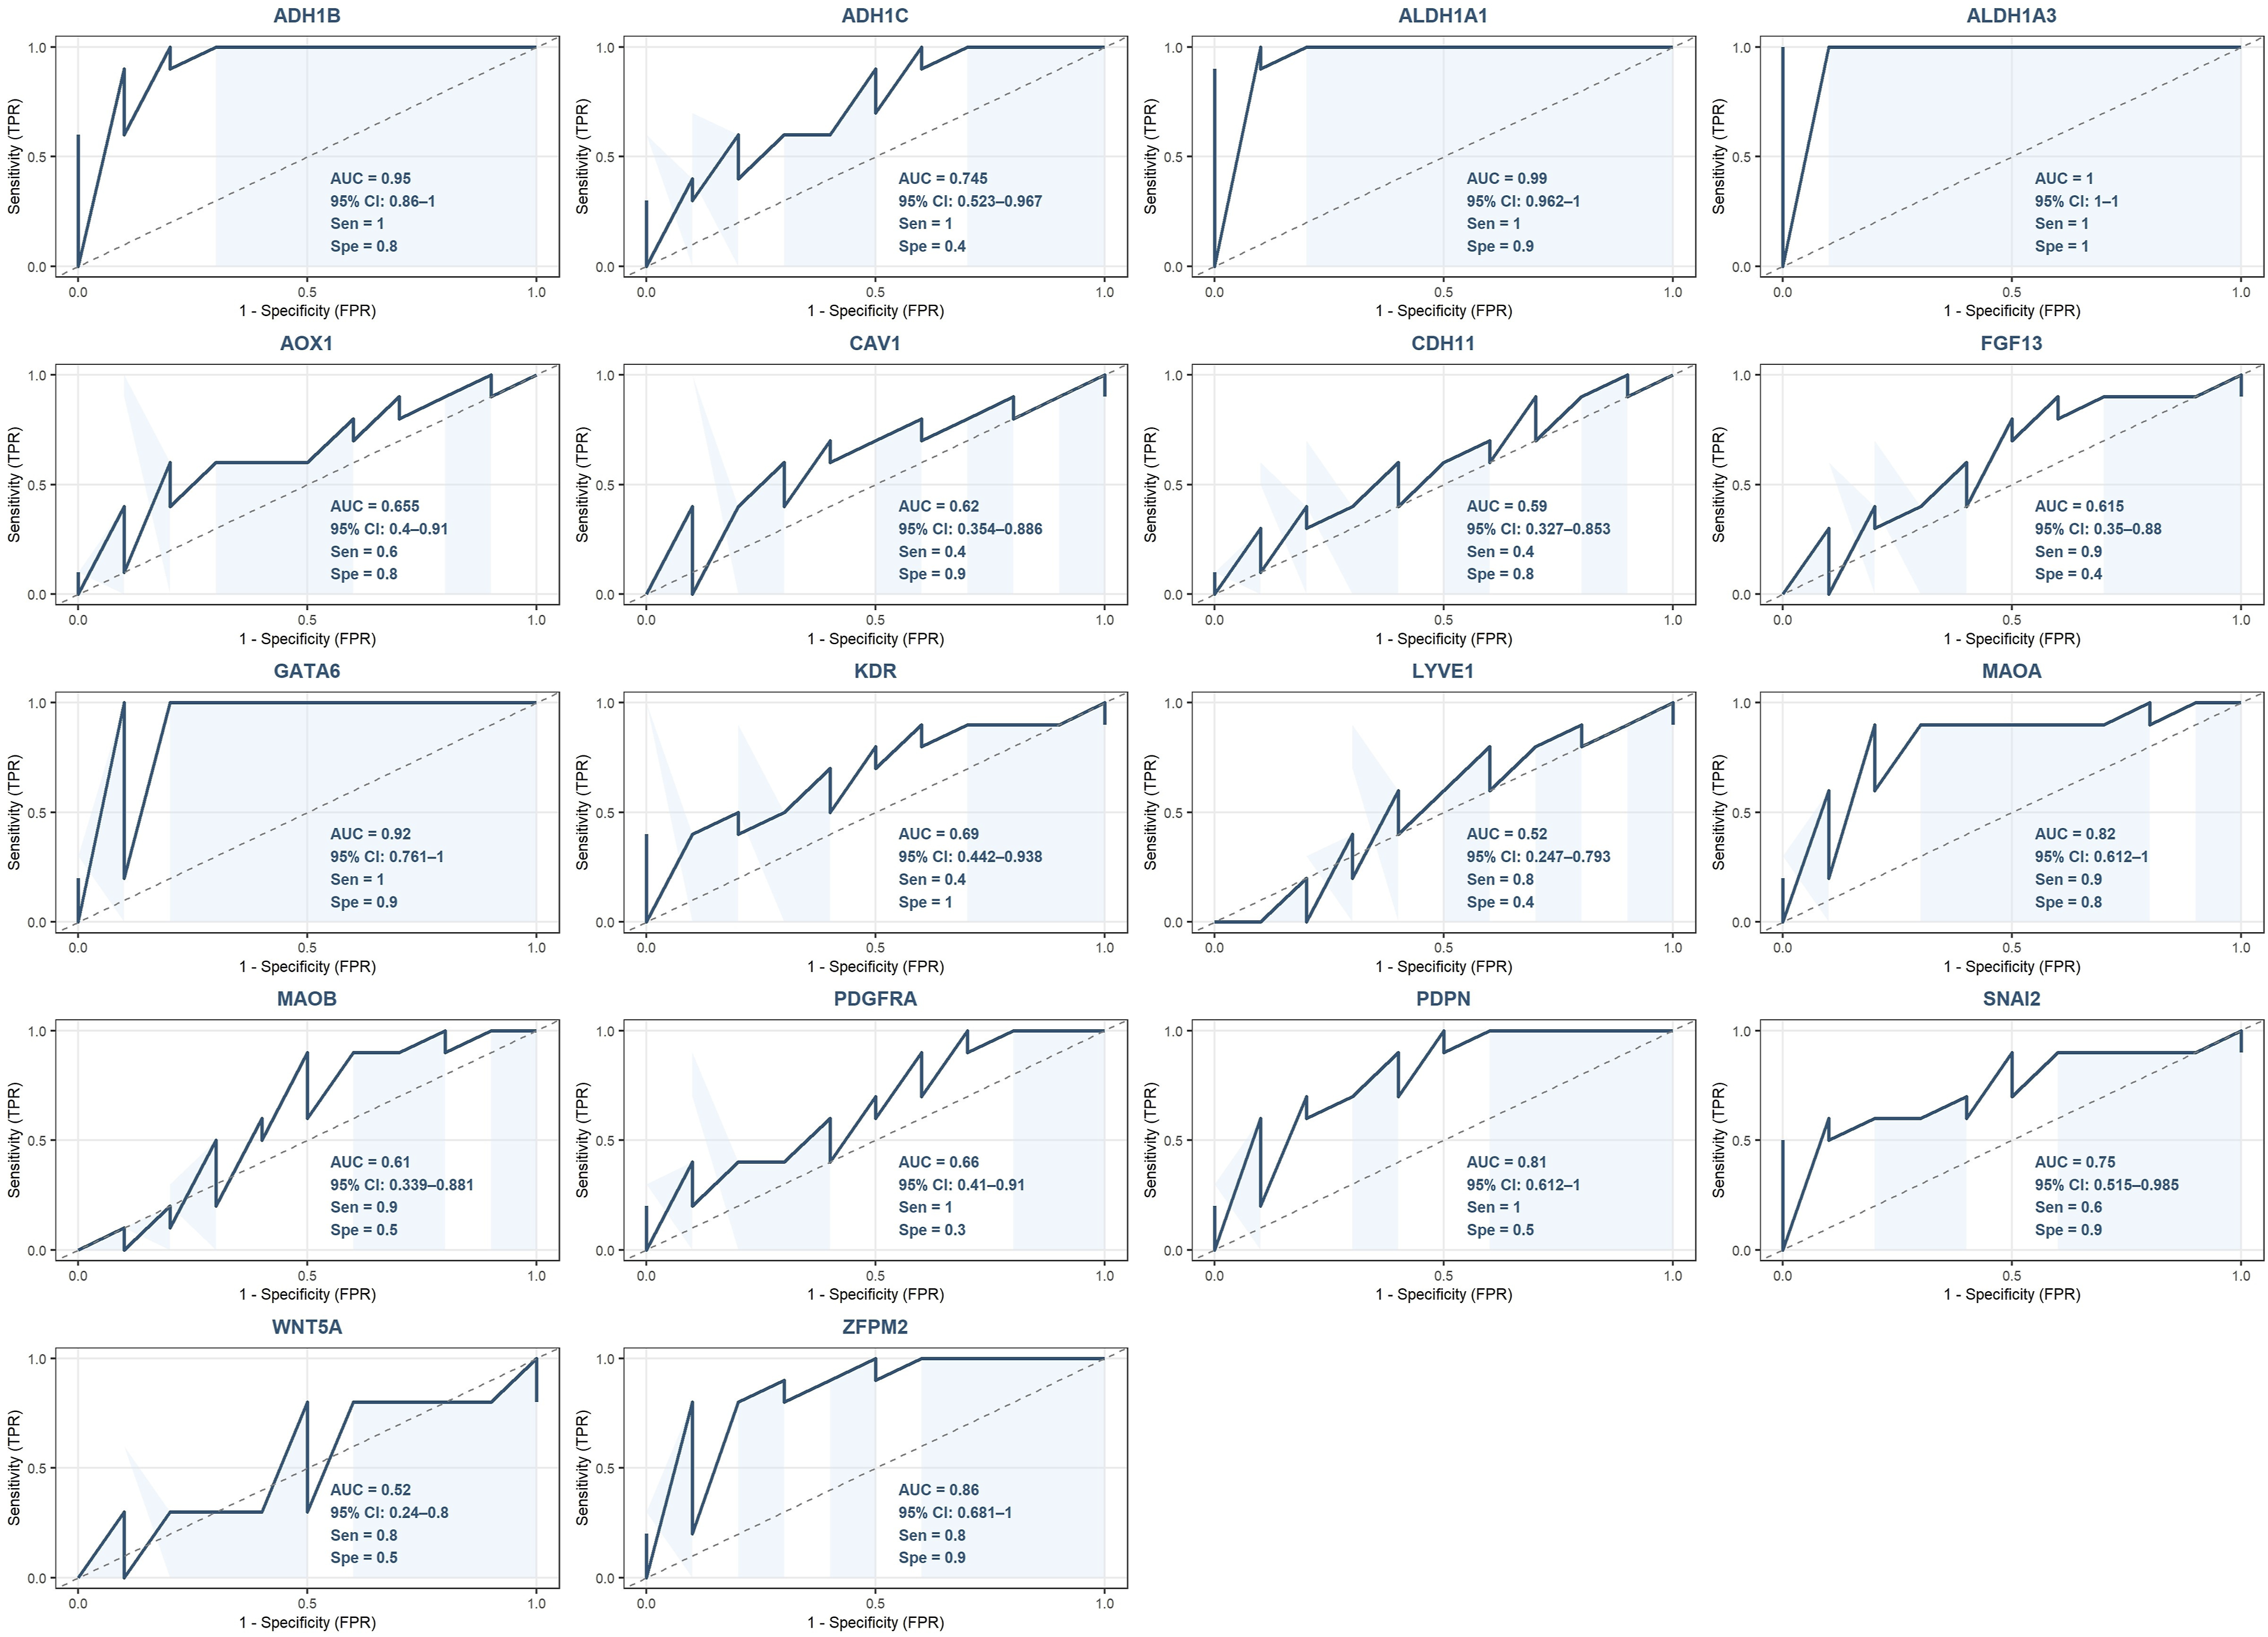
Discussion
This study applied an integrated multi-dataset bioinformatics approach to characterize the gene expression landscape of OC, with the aim of identifying candidate diagnostic and prognostic biomarkers. Through the analysis of four independent GEO microarray datasets, a panel of 35 hub genes was identified, comprising 17 upregulated and 18 downregulated genes, that collectively reflected two biologically distinct aspects of OC molecular pathology: aberrant activation of mitotic and cell cycle regulatory machinery, and suppression of metabolic, extracellular matrix, and signaling homeostatic programs, respectively. The convergence of these findings across independent datasets of varying sample sizes and patient compositions suggests that the transcriptional alterations identified represent a reproducible and biologically grounded molecular signature of OC rather than dataset-specific noise.
The identification of 209 overlapping DEGs across all four datasets supports the presence of a conserved transcriptional signature in OC that persists regardless of cohort-specific variables. Functional enrichment analysis revealed a clear directional asymmetry between the upregulated and downregulated DEG sets. Upregulated genes were predominantly enriched in chromosome segregation, mitotic cell division, and spindle apparatus regulation, while downregulated genes were significantly enriched in hormone metabolic processes, BMP signaling, steroid biosynthesis, retinol metabolism, and extracellular matrix-associated molecular functions. This bidirectional pattern is consistent with the established molecular hallmarks of OC progression, wherein uncontrolled cellular proliferation is accompanied by systematic dismantling of differentiation-associated and homeostatic transcriptional drivers. 35 The enrichment of BMP signaling suppression among downregulated genes is notable given the established role of BMP pathway activity in maintaining normal follicular biology and granulosa cell function in the ovary, and its reported dysregulation in epithelial ovarian carcinogenesis. 36 Concurrent suppression of retinol metabolism and steroid biosynthesis further supports OC progression, which involves the transcriptional erosion of lipid metabolic and endocrine regulatory functions that characterize normal ovarian tissue physiology. 37
Emerging from the PPI network analysis, the 17 upregulated hub genes formed a functionally coherent subnetwork predominantly involved in mitotic spindle assembly, chromosomal segregation, and spindle assembly checkpoint regulation. CDK1, which emerged as the most highly connected node within this network, is a master regulator of the G2/M phase transition and a well-characterized oncogenic driver whose overexpression in epithelial OC has been consistently associated with tumor proliferation and adverse clinical outcomes.38,39 Also, TOP2A, which catalyzes topological changes in DNA during replication and transcription, has been identified as a recurrent hub gene across multiple OC studies and represents an established target of anthracycline-based chemotherapy regimens.40–42 BUB1B and MAD2L1, both core components of the spindle assembly checkpoint, function to ensure chromosomal fidelity during mitosis through inhibition of premature anaphase onset; their overexpression in OC is consistent with the pervasive chromosomal instability that characterizes high-grade serous ovarian carcinoma, the predominant subtype in the datasets analyzed. 30 The coordinated upregulation of these functionally related genes across four independent datasets strongly supports their role as active drivers of the hyperproliferative phenotype in OC. Consistent with their biological significance, nine of the 17 upregulated hub genes (MCM4, MAD2L1, NEK2, BUB1B, CENPF, RACGAP1, TRIP13, TTK, and ZWINT) demonstrated statistically significant stage-dependent expression differences, with MCM4 exhibiting the strongest association. These findings indicate that the mitotic transcriptional program identified in this study intensifies progressively with disease advancement, reinforcing its relevance to OC pathogenesis.
Moving on, survival analysis identified TRIP13 as the only upregulated hub gene with a statistically significant association with OS, wherein high expression correlated with improved OS. TRIP13 encodes an AAA+ ATPase that functions as a mitotic checkpoint-silencing protein by catalyzing the conversion of closed MAD2 to its open conformation in connection with p31comet, thereby facilitating anaphase-promoting complex activation and mitotic exit.43,44 While TRIP13 overexpression has been associated with poor prognosis in several cancer types through mechanisms involving chromosomal instability and drug resistance, 45 its prognostic direction in OC may reflect subtype-specific or treatment context-dependent effects. It is plausible that in the TCGA ovarian serous cystadenocarcinoma cohort, elevated TRIP13 expression is associated with a degree of mitotic checkpoint resolution that correlates with platinum sensitivity rather than aggressive disease progression. This represents a biologically meaningful hypothesis that warrants further mechanistic investigation in dedicated experimental models and independent clinical cohorts.
The 18 downregulated hub genes that also emerged from the PPI network analysis represent two functionally distinct subgroups whose suppression in OC reflects complementary aspects of normal ovarian tissue biology. The first comprises a metabolic enzyme cluster anchored by alcohol dehydrogenases (ADH1B, ADH1C), aldehyde dehydrogenases (ALDH1A1, ALDH1A3), monoamine oxidases (MAOA, MAOB), and AOX1, all of which participate in xenobiotic detoxification, retinol catabolism, and cellular redox homeostasis. The near-complete loss of expression observed for ADH1B and MAOA in tumor tissue is consistent with previously reported downregulation of these enzymes in OC, where their suppression has been interpreted as reflecting an impairment of normal detoxification capacity and a disruption of oxidative metabolic regulation in malignant cells. 46 The second subgroup encompasses genes with established roles in angiogenesis, epithelial-mesenchymal transition, and extracellular matrix remodeling, including KDR, PDGFRA, SNAI2, CAV1, LYVE1, WNT5A, CDH11, and PDPN. Their downregulation relative to normal ovarian stromal tissue likely reflects fundamental reprogramming of the tumor microenvironment, wherein normal stromal regulatory architecture is disrupted to accommodate invasion and vascular remodeling.
Among the prognostic associations identified within the downregulated hub gene panel, FGF13 and LYVE1 were significantly associated with OS, while ALDH1A1, GATA6, and WNT5A showed statistically significant associations with DFS. High FGF13 expression correlated with improved OS, consistent with evidence that FGF13, a non-secreted member of the fibroblast growth factor family, may modulate microtubule stability and taxane sensitivity, thereby influencing chemotherapy response in OC. 47 High LYVE1 expression, in contrast, was associated with poorer OS, an observation that aligns with its established function as a lymphangiogenic marker whose upregulation facilitates lymphatic dissemination in solid tumors. 48 For DFS, ALDH1A1 was associated with improved recurrence-free intervals. This finding requires careful contextual interpretation, as an extensive body of literature has associated ALDH1A1 with cancer stem cell properties, platinum resistance, and inferior survival outcomes in OC49,50. The discrepancy may reflect subtype-specific effects, differences in cutoff methodology, or cohort-level heterogeneity in treatment exposure, and highlights the importance of prospective, subtype-stratified validation of ALDH1A1 as a prognostic marker. GATA6 was associated with shorter DFS intervals, consistent with its established role as a transcription factor that promotes tumor cell proliferation and invasion in OC. 51 WNT5A was associated with improved DFS, which is also consistent with evidence that WNT5A can function as a non-canonical WNT ligand with tumor-suppressive properties in gynecological cancers by antagonizing canonical WNT/β-catenin signaling 52 .
The clinicopathological association analyses revealed several patterns that warrant consideration, though these must be interpreted within the limitations of TCGA subgroup data, including unequal representation across demographic and clinical categories. Among the upregulated hub genes, 11 of 17 demonstrated significantly different expression between TP53-mutant and non-mutant samples, with CCNB1, KIF2C, MAD2L1, MCM4, and TOP2A showing the strongest associations. Given that TP53 mutation is the most prevalent somatic alteration in high-grade serous OC, occurring in over 96% of cases, and that TP53 loss is known to abrogate the G1/S checkpoint and unleash abnormal mitotic progression, 30 the strong co-occurrence of mitotic hub gene overexpression with TP53 mutant status substantiates the molecular coherence of the upregulated panel and suggests that these genes may function as downstream effectors of TP53-driven transcriptional dysregulation. Regarding the race and ethnicity analyses, the downregulated hub genes demonstrated substantially more population-stratified expression differences than the upregulated panel, with genes including ALDH1A1, CAV1, LYVE1, and PDGFRA showing significant differences between Caucasian and African American patients. These represent exploratory observations that, while preliminary and subject to the confounding effects of sampling imbalances, raise the possibility that genetic ancestry and population-specific regulatory variation may contribute to inter-individual differences in the OC transcriptome, a dimension that warrants further investigation in adequately powered, ethnically diverse cohorts.
Furthermore, diagnostic evaluation of the hub gene panel demonstrated strong discriminatory capacity across multiple analytical frameworks. Principal component analysis revealed robust separation between tumor and normal samples. Hierarchical clustering corroborated these findings, demonstrating consistent and directionally appropriate expression differences between tumor and normal tissue for all 35 hub genes. ROC analysis indicated that the downregulated hub gene panel achieved superior diagnostic performance in the primary analysis, with a mean AUC of 0.934 and individual top performers including KDR, FGF13, and ADH1B. The upregulated hub genes demonstrated more heterogeneous diagnostic performance in the primary analysis, with a mean AUC of 0.630 and several genes, including CDK1, MCM4, and PBK, yielding AUC values below 0.5. This observation is attributable, at least in part, to the biological ubiquity of these cell cycle genes across proliferating tissues, genes whose expression is not exclusive to malignant cells and whose discriminatory power is therefore inherently constrained when evaluated against normal ovarian epithelial samples that retain baseline proliferative activity. Consequently, the low AUC values observed for these genes in the primary analysis reflect a context-specific limitation of the analytical framework rather than an absence of biological relevance to OC, a distinction substantiated by their significant associations with disease stage and TP53 mutation status reported in this study.
External validation of the hub genes’ discriminatory performance using the independent external cohort substantially addressed concerns regarding the potential inflation of diagnostic metrics arising from performing ROC analysis on the same datasets used for hub gene identification. For the upregulated hub gene panel, the mean AUC increased from 0.630 in the primary analysis to 0.938 in the external cohort, with seven genes, CCNB2, KIF2C, KIF20A, TOP2A, TTK, UBE2C, and ZWINT, achieving complete discrimination between tumor and normal samples. This improvement in diagnostic performance in an independent cohort argues strongly against overfitting, as inflated primary findings would be expected to deteriorate rather than improve upon external validation, suggesting that the discriminatory capacity of the upregulated hub genes was consistent with a true diagnostic signal rather than dataset-specific analytical noise. For the downregulated hub gene panel, the external validation yielded a mean AUC of 0.742, representing an expected degree of performance attenuation consistent with natural variation in biomarker performance across independent patient cohorts with differing compositions. Within this panel, ALDH1A3, ALDH1A1, and ADH1B maintained excellent diagnostic performance, while the remaining genes demonstrated moderate to good discriminatory capacity. Collectively, the external validation results confirm the generalizability of the identified hub gene panel and provide compelling evidence that the diagnostic findings reported in the primary analysis reflect genuine discriminatory capacity rather than analytical overfitting.
Limitations
Several limitations of the present study merit acknowledgment. The analysis is entirely computational, relying on publicly available microarray and TCGA datasets, and the biological roles of the identified hub genes have not been experimentally confirmed. Functional validation through cell line studies, animal models, and protein-level assays such as immunohistochemistry and proteomics is necessary before any of the identified candidates can be considered for further investigational study. The normal reference samples across the four GEO datasets are limited to 38 samples in total and represent ovarian surface epithelial tissue collected in the context of cancer studies, which may not fully capture the transcriptional profile of healthy ovarian tissue. This tumor-to-normal sample imbalance could introduce bias in both differential expression detection and ROC-based diagnostic evaluation, and should be considered when interpreting the reported AUC values. The TCGA dataset employed for survival and clinicopathological analyses is composed predominantly of late-stage, high-grade serous OC cases with no Stage I representation, which precludes any inference regarding the expression behavior of the identified hub genes in early-stage disease, a dimension of particular clinical relevance given the known association between early detection and improved survival outcomes in OC. The demographic and clinicopathological subgroup analyses are exploratory in nature and are subject to the inherent limitations of TCGA data, including unequal subgroup sizes, limited statistical power in smaller demographic categories, and potential confounders, which include treatment history and sample collection heterogeneity. Thus, these findings should not be interpreted as definitive clinical associations without prospective validation in adequately powered and ethnically diverse cohorts. Finally, the prognostic associations identified in this study, while statistically significant, are based on median expression cutoffs applied to a single TCGA cohort comprising predominantly advanced-stage disease, and their clinical reproducibility requires confirmation in multi-institutional survival datasets with diverse disease stages, standardized treatment protocols, and long-term follow-up data
Conclusion and future perspectives
This study employed an integrated multi-dataset gene expression profiling and network-based bioinformatics approach to identify a panel of 35 hub genes with potential diagnostic and prognostic relevance in OC. The identified hub genes reflect two molecularly distinct aspects of OC pathology: aberrant activation of mitotic and cell cycle regulatory programs, and suppression of metabolic, angiogenic, and extracellular matrix homeostatic functions. Survival analysis identified TRIP13, FGF13, and LYVE1 as candidate prognostic biomarkers for OS, while ALDH1A1, GATA6, and WNT5A demonstrated significant associations with DFS. KDR emerged as the top-performing individual diagnostic biomarker, and external validation in the independent external cohort confirmed the generalizability of the diagnostic findings. These results, while exploratory and computationally derived, provide a biologically grounded molecular framework that may inform future biomarker development in OC. Prospective validation in independent, demographically diverse clinical cohorts, protein-level confirmation, and functional characterization in experimental models are essential next steps toward establishing the translational utility of the identified candidates. The integration of this hub gene panel with existing clinical biomarkers and its potential adaptation for liquid biopsy platforms represent promising directions for future investigation that could contribute to improved molecular detection and risk stratification in OC.
Footnotes

Ethical considerations
There are no human participants in this article and informed consent is not required.
Consent to participate
This study did not involve human participants or animal experiments, and all data used were publicly available.
Consent for publication
The manuscript does not contain any person’s data, images, or personal information.
Author contributions
Funding
The authors received no financial support for the research, authorship, and/or publication of this article.
Declaration of conflicting interests
The authors declared no potential conflicts of interest with respect to the research, authorship, and/or publication of this article.