






Abstract
Importance:
Type I tympanoplasty restores hearing in patients with simple tympanic membrane (TM) perforations, but reliable tools to predict postoperative outcomes remain limited.
Objective:
To develop and evaluate a deep learning-assisted model integrating automated TM image features and clinical data to predict postoperative air-bone gap (ABG) closure and residual ABG.
Design:
Diagnostic and prognostic model development and validation study.
Setting:
A tertiary referral medical center in northern Taiwan.
Participants:
A total of 1285 otoendoscopic images were collected, of which 1014 intact and 150 perforated TMs were used to train the mask region-based convolutional neural network (Mask R-CNN) segmentation model. Prognostic analysis included 121 patients with simple perforations and anatomically successful type I tympanoplasty (complete TM closure), with 83 preoperative images for training and 38 for independent internal testing. Demographic, clinical, and audiometric data were recorded.
Intervention or Exposures:
Automated image features extracted by Mask R-CNN, combined with clinical and audiometric variables, were used to develop prognostic models.
Main Outcome Measures:
Segmentation performance was evaluated using class pixel accuracy (CPA). Prognostic model performance was assessed using the coefficient of determination (R2), root mean square error (RMSE), mean absolute error, and predictive accuracy, defined as a predicted ABG within 10 and 5 dB of the measured value.
Results:
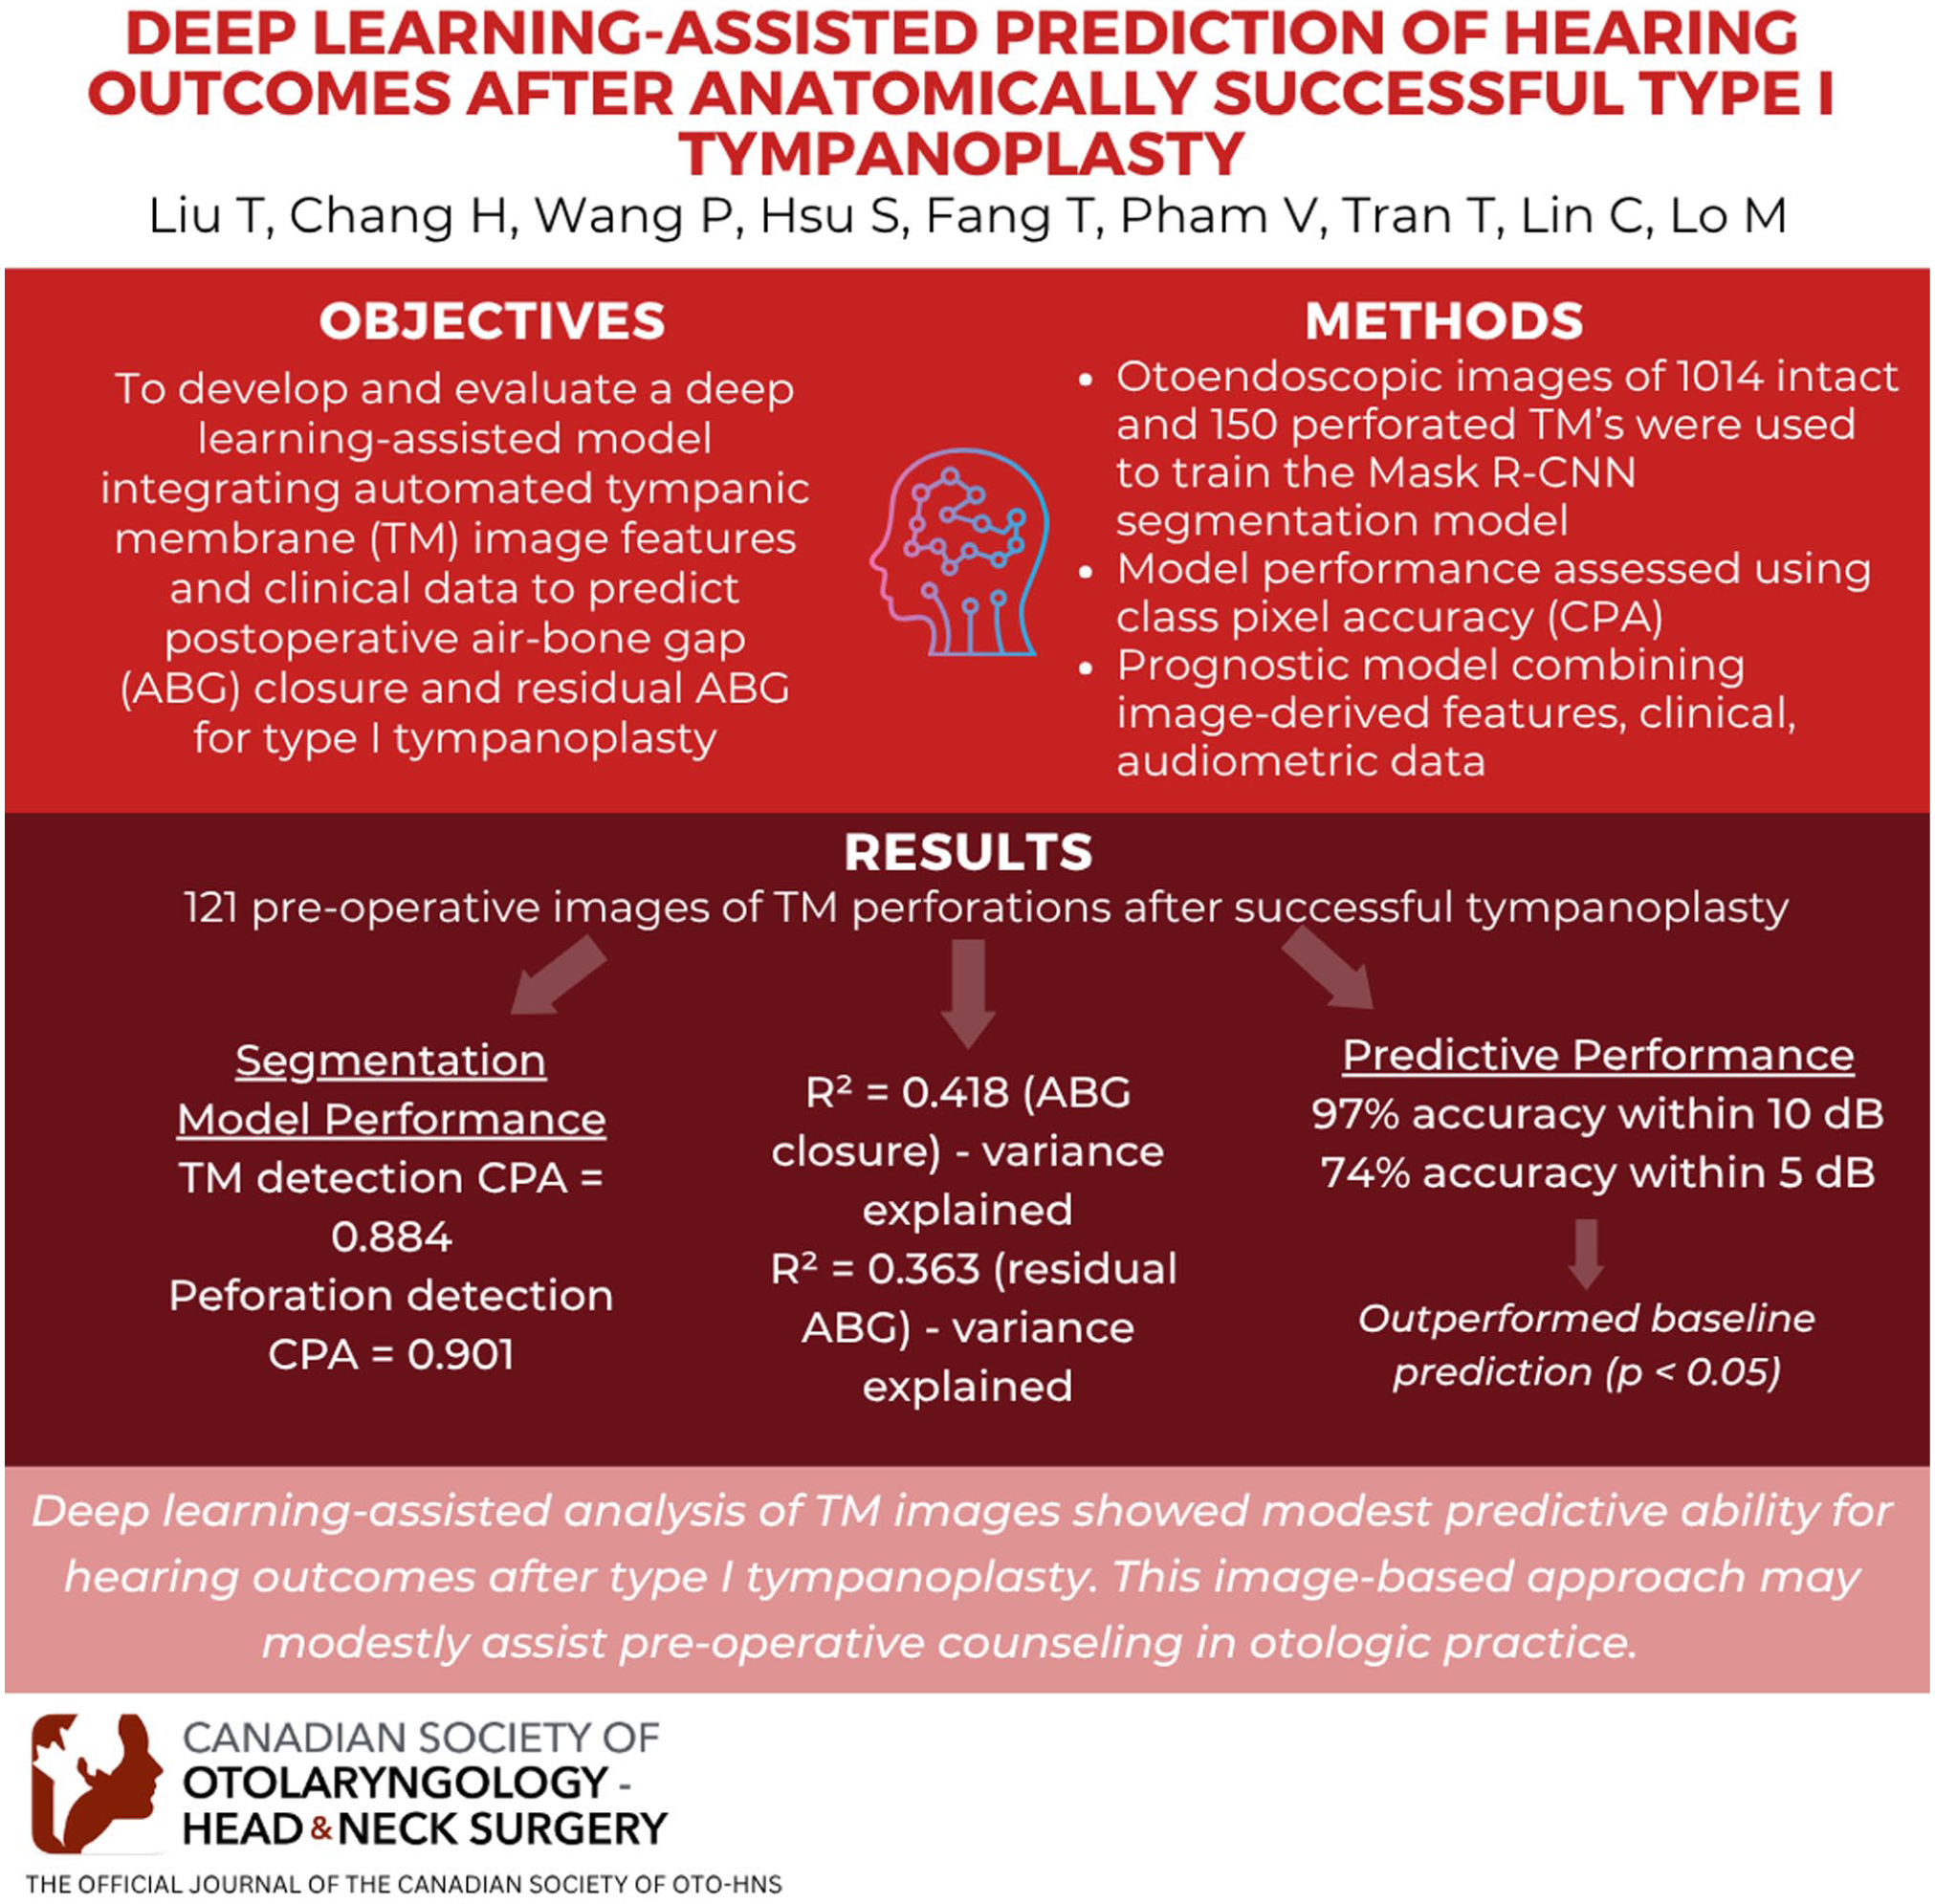
The segmentation model achieved a CPA of 0.884 for TM detection and 0.901 for perforation detection. The prognostic models yielded R2 values of 0.418 for ABG closure and 0.363 for residual ABG, with corresponding RMSEs of 4.39 and 4.36 dB. Prediction accuracy reached 97% within 10 dB and 74% within 5 dB, significantly outperforming baseline mean-value prediction (P < .05).
Conclusions:
Deep learning-assisted analysis of TM images showed modest predictive ability for hearing outcomes after anatomically successful type I tympanoplasty.
Relevance:
This image-based approach may modestly assist preoperative counseling in otologic practice.
Keywords
Key Messages
A deep learning-assisted model integrating tympanic membrane (TM) image features and clinical data demonstrated modest predictive performance in an internally validated cohort.
In internal testing, the model achieved 97% accuracy within 10 dB and 74% within 5 dB, significantly outperforming baseline prediction.
This image-based approach may serve as a supportive prognostic adjunct for preoperative counseling in patients with simple TM perforations.
Introduction
Tympanic membrane (TM) perforation is a common otologic condition that frequently arises from chronic otitis media, trauma, or iatrogenic causes. 1 Disruption of TM integrity leads to impaired transmission of sound energy to the ossicular chain, resulting in conductive hearing loss. Type I tympanoplasty remains the primary surgical approach for TM repair, aiming to reestablish TM continuity and improve auditory function. Although most patients experience postoperative hearing improvement, the degree of improvement differs substantially across cases,2-8 and no reliable preoperative predictors have been consistently identified. 9 Developing accurate and objective methods for preoperative prediction of hearing outcomes could improve shared decision-making and guide personalized surgical planning.
Although numerous demographic and clinical variables—including age, sex, mastoid pneumatization, middle ear mucosal status, and disease etiology—have been evaluated as potential prognostic indicators, none have shown consistent predictive value for postoperative hearing outcomes. 9 Among these, the preoperative air-bone gap (ABG) has emerged as one of the most important predictors, with larger preoperative ABG frequently associated with greater residual postoperative deficits. Additionally, increasing patient age has been correlated with reduced postoperative hearing improvement. 10
Geometric characteristics of TM perforations may offer additional prognostic utility. Prior studies have suggested that larger perforation areas are associated with greater postoperative ABG, 7 and 1 prospective study reported that central or subtotal perforations were linked to more hearing gains following tympanoplasty. 11 These image-derived features are noninvasively obtainable from standard otoscopic images and provide continuous, quantitative data that may outperform traditional categorical predictors in assessing surgical outcomes.
Currently, preoperative evaluation of hearing prognosis largely depends on clinicians’ subjective visual assessment of TM appearance. Incorporating quantitative image features into outcome prediction could provide a more objective and reproducible basis for preoperative counseling and surgical planning. Importantly, these image-based features can now be automatically extracted using artificial intelligence (AI), particularly deep learning approaches that have shown strong performance in medical image analysis.12-14 Convolutional neural networks (CNNs) have demonstrated high performance in image classification and object detection, and have been increasingly applied to the diagnosis of otologic diseases using digital otoscopic images.15-24 The mask region-based CNN (Mask R-CNN) algorithm is especially notable for enabling automated segmentation of TM structures. Mask R-CNN provides detailed spatial information, including the boundaries of the TM, perforation regions, and relevant middle ear landmarks25-29—offering a powerful tool for both clinical assessment and outcome prediction.
The objective of this study was to develop and evaluate a deep learning-assisted image analysis model that incorporates geometric features of TM perforations to predict postoperative hearing outcomes in patients with simple TM perforations undergoing tympanoplasty.
Study Design and Data Set
This study consisted of 2 major components: (1) development of a deep learning-based segmentation model to automatically extract TM and perforation features and (2) construction and validation of Elastic Net penalized regression models integrating image-derived and clinical variables to predict postoperative hearing outcomes.
This diagnostic and prognostic study was conducted at a tertiary medical center in northern Taiwan, with data collected from January 2020 to May 2024. A total of 1285 otoendoscopic images were obtained, of which 1164 de-identified outpatient images including 1014 intact and 150 perforated TMs from patients who had not undergone tympanoplasty—were used for development of the deep learning segmentation model. These images were randomly divided into training, validation, and test sets in an 8:1:1 ratio (932 training, 116 validation, and 116 testing images). The remaining 121 preoperative otoendoscopic images were collected from patients with simple TM perforations who achieved anatomically successful type I tympanoplasty (complete TM closure) and were used for prognostic modeling.
The prognostic model was based on data from these 121 patients with simple TM perforations who underwent successful type I tympanoplasty using an endoscopic transcanal approach. The procedure involved elevation of a tympanomeatal flap to evaluate the middle ear cavity and ossicular chain, followed by underlay grafting with autologous tragal perichondrium. All patients achieved complete TM closure postoperatively. For prognostic analysis, 83 preoperative images acquired intraoperatively were used for model training, and 38 outpatient-acquired images were reserved for testing, ensuring no patient-level overlap with the segmentation dataset (Supplemental eFigure 1). Preoperative data included endoscopic images of the perforated TM as well as pure-tone audiometry (PTA). Postoperative assessments included PTA and tympanometry. All patients had no otorrhea, myringitis, or tobacco use for at least 3 months prior to surgery. Medical records were reviewed to extract demographic and clinical information. Exclusion criteria included prior ear surgery, microtia, otosclerosis, cholesteatoma, superior semicircular canal dehiscence, preoperative ABG >30 dB (suggestive of underlying middle ear pathology beyond simple perforation), and pinhole-sized perforations, defined as involving <1% of the total TM area. This study was approved by the Institutional Review Board of Cathay General Hospital (IRB no CGH-P113003). The workflow of deep learning-assisted prediction and clinical integration is presented in Figure 1. The overall workflow was semi-automated. TM and perforation segmentation were performed automatically using a deep learning model, while manual input was limited to identification of the lateral process of the malleus and annotation of ear laterality (left vs right) for landmark-based measurements. This manual step required ~3 to 5 seconds/image and was performed by a trained otologist. Because the manual input was limited to a single anatomical landmark and ear laterality, the impact on workflow reproducibility was considered minimal (Figure 2).

Workflow of deep learning-assisted prediction and clinical integration. Mask R-CNN, mask region-based convolutional neural network; PTA, pure tone audiometry; ABG, air-bone gap; AI, artificial intelligence.
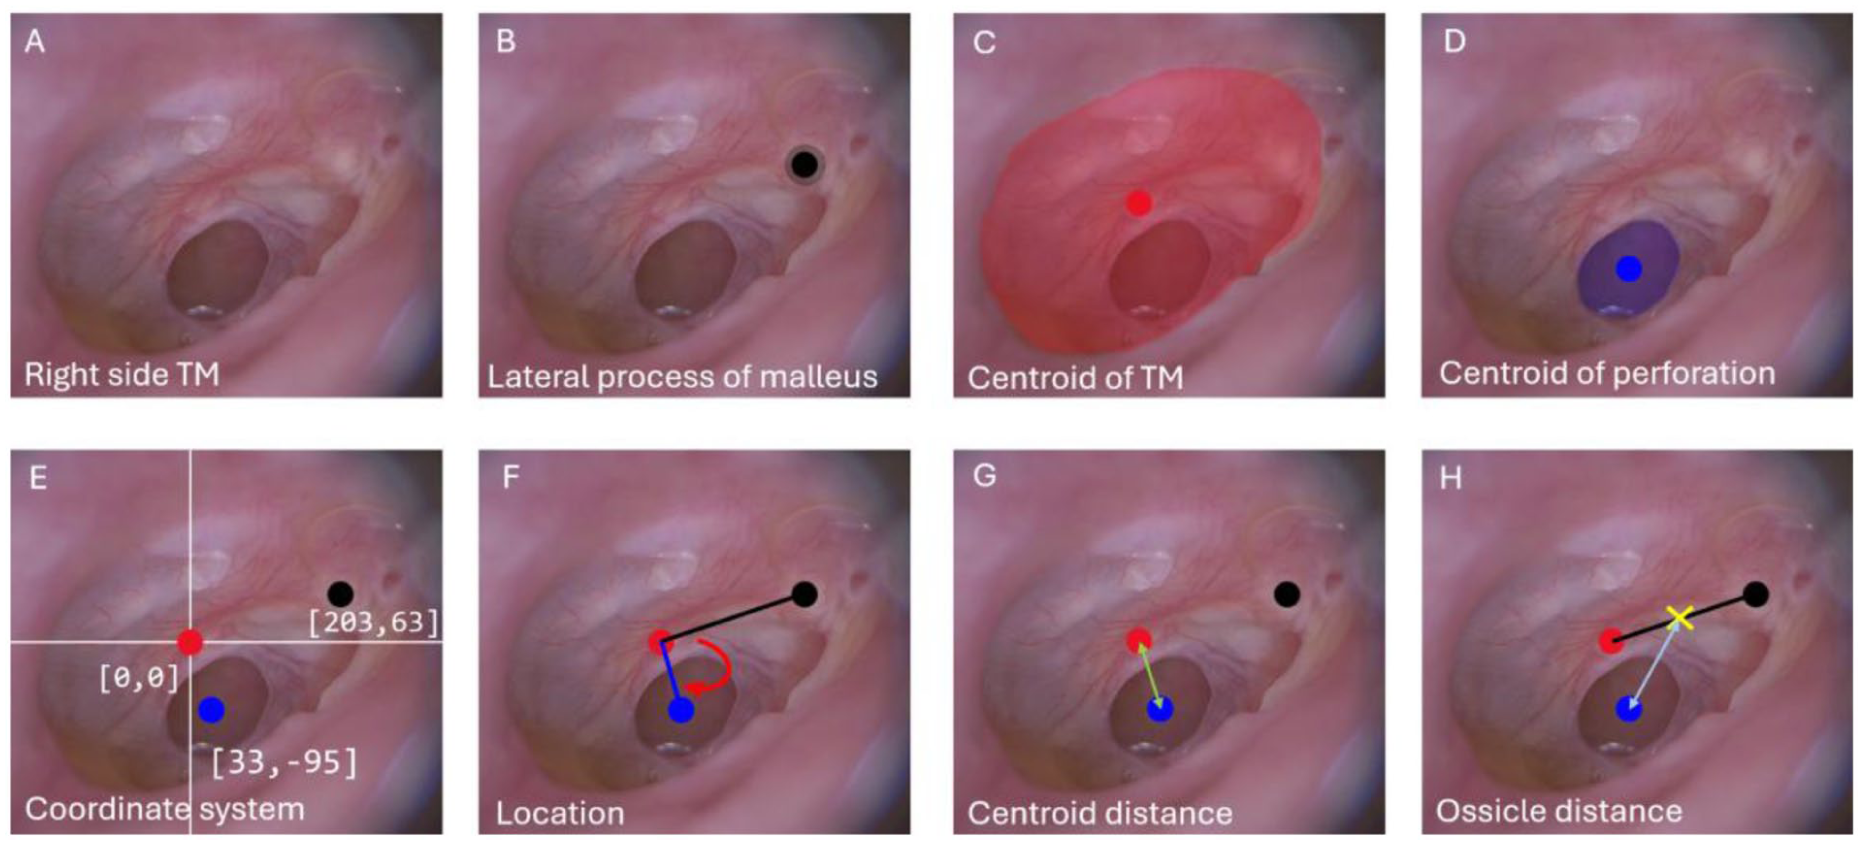
Geometric feature extraction of TM and perforation. (A) Endoscopic image of a right TM. (B) Identification of the lateral process of the malleus (black dot). (C) Segmentation and centroid calculation of the TM (red area and dot). (D) Segmentation and centroid of the perforation (blue area and dot). (E) Coordinate system establishment with the TM centroid set as the origin. (F) Perforation angle defined as the angle between the vector from the TM centroid to the lateral process of the malleus and the reference vector from the TM centroid to the perforation centroid. (G) Centroid distance: linear distance between TM and perforation centroids (green line). (H) Ossicle distance defined as the linear distance from the perforation centroid to malleus (black line); the yellow cross indicates the midpoint between the TM centroid and the malleus, indicating the relative position of the malleus on TM. TM, tympanic membrane.
Audiometric Assessment and Image Acquisition
PTA was conducted at frequencies of 500, 1000, 2000, and 4000 Hz to assess hearing thresholds, including both air and bone conduction. The average ABG across these 4 frequencies was calculated for analysis. Postoperative audiometric data were obtained primarily between 2 and 12 months after surgery. Each patient contributed a single postoperative data point, representing the most recent audiogram available; in cases with multiple postoperative tests, the latest stable audiogram was selected to best reflect the final hearing outcome. ABG closure was defined as preoperative ABG − postoperative ABG, where positive values indicate improvement in hearing (reduction in ABG). ABG closure and postoperative ABG represent related but clinically distinct endpoints: ABG closure reflects the magnitude of hearing improvement following surgery, whereas postoperative ABG reflects the residual conductive deficit and final functional hearing status.
Otoscopic images were obtained by otologists using an EOC 700 digital otoscope or a rigid otoendoscope (0°, 4 mm, 18 cm; Karl Storz SE & Co. KG, Tuttlingen, Germany) in the outpatient department (OPD), and a smaller otoendoscope (0°, 3 mm, 14 cm; Karl Storz SE & Co. KG, Tuttlingen, Germany) in the operating room. All images were stored in JPEG format with resolutions ranging from 512 × 512 to 1080 × 1080 pixels. Only high-quality images were included, defined as those clearly visualizing at least 95% of the TM surface, with identifiable landmarks such as the lateral process of the malleus, and full coverage of both the pars flaccida and pars tensa under standard white light illumination. Selection followed predefined quality criteria, and if multiple images met these criteria, the image demonstrating the clearest visualization of the TM and key anatomical landmarks was used.
Image Annotation and Feature Extraction
Manual annotation of TM structures was performed using Label Studio (HumanSignal, San Francisco, CA, USA), focusing on 3 key features: the TM boundary, the perforation area, and the lateral process of the malleus. To represent spatial anatomical relationships, a polar coordinate system was established, with the TM centroid defined as the origin (0, 0) and a reference axis drawn from the centroid to the lateral process of the malleus. The ossicle position was defined as the midpoint between these 2 landmarks. Based on these annotations, 4 quantitative features were extracted: (1) perforation ratio, calculated as the area of the perforation divided by the total TM area; (2) normalized centroid distance, defined as the distance from the perforation centroid to the TM centroid, normalized by the square root of the TM area; (3) normalized ossicle distance, defined as the distance from the perforation centroid to the ossicle position, also normalized by the square root of the TM area; and (4) perforation location, defined as the angular position of the perforation centroid relative to the polar axis, with 0° to 180° classified as anterior and 180° to 360° as posterior. Ear laterality (left vs right) was manually annotated, and the angular reference was adjusted accordingly (clockwise or counterclockwise) to ensure a consistent anatomical definition of anterior and posterior location across ears (Supplemental eMethods 1).
Development of Feature-Based Regression Model
Predictive modeling was performed using Elastic Net penalized regression to avoid overfitting and account for potential collinearity among predictors. Elastic Net was chosen over more complex nonlinear models to balance bias-variance tradeoff in a modest sample size and to preserve interpretability for clinical translation. Seven variables were included: preoperative ABG (modeled with both linear and quadratic terms), patient age, and 4 extracted geometric features of the TM. Postoperative hearing outcomes were modeled using Elastic Net penalized regression to address the modest sample size, with nested cross-validation (CV) and bootstrap resampling applied to mitigate overfitting and calibration evaluated using calibration slope and intercept.
Model training was conducted using 83 preoperative images acquired in the operating room, and model evaluation was performed on an independent internal test set of 38 outpatient-acquired images from the same institution, representing a distinct imaging environment. Nested CV was used for both ABG closure and postoperative ABG prediction during model development to ensure robust hyperparameter tuning and minimize overfitting.
Model performance was quantified using root mean square error (RMSE), mean absolute error (MAE), the coefficient of determination (R2), and Bland-Altman analysis to evaluate measurement agreement and potential systematic bias. Calibration was assessed using calibration slope and intercept. To further correct for small-sample optimism, bootstrap resampling with 1000 iterations was applied to obtain bias-adjusted RMSE values and corresponding 95% confidence intervals. We also provide the proportions of predictions falling within ±5 and ±10 dB, consistent with audiometric tolerance thresholds routinely applied in clinical practice.
To evaluate the incremental contribution of image-derived geometric features, 3 Elastic Net model specifications were compared: Full Model, including all 7 predictors; Reduced Model-ABG, including only the preoperative ABG linear and quadratic terms; and Reduced Model-ABG + AGE, including preoperative ABG and age.
Multicollinearity was assessed using variance inflation factors (VIFs), which confirmed the absence of concerning collinearity among the geometric predictors. The final coefficients of the Elastic Net models for both postoperative ABG and ABG closure are provided in the Supplemental eTable 1.
Deep Learning-Assisted Segmentation and Automated Feature Extraction of the TM
To enable automated extraction of TM features, a deep learning model based on a Mask R-CNN was developed to segment both the TM and perforation areas, building on a previously validated Mask R-CNN architecture established by our laboratory 30 (Supplemental eMethods 2). Segmentation performance was evaluated using standard metrics, including the Dice coefficient, intersection over union (IoU), mean IoU, pixel accuracy (PA), class PA (CPA), and mean PA. The lateral process of the malleus was not included in the automated segmentation because this fine anatomical structure cannot yet be reliably detected by current models. A total of 83 preoperative images of perforated TMs in the operating room were used as an independent internal test set. The TM features extracted by the Mask R-CNN model were used as inputs to the regression models developed in this study to predict ABG closure and postoperative ABG. Overall workflow of the deep learning-based segmentation and prognosis prediction pipeline is shown in Supplemental eFigure 2.
Statistical Analysis and Experimental Equipment
All statistical analyses were performed using MATLAB R2021b (MathWorks, Natick, MA, USA). Categorical variables were compared using the χ2 test or Fisher exact test, as appropriate. Continuous variables were compared using the Kruskal-Wallis rank-sum test. A 2-sided P < .05 was considered statistically significant. To compare model performance, paired t-tests were used to assess the statistical significance of differences in RMSE between predictive models. All deep learning experiments were implemented in Python (version 3.6.13) using Keras (version 2.1.6) with a TensorFlow backend (version 1.15.0). Model training was conducted on a dedicated workstation equipped with 4 Tesla V100-DGXS-32GB GPUs, with 1 GPU allocated/training session. The 32 GB GPU memory capacity enabled efficient processing of high-resolution otoendoscopic images and computationally intensive training procedures. This study adhered to the TRIPOD-AI reporting guideline, and the completed checklist is provided in the Supplemental eTable 2.
Results
The results are presented in 2 parts: first, the performance of the segmentation model was evaluated to ensure the reliability of automatically extracted image features; second, these features were used to develop and validate Elastic Net penalized regression models for predicting postoperative hearing outcomes.
Patient Characteristics and Image Parameters
A total of 121 patients with simple TM perforations who achieved complete closure after tympanoplasty were included, comprising 83 preoperatively acquired images from the operating room (OR group) and 38 outpatient-acquired images from the outpatient department (OPD group). Patient demographics are presented in Table 1. There were no significant differences in laterality, sex distribution, age, or audiometric outcomes between the 2 groups. Mean (SD) age was 54.1 (17.9) years in the OR group and 54.7 (18.0) years in the OPD group (P = .865). Preoperative and postoperative ABG values were comparable between groups [pre-ABG: 17.3 (7.2) vs 19.1 (6.6) dB; P = .180; post-ABG: 8.7 (5.9) vs 8.8 (5.5) dB; P = .928], as was the mean ABG closure [8.5 (6.3) vs 10.2 (5.8) dB; P = .149]. No significant differences were observed in geometric features, including perforation ratio, normalized centroid distance, proportion of anteriorly located perforations, or normalized ossicle distance.
Baseline Demographic and Clinical Characteristics.
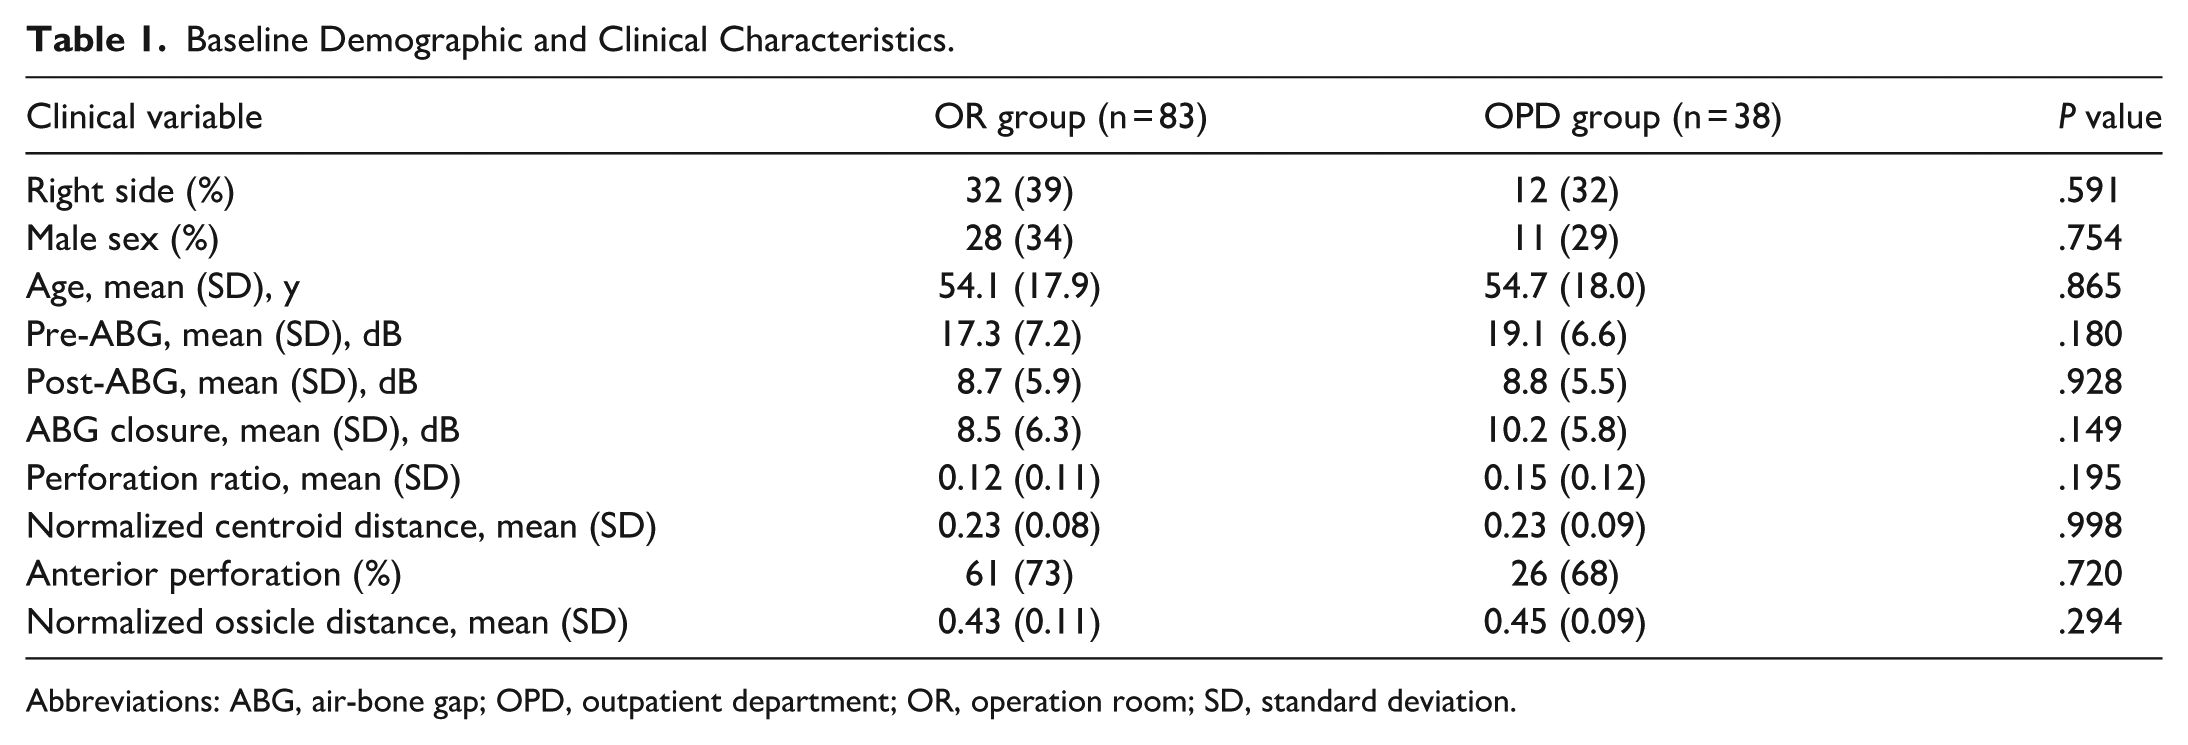
Abbreviations: ABG, air-bone gap; OPD, outpatient department; OR, operation room; SD, standard deviation.
Predictors of ABG Closure and Postoperative Hearing Outcomes
Among 6 individual predictors—age, preoperative ABG, perforation ratio, normalized centroid distance, normalized ossicle distance, and perforation location—Pearson correlation analysis demonstrated that preoperative ABG (Pearson product-moment correlation coefficient (PPMCC) = 0.626; P < .001) and perforation ratio (PPMCC = 0.369; P < .01) were significantly associated with ABG closure. For postoperative ABG, significant correlations were observed with both age (PPMCC = 0.309; P = .004) and preoperative ABG (PPMCC = 0.544; P < .001).
Segmentation Performance for TM and Perforation
Segmentation performance was evaluated using Dice, IoU, and CPA. For TM segmentation, Dice coefficients were 0.885 (outpatient) and 0.875 (intraoperative), with corresponding IoU values of 0.715 and 0.701 and CPA values of 0.882 and 0.884. Perforation segmentation demonstrated similar performance, with Dice coefficients of 0.904 and 0.919, IoU values of 0.742 and 0.791, and CPA values of 0.863 and 0.901 for outpatient and intraoperative images, respectively (Supplemental eTable 2 and eFigure 3).
CV Performance (Training Set, n = 83)
The predictive performance of the Elastic Net regression models is summarized in Table 2. For ABG closure, the Full Model (including all 7 predictors) achieved a nested-CV RMSE of 4.95 dB and an R2 of 0.454. The Reduced Model-ABG, which included only preoperative ABG (linear and quadratic terms), showed lower predictive performance (RMSE 5.04 dB, R2 0.360). Adding age modestly improved performance (RMSE 4.89 dB, R2 0.399). Bootstrap optimism-corrected RMSE ranged from 5.07 to 5.20 dB across models.
Predictive Performance of Elastic Net Models for ABG Closure and Postoperative ABG.
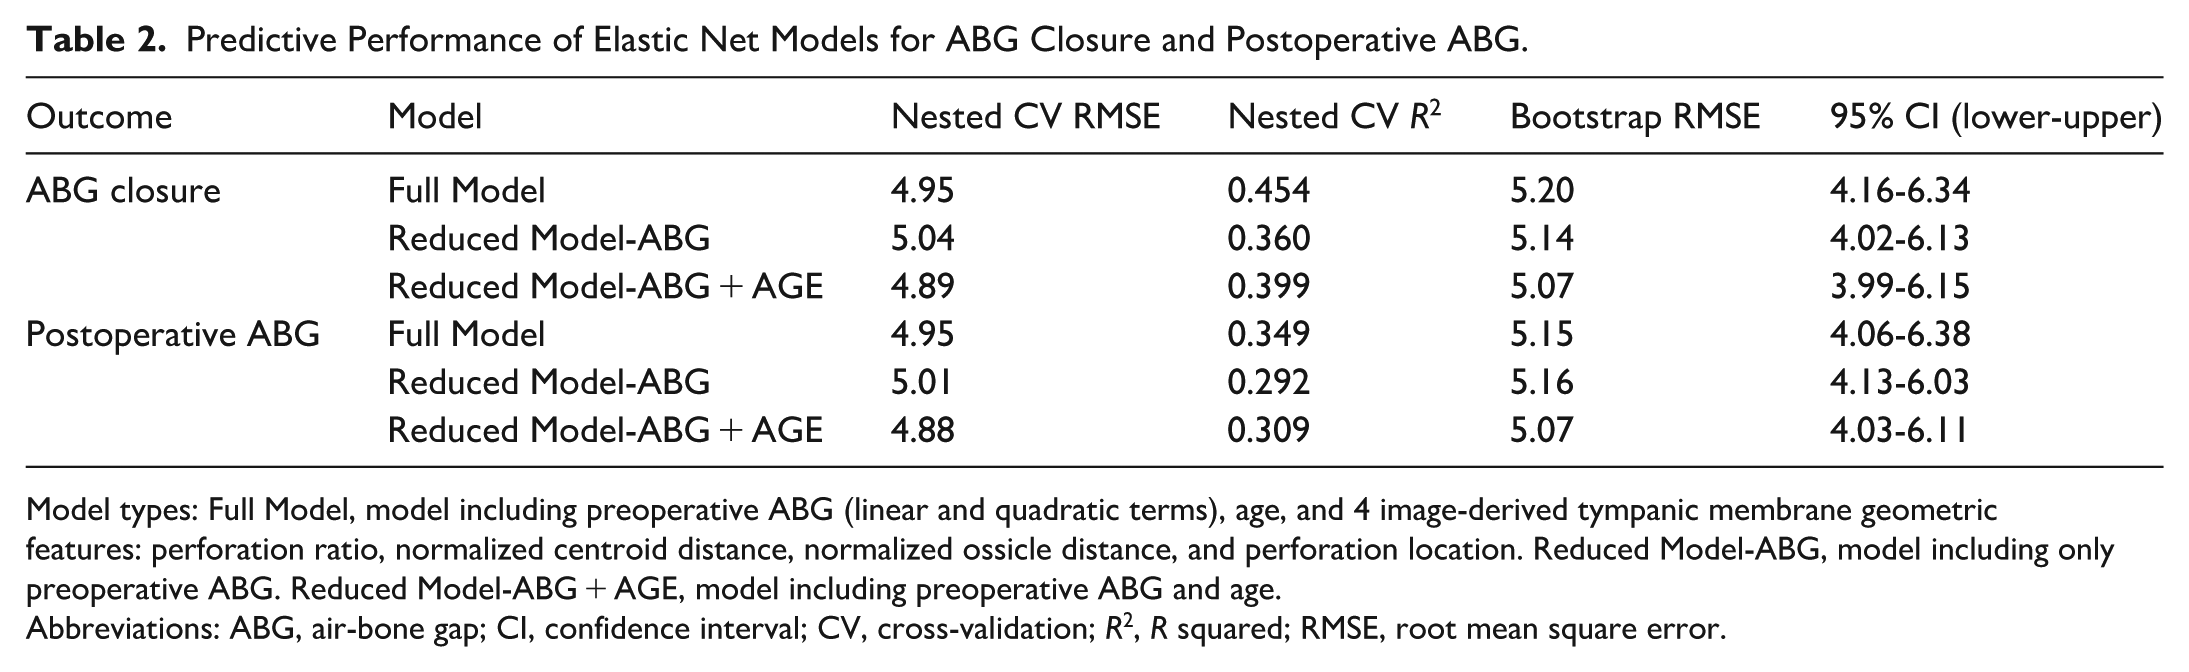
Model types: Full Model, model including preoperative ABG (linear and quadratic terms), age, and 4 image-derived tympanic membrane geometric features: perforation ratio, normalized centroid distance, normalized ossicle distance, and perforation location. Reduced Model-ABG, model including only preoperative ABG. Reduced Model-ABG + AGE, model including preoperative ABG and age.
Abbreviations: ABG, air-bone gap; CI, confidence interval; CV, cross-validation; R2, R squared; RMSE, root mean square error.
For postoperative ABG, a similar pattern was observed. The Full Model yielded a nested-CV RMSE of 4.95 dB and an R2 of 0.349, whereas the Reduced Model-ABG performed worse (RMSE 5.01 dB, R2 0.292). Incorporating age again improved performance modestly (Reduced Model-ABG + AGE: RMSE 4.88 dB, R2 0.309). Bootstrap RMSEs ranged from 5.07 to 5.16 dB. Bland-Altman and calibration analyses are presented in the Supplemental eFigures 4 and 5. Both normalized ossicle distance and normalized centroid distance exhibited low multicollinearity (VIF = 2.05 and 2.07, respectively).
Independent Internal Test Performance (Testing Set, n = 38)
Performance on the independent internal test set (n = 38) is summarized in Table 3. For ABG closure prediction, the Elastic Net model achieved an R2 of 0.418, an RMSE of 4.39 dB, and an MAE of 3.41 dB, with 97% of predictions within ±10 dB and 74% within ±5 dB of the measured values. The Mask R-CNN-assisted Elastic Net model demonstrated similar performance (R2 0.421, RMSE 4.38 dB, MAE 3.38 dB), and both approaches outperformed the mean-value baseline (R2 = 0.000; RMSE 6.02 dB; MAE 4.76 dB). For postoperative ABG prediction, the Elastic Net model yielded an R2 of 0.363, RMSE 4.36 dB, and MAE 3.35 dB, again achieving 97% accuracy within ±10 dB and 74% within ±5 dB. The Mask R-CNN-assisted model performed comparably (R2 0.366, RMSE 4.35 dB, MAE 3.32 dB) and exceeded the baseline predictor (RMSE 5.47 dB, MAE 4.61 dB, 53% within ±5 dB). Additional visual analyses, including the distributions of preoperative and postoperative ABG and ABG closure by perforation size quartiles, predicted-versus-observed scatter plots, calibration plots, and decision curve analysis, are provided in the Supplemental eFigures 6 to 9. Calibration analysis showed a slope of 1.02 with an intercept of 0.57 for ABG closure prediction, and a slope of 0.38 with an intercept of 6.22 for postoperative ABG prediction. Decision-curve analysis across threshold probabilities of 0.1 to 0.6 showed positive net benefit for predicting postoperative ABG ≤10 dB compared with treat-all and treat-none strategies.
Performance Metrics of Prediction Models for ABG Closure and Postoperative ABG.
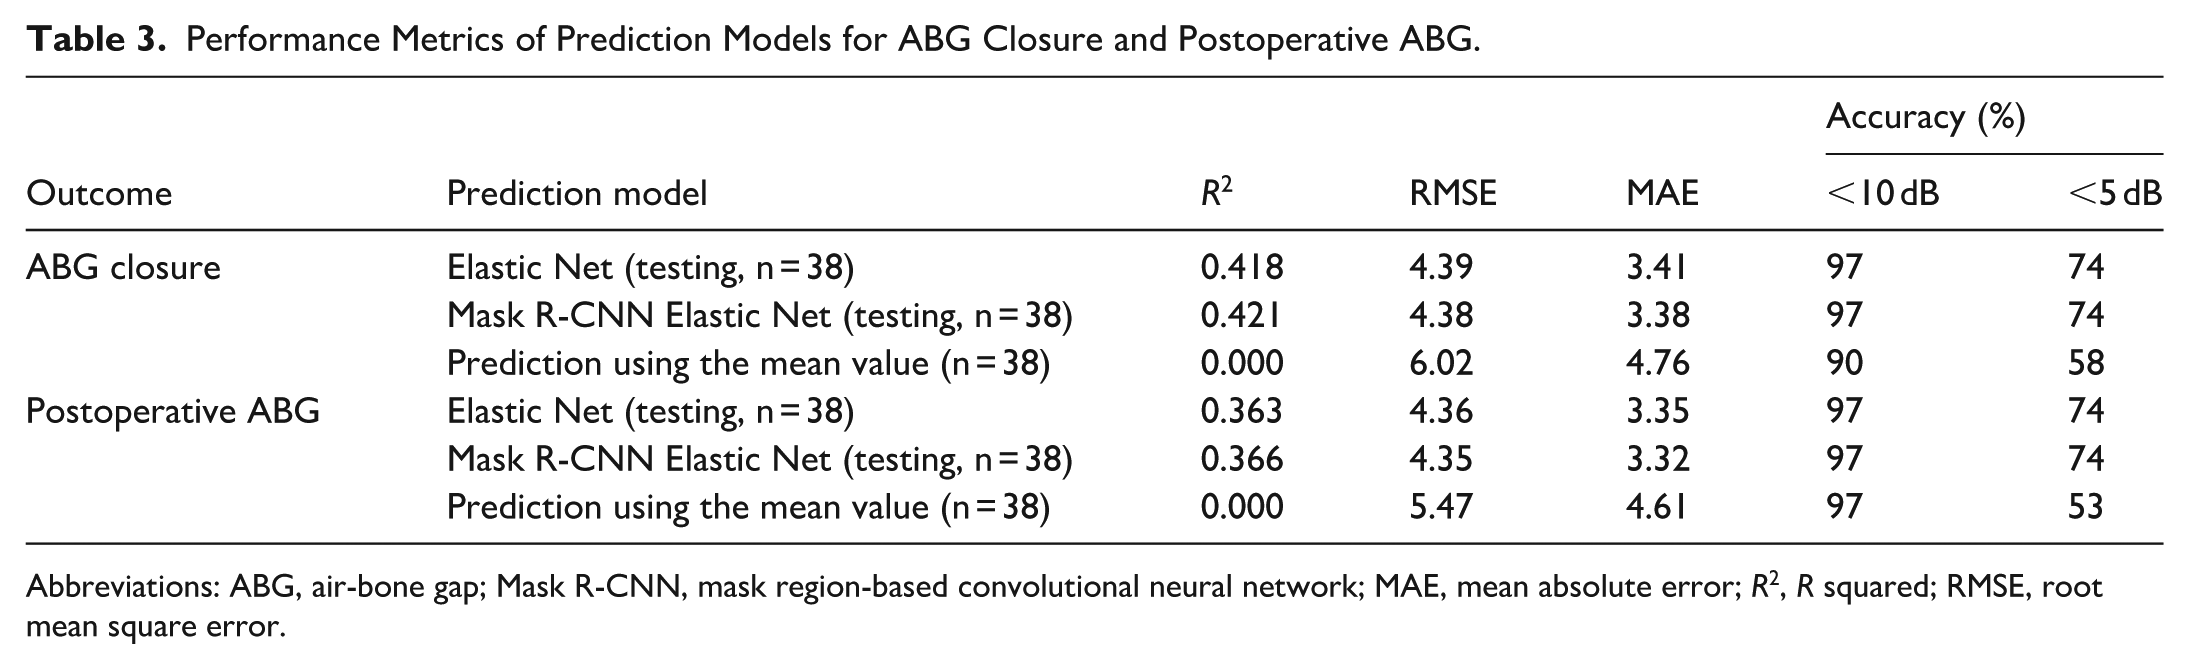
Abbreviations: ABG, air-bone gap; Mask R-CNN, mask region-based convolutional neural network; MAE, mean absolute error; R2, R squared; RMSE, root mean square error.
Discussion
From a clinical perspective, an RMSE of ~4.4 dB is within a single standard audiometric test step (5 dB) and comparable to routine test-retest variability, supporting the model’s use for preoperative counseling and expectation setting rather than precise individual prediction. Further automation of landmark detection could reduce operator dependency; however, full automation was not implemented in the present study because accurate localization of the malleus lateral process remains technically challenging.
This study demonstrates the feasibility of integrating deep learning-based TM segmentation with regression modeling to estimate postoperative hearing outcomes after type I tympanoplasty. The Mask R-CNN model enabled automated extraction of TM and perforation geometry, and incorporation of these features into Elastic Net models resulted in modest predictive performance in an internally validated cohort. Although image-derived geometric features provided incremental improvements beyond preoperative ABG and age, their contribution was additive rather than transformative. Accordingly, the model should be interpreted as a supportive prognostic adjunct that complements, rather than replaces, established clinical assessment.
Although type I tympanoplasty is generally effective in improving conductive hearing, hearing outcomes are not always predictable. Previous studies, including those by Bewick and Prinsley, have reported that postoperative hearing deterioration is not uncommon, and no single preoperative factor consistently predicts which patients will benefit or worsen. 31 Berglund et al also found that, despite successful anatomic repair, some patients reported suboptimal hearing gains and dissatisfaction, highlighting the variability of outcomes and the importance of setting realistic expectations. 32
Several risk stratification tools, including the Middle Ear Risk Index (MERI) and the Ossiculoplasty Outcome Parameter Staging (OOPS), have been developed to integrate multiple prognostic variables.33,34 While MERI primarily aims to predict surgical success, OOPS incorporates ossicular chain status to better estimate hearing outcomes. However, both tools rely on intraoperative findings or computed tomography to assess ossicular integrity and place limited emphasis on TM-based parameters. In contrast, the present study highlights the prognostic value of geometric features of the TM, which can be automatically extracted from preoperative otoendoscopic images using deep learning-based segmentation. This image-based approach offers a practical, noninvasive, and readily accessible prognostic adjunct for patients with simple perforations.
Recent efforts have explored the role of AI and machine learning in predicting postoperative auditory outcomes. Koyama et al compared traditional scoring systems with machine learning classifiers (random forest, support vector machine, and k-nearest neighbors) and found that machine learning models outperformed MERI and OOPS in predicting postoperative ABG when incorporating variables such as clinical history, computed tomography findings, preoperative ABG, and TM image features. 10 De Chua et al applied a neural network and decision tree regression model using demographic and clinical predictors to estimate postoperative ABG in 125 cases, reporting RMSE values of 18.7 and 17.3 dB, respectively. 9 These studies confirm that data-driven models incorporating key features can improve predictive performance compared to empirical scoring systems, although their overall accuracy remains limited.
In contrast, deep learning does not require manually defined features and has also shown potential for outcome prediction. Zeng et al demonstrated the capability of deep learning to classify conductive hearing loss using TM images in cases of otitis media with effusion, achieving a classification accuracy of 81%. 35 These findings underscore the clinical relevance of subtle image-based cues—such as variations in color, contour, or translucency—that can be captured through CNNs. However, despite their promise, such models often lack explainability and are seldom externally validated, raising concerns about their generalizability. Collectively, prior studies have largely relied on handcrafted or intraoperative features, underscoring the need for an image-based approach that can noninvasively predict postoperative outcomes.
External validation is necessary to establish robustness and clinical applicability. The model was trained on intraoperative images and evaluated on outpatient-acquired images from the same institution; therefore, this represents internal validation across imaging environments rather than external validation across institutions or devices. Differences in equipment, illumination conditions, and image capture systems across hospitals may introduce domain shift and affect model performance. Accordingly, these findings should be considered preliminary and require confirmation in independent, multi-institutional cohorts to determine generalizability.
Building upon these advances, our model incorporates raw otoendoscopic images into an end-to-end deep learning pipeline, enabling automated segmentation, feature extraction, and outcome prediction. This streamlined workflow may facilitate rapid, reproducible, and objective assessment of TM morphology in clinical practice. From a clinical standpoint, the model’s modest yet meaningful predictive ability may help guide preoperative counseling, set realistic expectations, and promote shared decision-making. Future studies with larger, multi-institutional datasets and fully automated landmark detection are warranted to further improve model precision and generalizability.
Limitations and Future Studies
This study has several limitations. First, the prognostic model was developed from a modest single-institution cohort and focused solely on postoperative hearing outcomes; surgical success measures such as TM closure and graft integration were not evaluated, and external validation was not performed. Second, follow-up was limited to the short-term postoperative period, precluding assessment of long-term hearing stability. Third, only patients with simple TM perforations undergoing a standardized transcanal endoscopic type I tympanoplasty were included, which may limit generalizability to more complex pathologies or alternative surgical techniques. Fourth, the workflow was semi-automated: TM and perforation segmentation were automated, whereas identification of the malleus lateral process required manual annotation. Although normalization by TM area likely mitigates the impact of minor spatial deviations, inter-rater reliability and annotation time were not formally evaluated. Fifth, the segmentation dataset was imbalanced, and Dice and IoU performance for perforation masks were not stratified by size or anterior/posterior location. Sixth, postoperative audiometric testing was not uniformly timed, introducing potential temporal heterogeneity. Seventh, when multiple eligible images were available, the clearest image was selected, which may introduce selection bias toward optimally visualized cases and overestimate segmentation robustness under routine clinical conditions.
Future research should focus on building a comprehensive TM perforation image database to support model generalizability and scalability. Multicenter collaborations would enable external validation of the deep learning model across diverse patient populations, surgical techniques, and clinical environments. Incorporating additional imaging modalities, such as high-resolution computed tomography, may provide valuable anatomical information, including middle ear volume, to further enhance predictive accuracy. Furthermore, extension of the model to analyze video otoscopy could facilitate dynamic assessment of middle ear status and improve real-time clinical applicability.
Conclusions
A deep learning-based model integrating TM image features with clinical data showed modest predictive performance for hearing outcomes after anatomically successful type I tympanoplasty. This approach may serve as a supportive prognostic adjunct for preoperative counseling, though further validation in larger, multi-institutional cohorts is needed.
Supplemental Material
sj-docx-1-ohn-10.1177_19160216261450491 – Supplemental material for Deep Learning-Assisted Prediction of Hearing Outcomes After Anatomically Successful Type I Tympanoplasty
Supplemental material, sj-docx-1-ohn-10.1177_19160216261450491 for Deep Learning-Assisted Prediction of Hearing Outcomes After Anatomically Successful Type I Tympanoplasty by Te-Yi Liu, Hsiang-Chih Chang, Pa-Chun Wang, Su-Yi Hsu, Te-Yung Fang, Van-Truong Pham, Thi-Thao Tran, Chen Lin and Men-Tzung Lo in Journal of Otolaryngology - Head & Neck Surgery
Footnotes
Acknowledgements
The authors thank all patients who participated in this study and the clinical staff for their assistance in data collection.
Declaration of Conflicting Interests
The authors declared no potential conflicts of interest with respect to the research, authorship, and/or publication of this article.
Funding
The authors disclosed receipt of the following financial support for the research, authorship, and/or publication of this article: The present study was supported by the National Science and Technology Council, Taiwan (NSTC 114-2640-B-008-001), awarded to C. Lin and M.-T. Lo.
Ethical Considerations
This study was approved by the Institutional Review Board of Cathay General Hospital, Taipei, Taiwan (IRB no CGH-P113003). All procedures complied with the ethical standards of the responsible committee and with the 1964 Declaration of Helsinki and its later amendments.
Consent to Participate
The requirement for informed consent to participate was waived by the Institutional Review Board of Cathay General Hospital due to the retrospective nature of the study.

Data Availability Statement
The data that support the findings of this study are available from the corresponding author upon reasonable request; however, patient-level data cannot be made publicly available due to privacy and ethical restrictions. The feature-extraction and regression analysis code used in this study is also available from the corresponding author upon reasonable request.
Supplemental Material
Additional supporting information is available in the online version of the article.
References
Supplementary Material
Please find the following supplemental material available below.
For Open Access articles published under a Creative Commons License, all supplemental material carries the same license as the article it is associated with.
For non-Open Access articles published, all supplemental material carries a non-exclusive license, and permission requests for re-use of supplemental material or any part of supplemental material shall be sent directly to the copyright owner as specified in the copyright notice associated with the article.
