
Abstract
This study examines the power of cognitive and noncognitive variables to predict students’ performance in algebra. We investigated students’ prior year’s assessment scores and demographic characteristics to predict eighth-grade algebra scores. Using California statewide assessment data, we explored predictive factors in three regression models. These analyses reveal that the seventh-grade mathematics test scores account for 61% of the variance in eighth graders’ algebra test scores. Analyzing subscores of the seventh-grade mathematics test, the assessment content focus of rational numbers is a major predictor, contributing 48% of the variance in eighth graders’ algebra test scores. On the other hand, students’ demographic variables show little predictive power for eighth-grade algebra scores. This study provides empirical evidence for understanding the factors that impact a student’s success in learning algebra.
The large increase of eighth graders taking algebra courses in the recent two decades and the mixed results of students’ learning success as reflected by test scores have led to an increasing interest in investigating what factors impact students’ performance in algebra (House & Telese, 2008; Loveless, 2013; Matthews & Farmer, 2008; McCoy, 2005). Providing educators and policymakers empirical evidence of factors that influence students’ learning success is more relevant than ever. This study aims to reveal several cognitive (academic) and noncognitive (demographic characteristics) factors that predict students’ eighth-grade algebra learning trajectory.
For many decades, algebra has been considered a gateway to college preparatory mathematics courses in high school (Moses, 1995). Historically, algebra has been a ninth-grade high school mathematics course (George, 2007). Several notable forces have driven the placement of algebra courses in the eighth-grade curriculum. For example, Robert Moses of the Algebra Project argues access to algebra courses is a new civil right for middle school students in the inner city (Moses, 1995; Moses & Cobb, 2002; Moses, Kamii, Swap, & Howard, 1989). In a U.S. Department of Education’s white paper, “Mathematics Equals Opportunity,” the author argued for the earlier focus on algebra in school because students who “begin to study algebra during middle school are at a clear advantage” for going to and completing college (U.S. Department of Education, 1997, p. 14). Several studies (Gamoran & Hannigan, 2000; Smith, 1996; Spielhagen, 2006) show these benefits of eighth-grade algebra: Students perform better in high school, take more advanced mathematics courses, and stay in the mathematics pipeline longer.
Since these discussions, many states and the nation’s largest school districts set their policies to encourage all eighth graders to take algebra. For example, California’s education accountability policy (until its suspension in 2015 due to major changes of the state’s testing and accountability systems) penalized schools and districts in its Academic Performance Index (API) calculations if eighth- and ninth-grade students took the California Standards Test (CST) for General Mathematics 1 instead of the CST for Algebra I. Therefore, California has seen a significant increase in the number of eighth graders taking algebra courses since 2003, as reflected in the growth of eighth graders taking the CST for Algebra I, increasing from 32% in 2003 to 58% in 2013 (California Department of Education, 2014). This growth parallels the national trend of more students taking algebra courses in eighth grade (Loveless, 2008, 2013; National Center for Education Statistics, 2005; Stein, Kaufman, Sherman, & Hillen, 2011).
The large increase of eighth graders taking algebra led to a huge challenge for schools and districts across the nation to improve students’ learning success in algebra (Clotfelter, Ladd, & Vigdor, 2012; Domina, McEachin, Penner, & Penner, 2015; Liang, Heckman, & Abedi, 2012; Loveless, 2008, 2013; Taylor, 2011; Walston & McCarroll, 2010; Waterman, 2010; Williams, Haertel, & Kirst, 2011; Williams, Haertel, Kirst, Rosin, & Perry, 2011). In California, according to the California Standardized Testing and Reporting (STAR) test results, less than 50% of eighth graders who took the CST for Algebra I scored proficient 2 or above in 2013 (California Department of Education, 2014). Kriegler and Lee (2006) studied over 100 middle schools in Southern California. They found that placing students who scored below basic or far below basic in mathematical proficiency on their seventh-grade CST in eighth-grade algebra courses is ineffective because a large number of these students did not score proficient on the CST for Algebra I. Their study concluded that a proficient or above score on the CST for Grade 7 Mathematics provides a strong indicator for eighth-grade algebra success (p. 10). Waterman (2010) investigated eighth- and ninth-grade mathematics classes in eight school districts in Northern California’s Bay Area. He found that many students repeated algebra because of the unsatisfactory learning of the course material. However, repeating algebra in the ninth grade did not yield better results. Domina et al. (2015) found that increasing students’ enrollment in eighth-grade algebra did not improve tenth graders’ mathematics achievements either.
Statewide in California, more than 50% of eighth graders failed the CST for Algebra I between 2003 and 2013, resulting in a large number of students who retook the algebra CST in ninth grade. For example, in 2007, 44% of eighth-grade algebra test-takers repeated the algebra CST in ninth grade (Liang & Guo, 2007). Compared with their peers who took the CST for Algebra I for the first time in ninth grade, those repeaters had a 69% less chance of scoring at least a proficient on the CST for Algebra I (Liang et al., 2012). An analysis of 303 California middle schools by Williams, Haertel, and Kirst (2011) supported these conclusions.
The negative impact of eighth-grade algebra for all is also reported by studies in other states. For example, Clotfelter et al. (2012) revealed the impact of eighth-grade algebra on high school students’ performance in math courses at the Charlotte-Mecklenburg schools in North Carolina. They noted that Students affected by the acceleration initiative scored significantly lower on end-of-course tests in Algebra I, and were either no more likely or significantly less likely to pass standard follow-up courses, Geometry and Algebra II, on a college-preparatory timetable. (Clotfelter et al., 2012, p. 1)
Moreover, in “The Misplaced Math Student: Lost in Eighth-Grade Algebra,” Loveless (2008) reported that 120,000 students nationwide were misplaced in eighth-grade algebra classrooms. He concluded, “No social benefit is produced by placing students in classes for which they are unprepared” (Loveless, 2008, p. 10). Because of the many reports about low student success in eighth-grade algebra, students’ success in algebra, especially in eighth grade, has become a focus of policymakers and educators (National Mathematics Advisory Panel, 2008), as well as for education researchers (Carraher, Schliemann, Brizuela, & Earnest, 2006; Siegler et al., 2012; Xin et al., 2011).
In the quest to improve students’ success in eighth-grade algebra, researchers have studied predictive factors of eighth-grade algebra to inform educational practitioners and policymakers (Flexer, 1984; McNamara, 2004; Siegler et al., 2012). Although they revealed predictive variables on algebra achievement, these studies used quite limited samples. Flexer (1984) studied a sample of 139 students for eighth-grade algebra prediction and McNamara (2004) studied a sample of 235 high school students in their study of Algebra I predictors. Siegler et al. (2012) studied a sample of 3,677 U.K. students and 599 U.S. students to find early predictors of algebra achievement.
This study focuses on a similar investigation of predictive variables, but uses a larger sample. It examines variables such as students’ prior year’s CSTs for English language arts (ELA) and Mathematics scores, their CST mathematics subscores, and variables related to students’ demographic characteristics. In our investigation of the predictive variables in mathematics subscores, we were especially interested in finding out if particular mathematics’ knowledge and skills might contribute to students’ success in eighth-grade algebra. Our contribution to the body of study is to use a large data set that has over 200,000 records, large enough to detect significant predictors, most of them well above the 1% nominal level.
Though it is outside the scope of our study, we acknowledge the influence of many factors besides those we examined in this study that influence students’ performance in algebra. Those factors include the student’s cognitive development (Gagné, 1963; Piaget & Garcia,1989), motivation (Middleton & Spanias, 1999; Simzar, Domina, & Tran, 2016), peer influence (Bulotsky-Shearer, Fernandez, Dominguez, & Rouse, 2011), school and community influence (Cobb & Hodge, 2002; Keck-Staley, 2010; Nasir, Hand, & Taylor, 2008), self-identity (Nasir, 2002; Solomon, Lawson, & Croft, 2011), language proficiency (MacGregor & Price, 1999), and prior mathematics knowledge and skills (Flexer, 1984; McNamara, 2004; National Mathematics Advisory Panel, 2008; Siegler et al., 2012).
We focused our investigation on the predictive power of students’ prior year’s test scores and student demographic characteristics to predict eighth-grade algebra scores. We sought answers to the following research questions:
Method
Our exploratory study is based on data from the California’s statewide assessment. Specifically, we examined seventh and eighth graders’ performance on the CSTs. We wanted to explore the predictive variables in students’ performance on the CSTs for Grade 7 Mathematics and the subscores of those test results. These CSTs served as the state’s main assessments for the STAR program. They were rolled out in 2000 for ELA and in 2001 for mathematics, science, and history-social science. The CSTs, ended in 2014 when the state adopted the Smarter Balanced Assessments, were administered annually in the spring to students in grades 2 through 11 to fulfill part of the state and federal accountability requirements.
The data sources for this investigation are the student data files of the STAR program administered in 2006 and 2007. Three main reasons guided our decision to use these two years of data for the study. First, 2006 is the last year that all California seventh graders took the CST for Grade 7 Mathematics. After 2007, seventh graders could take the CST for Algebra I, if they completed the course by that time (California Department of Education, 2007). Second, the California Modified Assessment (CMA) was developed after 2007 for students with moderate cognitive disabilities who had an individualized education program (IEP) and met the criteria for taking the CMA. With the CMA, many students who would have taken the CST for Algebra I would no longer be included in our study sample, because they took the CMA for Algebra I. Last but not least, in 2006, California implemented the use of the Statewide Student Identifier (SSID) on a voluntary basis, with a participation rate of over 95%, which is sufficient for this study. The SSID is a unique, nonpersonally identifiable number linked to a given individual student. The use of SSID became mandatory in 2007.
The SSID enabled us to conduct longitudinal studies by matching student records from year to year. Using SSIDs, we matched students’ records in 2006 and 2007 STAR student data files. Each file consists of about 490,000 students’ records. We extracted a cohort of students who took the CST for Grade 7 Mathematics in 2006 and CST for Algebra I in 2007 in eighth grade. We matched 209,364 students for this cohort, which is 88% of the 239,240 records of eighth graders who took the CST for Algebra I reported on the STAR report of 2007.
We built three general linear models to explore the predictive variables in our data set to answer our research questions stated earlier.
Model 1: CST for Grade 7 Mathematics Raw Score as the Predictor
We built this model to find out how much the Grade 7 math test scores predict the eighth-grade algebra scores. In this model, the predictor variable is the CST for Grade 7 Mathematics’ raw score, and the criterion variable is the CST for Algebra I raw score in eighth grade. We chose to analyze the CST raw scores instead of scale scores because each CST is scaled, equated, and standard set independently. This regression model is designed to test how much predictive power the CST for Grade 7 Mathematics has on the CST for Algebra I. Our data set has 208,159 student records with valid scores for the 2006 CST for Grade 7 Mathematics and the 2007 CST for Algebra I.
Model 2: CST for Grade 7 Mathematics’ Six Reporting Clusters’ Subscores as Predictors
The report of the CST for Grade 7 Mathematics is detailed in six reporting clusters. Because we are interested in finding which, if any, skills and tested content knowledge are strong predictors of eighth-grade algebra success, we use the six subscores as independent variables for this model. This model was built to answer part of Research Question 2: What seventh-grade mathematics CST subscores of tested content knowledge and skills are strong predictors of eighth graders’ algebra scores? Our data set has 208,043 records with valid subscores of the 2006 CST for Grade 7 Mathematics and the 2007 CST for Algebra I scores.
Model 3: Student Demographic Variables, the CST for Grade 7 ELA, and the CST for Grade 7 Mathematics’ Six Reporting Clusters’ Subscores as Predictors of Eighth-Grade Algebra
Being aware that students with high math competency are more likely to have high verbal scores (Ceci, Williams, & Barnett, 2009), we included students’ ELA scores in our study to find out how much they affected algebra scores. We also included the CST for Grade 7 Mathematics’ six reporting clusters’ subscores in this model because they account for more variance in the eighth-grade algebra scores than single composite scores, as shown in Table 4. In addition, reports and studies about the achievement gap show that students’ learning success relates to their ethnicity and socioeconomic characteristics (National Center for Education Statistics, 2015a, 2015b; Reardon, 2011). That finding led us to include the variables of students’ demographic characteristics, such as gender, ethnicity, parent education level, participation in National School Lunch Program (NSLP), special education programs, and Gifted and Talented Education (GATE) programs, as well as English acquisition status such as English learner (EL) and reclassified–fluent English proficient (R-FEP). Our data set has 173,811 student records with complete demographic information and related test scores for two years. We then purged the number of records in our data set by about 34,000 for Model 3 due to missing or invalid entries of student demographic information.
Results
Table 1 shows the data characteristics for the cohort of students who took the 2006 CST for Grade 7 Mathematics and the 2007 CST for Algebra I in eighth grade. For most of the predictive variables, the frequencies are large enough to produce estimates that are statistically significant with p < .0001 except for students who are designated American Indian (n = 1,393) and an unknown ethnicity (n = 1,237). Because of the extreme low N count of 73 in unknown GATE status, we exclude it from the variables in Model 3.
Frequencies, Percentages, and Cumulative Percentages for the Cohort of Students Who Took the 2006 CST for Grade 7 Mathematics and the 2007 CST for Algebra I in Eighth Grade (N = 209,364).
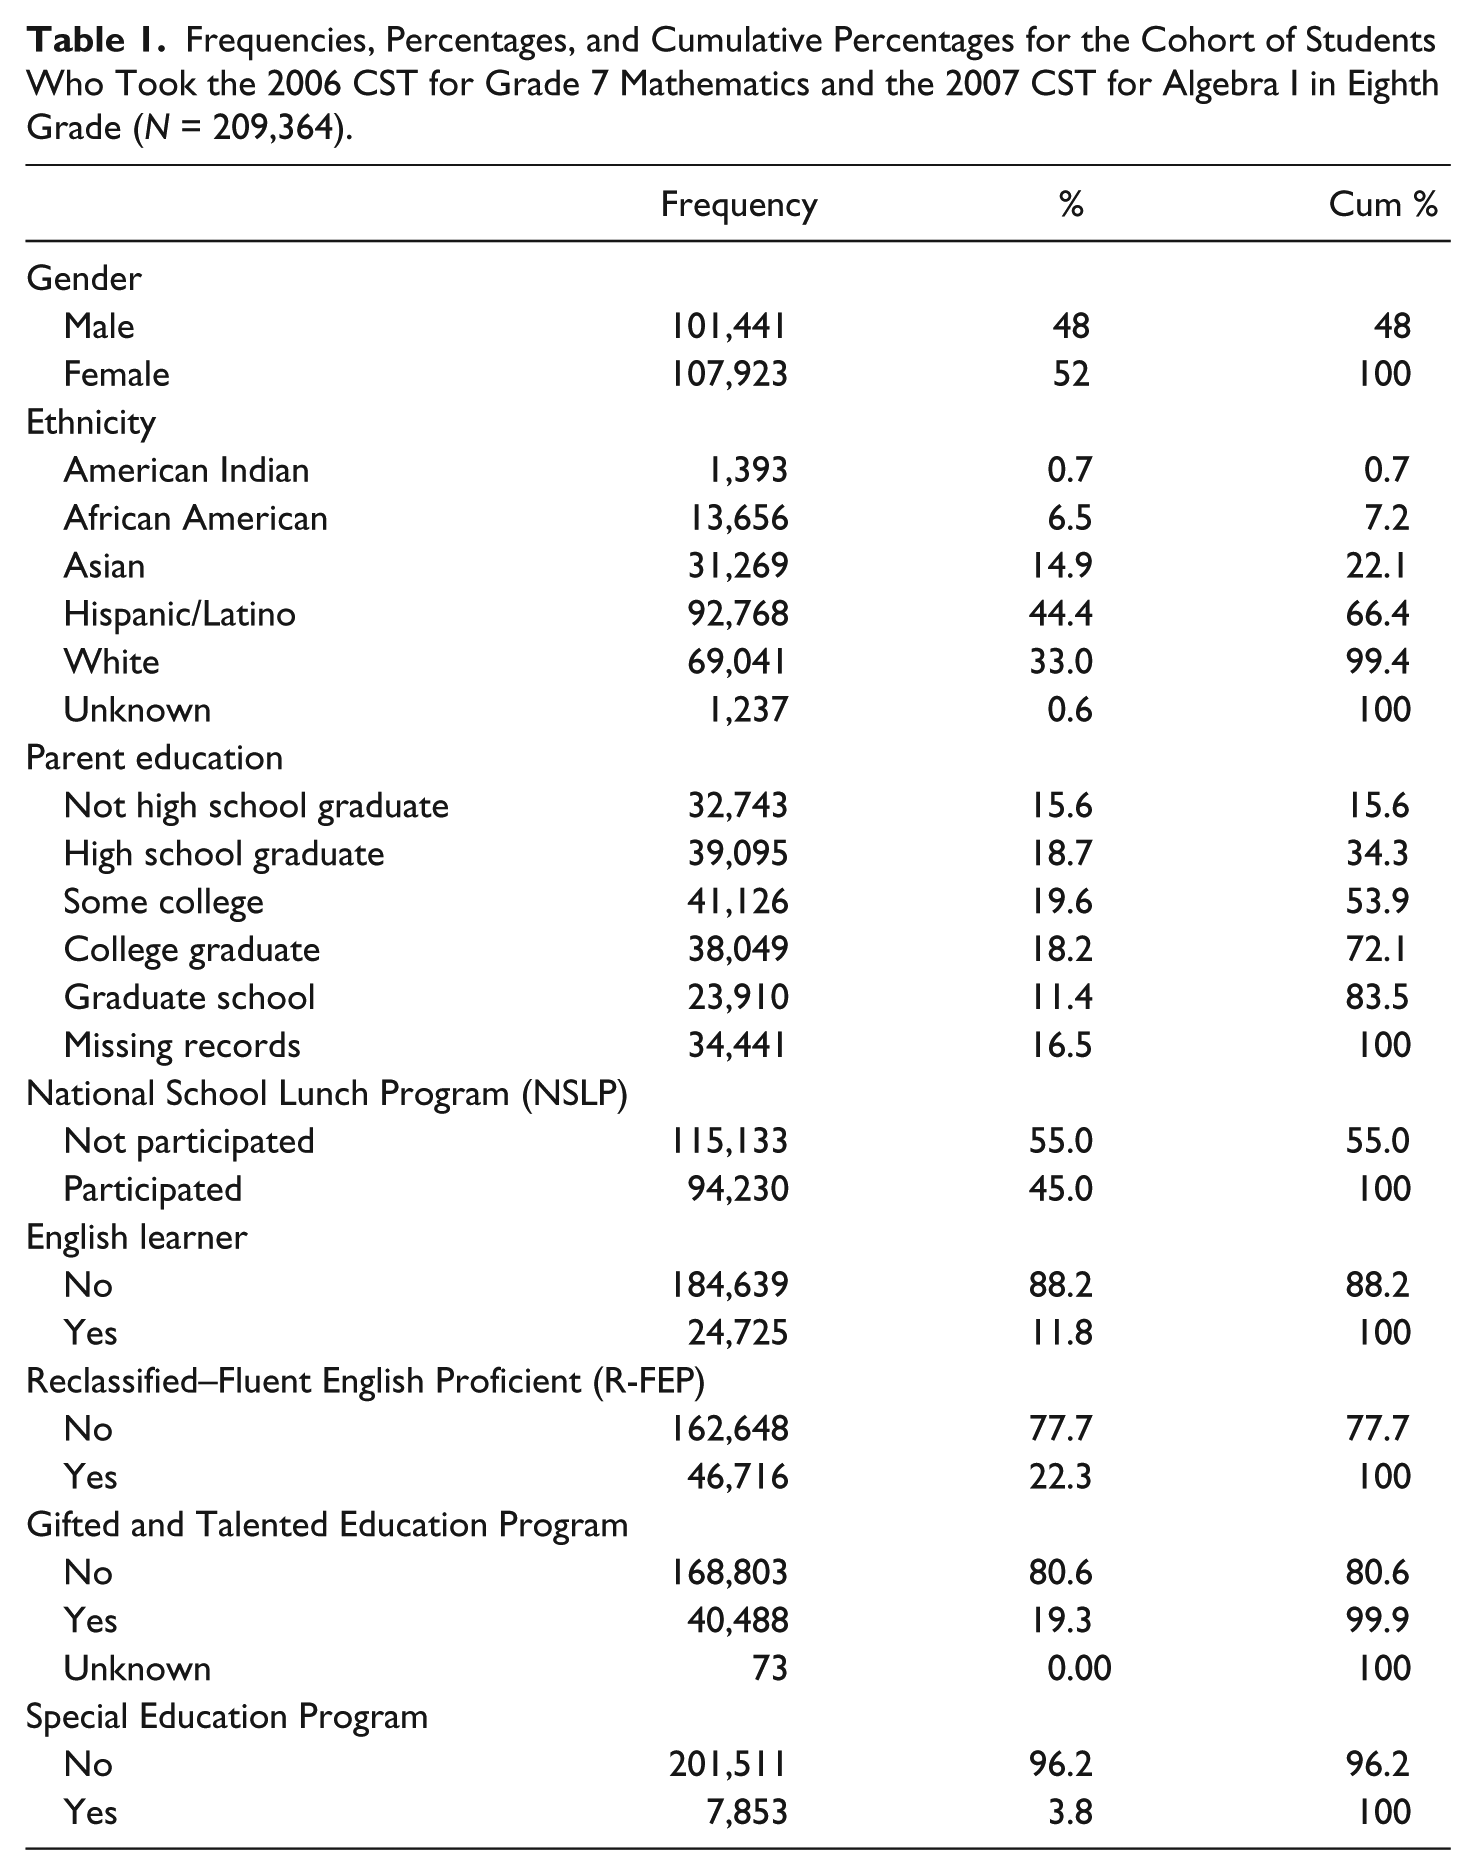
Table 2 shows the mean, standard deviation, and maximum value for each of the quantifiable predictor variables and for the CST for Algebra I raw scores. The CST for all mathematics tests has 65 items with a maximum raw score of 65. The CST for Grade 7 ELA has 75 multiple-choice items with eight points for a writing component, which totals a raw score of 83. The maximum number of items/scores for the six reporting clusters ranges from 5 to 15.
Mean, Standard Deviation, and Maximum Value of Predictors and Criterion.
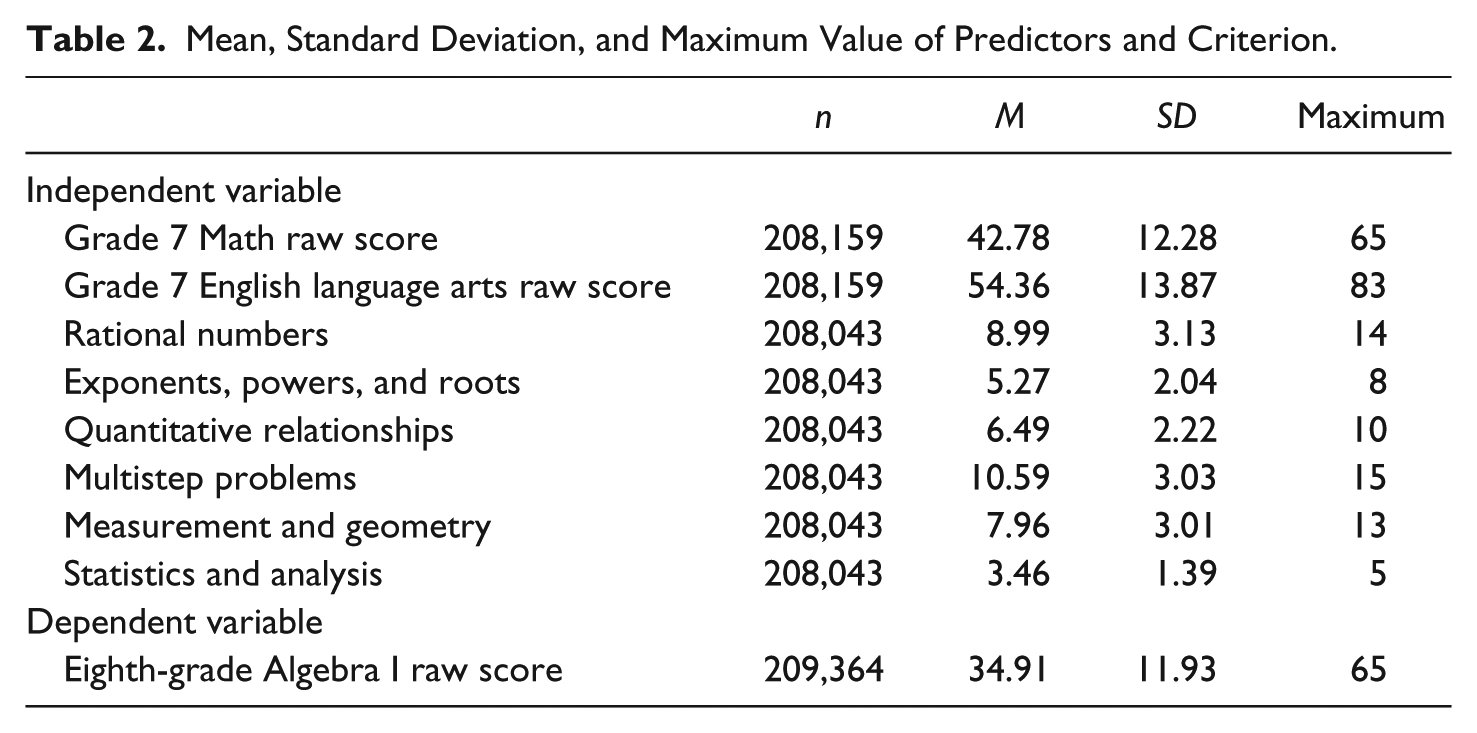
Table 3 presents the correlations and descriptive statistics for the quantifiable predictors and the criterion, the raw scores of eighth graders on the CST for Algebra I. Excluding the records with missing or invalid values, we have data for 208,043 students in the analysis. Columns 1 through 8 represent the same variables named in rows 1 through 8 respectively. All measures of the predictor variables (the CST for Grade 7 ELA raw scores and the six reporting cluster subscores on the CST for Grade 7 Mathematics) were moderately correlated to the eighth graders’ CST for Algebra I raw score. The Pearson r correlation coefficients between the six reporting clusters range from .495 to .690. The highest correlation occurred between the reporting cluster 1, rational numbers, and the eighth-grade CST for Algebra I raw score, with the Pearson correlation coefficient of .690. Thus, the rational numbers cluster explains about 48% of the common variance between the two variables. The lowest correlation is shown between the reporting cluster 2, exponents, powers, and roots, and reporting cluster 6, statistics and analysis, with the Pearson correlation coefficient of .495, explaining about 25% of the common variance.
Correlation Matrix and Descriptive Statistics for Predictor Variables and Criterion.
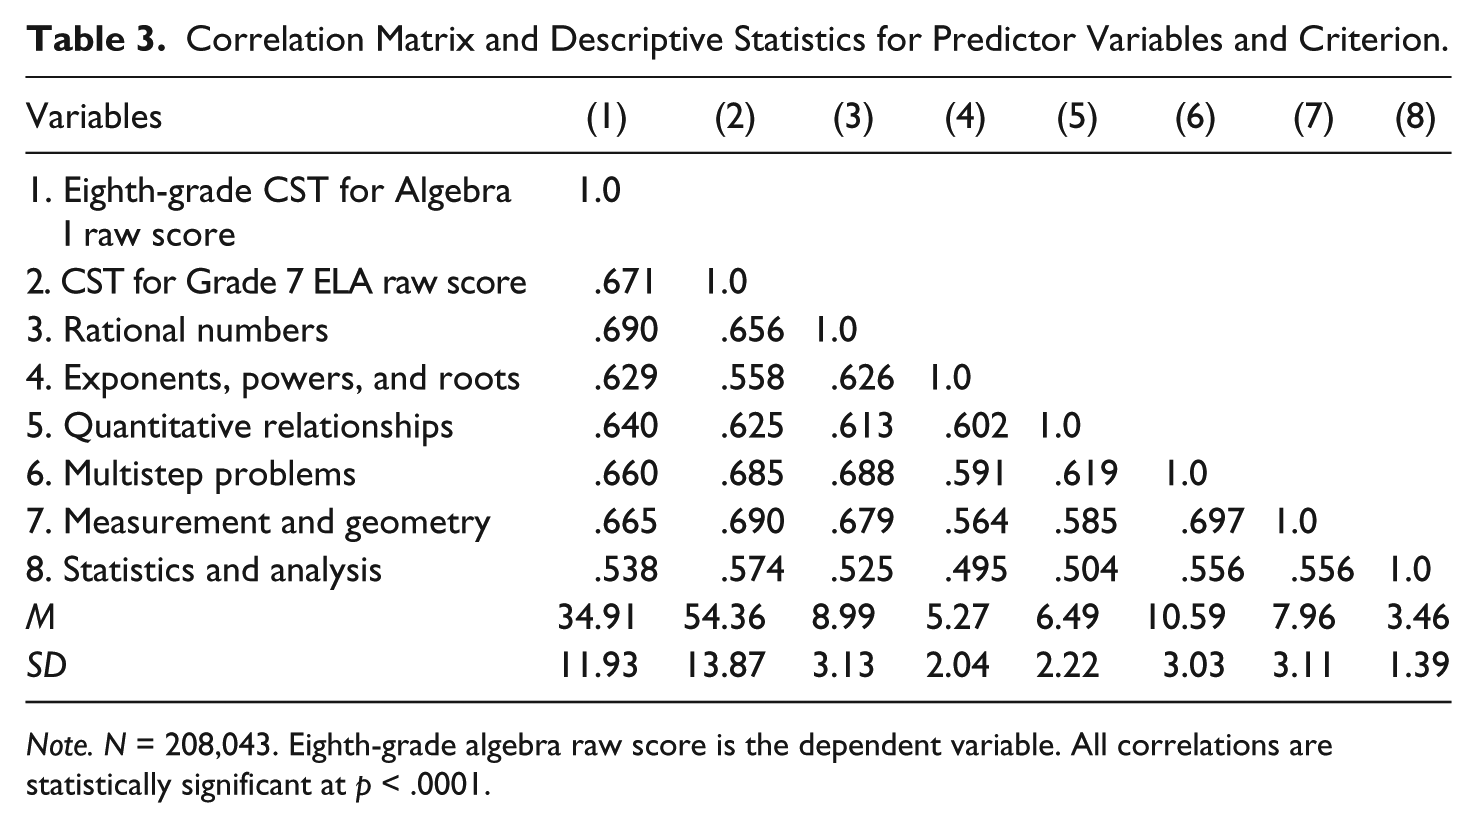
Note. N = 208,043. Eighth-grade algebra raw score is the dependent variable. All correlations are statistically significant at p < .0001.
Research Question 1: In What Ways and to What Degrees Can Seventh-Grade Mathematics Test Scores, Specifically the CST Scores, Predict Eighth-Grade Algebra Test Scores?
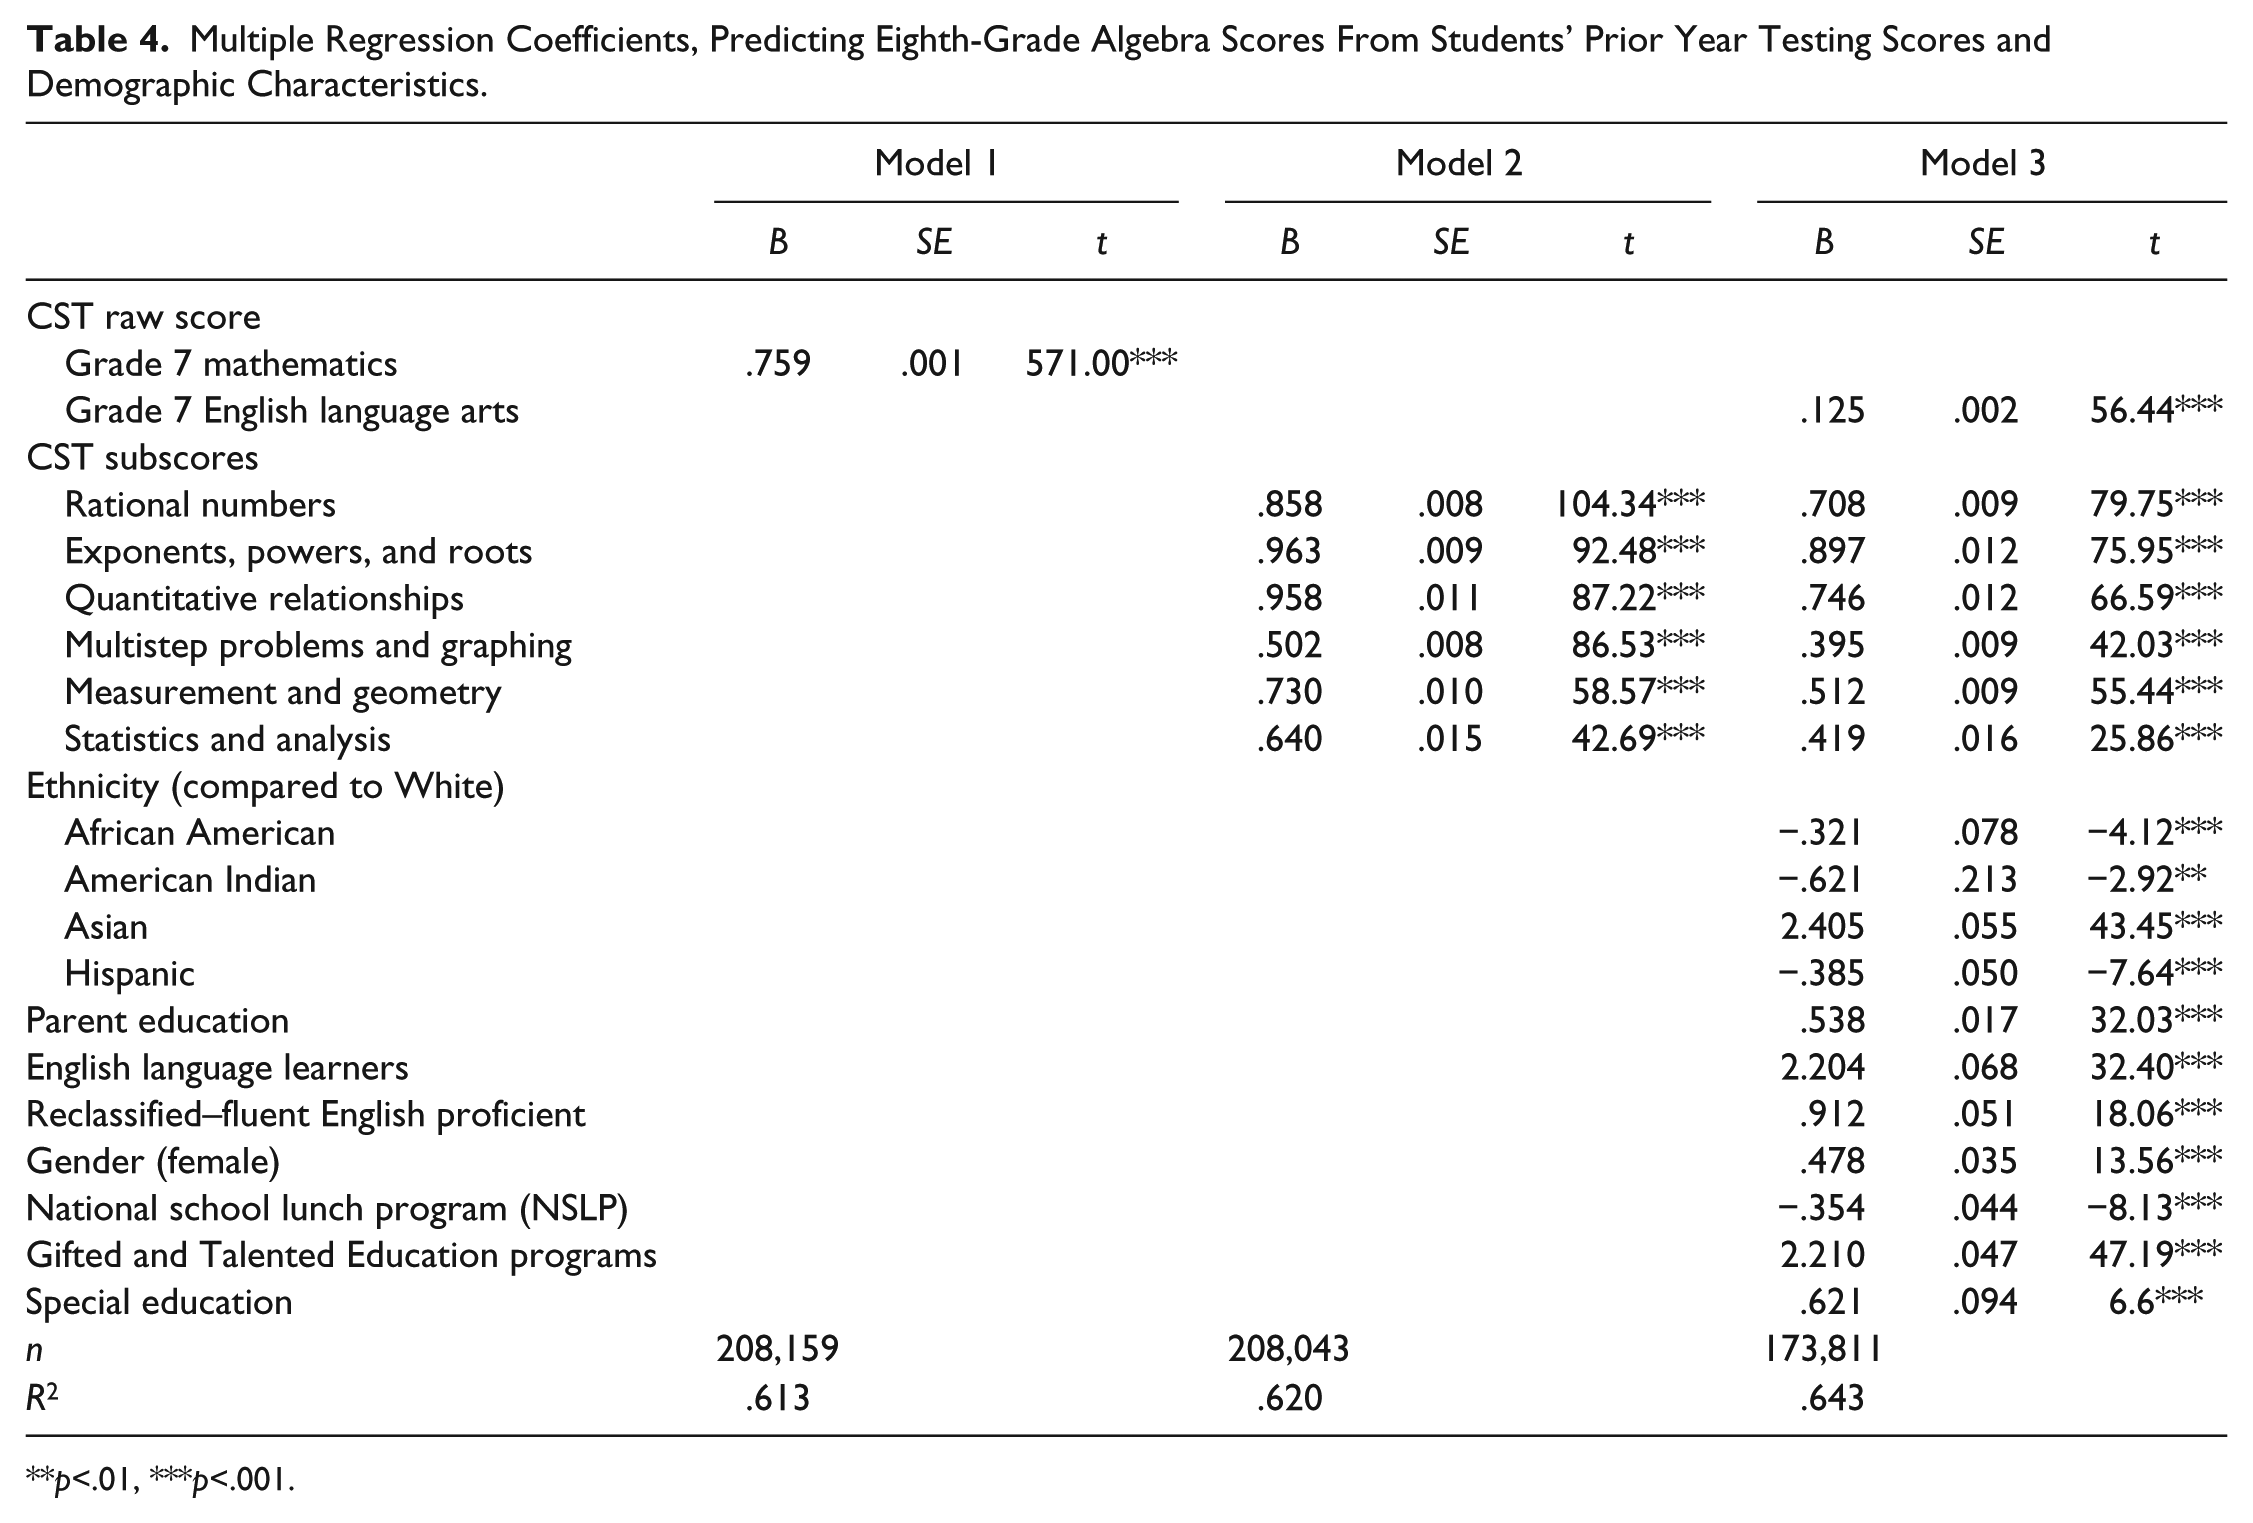
Table 4 presents the multiple regression analyses of the three models described above. In Model 1, the predictor variable is the CST for Grade 7 Mathematics raw score and the criterion is the eighth-grade CST for Algebra I raw score. The Regression Model 1 indicates that the CST for Grade 7 Mathematics raw score accounts for 61% of the variance in the eighth-grade CST for Algebra I raw scores with an R-squared of .613. Also shown in Table 4 are the estimated regression coefficients, unstandardized (B) of .759, standard error (SE) of .001, and the t statistic of 571, the ratio of estimated coefficient to its standard error. The associated p value is less than .0001, which indicates that if the true coefficient for the CST for Grade 7 Mathematics raw score is zero, the probability of estimating a coefficient (.759) this much different from zero is less than .0001. Our Model 1 shows that the CST for Grade 7 Mathematics score is a strong predictor of the CST for Algebra I score.
Multiple Regression Coefficients, Predicting Eighth-Grade Algebra Scores From Students’ Prior Year Testing Scores and Demographic Characteristics.
p<.01, ***p<.001.
Research Question 2: If the CST for Grade 7 Mathematics Scores are Predictive of Eighth-Grade Algebra Achievement, What Seventh-Grade Mathematics CST Subscores of Tested Knowledge and Skills Strongly Predict Eighth Graders’ Algebra Scores?
In Model 2, the predictor variables include the six reporting cluster subscores of the CST for Grade 7 Mathematics. We used backward elimination as the model selection method because it is more suitable for our exploratory analysis (Kutner, Nachtsheim, Neter, & Li, 2005).
As shown in Table 4, among the six reporting clusters, Cluster 1, rational numbers, is a strong predictor of students’ algebra scores. A one-unit increase in the CST for the subscore of rational numbers results in .858-unit increase of the CST for Algebra I. That is, the rational numbers subscore accounts for about 48% of the variance of the eighth-grade CST for Algebra I raw scores. Cluster 3, quantitative relationships, is the second strongest predictor of the algebra score (R2 = .075, B = .958, t = 87.22) and accounts for about 8% of the variance of the CST for Algebra I raw scores. Cluster 5, measurement and geometry, accounts for about 4% of the variance (R 2 = .039, B = .730, t = 58.57). In total, these six reporting cluster subscores contributed about 62% of the variance in the eighth-grade CST for Algebra I raw scores.
Because large sample sizes produce F values large enough to indicate statistical significance (with F values ranging from 2,000 to 190,000), we also performed effect size analysis to examine how big those effects are. That analysis shows that all effect sizes are negligible, about .004. This finding led to our concern about the collinearity among the subscores in the six reporting clusters, as shown in Table 2. This multicollinear relationship of the subscores could be seen as inflating the variance and distorting the relationship between predictor variables and criterion. However, we monitored this multicollinearity factor by calculating the variance inflation factors (VIF), which range from 1.7 to 2.6 for the subscores of the six reporting clusters in the prediction model. Only VIF numbers larger than 10 are considered large enough to affect the predicted values (SAS, 2004).
Research Questions 3: What, If Any, Demograpic factors are Strong Predictors of Eighth-Grade Algebra Achievement Test Scores?
Model 3 includes student demographic variables, the raw score of the CST for Grade 7 ELA, and the six reporting cluster subscores of the CST for Grade 7 Mathematics as predictor variables. As mentioned above, we used backward elimination as the selection method for Model 3 to explore predictive powers of variables both in testing scores and student demographic data.
As indicated in Table 4, the reporting cluster rational numbers is still the strongest predictor, accounting for 47% of the variance in the eighth-grade CST for Algebra I raw scores. The CST for Grade 7 ELA score is the second strongest predictor, and accounts for 8% of the variance in the eighth-grade CST for Algebra I raw scores.
Table 4 further reveals that most of the students’ demographic variables have positive estimated coefficients. The demographic variables with these coefficients are Asian, GATE, parent education level, EL, R-FEP, gender, and special education. Those demographic variables having negative estimated coefficients include National School Lunch Program (NSLP), Hispanic/Latino, African American, and American Indian. The probability for American Indian is .0035, which is p < .01 significant. The prediction for the remaining variables are at the p < .0001 level. Table 4 also shows that including all demographic variables in the calculation improved prediction by only 2.3%.
Discussion
Our findings demonstrate that strong predictors of eighth-grade algebra success are students’ prior year’s mathematics achievement, specifically certain subcategories of mathematics knowledge and skills, along with their ELA achievement. The CST for Grade 7 Mathematics alone contributes 61% of the variance of eighth graders’ performance on the CST for Algebra I, much larger than the 22% variance that Flexer found in her regression analysis of eighth-grade algebra achievement predicted by seventh-grade mathematics tests (1984). Several investigations on “prior knowledge” as a potential variable contributing to test score variance revealed that pretest scores explained between 25% and 81% of the variance in posttest scores (Bloom, 1976). For example, Dochy (1992) found that “prior knowledge” could explain up to 42% of the variance in performance on several European’s state tests, and Tobias (1994) indicated that such knowledge explained 30% to 60% of the variance. Although terms such as prior knowledge, pretest, and previous year’s test scores do not mean the same thing, prior test scores usually contribute to later test scores’ variance within the same test-takers (Dochy, Segers, & Buehl, 1999). This suggests that prior knowledge or achievement is somehow linked to future achievement to a certain degree. Such studies support our study’s conclusion that a reasonably useful algebra success criterion might be based on students’ seventh-grade mathematics achievement
If the CST for Grade 7 Mathematics predicts eighth-grade algebra achievement with great reliability, then what subsets of skills and knowledge might contribute to this strong prediction? Regression Model 2 indicates that the subscore of the reporting cluster rational numbers is the strongest predictor, contributing 48% of the variance of the eighth-grade CST for Algebra I scores. The second strongest predictor is the subscore of the reporting cluster quantitative relationships, contributing 8% of the variance of the eighth-grade CST for Algebra I.
According to the California Department of Education (2009a), the rational numbers reporting cluster of the CST for Grade 7 Mathematics assesses whether students “know the properties of, and compute with, rational numbers expressed in a variety of forms” (p. 2). The various forms of these rational numbers include integers, fractions, decimals, and percents (California Department of Education, 2006). In the released test questions, 1-20 (California Department of Education, 2009a, pp. 7-12), we see that the subset of rational numbers tests students’ ability to manipulate fractions, decimals, and percents. Our finding supports the National Mathematics Advisory Panel’s recommendation (2008) that knowledge of fractions is a critical focus for algebra preparation: A major goal for K–8 mathematics education should be proficiency with fractions (including decimals, percent, and negative fractions), for such proficiency is foundational for algebra and, at the present time, seems to be severely underdeveloped. Proficiency with whole numbers is a necessary precursor for the study of fractions, as are aspects of measurement and geometry. These three areas—whole numbers, fractions, and particular aspects of geometry and measurement—are the Critical Foundations of Algebra. (p. xvii)
In a more recently published study, Siegler et al. (2012) reveal that fractions and division are strong predictors of high school students’ knowledge of algebra and overall mathematics achievement. To understand a fraction’s value, one has to either compare the denominator to the numerator to estimate whether the fraction is greater or lesser than 1, or divide to find its decimal value, or convert to a denominator of 100 for a percent (i.e., 3 / 4 = 3 ÷ 4 = .75 = 75%). These conversions require conceptual understanding of rational numbers and the computational skills to manipulate numbers. The conceptual understanding of rational number that a mathematical value can be expressed in more than one form may be critical for students to connect isolated numbers to their equivalents, a concept central to algebraic reasoning. Ours and others’ findings and explanations about rational numbers may help instructional leaders and classroom teachers encourage students’ algebra learning by focusing on improving their understanding and use of fractions, decimals, and percents, and understanding their equivalence.
Like Model 2, Model 3 of the regression analysis yields the reporting cluster rational numbers as the strongest predictor of the CST for Algebra I raw score. However, in Model 3, the CST for Grade 7 ELA score, rather than the reporting cluster, quantitative relationships, is the second strongest predictor, contributing 8% of the variance for the CST for Algebra I raw score, compared to 47% of the variance contributed by the rational numbers subscore. Based on Model 3, students’ ELA achievement contributes strongly to their algebra scores. However, it is not clear whether this strong predictive power is related to the language loading (the reading skill required to complete the mathematics test items) of the CST (California Department of Education, 2009b) and/or to the test’s psychometric properties and the issues they raise about language (Abedi, 2006).
Among the demographic variables, Asian and GATE program are positive predictors of the CST for Algebra I score but their prediction power is quite trivial. This finding is in agreement with the California Department of Education’s STAR reports that Asian students and GATE students scored higher compared to the state average (California Department of Education, 2014). The variable of parent education level plays a more important role than the role of the subscore of statistics and analysis in predicting the CST for Algebra I scores. This positive coefficient means that the higher the educational level of a student’s parents, the higher that student’s algebra score will be, a conclusion that agrees with the state’s STAR report (California Department of Education, 2014) and agrees with the study results from national data (Hill et al., 2004; Tate, 1997; Useem, 1992).
However, our study’s finding that the variable of English learners has a positive relationship to the algebra score contrasts with previous results. For example, Gandára, Rumberger, Maxwell-Jolly, and Callahan (2003) investigated California students’ scores on the Stanford Achievement Test version 9 (SAT9), a national, norm-referenced achievement test that California students took in the years prior to CSTs. They found that there is “a persistent gap in test scores” between ELs and English-speaking students “throughout their entire school career” (p. 4). Furthermore, the California Department of Education’s STAR report (2012) shows that ELs scored below the state average, with only 13% scoring proficient or above on the eighth-grade CST for Algebra I, compared to the state average of 38% for the year. The discrepancy between the findings of our study and previous results in other studies suggests the importance of further exploring this study’s positive relation between ELs and the CST for Algebra I scores.
Regarding this above discrepancy, we note a difference in methodology between our study and other studies similar to the STAR reports (California Department of Education, 2014). Our study examines the learning growth for the same students at two separate times, from seventh graders’ mathematics achievement to eighth graders’ algebra success; whereas, the above studies have only examined an aggregated data set at one end period of the students’ school year. This two snapshot methodology lends weight to the positive coefficient that arises in this study for English-language learners. Being classified English-language learners, given that they are at the same level of prior mathematics achievement as that of English speakers, contributes positively to students’ CST for Algebra I score.
Other factors may also contribute to this study’s result of a positive coefficient for English-language learners. A possible explanation is that algebra and/or the CST for Algebra I are less language dependent than other areas of study. However, our other finding of the importance of ELA, students’ language and reading ability, on CST scores seems to counter this possibility. Another factor might be the process by which those students who are classified as English-language learners are reclassified as fluent English proficient (R-FEP). Many schools and districts refrain from reclassifying English-language learners as R-FEP because they may lose state and federal funding. English proficient students may be more represented in the EL portion in this sample because of the financial limitations of reclassifying English-language learners. Whatever the explanations, this study’s finding of a positive relationship between English-language learners and the CST for Algebra I score, although interesting, should be questioned until other studies either confirm or explore the factors we suggest and other factors that might be contributing to these positive coefficients.
The study also found that the variable R-FEP has a positive relationship to the CST for Algebra I score. This finding confirms the California Department of Education’s STAR report, which shows that eighth-grade R-FEP students scored higher than the state average, 40% versus 38% respectively, scoring proficient or above on the CST for Algebra I. Yet, similar questions, such as why R-FEP students score higher, remain for this finding as well as for the previous question about English-language learners.
As for gender, the study concludes that being female contributes positively to the CST for Algebra I score. This finding corresponds to the California Department of Education’s report that 39% of female students scored proficient or above on the CST for Algebra I at eighth grade compared to 38% of all statewide students. In contrast to a widely held concern, supported by national data (Walston & McCarroll, 2010), that girls achieve at lower levels than boys in mathematics, it appears from our study that in eighth-grade algebra, girls outperform boys in California. We consider this finding especially important because the gender achievement gap has been narrowed since 2000, as reported by the National Assessment of Educational Progress (NAEP), and finally closed at 2015 when boys and girls achieved the same score of 282 on the eighth-grade mathematics assessment (U.S. Department of Education, Institute of Education Sciences, & National Center for Education Statistics, n.d.). However, the gender achievement gap still exists in California’s higher level mathematics, such as Geometry and Algebra II, as reported in the California Department of Education’s STAR report (2012). The California data are supported by the NAEP 12th-grade mathematics results showing boys outperformed girls. More interestingly, the California data showing girls outnumber boys enrolling in higher level mathematics courses are supported by the NAEP report and Walston and McCarroll (2010). We call for further investigations on the disappearing gender achievement gap in eighth-grade mathematics and algebra and its impact on higher level mathematics. We also call for more research on the turning point and impact factors that cause fewer girls than boys to choose science, technology, mathematics, and engineering (STEM) fields for their college and career.
Furthermore, we found that being in special education has a positive relationship to the CST for Algebra I score when students had the same preparation level as indicated by their CST for Grade 7 Mathematics’ scores. This finding contrasts with the California Department of Education’s STAR report that only 14% of students with disabilities scored proficient or above on the eighth-grade CST for Algebra I, compared to 38% of students statewide. Similar to English-language learners, special education students may benefit from algebra’s lower level of language dependency than other subjects, a topic that requires further exploration. Also, the self-selection factor involved with students with disabilities may affect this study’s findings: Only some special education students, presumably those motivated or selected by their IEP teams, take the CST for Algebra I. In addition, to encourage their learning, special education students usually have a smaller class size and extra resources, which may provide additional support for their learning. These explanations also require additional research.
The study’s finding of the negative relationships between the CST for Algebra I scores and the variables of national school lunch program, Hispanic/Latino, African American, or American Indian is consistent with the California Department of Education’s STAR report and with many other studies regarding the achievement gap (Barton, 2003; Haycock, 2001; Lee, 2002; Sirin, 2005). Efforts to narrow these gaps have led to some gains although the gaps continue to exist (Balfanz & Byrnes, 2006; Loveless, 2013). However, while achievement gaps among race/ethnicity groups narrowed, the gap based on students’ family income is widening (Reardon, 2011, 2013).
In addition to Model 3, which includes the prior year’s students’ test results and demographic data, we also performed a regression analysis in a restricted model that included only students’ demographic variables. The restricted model reveals students in the GATE program accounting for 15% and parent education level accounting for 8% of the variance. However, when the demographic variables are included with test scores, these variables only account for 2% of the variance as shown in Models 2 and 3 in Table 4. This indicates that collinearity does also exist among students’ demographic variables and their prior years’ test scores. In other words, the students’ demographic characteristics are also correlated with their prior year’s test scores. The multicollinearity of the data limits the interpretation of this study’s results.
There are other limitations in this study. A major limitation is the regional representation of our data. Although California is a large state and our data have the most records for this kind of study, we caution readers on overinterpreting these results. The differences between California and the rest of the country may exist not only in geography, but, more importantly, in middle and high school mathematics curricula. Another limitation is the negligible effect size of this study. Due to the large data set, almost all of our analyses showed a return value of p < .0001. This indicates that, if the true coefficient for the predictor is zero, the probability of estimating a coefficient of a returned value different from zero is less than .0001. However, when we performed effect size analysis at a 95% confidence interval, the return value of the effect size is minimal at .004. This result is expected because of the small p value, large N count, and moderate correlations of coefficients (Nakagawa & Cuthill, 2007).
Conclusion
Our finding that eighth graders’ performance on algebra achievement can be predicted reliably by the previous year’s knowledge and skills, students’ ELA achievement, and their demographic characteristics provides important information for educators and policymakers both in raising questions about and determining the learning conditions for students to understand and succeed in algebra. Various panaceas for mathematics learning in school also remain a challenge—such as accelerating the pace of prealgebra mathematics learning, double-dose algebra (struggling students are given twice as much instructional time as they would normally receive), and the focus on students’ mathematical experiences in school to support students learning algebra in eighth grade. However, the predictors that our study uncovered add to the domain of factors known to improve students’ performance on an algebra test. Among the specific mathematics’ focus areas, rational numbers is a major predictor for algebra achievement. Quantitative relationships also appear to contribute to algebra achievement.
These predictors and focuses raise an important question: would greater attention to fewer mathematics concepts and related skills—such as rational numbers and quantitative relationships—provide better support for student’s algebra learning? If so, the usual lengthy list of knowledge and skills that many students have been required to focus on in their unsuccessful efforts to learn algebra may not promote the necessary conceptual understandings for that learning. Moss and Case (1999) discuss important considerations for promoting rational number understanding among middle school students. In their view, as students age and have more years of mathematics teaching They also learn about the relationship between fractional and decimal notions. Generally (though, often not until they have reached the end of high school), they construct a generalized understanding of the entire rational number system. (p. 125)
By having more experiences with rational numbers and quantitative relationships in their middle years of schooling, students may enhance their understanding of the rational number system. Also, with more reflection and talk in mathematics classrooms about students’ thinking about these concepts (Hiebert, 1992), greater understanding may arise as well as more meaningful student mathematical identities and agency (Boaler & Sengupta-Irving, 2016; Cobb, Gresalfi, & Hodge, 2009). Finally, encouraging students’ conceptual development and understanding in important disciplines like mathematics challenges the usual practices of covering large amounts of topics and procedures. In this usual broad approach, students “do not learn anything in depth, and thus are not able to structure what they are learning around the major organizing principles and core concepts of the discipline” (National Research Council, 2002, p. 120). We conclude that success in algebra requires encouraging student conceptual understanding rather than teaching a multitude of divergent skills.
Footnotes
Authors’ Note
The opinions expressed by Jian-Hua Liang are of the author alone and do not reflect opinion or policy of the California Department of Education.
Declaration of Conflicting Interests
The authors declared no potential conflicts of interest with respect to the research, authorship, and/or publication of this article.
Funding
The authors received no financial support for the research, authorship, and/or publication of this article.