
Abstract
Background:
While health care providers (HCPs) are generally aware of the challenges concerning insulin adherence in adults with insulin-treated type 2 diabetes (T2D), data guiding identification of insulin nonadherence and understanding of injection patterns have been limited. Hence, the aim of this study was to examine detailed injection data and provide methods for assessing different aspects of basal insulin adherence.
Method:
Basal insulin data recorded by a connected insulin pen and prescribed doses were collected from 103 insulin-treated patients (aged ≥18 years) with T2D from an ongoing clinical trial (NCT04981808). We categorized the data and analyzed distributions of correct doses, increased doses, reduced doses, and missed doses to quantify adherence. We developed a three-step model evaluating three aspects of adherence (overall adherence, adherence distribution, and dose deviation) offering HCPs a comprehensive assessment approach.
Results:
We used data from a connected insulin pen to exemplify the use of the three-step model to evaluate overall, adherence, adherence distribution, and dose deviation using patient cases.
Conclusion:
The methodology provides HCPs with detailed access to previously limited clinical data on insulin administration, making it possible to identify specific nonadherence behavior which will guide patient-HCP discussions and potentially provide valuable insights for tailoring the most appropriate forms of support.
Keywords
Introduction
Despite the development of new drugs, insulin therapy remains a key component for many patients with type 2 diabetes (T2D). 1 For these patients, adherence to prescribed insulin regimens is a vital factor for obtaining sufficient glycemic control and postponing development of late-diabetic complications.2,3 Insulin adherence refers to the extent to which an individual’s insulin administration corresponds with the agreed recommendations from the health care provider’s (HCP) guidelines in terms of dosing, timing, and frequency. 3 Unfortunately, many patients with T2D struggle to maintain their insulin regimen, and insulin nonadherence has been reported in up to two-thirds of people with insulin-treated T2D.4 -6
While HCPs are generally aware of the challenges concerning insulin adherence, 6 data guiding identification of insulin nonadherence and understanding of injection patterns have been limited. 7 Insulin adherence has commonly been evaluated using different self-reported measures (eg, questionnaires) and quantitative measures (eg, pharmacy claims),8,9 and the Medication Possession Ratio (MPR) has been recommended for adherence assessment. 8 Yet, the available assessment methods are severely limited in providing detailed information on timing, dosing size, injection patterns, and adherence behavior.10,11 Consequently, HCPs must often make decisions based on presumptions 12 and they often fail to recognize nonadherence in their patients, which can lead to suboptimal treatment and put individuals at risk of developing complications.13 -15
In recent years, different connected insulin pens have emerged. These pens record timing and dosing of insulin injections and transfer insulin dosing data to an HCP and/or patient platform (eg, a smartphone app) where data can be displayed. 16 With the introduction of connected insulin pens, HCPs now have detailed access to previously limited clinical data on insulin administration, potentially making it possible to identify patterns of missed or incorrect doses, which may help move dialogues regarding insulin therapy with HCPs away from guessing about adherence, toward true knowledge about insulin administration. 17
Recent studies18 -20 have successfully used insulin injection data from connected insulin pens to assess insulin adherence. These studies demonstrated the feasibility of employing insulin injection data to assess whether an insulin dose was mistimed or missed. Nevertheless, neither of the studies described how HCPs can use insulin injection data to assess insulin adherence in adults with insulin-treated T2D. Therefore, research focusing on the way data obtained from connected insulin pens can be effectively used is needed. 16
Thus, the aim of the present study is to provide methods for assessing different aspects of basal insulin adherence and exemplify these using data from an ongoing clinical trial.
Methods
Data Collection
Basal insulin injection data and prescribed insulin data were collected over a three-month period from 103 patients with T2D who were randomized to the intervention group of the ongoing DiaMonT trial (NCT04981808). Only data from patients who had completed the trial were included. The trial is investigating the effect of telemonitoring on glycemic control among other outcomes, and enrolled patients were ≥18 years of age, had a confirmed diagnosis of T2D for a minimum duration of one year, and were treated with basal insulin either as monotherapy or in combination with bolus insulin. The trial is described in detail elsewhere. 21
Basal insulin injection data were recorded with a reusable NovoPen 6 connected insulin pen (Novo Nordisk A/S, Bagsværd, Denmark). The connected insulin pen administered insulin in one-unit dose increments, with a maximum dose of up to 60 units. Time and date of all injected doses as well as the number of units dosed were automatically recorded by the connected insulin pen. The connected insulin pen can store the last 800 doses and has five-year battery life. 22 Participants were asked to transfer injection data to their smartphones at least once weekly. If a participant had not transferred injection data, trial personnel reminded the participants. Prescribed basal insulin injection data, including basal insulin dose at baseline and continuous adjustments, were registered by trial personnel during the trial.
All data analyses were performed using Python 3.7 and relevant packages (Pandas version 1.4.4, NumPy version 1.19.5, and Matplotlib version 3.5.2).
Preprocessing
Data were structured into 24-hour periods from 03:00 to 03:00 the next day. For this study, basal insulin doses recorded on the same day were summed and doses of greater than or equal to two units were excluded. The latter is because patients were instructed to test the insulin flow with a two-unit air shot after replacing the insulin cartridge. 22 If no insulin injection was recorded by the connected insulin pen on a given day 0 units were imputed.
Quantification of Adherence
Adherence was measured by comparing the prescribed basal doses by trial personnel with the basal insulin doses recorded by the connected insulin pen each day. A correct dose was defined as a recorded dose equivalent to the prescribed dose, an increased dose was defined as a recorded dose bigger than the prescribed dose, and a reduced dose as a recorded dose smaller than the prescribed dose. A missed dose was defined where 0 unit was imputed.
Based on these data, we evaluated three aspects of adherence, offering HCPs a comprehensive assessment approach: in step 1, “Overall adherence,” the adherence level is determined to assess whether the patient generally administers correct doses, or whether there seems to be a problem related to adherence. Step 2, “Adherence distribution,” explores the type and frequency of any deviations from the prescribed dose. This will aid HCPs in determining whether a specific adherence problem is attributable to increased, reduced, or missed doses. Last, step 3, “Dose deviation,” uncovers how much increased or reduced doses vary from the prescribed dose. This detailed examination will provide valuable insights for tailoring the most appropriate forms of support.
Step 1: Overall adherence level
We suggest that the HCP starts by determining whether a patient is adhering to the basal insulin regimen and generally administering correct doses. This objective assessment of adherence is a prerequisite for improving overall adherence; to provide essential support and intervention, HCPs must first accurately identify patients who are nonadherent to the regimen. 4
Sokol et al 23 have shown that adherence levels of ≥80% are associated with a lower risk of hospitalization and lower costs of care for patients with diabetes. Therefore, we classified patients as adherent when ≥80% of doses were completed and/or correct and as nonadherent when <80% were completed and/or correct. Overall adherence was calculated as the percentage of the number of correctly administered doses divided by the total number of prescribed doses in a given period. We calculated the adherence level both for the entire trial period and on a weekly basis to see trends in adherence.
If the patient is considered adherent, assessment can end here. However, should nonadherence be evident, we recommend that the HCP proceeds to step 2 to investigate the distribution of incorrect doses.
Step 2: Adherence distribution
When nonadherence is present in step 1, the HCP should investigate the type and frequency of any deviations from the prescribed dose. This will support HCPs in determining whether a specific adherence problem is attributable to increased, reduced, or missed doses. Recognizing diverse types of nonadherences holds significance, as distinct dosing irregularities signify unique behavioral entities necessitating individual evaluation.7,10
A patient’s weekly number of correct, increased, reduced, and missed doses were counted. The weekly distribution was presented in percentages and was graphically displayed in a stacked barplot.
In case of predominantly missed doses, HCPs should explore the underlying causes, for example, forgetfulness.7,10 If the patient mainly presents with increased and/or reduced doses, we suggest proceeding to step 3.
Step 3: Dose deviation
If the patient is considered nonadherent due to primarily increased or reduced doses, this should be investigated further. The magnitude of deviation from the prescribed basal insulin dose holds importance. For a patient with a prescribed dose of 25 units, deviating by one unit would yield a lesser impact than a deviation of 20 units. 23 The size of the deviation is commensurate with the size of the prescribed dose.
Missed doses were excluded before calculating the deviation, and the lower 2.5 percentile and the upper 97.5 percentile were excluded as well to leave out one-time mistakes. Through computation of the difference between the daily prescribed and administered doses, the extent of the daily deviation was derived for a selected period (30 days). The deviation was described by mean and range. The percentage deviation and the proportion of deviations were visualized using a histogram.
Step 3 concludes our comprehensive three-step guide for quantification of adherence.
Results
Overall, 9556 doses were registered. Of these, 6932 (73%) were administered correctly, while 2624 (27%) were incorrect. Of the incorrect doses, 1278 (49%) were increased doses, 844 (32%) were reduced doses, and 502 (19%) were missed doses. Of the 103 participants, 52 (50.5%) were considered overall adherent based on the 80% threshold, while the remaining 51 (49.5%) were considered nonadherent. During the three-month trial period, deviation from basal insulin prescription was identified at least once in all participants. In the subsequent sections, we detail our assessment of patient-level adherence using our three-step method. This evaluation is illustrated through cases to showcase different scenarios derived from data collected in the ongoing clinical trial.
Step 1: Overall adherence level
Three diverse cases with varying overall adherence levels will be presented to illustrate step 1.
Case 1: The fully adherent patient
The patient exhibits high adherence throughout the study, achieving an overall adherence level of 97.9% across the entire 12-week trial period (see Figure 1). In week 1, the patient demonstrated full adherence, administering 100% of doses as prescribed, and maintained this for 11 out of the 12 weeks. The patient administered one dose incorrectly out of seven during week 4, resulting in an overall adherence level of 86% in that week. Yet, the overall adherence level remained above 80%. Given the consistently high adherence demonstrated by this patient, we advise to conclude the adherence assessment.
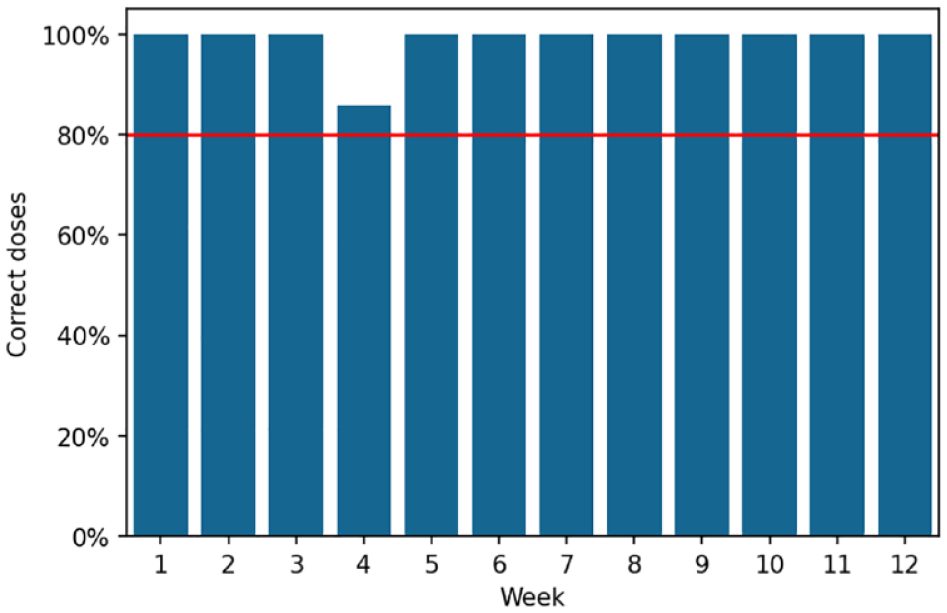
Overall adherence level for case 1. The red line illustrates an 80% adherence level; the blue bars represent the patient’s adherence level for the week concerned.
Case 2: Adherence improvement
The patient’s overall adherence level is 70.7% but shows improvement during the trial (see Figure 2). In the initial two weeks, the overall adherence level is at 0%, but it gradually rises from week 3 onward. From week 6 until the end of the trial, the patient is consistently adherent with an overall adherence level above 80%. We recommend concluding the adherence assessment based on the data from the last four weeks of the trial (weeks 10-13).
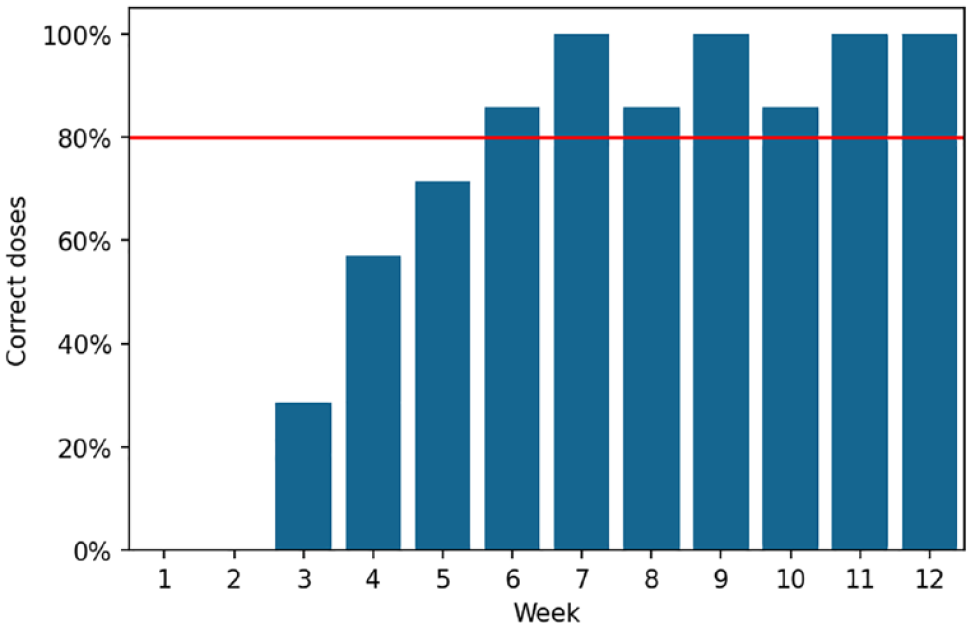
Overall adherence level for case 2. The red line illustrates an 80% adherence level; the blue bars represent the patient’s adherence level for the week concerned.
Case 3: The nonadherent patient
The patient’s overall adherence level is 28.3%, indicating nonadherence throughout the trial period (see Figure 3). In weeks 3 and 8, the patient briefly reached an adherence level just below 60%, which was the highest during the trial. We suggest moving to step 2 to investigate the nature and frequency of deviations from the prescribed dose.
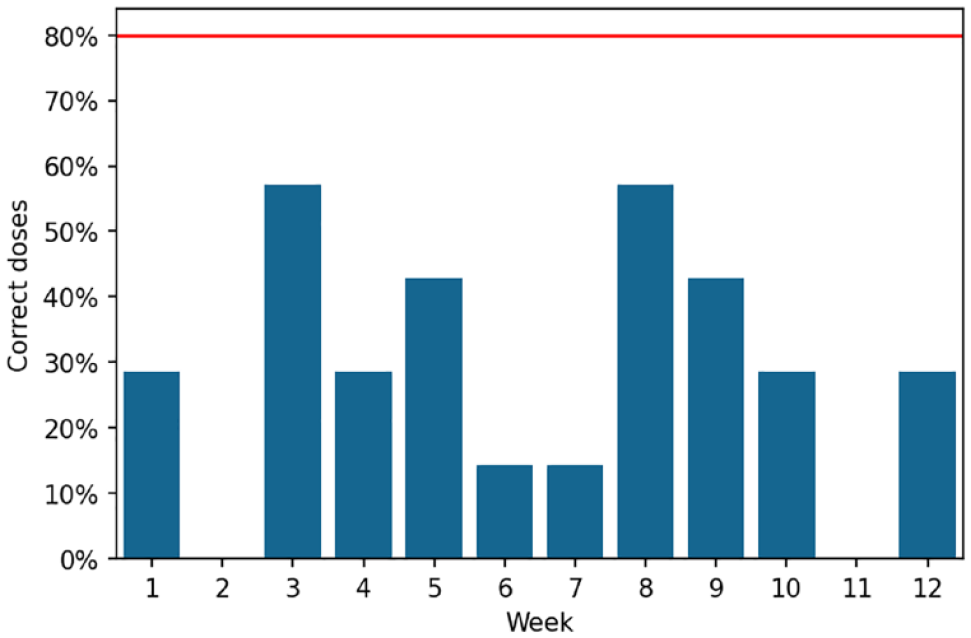
Overall adherence level for case 3. The red line illustrates an 80% adherence level; the blue bars represent the patient’s adherence level for the week concerned.
Step 2: Adherence distribution
Two cases will be presented to illustrate step 2, one primarily with increased and reduced doses and another with missed doses.
Case 1: Increased and reduced doses
This patient exhibits irregular injection patterns and a low overall adherence level (see Figure 4). Initially, the patient administered increased doses in the first weeks, but toward the end of trial, there was a notable shift toward reduced doses. To understand this patient’s adherence better, it is recommended to investigate dose deviations in step 3.
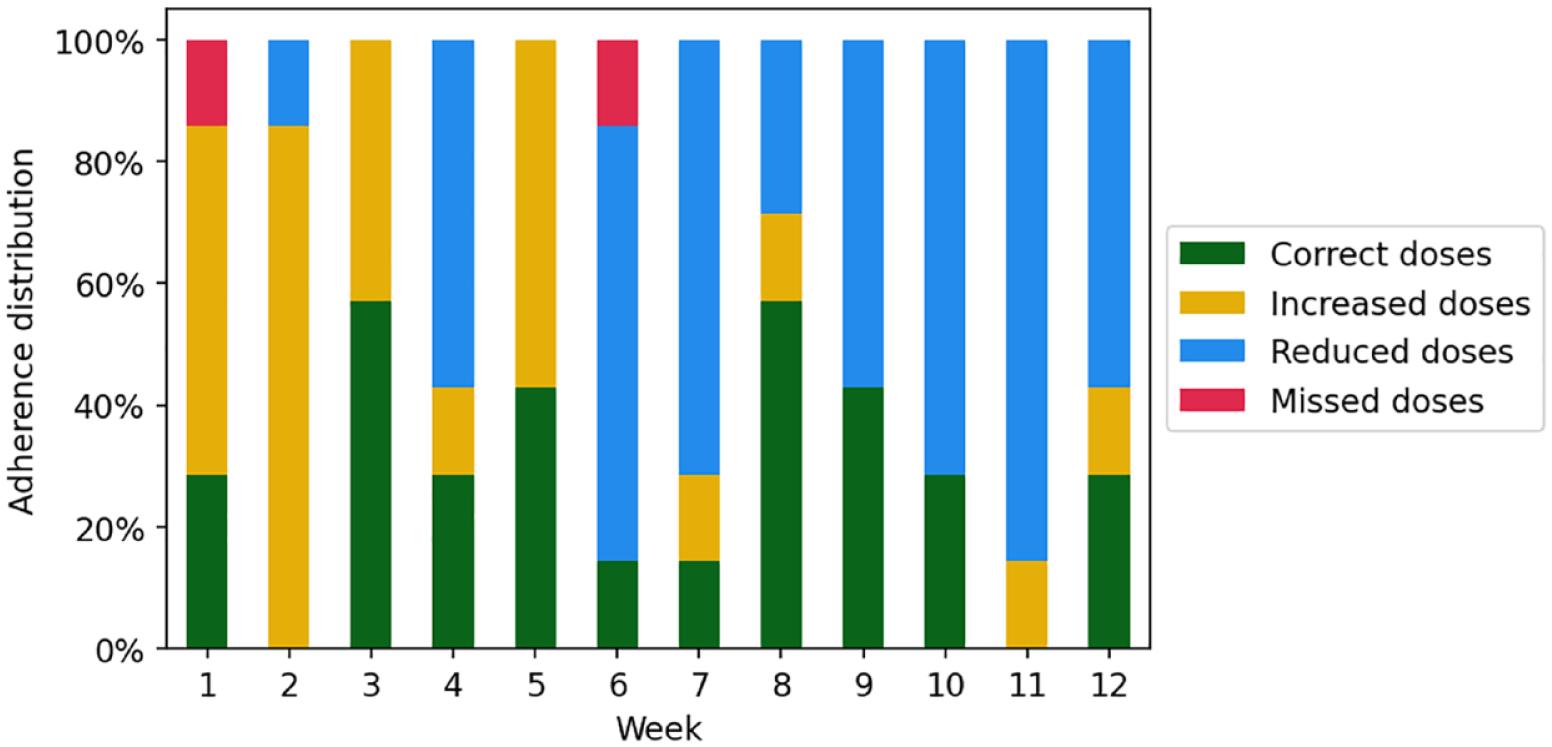
Adherence distribution for case 1.
Case 2: Missed doses
This patient’s injection pattern was irregular (see Figure 5). The instances of nonadherence in some weeks were primarily due to missed doses. Despite the missed doses, the patient generally administered doses correctly, with only a few being adjusted (increased/reduced) during the trial. Notably, in week 9, all doses were administered correctly. It is advisable for the HCP to investigate the reasons for missed doses with no need to proceed to step 3.
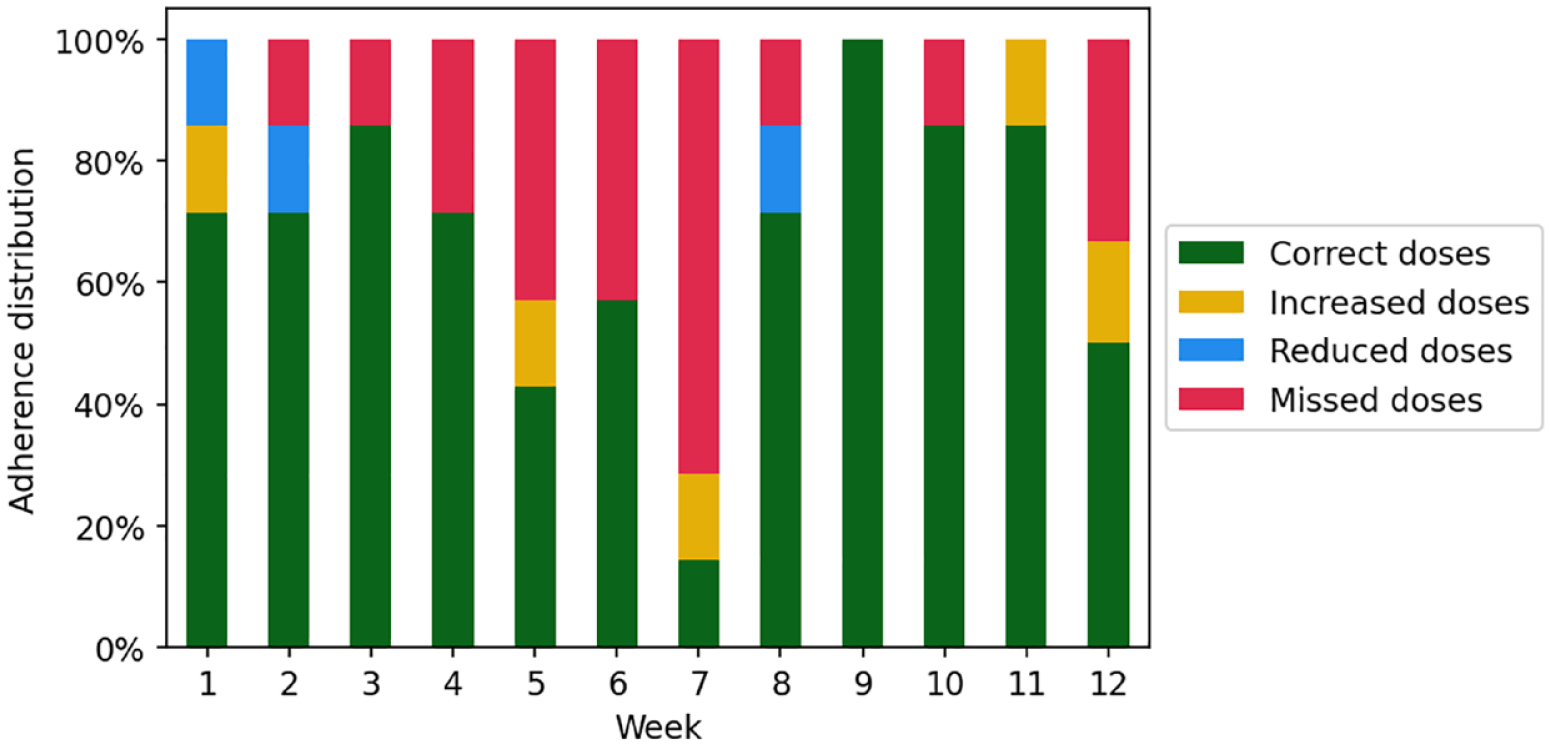
Adherence distribution for case 2.
Step 3: Dose deviation
Two cases will be presented to illustrate step 3, one with large dose deviations and another with micro-adjustments.
Case 1: Large dose deviations
The prescribed dose starts at 30 units and is stepwise increased to 44 units during the selected period (30 days). However, the patient demonstrates large deviations, including instances where the administered dose is twofold compared with the prescribed dose (see Figure 6a). There are notable variations with both increased and reduced doses compared with the prescribed dose, indicating that the patient faces substantial challenges with adherence. In this case, the dose deviation has a mean of seven units, which is relatively close to the prescribed dose, but a range of 46 units (−13 to 33 units) emphasizes the large deviations. Figure 6b illustrates that most of the deviations deviated more than 60% from the prescribed dose. It is important to investigate the underlying reasons for this behavior, such as a lack of understanding of insulin’s effect and usage, to provide tailored support.
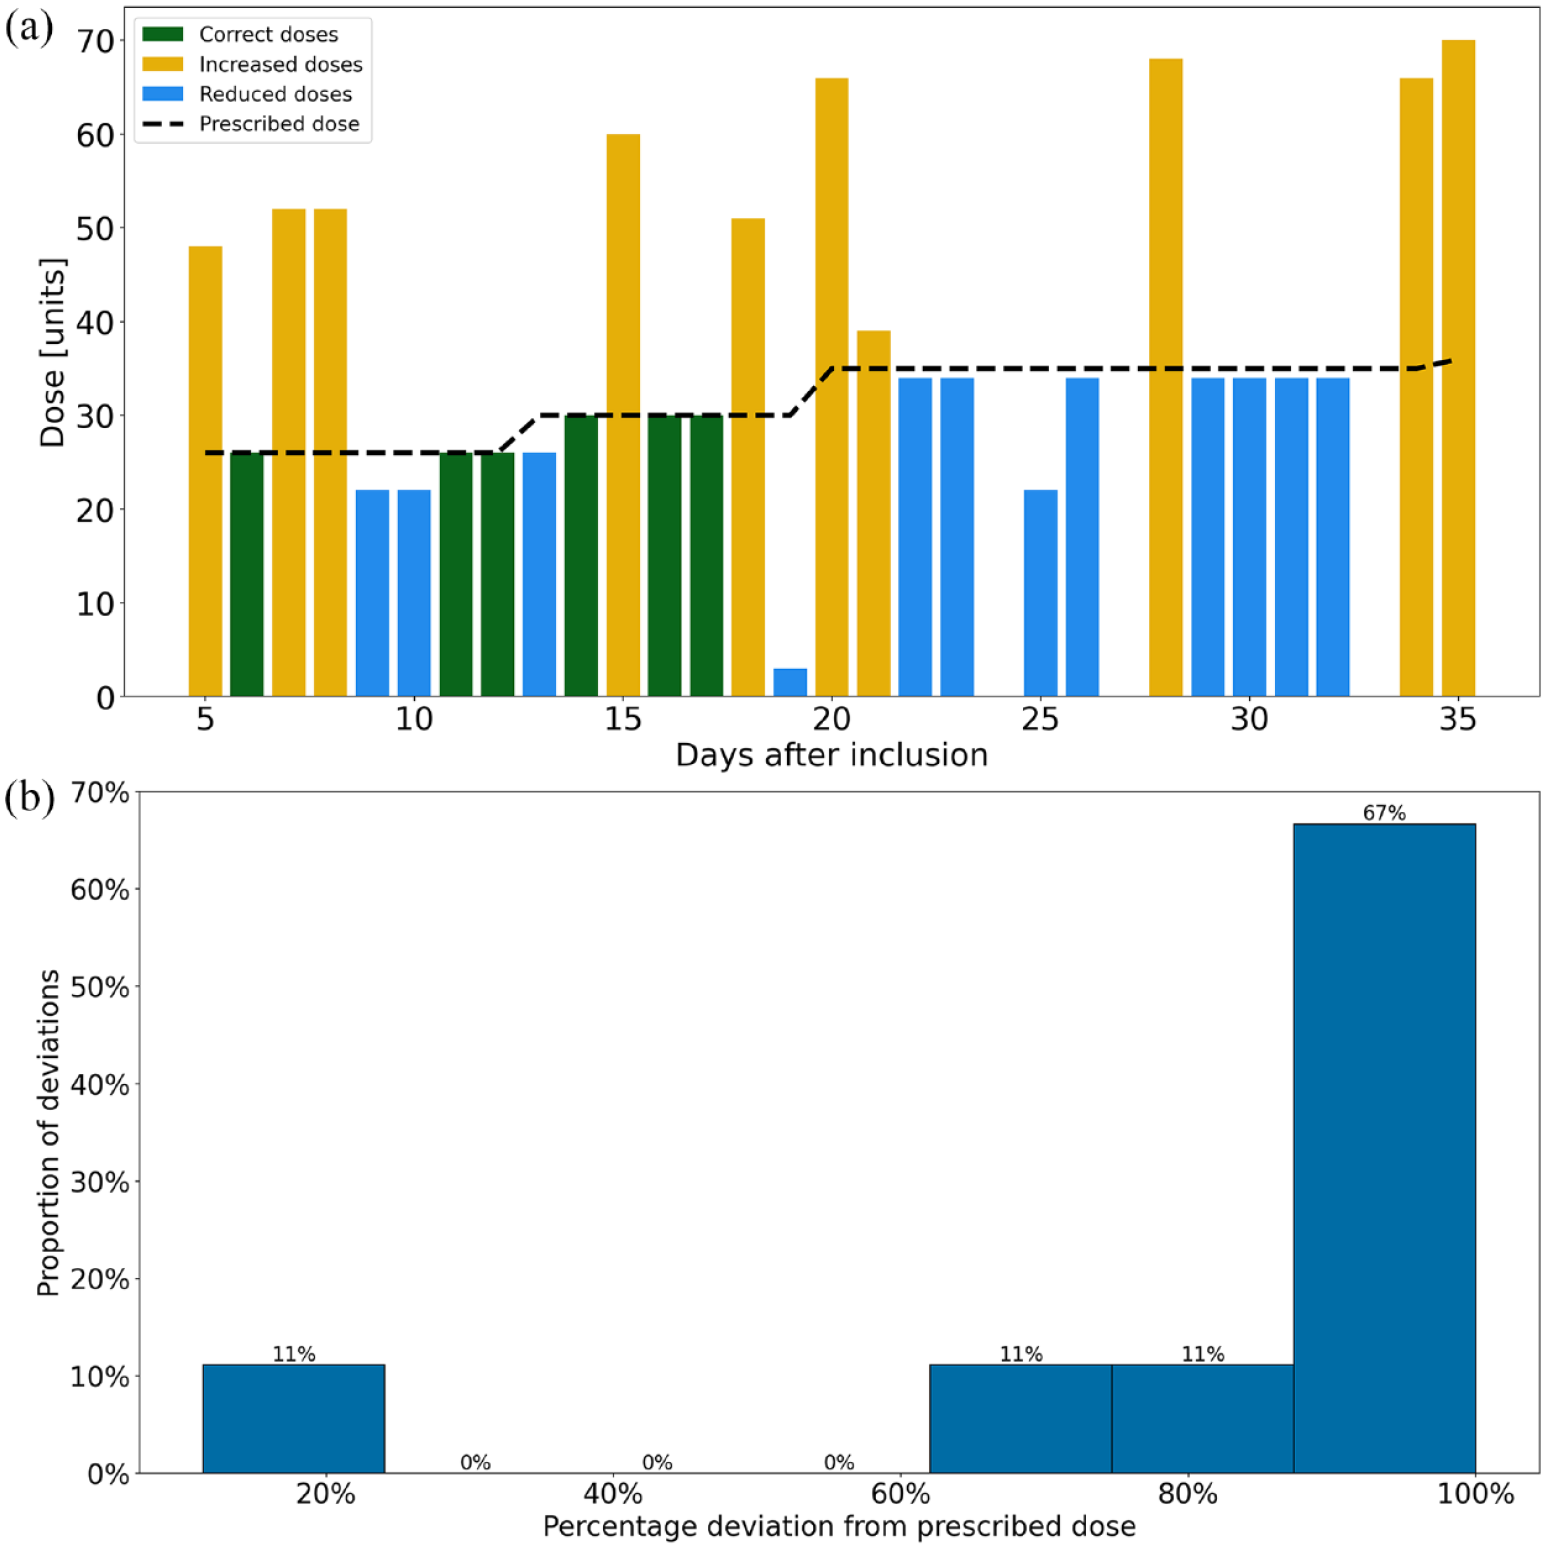
(a) Daily dose deviation for case 1. Missing bars represent missed doses. (b) Distribution of dose deviations (30-day period) for case 1. The deviation is presented as a percentage. Correct doses, missed doses, and the lower 2.5 and the upper 97.5 percentiles are excluded.
Case 2: Micro-adjustments mainly increased doses
Over the 30-day observation period, the patient frequently adjusted the basal insulin dose, often increasing it slightly (see Figure 7a and b). The prescribed dose started at 105 units and was stepwise increased to 130 units during the observation period. In this case, the dose deviation had a mean of three units, which is close to the prescribed dose. The range of nine units (0-9 units) and a maximum deviation of <9% from the prescribed dose further emphasize the micro-adjustments. The reason for this behavior should be investigated. Yet, the patient’s glycemic control should be taken into consideration; if the patient achieves good glycemic control, the micro-adjustments probably will not pose a risk to this patient’s health outcomes.

(a) Daily dose deviation for case 2. Missing bars represent missed doses. (b) Distribution of dose deviations (30-day period) for case 2. The deviation is presented as a percentage. Correct doses, missed doses, and the lower 2.5 and the upper 97.5 percentiles are excluded.
Discussion
This is the first study demonstrating how insulin dosing data obtained from connected insulin pens can be effectively used by HCPs to assess insulin adherence in patients with T2D. This study establishes a comprehensive three-step methodology for evaluating different aspects of nonadherence enabling HCPs to gain a comprehensive understanding of a patient’s adherence.
The results from this study demonstrate that our method is capable of detecting and differentiating instances of missed doses, increased doses, and reduced doses, which commonly used methods cannot encompass. 24 Type, frequency, and deviation are important aspects of adherence. Recognizing diverse nonadherence patterns is crucial since, for example, common factors such as forgetfulness or complexity do not apply to many nonadherent patients who discontinue early or do not start medication at all. Consequently, some adherence support strategies such as reminders or dosing organizers may be irrelevant for these patients. 10 Therefore, our method offers a detailed examination, providing HCPs with insights to customize support effectively.
Furthermore, our method provides HCPs with a comprehensive overview that includes adherence tendencies and developments over time. This is important because otherwise some patients may be erroneously classified as either adherent or nonadherent. For instance, the patient exemplified in case 2 (step 1) has an overall adherence level of 70.7% but shows improvement during the trial and has an adherence level of >80% in the last seven weeks out of the total 12 weeks. This improvement would probably not have been detected using the traditional methods, for example, pharmacy claims–based calculations.
In this study, we assessed basal insulin adherence as an example. However, we believe that the method could be applied to other self-injectable medications where HCPs would wish to assess adherence, for example, bolus insulin. This could also be patients with rheumatoid arthritis, multiple sclerosis, or those requiring human growth hormone. 8 Yet, for this to be possible, it would require that the medicine be administered with a device able to record and transfer administration data. We also believe that the methodology could be applied to other types of medication, where the administration can be recorded and logged, for example, with an electronic pill dispenser.
Although our three-step methodology using insulin dosing data seems promising, potential obstacles to clinical use should be noted. First, HCPs may lack qualifications to interpret insulin dosing data, 25 but our experiences from the DiaMonT trial indicate HCPs ease in using recorded pen data. We anticipate similar results with the new method, though further studies are needed to assess usability and HCP attitudes. Second, for clinical implementation, the three-step method must integrate seamlessly into HCP systems, for example, functioning like an Ambulatory Glucose Profile. 26 Data should be presented as a one-page standardized report with numeric and graphic inulin injection data. Third, concerns about connected pen failures and costs may arise for some patients. However, high patient satisfaction and economic benefits have been observed with connected pens. 16 Last, the methodology lacks validation and requires future studies for verification.
While others have mainly included completion and timing of a dose in their definition of adherence, we did not take mistimed doses into consideration. Instead, we included completion and dose size. This is because people on basal insulin should only adjust their dose size after several successive days with either high or low blood glucose levels due to the pharmacokinetics. 27 Therefore, if they do so more often, it can be counted as a dosing irregularity. Furthermore, the profile of the long-acting insulin used (Tresiba; Novo Nordisk A/S) makes it less important to administer the insulin at a specific time each day. 28 However, if the method is to be used for another type of medicine, the time of administration might be an important factor that should be accounted for in the definition of adherence.
Limitations
Our three-step methodology using insulin dosing data is a potential tool for assessing adherence, but some limitations are noted. First, specific reasons for possible nonadherence are not investigated. A more detailed exploration of the reasons behind limited adherence is essential for tailoring effective interventions. Furthermore, this limitation introduces a risk of some doses being erroneously counted as missed or incorrect, for example, patients may deviate from their prescribed insulin doses due to daily activities, or a patient may have used another insulin pen on days where no dose was recorded. However, in clinical practice, HCPs can use the method as an initial assessment and can obtain a more complete understanding of nonadherent behaviors during the therapeutic dialogue. 18 Yet, the therapeutic dialogue that follows the initial assessment is potentially time-consuming, but may also help to identify whether a treatment has limited effect due to nonadherence. Future studies should address reasons for nonadherence as it would be clinically helpful for HCPs and would contribute significantly to the field. Second, prescribed doses were initially recorded on paper by trial personnel and later transcribed into Excel. This manual transcription process carries the risk of errors and discrepancies, a common concern in health care and data entry, potentially leading to inaccuracies or misinterpretations.
Conclusion
Common adherence assessment methods have limitations in providing detailed adherence information. Consequently, this leads to presumptions and suboptimal treatment of nonadherence. Using data from a connected insulin pen, we developed a three-step methodology evaluating three aspects of adherence (overall adherence, adherence distribution, and dose deviation) providing HCPs with detailed access to previously limited clinical data on insulin administration. Using our method, it is possible to identify specific nonadherence behaviors (missed doses, increased doses, and reduced doses) and our methodology provides valuable insights for tailoring the most appropriate forms of support.
Footnotes
Abbreviations
HCP, health care provider; T2D, type 2 diabetes.
Declaration of Conflicting Interests
The author(s) declared the following potential conflicts of interest with respect to the research, authorship, and/or publication of this article: MHJ is an employee of, and holds stock in, Novo Nordisk A/S and PV is head of research at Steno Diabetes Center North Denmark funded by an unrestricted grant from the Novo Nordisk Foundation. Apart from that, we declare that no conflicts of interest are associated with this publication and that Novo Nordisk A/S did not influence the research or its presentation.
Funding
The author(s) received no financial support for the research, authorship, and/or publication of this article.