
Abstract
Background and aims:
The Q-Score is a single-number composite metric that is constructed based on the following components: central glycemic tendency, hyperglycemia, hypoglycemia, and intra- and interday variability. Herein, we refined the Q-Score for the screening and analysis of short-term glycemic control using continuous glucose monitoring (CGM) profiles.
Methods:
Continuous glucose monitoring profiles were obtained from noninterventional, retrospective cross-sectional studies. The upper limit of the Q-Score component hyperglycemia‚ that is, the time above target range (TAR), was adjusted from 8.9 to 10 mmol/L (n = 1562 three-day-sensor profiles). A total of 302 people with diabetes mellitus treated with intermittent CGM for ≥14 days were enrolled. The time to stability was determined via correlation-based analysis.
Results:
There was a strong correlation between the Q-Scores of the two TARs, that is, 8.9 and 10 mmol/L (Q-ScoreTAR10 = −0.03 + 1.00 Q-ScoreTAR8.9, r = .997, p < .001). The times to stability of the Q-Score and TIR were 10 and 12 days, respectively. The Q-Score was correlated with fructosamine concentrations, the glucose management indicator (GMI), the time in range (TIR), and the glycemic risk index (GRI) (r = .698, .887, –.874, and .941), respectively. The number of Q-Score components above the target increased as the TIR decreased, from two (1.7 ± 0.9) in CGM profiles with a TIR between 70% and 80% to four (3.9 ± 0.5) in the majority of the CGM profiles with a TIR below 50%. A conversion matrix between the Q-Score and glycemic indices was developed.
Conclusions:
The Q-Score is a tool for assessing short-term glycemic control. The Q-Score can be translated into clinician opinion using the GRI.
Keywords
Introduction
Continuous glucose monitoring (CGM) is rapidly improving diabetes management.1-4 Standardized reports from CGM devices, such as the Ambulatory Glucose Profile (AGP), are recommended for the analysis and interpretation of CGM data. 5 The AGP report contains the actual AGP, a composite display of daily glycemic patterns that superimposes data for the relevant data period, including the median glucose concentration and the interquartile and interdecile ranges. 6 The AGP also provides an overview of CGM metrics related to short-term glycemic control, such as time in range (TIR), time above target range (TAR), time below range (TBR), and glucose variability, expressed as the coefficient of variation (CV).5-7 Among those parameters, the TIR has become a widely used parameter in daily diabetes care.8-11
In 18 countries, representing approximately 50% of the global population, primary care physicians treat the majority of people with diabetes, followed by diabetes specialists, 12 and can spend 5 minutes or less with their patients. 13 Nondiabetes specialists might need additional guidance to screen for CGM profiles that require attention and to identify glucose profile factors that are outside of the target range.14-16 This need can be strengthened by the increasing prevalence of people living with type 1 and type 2 diabetes,17,18 the increased use of CGM devices for the standard of care for people with type 1 diabetes and people with type 2 diabetes receiving insulin therapy19,20 and a shortage of diabetes specialists. 20
Composite metrics have been introduced as screening tools for assessing the glycemic quality of CGM patients.16,21 We developed the Q-Score, a quality evaluation score, for the evaluation of CGM profiles. 22 The Q-Score is a single-number summary of the quality of glucose profiles. The Q-Score equation was constructed based on the main factors of the glucose profile, which are central glycemic tendency, hyperglycemia, hypoglycemia, and intra- and interday variations. The result of the calculation is a number that provides information about the quality of glycemic control based on an existing CGM glucose profile of a defined period of time. A low Q-Score indicates good glycemic control, and a high Q-Score indicates insufficient glycemic control. 22 An analysis of the Q-Score components would help to identify the factors related to the glucose profile that deserve attention, thus leading to personalized therapeutic recommendations.23,24
In this study, we further developed the Q-Score for screening the quality of glucose profiles derived from the data output of CGM devices, compared its performance with that of the TIR, and suggested a personalized approach for identifying parameters requiring therapeutic attention.
Materials and Methods
Study Design
This was a noninterventional, retrospective cross-sectional study performed at the Department for Diabetology, Klinikum Karlsburg, Heart and Diabetes Center Karlsburg, Germany. The protocol was approved by the Regional Ethics Review Board of the University of Greifswald (Germany). All participants provided informed consent prior to enrollment. The study was performed in accordance with the Good Clinical Practice guidelines of the Declaration of Helsinki in its latest form. Participants were enrolled between 2021 and 2023. The inclusion criteria were diabetes mellitus, age older than 18 years, and use of intermittently scanned CGM (isCGM) with a sensor data quality of at least >70%, that is, >70% of the data recorded for ≥14 consecutive days prior to admission. A lack of written consent resulted in exclusion from the study.
Participants were recruited during their inpatient stay. Participants underwent isCGM with the flash scanning sensor FreeStyle Libre 2, and the data were recorded using the associated reader. At admission (day 0 of the study), participants underwent routine anthropometric procedures and anamnesis interviews. Fasting blood was collected for diabetes laboratory parameters, including fructosamine and HbA1c, on the following day (day 1). Glucose data from the flash scanning reader were exported using FreeStyleLibre Software. Continuous glucose monitoring data were analyzed for a maximum of 21 days (day −21 to −1) before admission (day 0) for parameters of glycemic control reflecting daily life conditions.
Participants
A total of 302 people with diabetes (type 1 or 2 and pancreatic) were enrolled in the study. Insufficient sensor data quality (% of sensor data obtained < 70%) was revealed for 27 participants. A complete analysis was performed with data from 275 participants—142 individuals diagnosed with type 1 diabetes mellitus, 116 individuals with type 2 diabetes mellitus, and 17 individuals with pancreatic diabetes mellitus. A total of 127 participants were females, and 148 were males (Table 1). Measures of glycemic control were retrospectively analyzed for 275 participants between day −1 and day −14, while glycemic control was analyzed for 254 participants between day −1 and day −21.
Baseline Characteristics of the Study Participants.
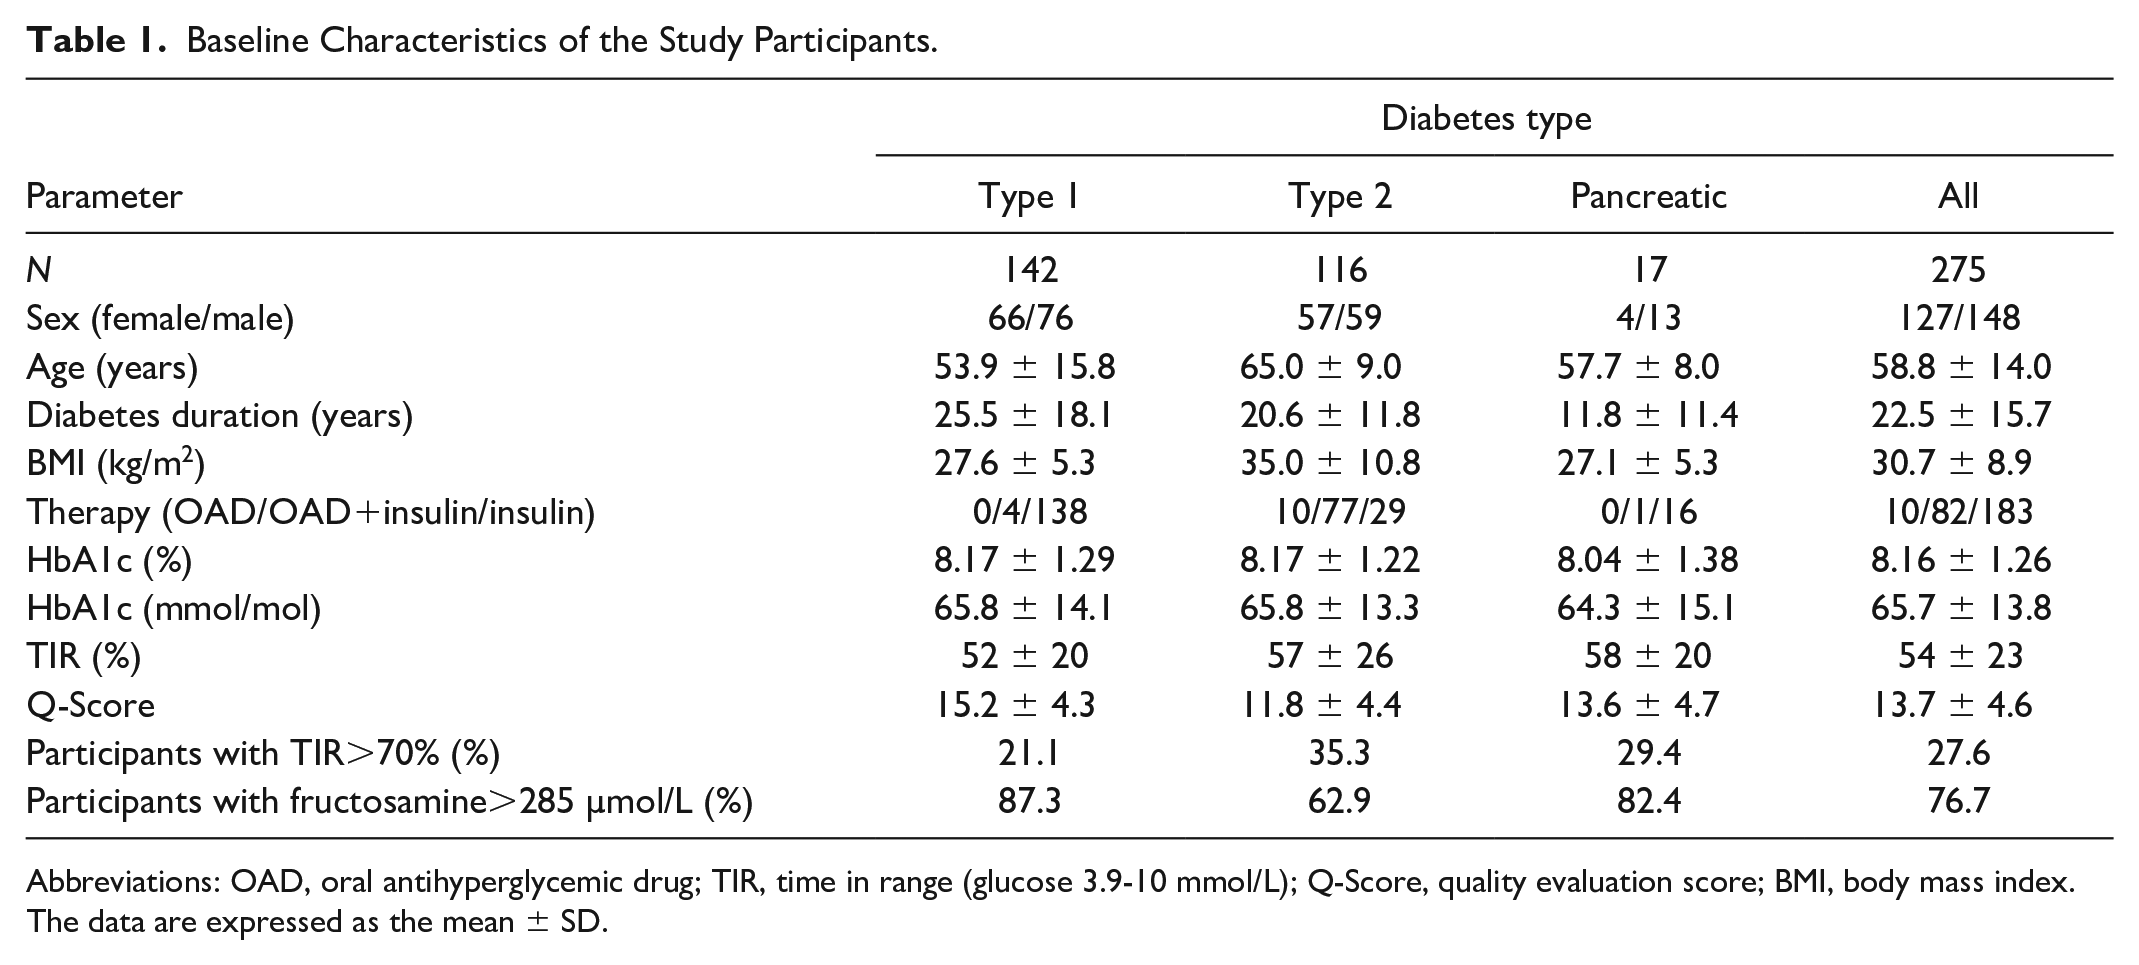
Abbreviations: OAD, oral antihyperglycemic drug; TIR, time in range (glucose 3.9-10 mmol/L); Q-Score, quality evaluation score; BMI, body mass index.
The data are expressed as the mean ± SD.
Q-Score
The Q-Score 22 is a metric for the analysis of glucose data obtained from CGM devices. The equation for the Q-Score was constructed based on the following parameters: mean sensor glucose (MSG; in mmol/L), range (in mmol/L), mean of daily differences (MODD) (in mmol/L), and times spent above or below the target range of 3.9 to 8.9 mmol/L (previously abbreviated as t[hyper] and t[hypo], expressed as hours). To improve readability, herein, “time spent above target” is abbreviated as TAR, and “time spent below target” is abbreviated as TBR. 5
Biochemical Assays
Fructosamine concentration was determined using a colorimetric test and a Roche/Hitachi cobas c III system (Roche Diagnostics GmbH). A total of 285 µmol/L was the upper limit for the normal range of fructosamine. HbA1c was determined by the automated HbA1c D-10TM System from Bio-Rad Laboratories (California, USA), which utilizes ion-exchange high performance liquid chromatography (HPLC) technology.
Statistical Analysis
All the statistical analyses were performed using PASW Statistics for Windows, version 18.0 (SPSS, Inc., Chicago, IL). The results are presented as the means ± standard error of the mean (SEMs), means ± standard deviations (SDs), medians (interquartile ranges [IQRs]), or percentages (%) and are presented as the means ± SEMs. The mean absolute deviation (MAD) is given as the median and IQR.
For bivariate comparisons between metrics, scatterplots were constructed based on the results of linear regression and Pearson’s correlation analysis. One-way and two-way analysis of variance (ANOVA) were used when comparing multiple groups. To compare two correlation coefficients, we used the online calculator StatistikGuru, version 1.96. 25
Measures of glycemic control derived from isCGM were reported as recommended. 11 TIR is the percentage or hours of time spent in the consensus target glucose range of 3.9 to 10 mmol/L, TBR is the percentage or hours of time spent with glucose levels < 3.9 mmol/L, and TAR>10 is the percentage or hours of time spent with glucose levels > 10 mmol/L. A TAR>8.9 is the percentage or hours of time spent with glucose levels > 8.9 mmol/L. The glucose management indicator (GMI) is a measure of short-term glucose levels. 26 The glycemia risk index (GRI) was determined in accordance with a recent publication. 21 The CV (%) was determined by multiplying the SD/mean glucose by 100 for 14 days. The Q-Score8.9, considering the target glucose range of 3.9 to 8.9 mmol/L, was calculated as described previously. 22
The time to stability, that is, the minimum duration of data that was closely correlated (r 2 ≥ .95) with the data taken across the whole sampling period, was determined as described by Rama Chandran et al. 27 p < .05 indicated statistical significance. All the data generated or analyzed during this study are included in the published article.
Results
Q-Score Adjustment to the Target Range of 3.9 to 10 mmol/L
In previous studies, the Q-Score was calculated using CGM data from at least three consecutive days, with a euglycemic target range of 3.9 to 8.9 mmol/L.22,23 Based on international recommendations, the Q-Score target range was adjusted to 3.9 to 10 mmol/L10 using the original data set of n = 1562 CGM profiles including 499 females and 1063 males with type 1 (n = 48) or type 2 diabetes (n = 1514). 22 Therefore, the limit for the TAR was increased from 8.9 to 10 mmol/L. We found a high correlation (r = .958) between the TAR values with a cutoff of 8.9 mmol/L and the TAR values with a cutoff of 10 mmol/L for hyperglycemia (Figure 1a).
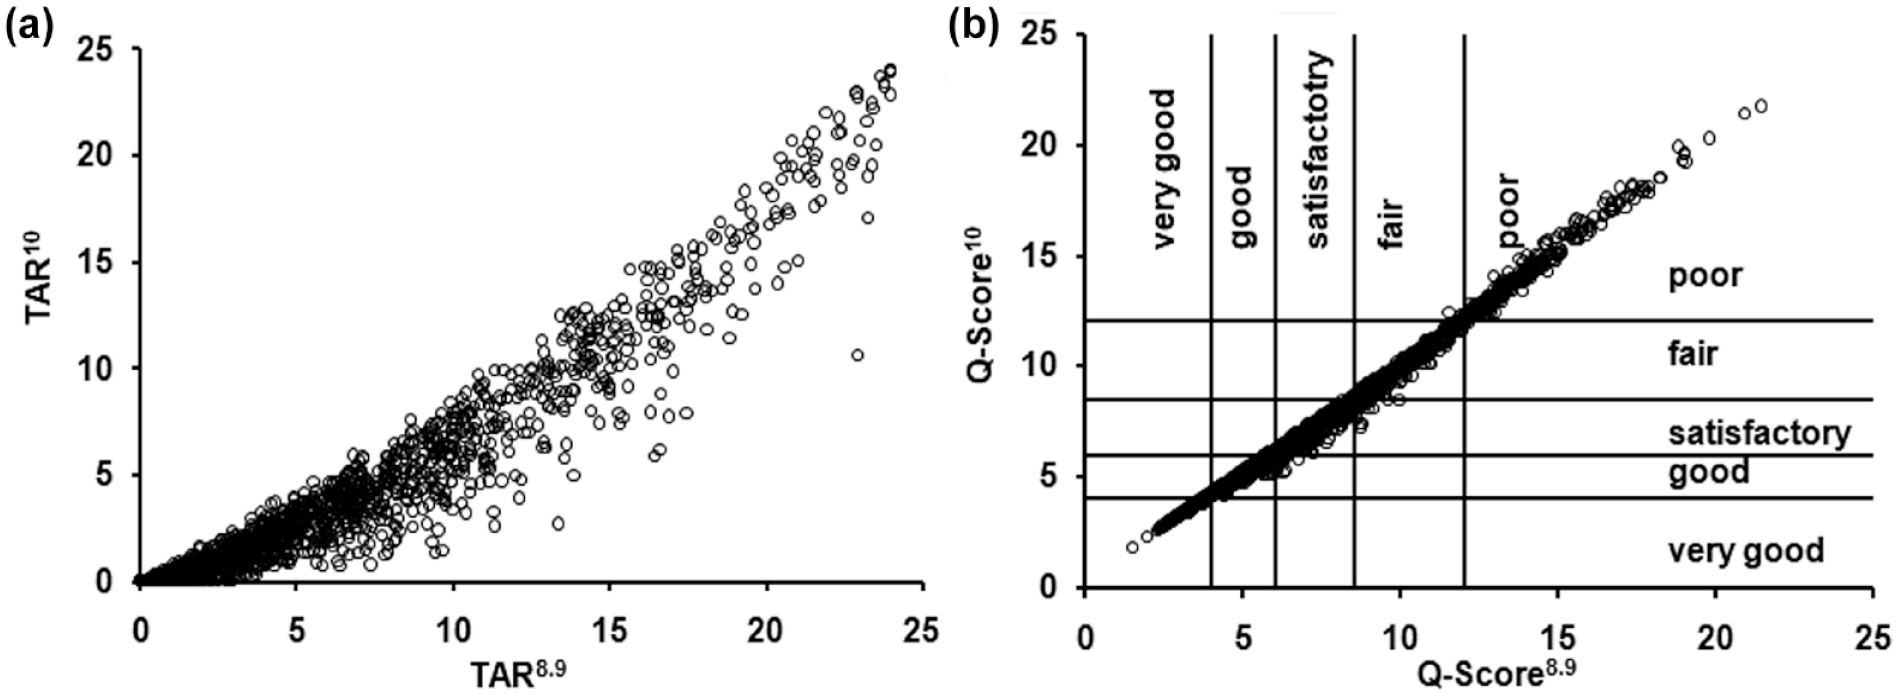
(a) Scatterplot demonstrating the strong correlation between TAR8.9 versus TAR10 (r = .958). (b) Scatterplot of the Q-Scores calculated with TAR8.9 versus TAR10 (r = .997).
The Q-Score is calculated from five components: MSG, intra- and interday variability (range, MODD), time in hyperglycemia (TAR), and time in hypoglycemia (TBR). The formula for the Q-Score was adjusted to the target range of 3.9 to 10 mmol/L as follows
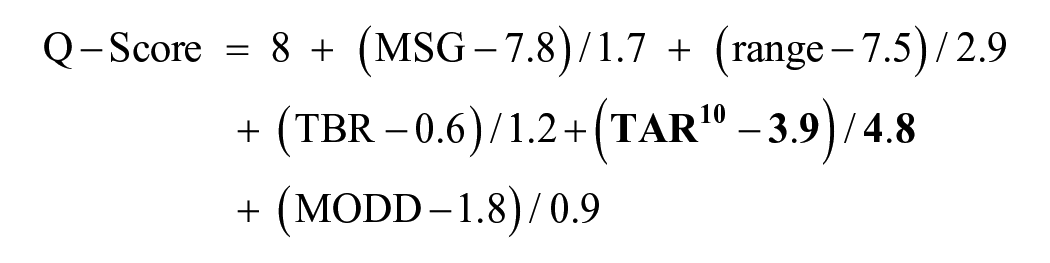
The linear relationship between the Q-Scores calculated by applying both TARs was as follows: Q-Score10 = −0.03 + 1.00 Q-Score8.9. There was a high correlation (r = .997) between the Q-Score8.9 and the Q-Score10 (Figure 1b). The MAD is 0.16 (0.08, 0.27).
Time to Stability of the Q-Score in Comparison With the TIR and CV Measures
We investigated the time to stability of the Q-Score as a function of the number of days of CGM recording, 27 defined as the minimum duration of data needed to reach a coefficient of determination (r 2 ) >.95. The Q-Score was stable after 10 days, the TIR was stable after 12 days, and the CV was stable after 14 days (Figure 2a). The Q-Scores components were stable between 10 and 15 days (Figure 2b).
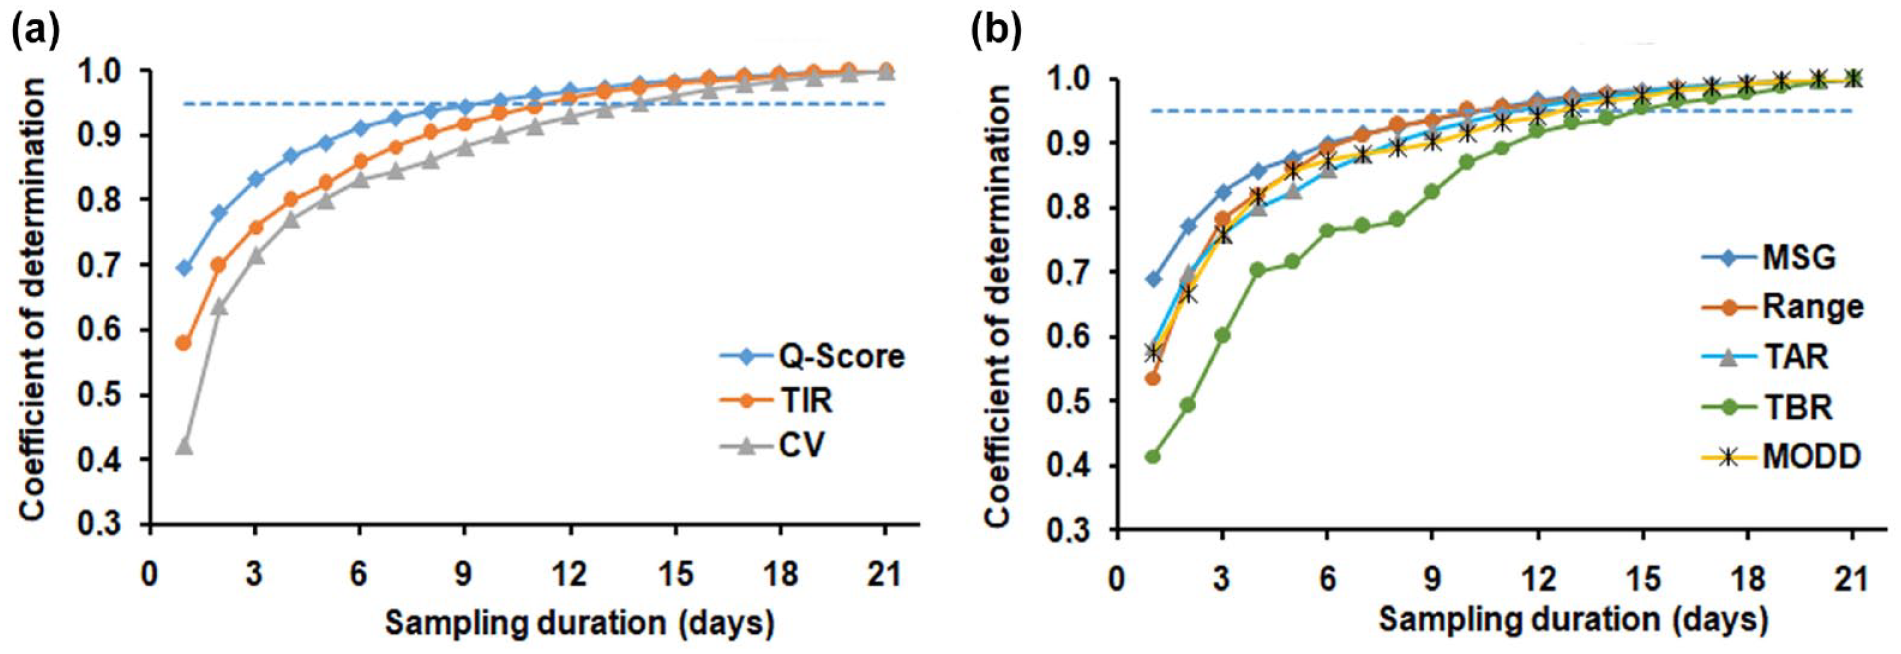
(a) Time to stability given for the Q-Score, TIR, and CV as well as (b) for the Q-Score components MSG, Range, TAR, TBR, and MODD determined by the correlation-based method derived from incremental sampling durations between 1 and 21 recording days.
Comparison of the Q-Score With Parameters of Short-Term Glycemic Control
According to our findings and international consensus statements,10,11 the following results are based on isCGM data sets with a 14-day recording time. The Q-Score had an inverse correlation with the TIR, with a correlation coefficient of –.87 (Figure 3a). The correlation coefficients between the Q-Score and the fructosamine concentration, GMI, CV, and HbA1c were .70, .88, .43, and .74, respectively. All the correlations were significant (p < .001). The glycemic risk index (GRI) estimates the ranking of CGM profiles by clinicians in relation to the quality of glycemia. 21 The Q-Score and GRI were strongly correlated (r = .941) (Figure 4).
(a
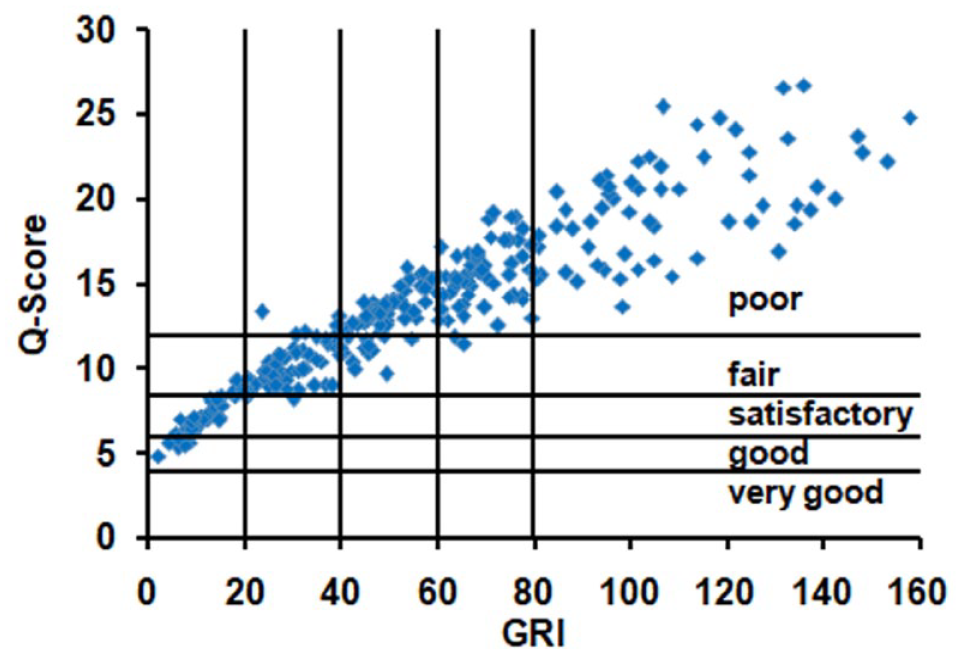
Scatterplot showing individual data for the Q-Score with the GRI. 21
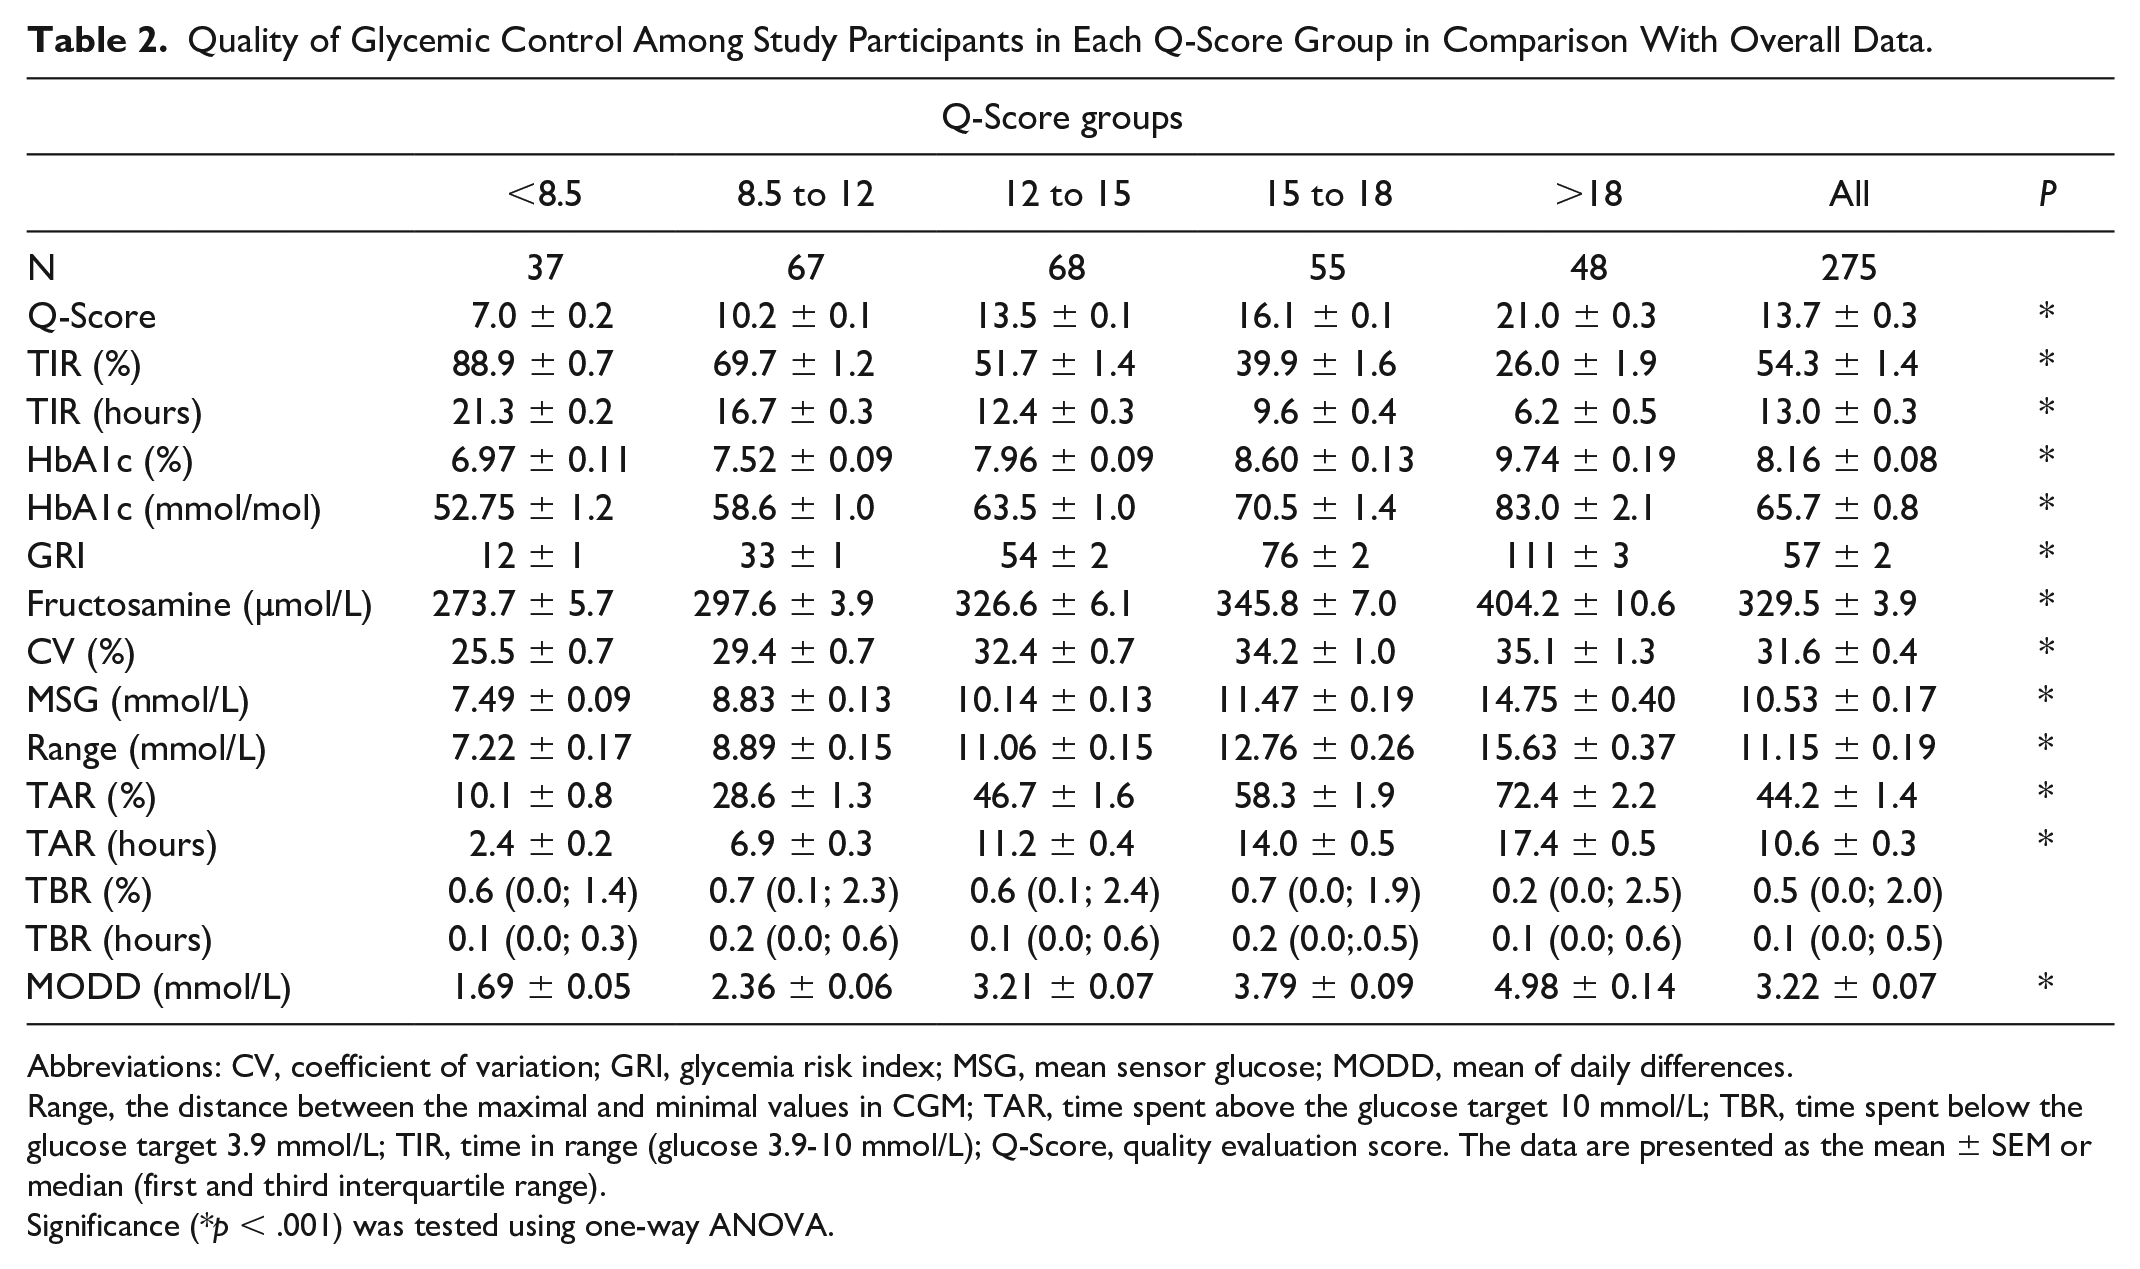
The Q-Score, TIR, GMI, and fructosamine concentration were used to characterize short-term glycemic control (Table 2). The majority of participants had a Q-Score >12 (171/275) and a TIR < 70% (199/275). A total of 37/275 participants had a Q-Score < 8.5. A total of 103/275 participants had a Q-Score > 15. The overall TIR was 54%. A TBR >4% (>1 hour) was detected in 9.8% (27/275) of CGM profiles, with 86% (23/27) of those profiles belonging to people with type 1 diabetes (Supplementary Figure 1).
Quality of Glycemic Control Among Study Participants in Each Q-Score Group in Comparison With Overall Data.
Abbreviations: CV, coefficient of variation; GRI, glycemia risk index; MSG, mean sensor glucose; MODD, mean of daily differences.
Range, the distance between the maximal and minimal values in CGM; TAR, time spent above the glucose target 10 mmol/L; TBR, time spent below the glucose target 3.9 mmol/L; TIR, time in range (glucose 3.9-10 mmol/L); Q-Score, quality evaluation score. The data are presented as the mean ± SEM or median (first and third interquartile range).
Significance (*p < .001) was tested using one-way ANOVA.
Participants were assigned to five Q-Score groups (Table 2). Parameters of short-term control changed significantly as the Q-Score increased. In the group comprising participants with a Q-Score < 8.5, the TIR was the highest, and the GMI and fructosamine were the lowest. Among the participants with a Q-Score > 18, the TIR was the lowest, and the GMI and fructosamine concentration were the highest. Additionally, HbA1c, GRI, 21 fructosamine levels, and CV increased significantly from the Q-Score < 8.5 group to the Q-Score > 18 group. Similarly, the Q-Score components TAR, range, MODD, and MSG were significantly different between the Q-Score groups. The TBR was not significantly different (Table 2).
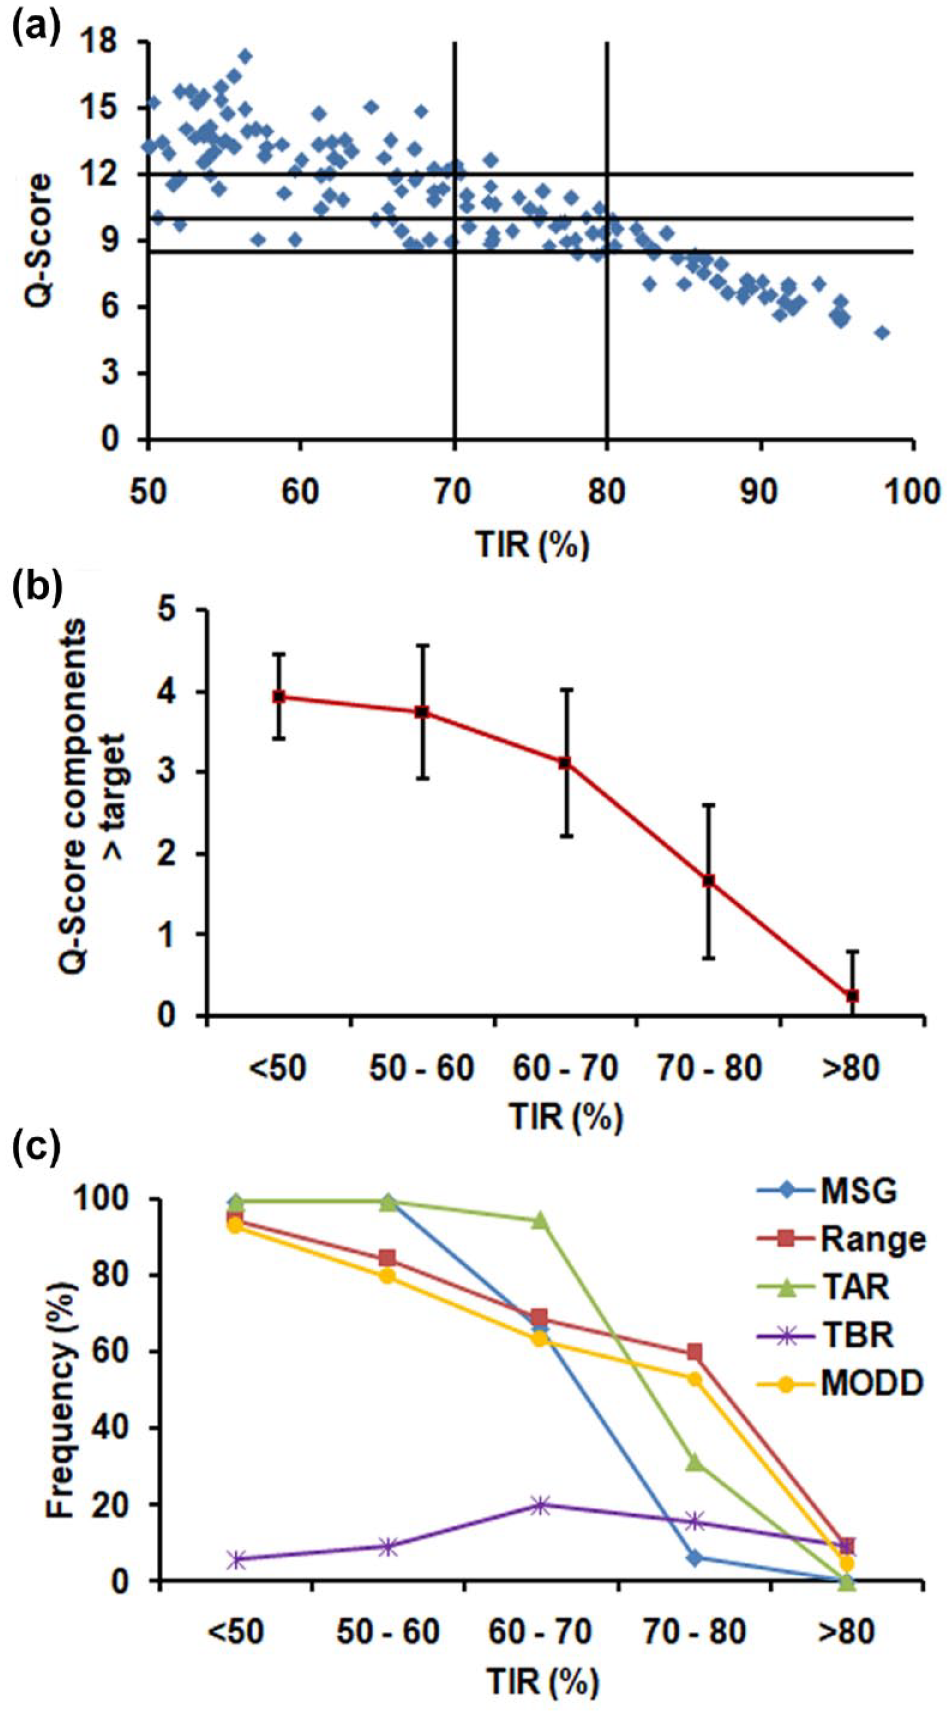
Comparison of the Q-Score and TIR for Describing the Quality of Glycemic Control
The scatterplot for the Q-Score versus the TIR shows that the variance increases as the Q-Score increases and as the TIR decreases. As the TIR decreases, a wider range of Q-Scores is possible for any given TIR (Figure 3a). For further analysis, the TIR was divided into deciles. The group of CGM profiles obtained from patients with a TIR > 80% was characterized by Q-Scores < 10 (Figure 3a). In the group with a TIR ranging from 70% to 80%, 50% of individuals had a Q-Score > 10 and 9.4% of individuals had a Q-Score greater than 12. In the group with a TIR ranging from 60% to 70%, 80% of individuals had a Q-Score above 10 and 42.9% of individuals had a Q-Score greater than 12 (Figure 3a). A TIR below 60% was associated with a Q-Score > 12 in most cases (93%).
Q-Score Components Out-of-Target in Relation to the TIR and Q-Score
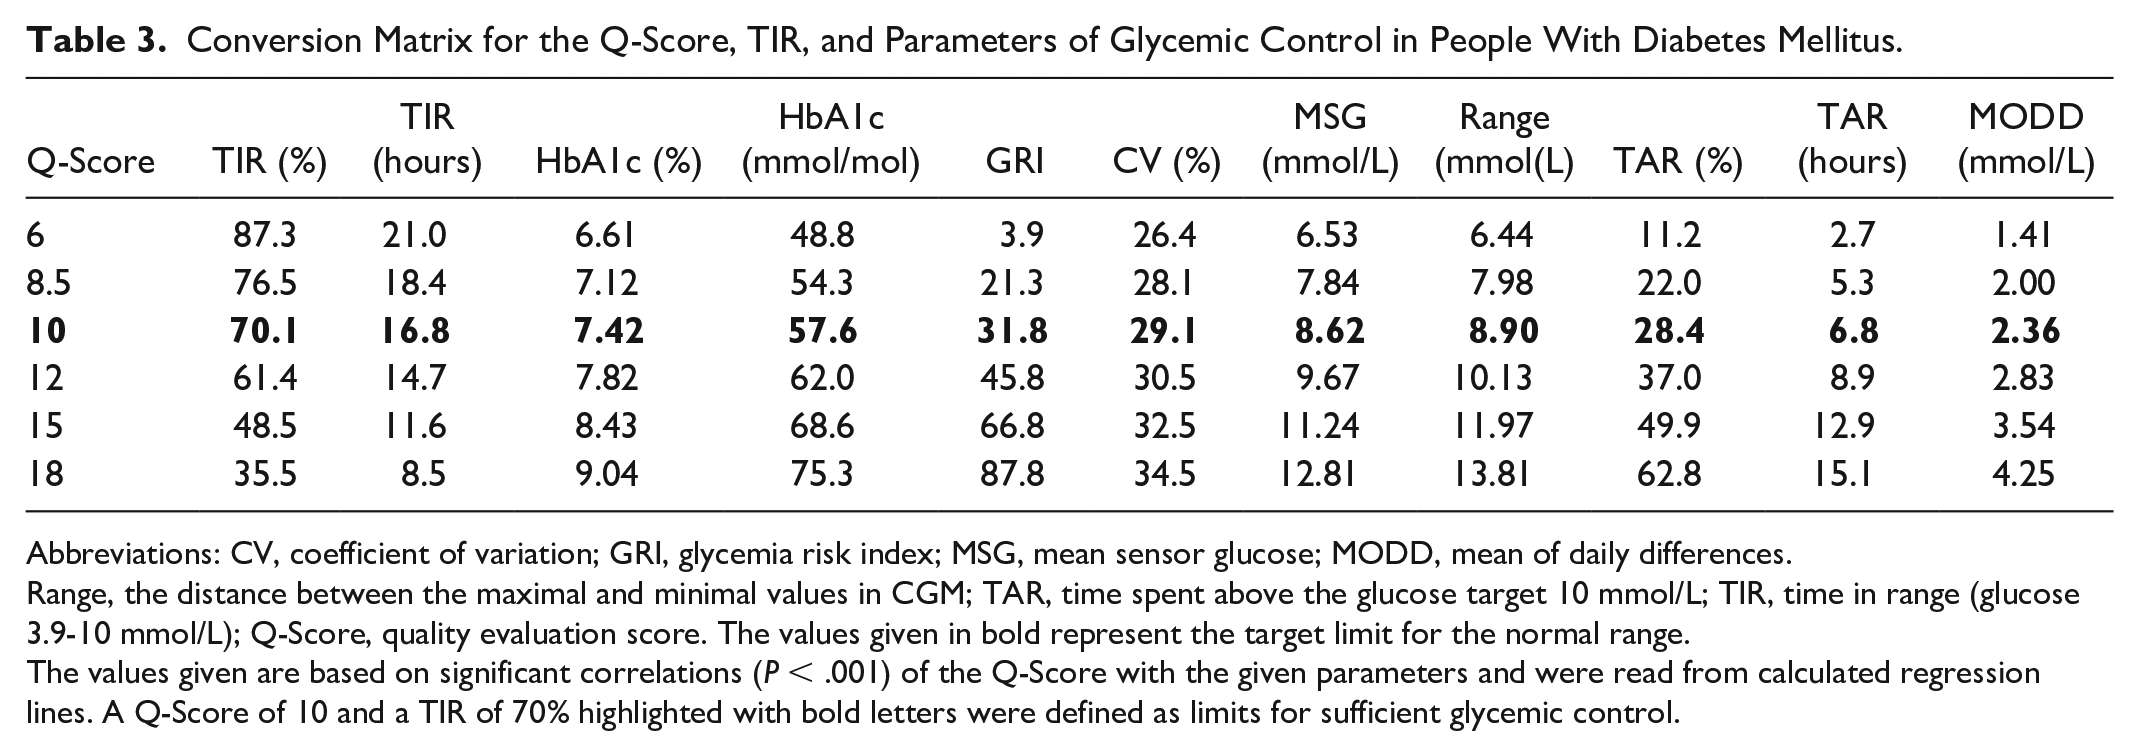
Based on correlation analysis with a Q-Score = 10 and TIR = 70% as the limits for sufficient glycemic control,7,10,11 MSG > 9 mmol/L, range > 9 mmol/L, and MODD > 2.5 mmol/L were defined to be above target (Table 3).
Conversion Matrix for the Q-Score, TIR, and Parameters of Glycemic Control in People With Diabetes Mellitus.
Abbreviations: CV, coefficient of variation; GRI, glycemia risk index; MSG, mean sensor glucose; MODD, mean of daily differences.
Range, the distance between the maximal and minimal values in CGM; TAR, time spent above the glucose target 10 mmol/L; TIR, time in range (glucose 3.9-10 mmol/L); Q-Score, quality evaluation score. The values given in bold represent the target limit for the normal range.
The values given are based on significant correlations (P < .001) of the Q-Score with the given parameters and were read from calculated regression lines. A Q-Score of 10 and a TIR of 70% highlighted with bold letters were defined as limits for sufficient glycemic control.
Q-Score components above the target range already appear in CGM profiles with TIRs between 70% and 80% (Figure 3b, Table 4). Continuous glucose monitoring profiles with TIRs between 60% and 70% had two to four Q-Score components above the target. For CGM profiles with a TIR less than 50%, the majority of the Q-Score components were above the target range (data not shown).
Evaluation of Glycemic Control Based on isCGM Profiles Using Q-Score Components, Q-Scores, and the TIR.
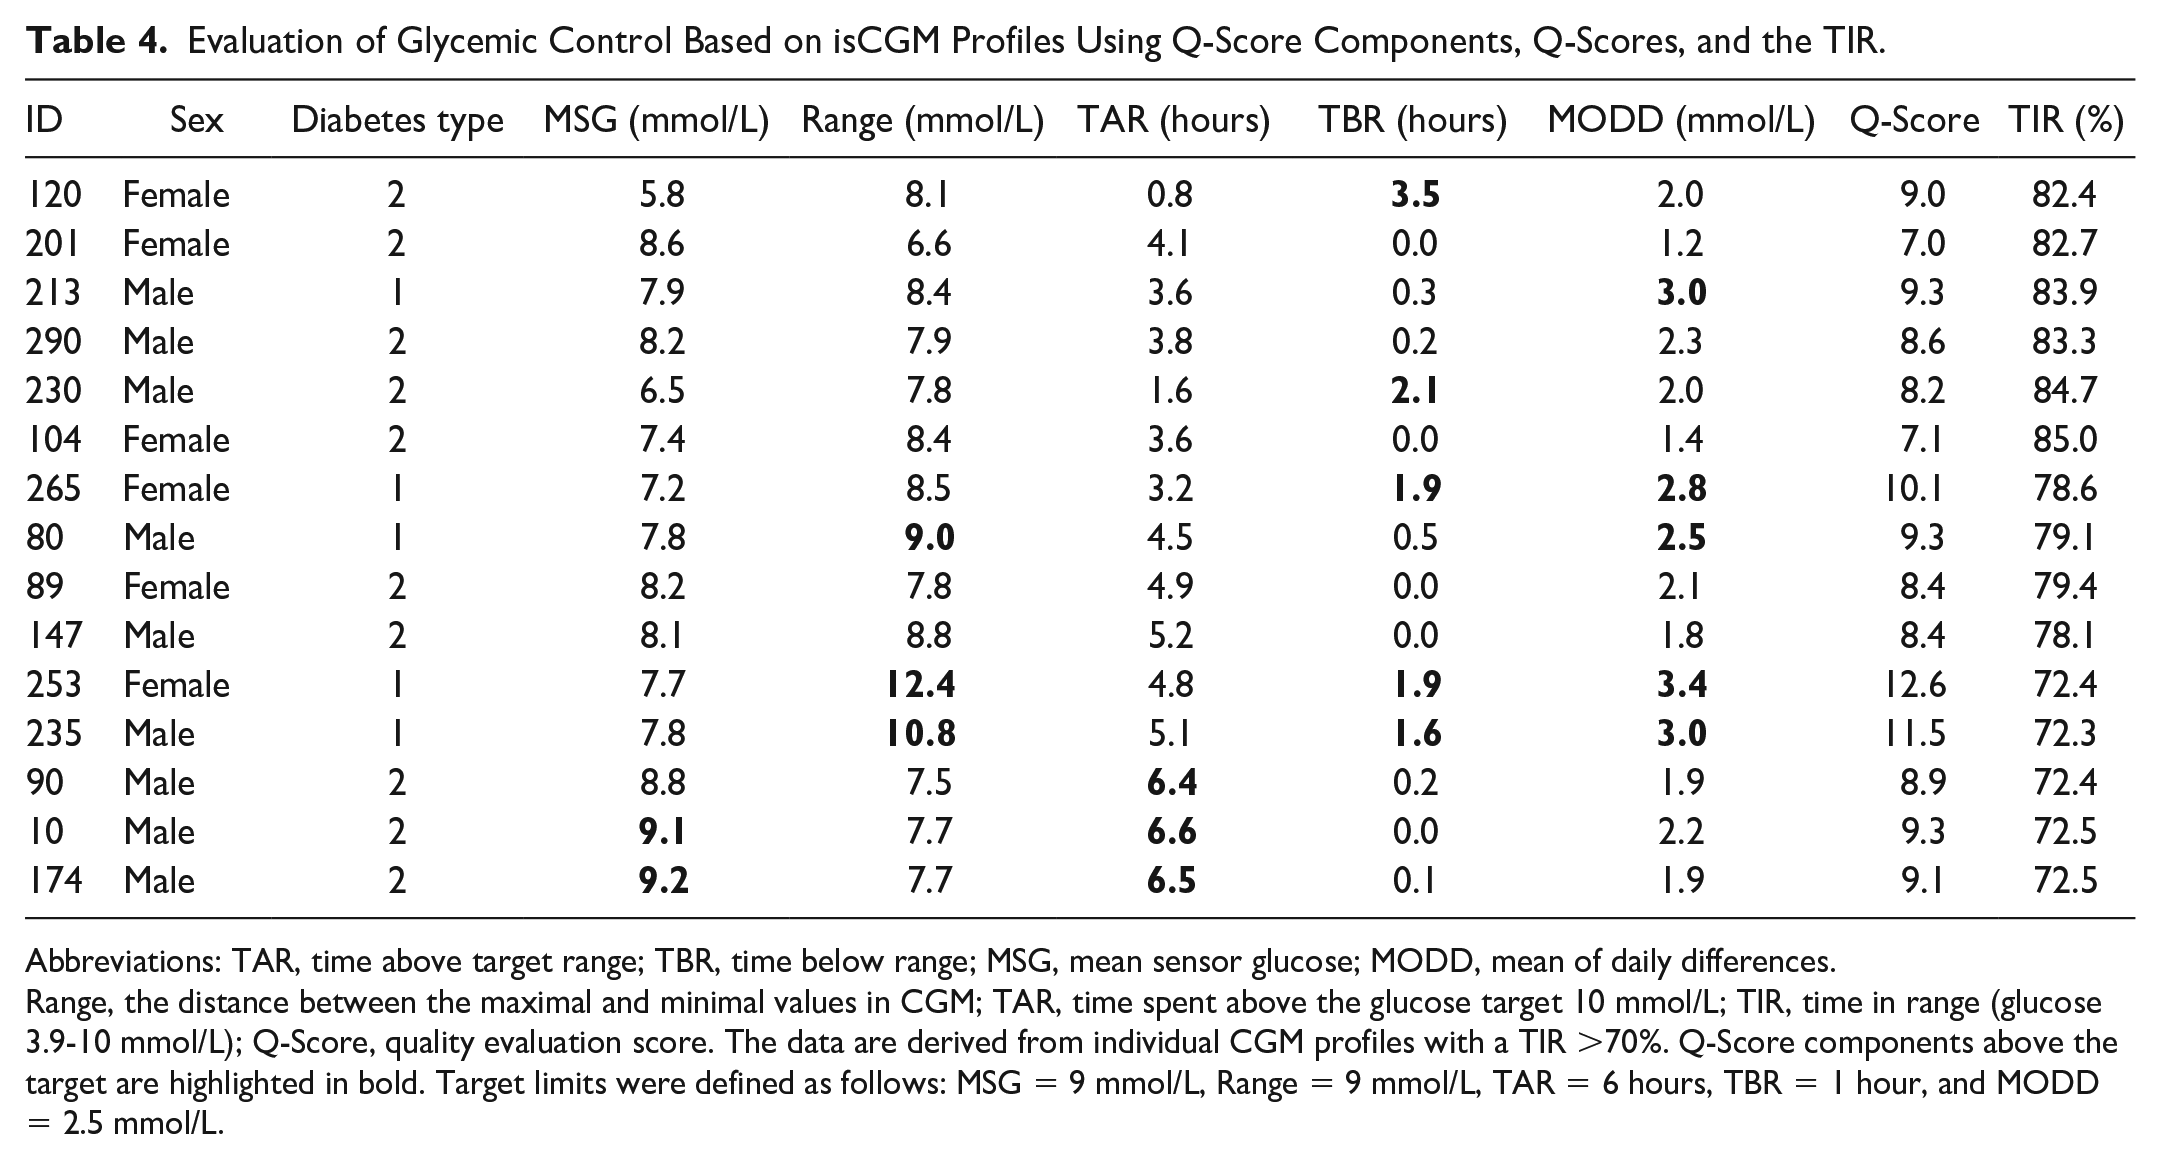
Abbreviations: TAR, time above target range; TBR, time below range; MSG, mean sensor glucose; MODD, mean of daily differences.
Range, the distance between the maximal and minimal values in CGM; TAR, time spent above the glucose target 10 mmol/L; TIR, time in range (glucose 3.9-10 mmol/L); Q-Score, quality evaluation score. The data are derived from individual CGM profiles with a TIR >70%. Q-Score components above the target are highlighted in bold. Target limits were defined as follows: MSG = 9 mmol/L, Range = 9 mmol/L, TAR = 6 hours, TBR = 1 hour, and MODD = 2.5 mmol/L.
Q-Score components above targets (n= 1.4 ± 0.7) were detected in isCGM profiles with Q-Scores between 8.5 and 10 (Figure 5a). For example, isCGM ID120 had a Q-Score of 9 and a TBR of 3.5 (Table 4). The number of components above the target increased to 2.6 ± 0.7 in the group with Q-Scores from Group 10 to 12, as exemplified for the CGM profiles ID235 and ID265 (Table 4). An additional increase to 3.7 ± 0.6 was observed in the group with Q-Scores from 12 to 15 (CGM profile ID253), and a further increase to 4.1 ± 0.4 in the group with Q-Scores > 15 (Figure 5a and b).
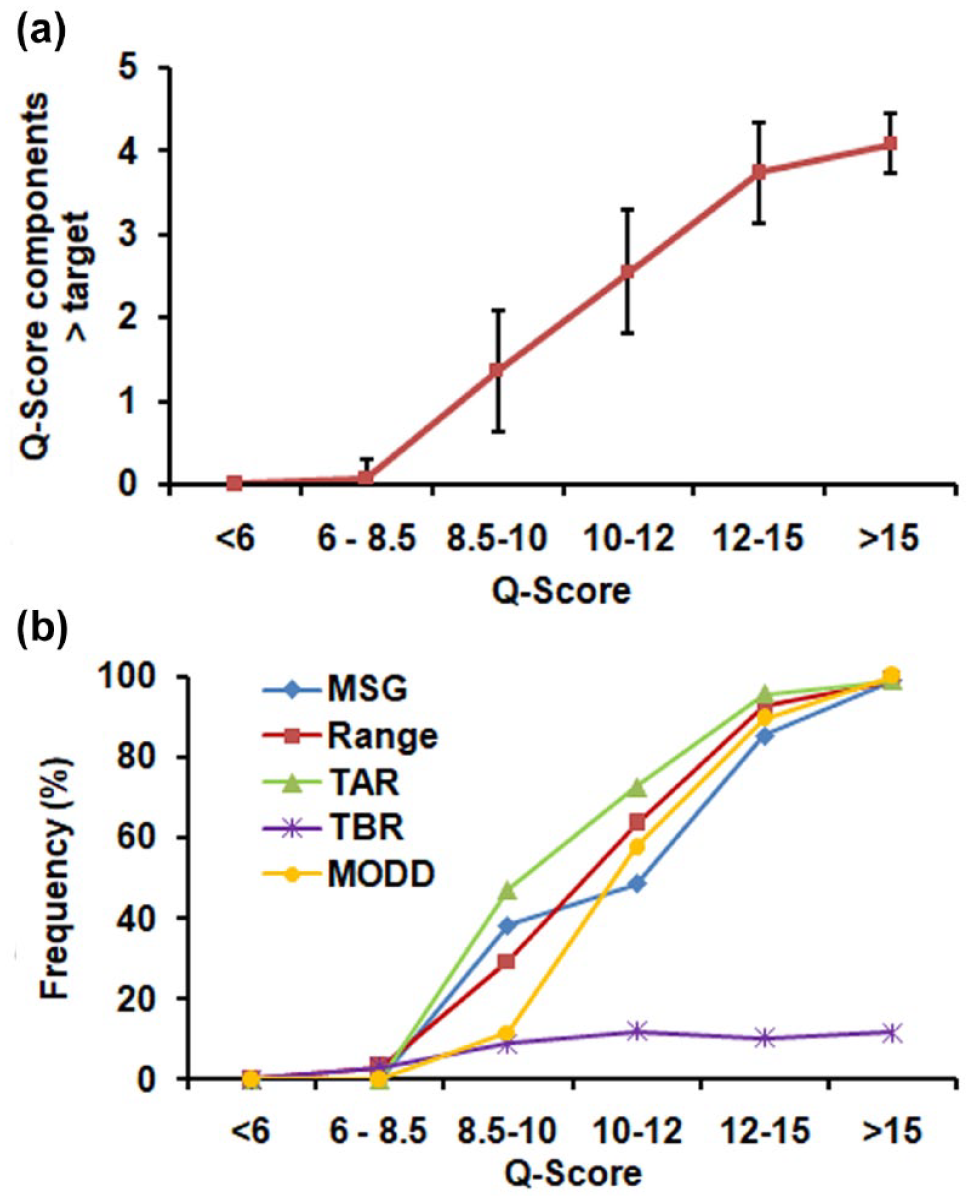
Number (a) and frequency (b) of Q-Score components above the target in relation to Q-Score groups with increasing Q-Score.
Conversion Matrix for Parameters of Glycemic Control
For consultation with people with diabetes, a matrix for the conversion of the Q-Score and TIR to glycemic control parameters was developed using regression analyses (Table 3). The conversion matrix is a tool for clinical practice that can be used for clarifying the quality of CGM profiles by demonstrating the conversion of a given Q-Score or TIR to other CGM metrics.
A wide range of Q-Score, TIR, and GRI values were found for participants with TBR > 1 h, mostly people with type 1 diabetes (Supplementary Figure 1A-C). Time below range needs to be addressed individually by health care professionals 5 and was excluded from the conversion matrix.
Discussion
For objective screening and analysis of glucose profiles derived from CGM devices, composite metrics revealing the quality of glucose profiles have been proposed.16,21 In this study, we tested the usefulness of the Q-Score for assessing the quality of glycemic control based on existing CGM profiles, and we examined its use as a complement to the TIR by revealing components of the glucose profile outside of the target range.
The Q-Score is a single-number metric. 22 At the time of its development, the threshold for hyperglycemia was 8.9 mmol/L, which represented the maximum postprandial glucose value for healthy individuals. 28 In this study, we harmonized the target range of the Q-Score to 3.9 to 10 mmol/L and adjusted the Q-Score formula after demonstrating a high correlation with the Q-Score8.9. The Q-Score is now aligned with the currently recommended upper limit for postprandial glucose levels among individuals with diabetes.5,7,10
For the analysis of short-term glycemic control, a CGM recording time of 14 days is recommended. 10 The Q-Score fulfilled this requirement by reaching stability within 10 days. In accordance with earlier studies, the TIR, MSG, and TAR reached stable values after 12 to 13 days of recording. 29 The glucose variability metrics CV and MODD, which represent interdaily variability and hypoglycemia, respectively, reached stability after 15 to 16 days, as observed before.
To determine the suitability of the Q-Score as a metric for short-term glycemic control using data derived from CGM devices, we investigated the correlation of the Q-Score with previously established parameters of glycemic control. There was a strong correlation between the TAR and the Q-Score. The MSG, which is also a component of the Q-Score, reflects hyperglycemia 30 and accounts for the strong correlation between the Q-Score and GMI.11,26 Fructosamine is associated with the magnitude of glycemic control over the previous one to three weeks 31 and correlated with the Q-Score. As expected, the Q-Score had an inverse correlation with the TIR; here, the greater the TIR the lower the Q-Score was. An inverse correlation was also observed between the TIR and the GRI, 21 which is a composite metric developed using the AGP components hypoglycemia and hyperglycemia to assess overall glycemic risk, accounting for both hypoglycemia and hyperglycemia. 21 We detected a high correlation of .941 between the Q-Score and GRI. In the Q-Score, the five components (MSG, range, MODD, TAR, and TBR) are weighted equally. 22 The GRI gives greater weight to hypoglycemia than to hyperglycemia and to extreme hypo/hyperglycemia over less extreme hypo/hyperglycemia. 21 Currently, the GRI is addressed in ongoing studies. 32 Studies comparing the Q-Score and GRI in different clinical settings, for example, primary care and in-hospital care for non-diabetes-related reasons, are required to reveal which metric is appropriate for which setting.
Our study participants, who were admitted for inpatient diabetes treatment, had a mean HbA1c of 8.2%. Inadequate short-term glycemic control was indicated by an abnormal increase in fructosamine levels in 77% of the participants. Approximately 72% of the study participants had a TIR < 70%. In those with a TIR > 70%, the Q-Score revealed a segment of participants whose inadequate glucose control was not obvious when the analysis was focused on the TIR.
For patient-tailored evaluation of glycemic control, we determined the Q-Score components that were outside of the target range. Individuals with a Q-Score above 8.5 had 1 Q-Score component above the target range. Individuals with Q-Scores above 14 had more than 4 components above target, thus indicating poor glycemic control.
Time in range has been established as a metric for evaluating CGM profiles. 5 The Q-Score has the potential to provide an overall summary of short-term glycemic control and can complement TIR. In addition to the TAR, TBR, and MSG, the Q-Score reflects both intra- and interdaily glucose variability. 22 Glucose fluctuations 33 are considered risk factors for the development of microvascular complications. 34 The combination of TIR with glycemic metrics for identifying risk factors for diabetes complications is a preferable approach for assessing glycemic control. 35
Often, in daily clinical practice, patients need help to understand the complexity of their glucose profile. We developed a matrix for the conversion between parameters of glycemic control. Using the matrix, the quality of glucose profiles can be explained by meeting the needs of different care levels and individual understanding of people with diabetes and their families. With CGM available for an increasing number of people with diabetes, in the future, support can be provided by a range of health care professionals.7,20,36,37 The matrix can be a tool to increase the understanding of CGM metrics.
Conclusion
The Q-Score is a single-number composite metric. The Q-Score can be calculated objectively and can be converted into other parameters of glycemic control. As the Q-Score sums up five components of the glucose profile, components of CGM profiles requiring therapeutic action can be identified. A Q-Score above a cutoff value should prompt an analysis of elevated Q-Score components in addition to a detailed review of the AGP report or a referral to a diabetes specialist.
Limitations
This was a single-center observation. The majority of people with diabetes had CGM profiles indicating insufficient glycemic control. The use of the Q-Score as a screening tool needs to be evaluated in a large study. A trial comparing the suitability of several composite metrics is needed.
Supplemental Material
sj-docx-1-dst-10.1177_19322968241246209 – Supplemental material for Q-Score Complements the Time in Range in the Evaluation of Short-Term Glycemic Control
Supplemental material, sj-docx-1-dst-10.1177_19322968241246209 for Q-Score Complements the Time in Range in the Evaluation of Short-Term Glycemic Control by Petra Augstein, Peter Heinke, Alexandra Nowak, Eckhard Salzsieder and Wolfgang Kerner in Journal of Diabetes Science and Technology
Footnotes
Abbreviations
AGP, ambulatory glucose profile; CGM, continuous glucose monitoring; isCGM, intermittently scanned CGM; CV, coefficient of variation; GMI, glucose management indicator; GRI, glycemia risk index; HPLC, high performance liquid chromatography; IQR, interquartile range; MSG, mean sensor glucose; MODD, mean of daily differences; OAD, oral antihyperglycemic drug; (range) the distance between the maximal and minimal CGM values; TAR, time spent above the glucose target of 10 mmol/L; TBR, time spent below the glucose target of 3.9 mmol/L; TIR, time in range (glucose 3.9-10 mmol/L); (Q-Score) quality evaluation score; SD, standard deviation; SEM, standard error of the mean.
Author Contributions
P.A. and P.H. were involved in the conception, design, and analysis and interpretation of the results. A.N. contributed to the conduct of the study. P.A. led the analysis and write-up of the work and wrote the first draft of the manuscript. All the authors edited, reviewed, and approved the final version of the manuscript. P.H. is the guarantor of this work and, as such, has full access to all the data in the study and takes responsibility for the integrity of the data and the accuracy of the data analysis.
Declaration of Conflicting Interests
The author(s) declared the following potential conflicts of interest with respect to the research, authorship, and/or publication of this article: ES holds a patent for the Q-Score used in this manuscript. All the authors declare that they have no non-financial competing interests.
Funding
The author(s) received no financial support for the research, authorship, and/or publication of this article.
Supplemental Material
Supplemental material for this article is available online.
References
Supplementary Material
Please find the following supplemental material available below.
For Open Access articles published under a Creative Commons License, all supplemental material carries the same license as the article it is associated with.
For non-Open Access articles published, all supplemental material carries a non-exclusive license, and permission requests for re-use of supplemental material or any part of supplemental material shall be sent directly to the copyright owner as specified in the copyright notice associated with the article.