
Abstract
Introduction:
Considerable efforts to standardize continuous glucose monitoring (CGM) have occurred in recent years. The aim was to perform an analysis of clinical studies in clinicaltrials.gov to evaluate trends in CGM endpoint adoption.
Methods:
Clinicaltrials.gov was searched for studies of drugs, devices and combination products containing CGM terms posted from 2012 to 2023. 1269 studies were returned and 954 were excluded. 315 studies were divided into two periods (P1 [2012–2017] and P2 [2018–2023]) and differences analyzed using descriptive statistics and two-tailed t tests.
Results:
There was a significant 60.3% increase in total clinical studies from P1 (121) to P2 (194). Phase 2 and Phase 3 Studies both saw significant increases of 125.8 and 169.2%, respectively, in P2. Adult-only studies predominated in both periods, with a 40.4% increase in P2. Studies that included pediatric populations, although smaller in number, increased significantly. Most studies were nonindustry-funded, and studies in this category saw a significant 80.0% increase in P2. However, industry-only funded studies also increased significantly by 78.4% in P2 in the same period. Studies of type 1 diabetes (T1DM) and type 2 diabetes (T2DM) increased by 55.8% and 26.9%, respectively, but increases were not statistically significant. Studies of nondiabetes-related indications did increase significantly (233.3%). 27.6% of studies used CGM-derived metrics as primary endpoints (PE). Studies that used time in range (TIR) increased by 222.4% in P2, which was significant. Conversely studies that used mean amplitude of glycemic excursions (MAGE) decreased significantly by 71.3%.
Conclusion:
Our data provide evidence of significant increases in the application of CGM endpoints in clinical studies in the last six years, including studies with TIR as the PE. Increases have been driven largely by academia, but our data show that industry is starting to follow suit. The significant increase in studies that included pediatrics is encouraging.
Introduction
Glycated hemoglobin (HbA1c) has traditionally been the gold-standard for measuring the efficacy of glycemic agents in clinical trials but has limitations including the inability to represent glycemic excursions. Continuous glucose monitoring (CGM) measures glucose concentrations in interstitial fluid on a continual basis, which enables trends to be displayed over time, including during sleep, and provides a more granular and comprehensive picture of glycemic control compared with HbA1c alone or with self-monitored blood glucose (SMBG) measurements. Moreover, time-in-range (TIR), commonly defined as blood glucose levels between 70 and 180 mg/dL, is a CGM-derived measure of glycemic control that has been demonstrated to have an inverse linear correlation with HbA1c.1,2 Despite there being a clear correlation, some researchers have reported a wide scatter of data, indicating that TIR provides information about glycemic control that cannot be determined from HbA1c alone, thus supporting the role of TIR as potentially alternative or complementary endpoint. 3 Time in tight range (TITR) (defined as blood glucose levels between 70 and 140 mg/dL) is also emerging as an important endpoint in certain populations. For example, it has been reported that time above 140 mg/dL is a predictor of diabetes progression in children with autoantibodies. 4 There is also emerging evidence that CGM predicts microvascular complications of diabetes; however, the relationship between TIR and micro- and macrovascular complications of diabetes is yet to be validated in long-term prospective studies. 5
The concept of CGM was introduced in the late 1960s, when the first glucose sensors were developed. However, their size and lack of accuracy rendered them unsuitable for use in clinical settings. The first CGM system, the GlucoWatch, was approved by the U.S. Food and Drug Administration (FDA) in 1999 and, since then, CGM systems have rapidly evolved. Modern FDA-approved CGM systems are accurate and user-friendly, and the clinical use of CGM has evolved from its role in the management of T1DM and intensively treated T2DM to include feed-back on various behavioral and psychological interventions in prediabetes, obese patients without diabetes, and athletes. Furthermore, in recent years, the integration of CGM devices with insulin pumps has led to the development of “closed-loop” systems, which integrate CGM glucose readings with algorithm-derived automated insulin doses.
Despite the rapid incorporation of CGM into routine clinical management of diabetes in recent years and the known limitations of HbA1c, the uptake of CGM in clinical trials has been muted. A descriptive analysis of trials of marketed diabetes medication from 2000 to 2019 revealed that only 5.9% had included CGM and, although there was an increasing trend over time, the adoption of CGM endpoints was lower than expected. 6
The slow uptake in clinical trials has been attributed, in part, to a lack of consensus on the use of CGM-derived metrics. 6 However, since December 2017, there have been several international standardization efforts to rectify this,7-10 which we hypothesized would result in an increase in clinical studies that incorporated CGM endpoints. We therefore undertook a statistical analysis of clinical studies of therapeutic pharmacological agents in clinical development and on-market that included CGM endpoints in the last six years (2018-2023) following the release the first CGM consensus guidelines, compared with the previous six years (2012-2017), using metadata from the National Institutes of Health ClinicalTrials.gov (CT.gov) database.
Methods
CT.gov was searched for studies with a first posted date between January 1, 2012, to December 31, 2023, that contained the following outcome terms: Continuous Glucose Monitoring, CGM, Time in Range, TIR, Time Below Range, TBR, Time Above Range, TAR, Mean Amplitude of Glucose Excursions and MAGE Search criteria excluded expanded access programs as these are not considered to be clinical studies. A Jarque-Bera test was performed on the dataset to determine whether it was significantly different from a normal distribution. The test returned a P-value > .05, which confirmed that there was insufficient evidence that the dataset was not normally distributed. Studies were divided into two 6-year time periods: P1 (January 1, 2012, to December 31, 2017), which precedes the publication of the first international CGM consensus guidelines, and P2 (January 1, 2018, to December 31, 2023), which proceeds the release of guidelines. Differences between the two periods were analyzed using descriptive statistics and two-tailed t tests, assuming unequal variances, to test for statistical significance.
Results
The search returned 1269 records, of which 954 were excluded due to the primary intervention not being a therapeutic drug or biologic or the outcome did not correspond to a CGM search term. The remaining 315 studies were included in the analysis (shown in Figure 1) and are summarized in Table 1.
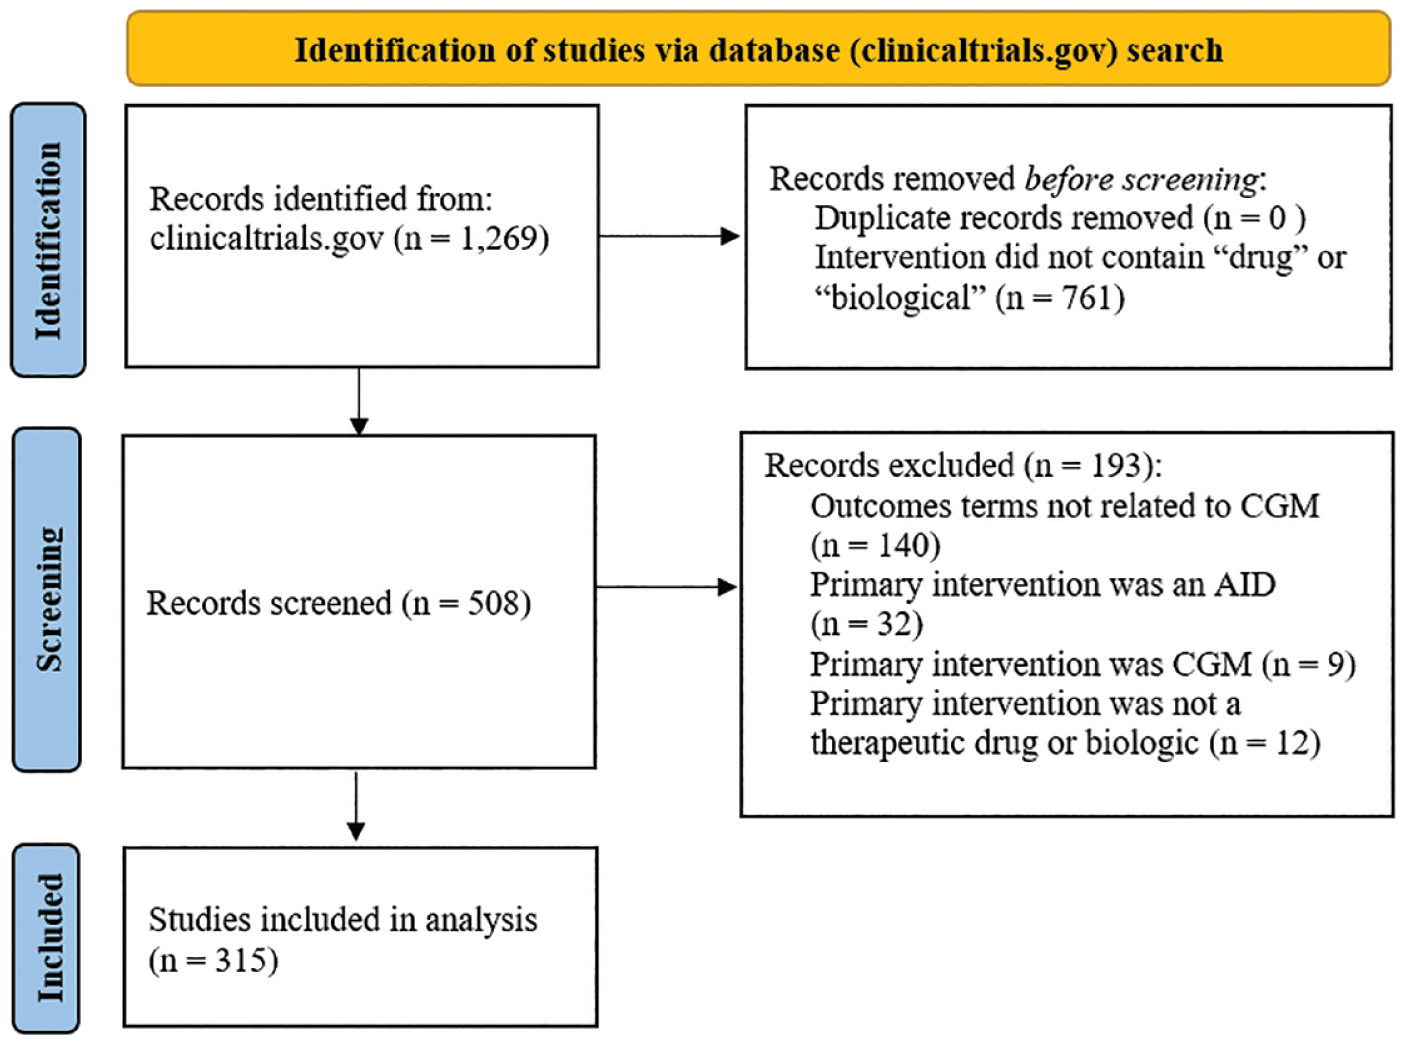
Flow diagram of the database screening process and results.
Summary of Studies Included in the Analysis.
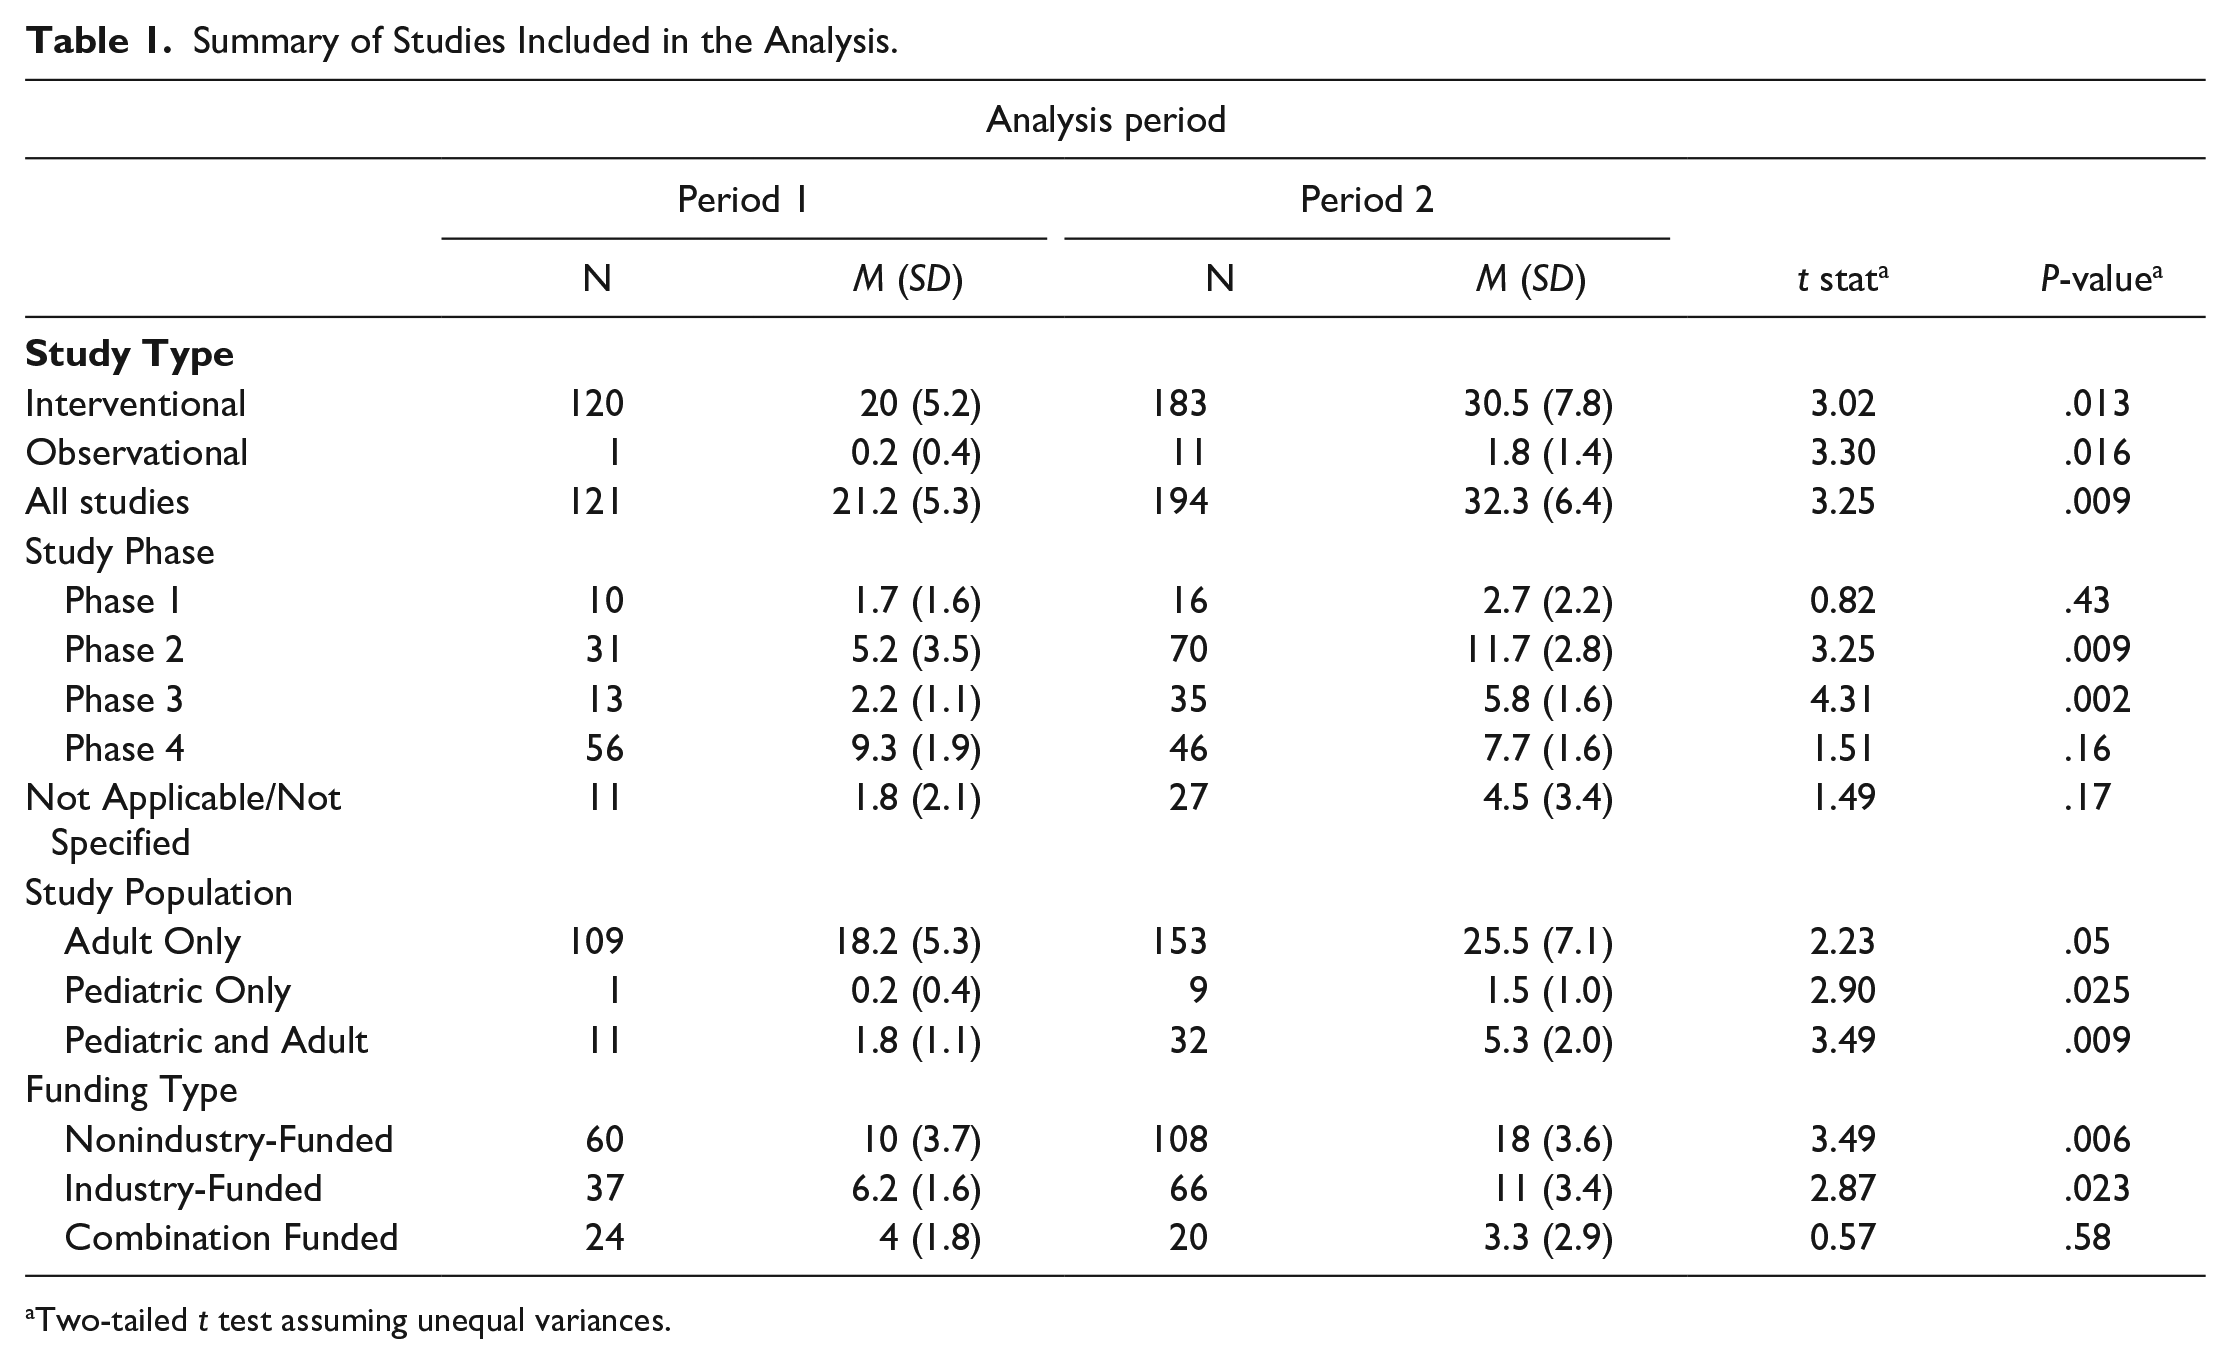
Two-tailed t test assuming unequal variances.
Study Type and Population Type
There was a 60.3% increase in the total number of clinical studies in P2 (194, M = 32.3 [SD = 6.4]) compared with P1 (121, M = 21.2 [SD = 5.3]) (shown in Figure 2a), which was statistically significant, t(10) = 3.25, P < .01. 303 studies were interventional (96.2%), which increased by 52.5%, P2 = 183, M = 30.5 (SD = 7.8) versus P1 = 120, M = 20.0 (SD = 5.2), t(10) = 3.02, P < .05. Observational studies, of which there were 12 (3.8%), although much smaller in number, increased by 1000%, P2 = 11, M = 1.0 (SD = 1.4) versus P1 =1, M = 0.2 (SD = 0.4), t(6) = 3.30, P < .05 (shown in Figure 2a). The majority of studies in both periods were conducted in adult-only populations (P1 = 90.0%, P2 = 78.9%) studies in this population increased by 40.4%, P2 = 153, M = 25.5 (SD = 7.1) versus P1 = 109, M = 18.2 (SD = 5.3), t(10) = 2.23, P < .05 (shown in Figure 2b). Studies that included both adult and pediatric populations increased by 190.9% in P2 (32, M = 5.3 [SD = 2.0]) versus P1 (11, M = 1.8 [SD = 1.1]), which was statistically significant, t(8) = 3.49, P < .01. The numbers of studies in pediatric-only populations were small (3.2%), but these also increase significantly, P2 = 9, M = 1.5 (SD = 1.0) versus P1 = 1, M = 0.2 (SD = 0.4), t(6) = 2.90, P < .05.
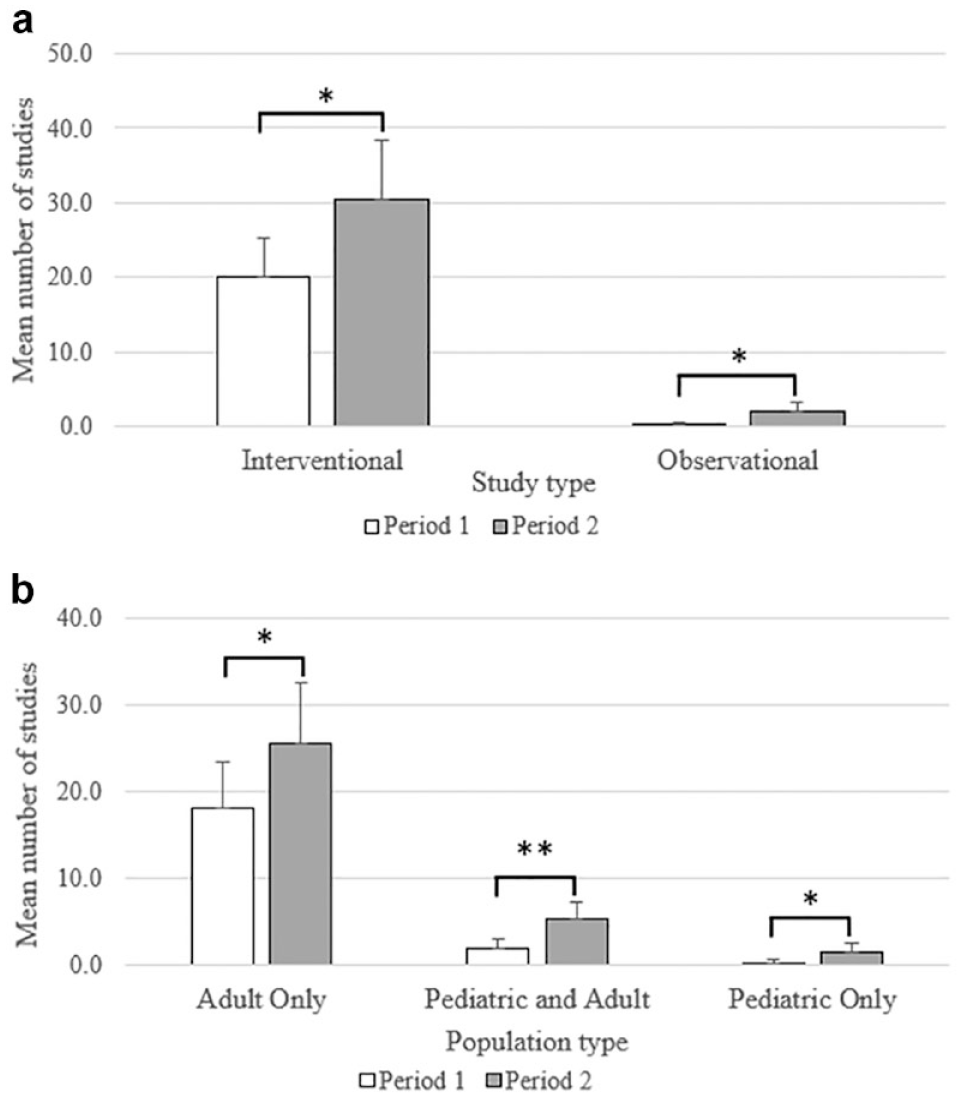
A comparison of the distribution of clinical studies that included CGM-derived endpoints registered in CT.gov in the period 2012-2017 (P1) versus 2018-2023 (P2) by (a) study type and (b) population type. Values represent the mean; error bars represent the standard deviation. *Two-tailed t test with unequal variances < .05; **two-tailed t test with unequal variances P-value < .01.
Development Phase and Funding Source
The number of phase 2 studies increased 125.8% in P2 (70, M = 11.7 [SD = 2.8]) compared with P1 (31, M = 5.2 [SD = 3.5]), which was statistically significant, t(10) = 3.25, P < .01 (shown in Figure 3a). The number of phase 3 studies also increased significantly (169.2%), P2 = 35, M = 5.8 (SD = 1.6) versus P1 = 13, M = 2.2 (SD = 1.1), t(9) = 4.31, P < .01. Differences in the number of studies in other development phases and studies with no development phase were not statistically significant. Most studies in both periods were nonindustry-funded (P1 = 60 [49.6%], P2 = 108 [55.7%]) (shown in Figure 3b). The number of nonindustry-funded studies increased by 80.0% in P2 (108, M = 18.0 [SD = 3.6]) compared with P1 (60, M = 10.0 [SD = 3.7]), which was statistically significant, t(10) = 3.49, P < .01. The number of industry-only funded studies (103 in total [32.7%]) increased by 78.4%, P2 = 66, M = 11.0 (SD = 3.4) versus P1 = 37, M = 6.2 (SD = 1.6), t(7) = 2.87, P < .05. The number of co-funded studies (studies that received funding from a combination of industry and nonindustry sources) was not significantly different between the two periods.
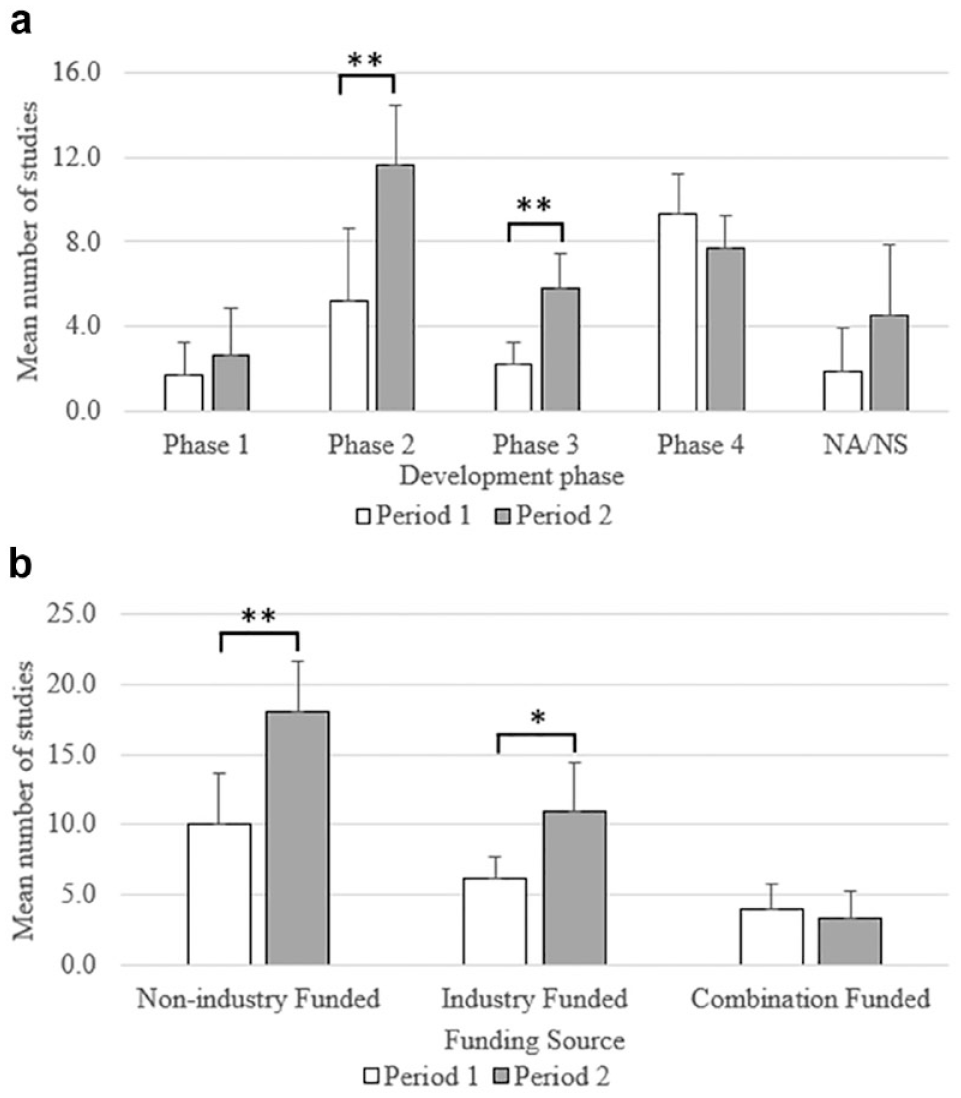
A comparison of the distribution of clinical studies that included CGM-derived endpoints registered in CT.gov in the period 2012-2017 (P1) versus 2018-2023 (P2) by (a) development phase and (b) funding type. Values represent the mean; error bars represent the standard deviation.
Primary Indications and Primary Outcomes
The most common study indications were T1DM, which increased by 55.8% in P2 (81, M = 13.5 [SD = 5.4]) compared with P1 (52, M = 7.7 [SD = 2.3]), followed by T2DM, which increased by 26.9% (P2 = 66, M = 11.0 [SD = 3.2] vs P1 = 52, M = 8.7 [SD = 23.0]); however, neither achieved statistical significance. Similarly, studies of other diabetes-related indications increase by 21.4% (P2 = 17, M = 2.8 [SD = 1.2] vs P1 = 14, M = 2.3 [SD = 1.6]); but this increase was not statistically significant. However, there was a statistically significant increase in the number of studies of nondiabetes-related indications (233.3%) in P2 (30, M = 5.0 [SD = 1.9]), compared with P1 (9, M = 1.5 [SD = 1.5]), t(9) = 3.22, P < .05 (shown in Table 2 and Figure 4a).
Study Indications.
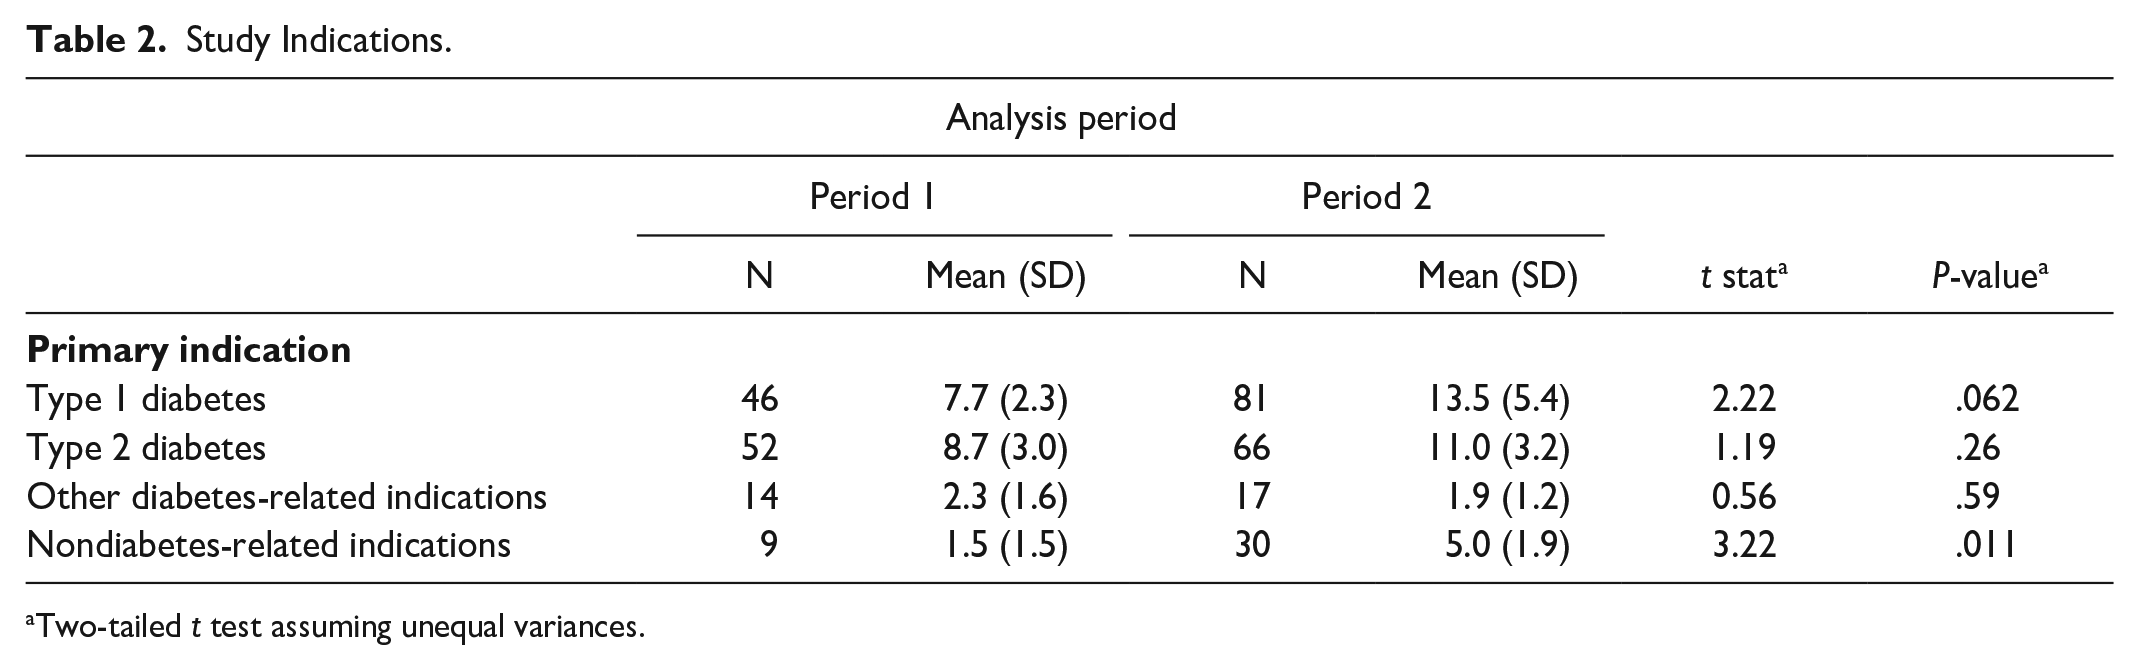
Two-tailed t test assuming unequal variances.
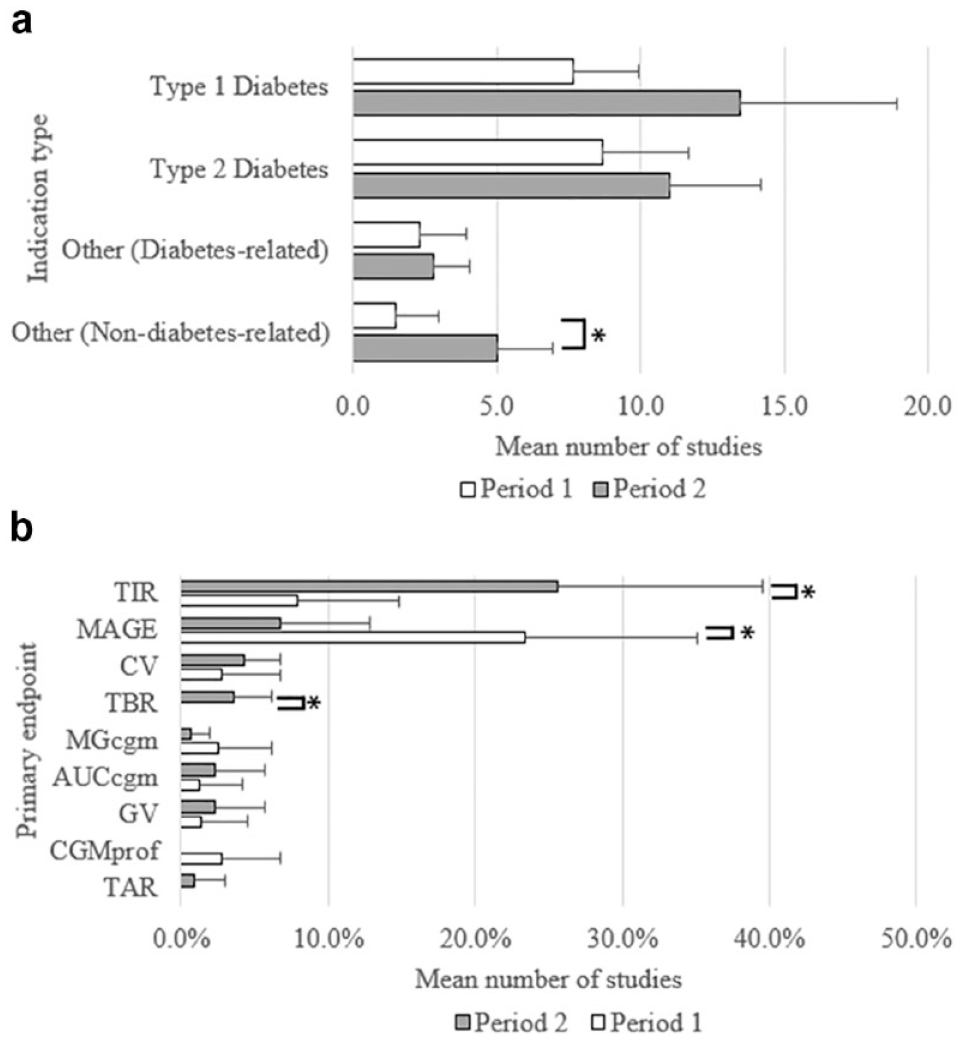
A comparison of the distribution of clinical studies registered in CT.gov in the period 2012-2017 (P1) versus 2018-2023 (P2) by (a) indication type and (b) CGM primary endpoint (PE) as a proportion of studies all studies in each period that had glycemic PEs. Values represent the mean; error bars represent the standard deviation. *Two-tailed t test with unequal variances < .05. Abbreviations (AUCcgm) CGM area under the curve, (CV) coefficient of variation, (CGMprof) CGM profile, (GV) glycemic variability, (MAGE) mean amplitude of glycemic excursions, (MGcgm) mean glucose determined by CGM, (TAR) time above range, (TBR) time below range, (TIR) time in range.
Eighty-seven studies (27.6%) used a CGM-derived metric as the primary endpoint (PE) (Table 3). The most frequent CGM PE was TIR, accounting for 36 of 87 studies that used a CGM-derived PE (41.4%). Furthermore, the proportion of studies that used TIR (ie, number of studies with TIR as the PE/total number of studies that had a glycemic PE within each period) increased by 222.4% in P2 (M = 25.6%, [SD = 13.9%]) compared with P1 (M = 7.9%, [SD = 6.8%]), which was statistically significant, t(7) = 2.55, P < .05 (shown in Table 3 and Figure 4b). In addition, there were significant trends for other CGM-derived PEs. Notably, the proportion of studies that used MAGE as the PE decreased by 71.3% in P2 (M = 6.7%, [SD = 6.2%]) compared with P1 (M = 23.4%, [SD = 11.6%]), t(8) = −2.83, P < .05, and one might postulate that this may be a result of the importance placed on TIR as measure of glycemic control over other CGM-derived measures in recent years. Studies that used TBR as a PE were infrequent (n = 4) and were found only in P2. Although this was a statistically significant trend, t(5) = 3.06, P < .05, the number of studies was small and therefore, caution should be taken when interpreting this result. No significant trends were found in the adoption of other CGM-derived PEs.
CGM-Derived Primary Endpoints.
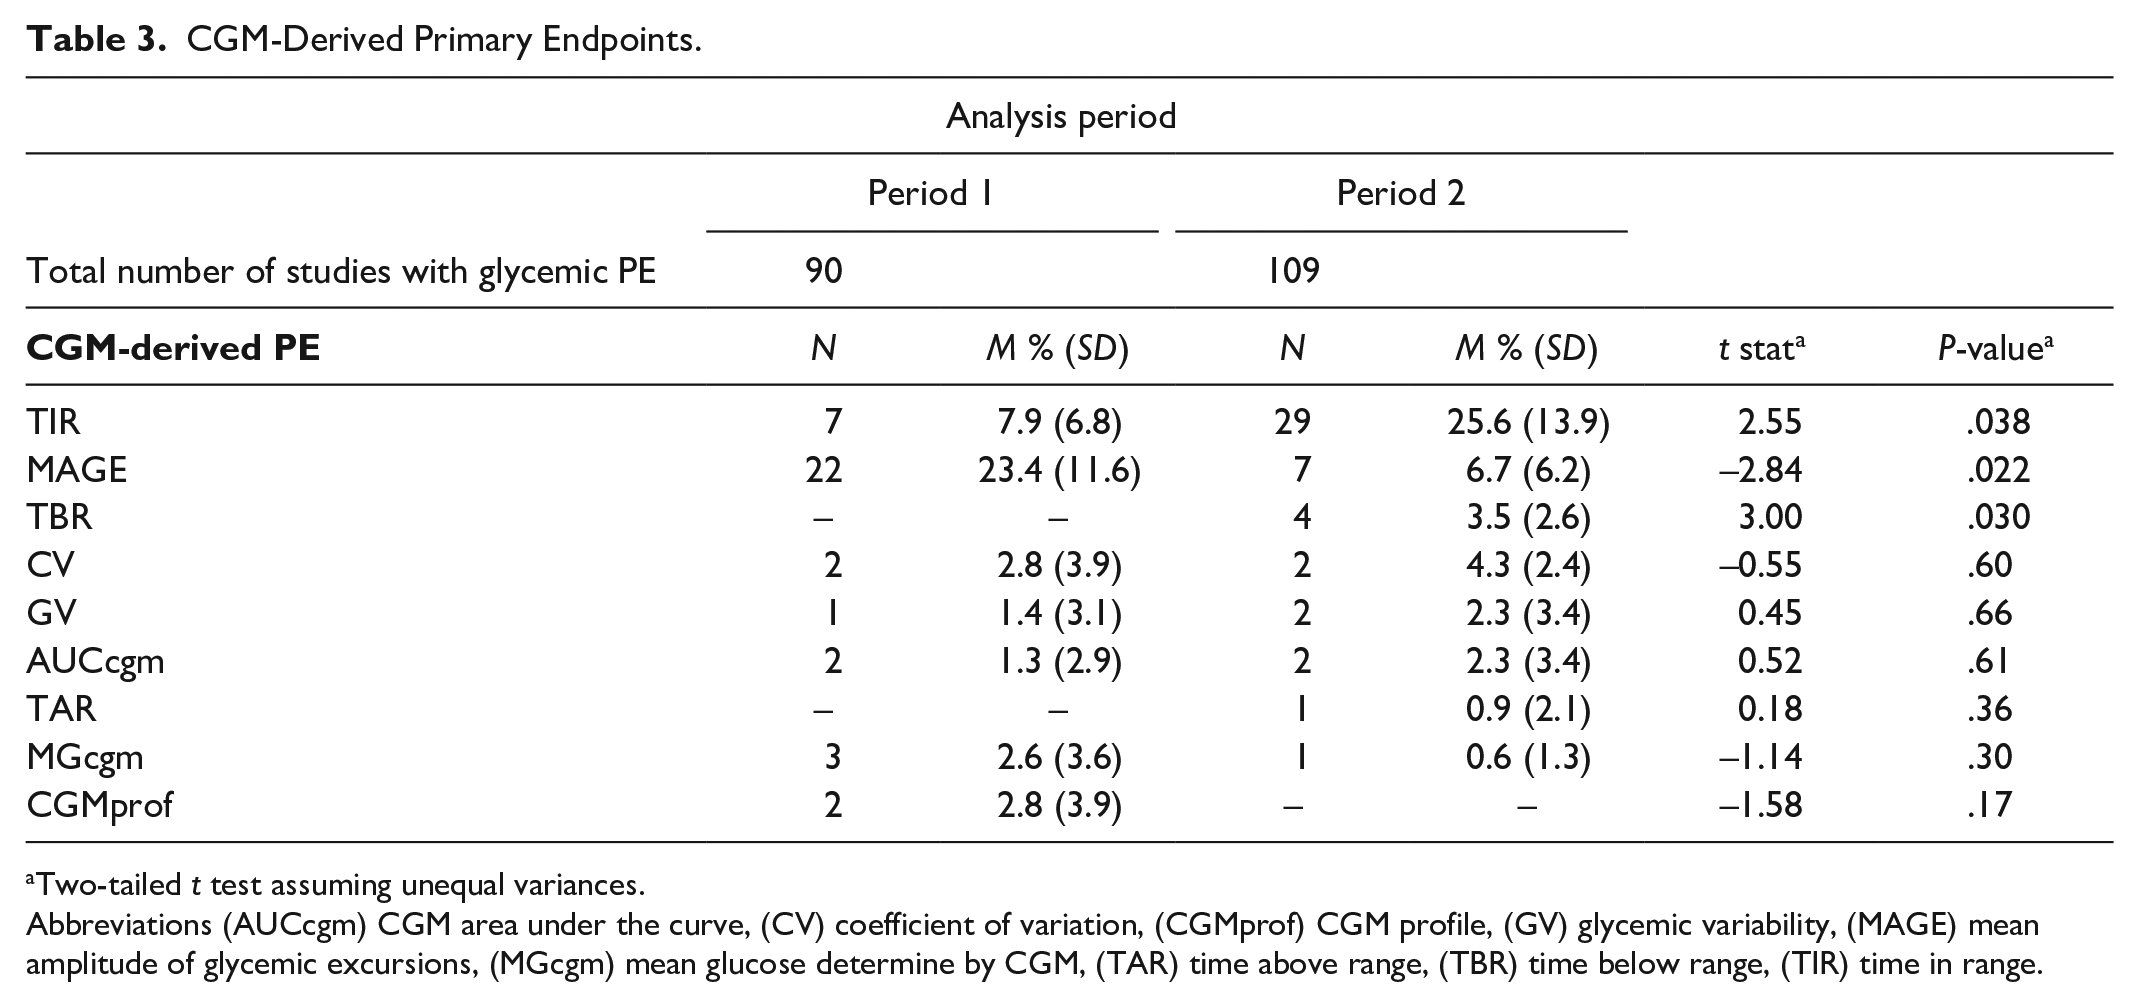
Two-tailed t test assuming unequal variances.
Abbreviations (AUCcgm) CGM area under the curve, (CV) coefficient of variation, (CGMprof) CGM profile, (GV) glycemic variability, (MAGE) mean amplitude of glycemic excursions, (MGcgm) mean glucose determine by CGM, (TAR) time above range, (TBR) time below range, (TIR) time in range.
Discussion
Our data provide evidence of significant increases in the adoption of CGM-derived endpoints in clinical studies of drugs and biological products in the last six years compared with the previous six. Notably, we found significant increases in the number of phase 2 and phase 3 studies and in the number of studies that included both adult and pediatric populations, which have been driven primarily by nonindustry-funded research. Furthermore, the use of CGM-derived endpoints has extended to studies of nondiabetes-related conditions, which collectively have increased significantly in the last six years. In the authors’ experience, academia tends to be an early adopter of novel endpoints in clinical research as these studies are rarely intended to support regulatory filing and are therefore, not restricted by the same regulatory constraints as industry-funded studies. The adoption of novel endpoints by industry often lags academia due to issues of standardization and lack of regulatory acceptance. However, our evidence of significant increases in CGM-derived endpoints in industry-funded studies in the last six years, suggest that industry has started to follow suit, and supports the hypothesis that international consensus statements to standardize CGM-metrics have had a positive impact not just on the adoption of CGM-derived endpoints in clinical research as a whole, but on industry-sponsored research in particular as evidenced by several studies published in the last five years.11-15 One may postulate that the significant positive trend in use of TIR as a PE in the last six years, and the commensurate reduction in the use of MAGE, may be a result of the importance placed on TIR as measure of glycemic control over other CGM-derived measures. However, it also acknowledged that advancements in CGM technology and recommendations for validation and performance assessments of CGM systems,16,17 may well have increased confidence in the accuracy and performance of CGM systems and contributed to the increase in adoption of CGM-derived endpoints in clinical research. Conversely, lack of acceptance of CGM-derived endpoints by authorities such as the FDA and European Medicines Agency (EMA) is likely to be limiting the inclusion of CGM in registrational trials.
In January 2023, an international consensus statement on the use of CGM and metrics for clinical trials was released. 10 This provides guidance on the incorporation of CGM devices into prospective clinical study protocols and aims to ensure the collected glucose metrics can be confidently managed and interpreted within the trial objectives and outcomes context. The consensus statement concludes that the incorporation of CGM devices in controlled clinical studies, particularly those involving new pharmaceutical agents for diabetes, can enhance both intervention monitoring and outcome measures and complement traditional HbA1c outcomes. CGM-derived metrics can also pinpoint specific treatment targets such as hypoglycemia, postprandial hyperglycemia, and glucose variability. However, different features of various systems may suit different study protocols and participant cohorts. Therefore, the selection and use of CGM devices, eg, transcutaneous versus implantable, real-time CGM (rtCGM) versus intermittently scanned CGM (isCGM) should be carefully considered to optimize study objectives. Ensuring CGM study endpoints are relevant to the study objectives is crucial. The overarching recommendation is that all core metrics for time ranges are to be reported. 9 Reporting is crucial for time below 70 mg/dL and time below 54 mg/dL and these should be reported separately. Furthermore, metrics for TIR, TBR, and TAR should be reported both as a daily percentage and as estimated hours/minutes per day in study outcomes. For studies evaluating the safety and efficacy of an intervention, the recommendation is for TIRs data be reported separately for nighttime and daytime periods. 10
The use of CGM in clinical trials poses practical challenges that should be carefully considered, and strategies to mitigate against the potential loss of data implemented. For example, the displacement or removal of a CGM sensor will result in loss of data. The consensus is that at least 70% of data should be obtained from each participant and implementing proactive measures to reduce the risk of missing data is an essential part of trial planning and execution. 10 Evaluating device compliance during screening or run-in periods will exclude participants who are unable to comply with CGM requirements. Continuing to monitor device compliance throughout a clinical trial and providing participants with replacement sensors will enable compliance issues to be detected quickly and the risk of loss of data reduced. It is also important to understand how CGM metrics can be affected by artifacts. For example, direct pressure at the sensor site caused by a lounge chair or bed can result in the attenuation of glucose values due to reduced blood flow and interstitial fluid exchange. Glucose values quickly return to normal after removal of pressure and therefore, ensuring trial participants are aware of this risk and know to avoid applying pressure to the sensor whenever possible is a consideration to minimize the number of compression artifacts. However, it is not possible to eliminate these entirely, therefore, the recommendation is to include all data in the per protocol analysis irrespective of whether it is potentially artifactual. 10 Ensuring medical oversight of CGM data trends for any consistent aberrant values with no medical justification can help identify potential issues.
One area that is not addressed in the consensus statement is how large volumes of clinical trial data generated by CGM should be managed and reviewed. This is a critical consideration as commercially available applications to store, access and review data from CGMs, may not be sufficient for clinical research needs and may not be compliant with the U.S. Food and Drug Administration Code of Federal Regulations, Title 21, Part 11 (21 CFR Part 11). To address these challenges the authors have utilized a multi-tier data architecture to support the extraction and processing of data from commercially available CGM devices via a CGM data provider with access to the device manufacturer’s application programming interfaces (APIs) (shown in Figure 5). The integration of API endpoints with a multi-tiered cloud data lake supports both near real-time and retrospective batch data integration into a 21 CFR part 11 compliant data environment. All data transformations, visualizations and trending analyses can be performed on a visual analytics platform (VAP), facilitating safety and device compliance reviews. Furthermore, this approach enables CGM data to be reviewed holistically alongside data from other sources, including data from electronic data capture (EDC) systems and central laboratory data. Data transfers directly into biostatistics systems allows for the analysis of outputs. The solution is device agnostic and can be potentially applied to other types of wearable devices.
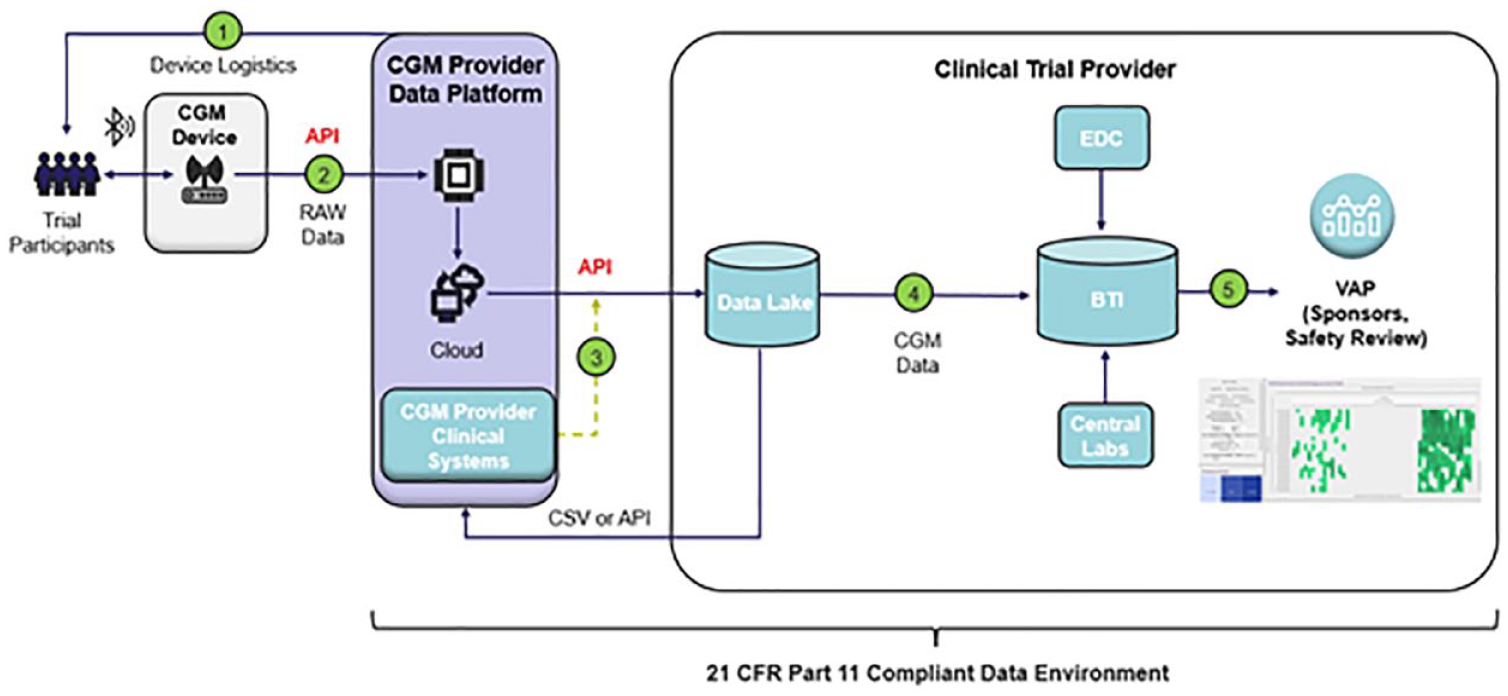
CGM clinical trial data architecture and data flow. (1) study specific identification codes are provided for the CGM devices, (2) raw CGM data are transferred with the applicable identification codes, (3) blinded identification codes and CGM data are transferred to the Digital Health Platform via an API connection, (3) CGM data are joined with clinical trial based identifiers and loaded into the data lake, (4) CGM data are transferred into biostatistical systems for study based analysis, (5) data converted to CDISC SDTM format and incorporated with other subject data. Transferred into analysis, dashboards, tables, listings, and figures. Abbreviations: (API) application programming interface, (BTI) biostatistics technology infrastructure, (CSV) comma separated values files, (EDC) electronic data capture system, (VAP) visual analytics platform.
Conclusion
There has been considerable progress over the last six years to standardize CGM metrics and the application of CGM in clinical research, which we believe has contributed our finding of marked and statistically significant increases in the number of studies that utilized CGM endpoints in the last six years following the release of several international consensus statements, compared with the previous six. While we acknowledge that there may be technological and other reasons for the trend, our results support our hypothesis that the standardization of CGM criteria in recent guidelines has contributed to a wider uptake of CGM endpoints in clinical trials. However, there continue to be challenges to implementing CGM into clinical research including rendering CGM data from commercial applications suitable for clinical trial use. Our approach, which utilizes a data architecture with a GGM provider that has access to CGM manufactures APIs, addresses this challenge.
In the future, we anticipate that the development of decision support systems that combine artificial intelligence (AI) algorithms with CGM data to predict glucose excursions for example, will lead to more personalized treatment decisions and optimize glycemic control for diabetes patients.18-20 Furthermore, the incorporation of AI into a CGM clinical trial data management system, such as the one we describe, could potentially augment medical reviews of CGM clinical data.
Footnotes
Acknowledgements
The authors thank Philip Bartle for his input on the CGM data architecture and data flow.
Abbreviations
AI, artificial intelligence; API, application programming interface; AUCcgm, CGM area under the curve; CGM, continuous glucose monitoring; CGMprof, CGM profile; CV, coefficient of variation; CT.gov, clinicaltrials.gov, GV, glycemic variability; HbA1c, glycated hemoglobin; isCGM, intermittently scanned CGM; MAGE, mean amplitude of glucose excursion; MGcgm, mean glucose determined by CGM; PE, primary endpoint; rtCGM, real-time CGM; SMBG, self-monitoring blood glucose; T1DM, type 1 diabetes mellitus; T2DM, type 2 diabetes mellitus; TAR, time above range; TIR, time in range.
Author Contributions
A.B. was responsible for the conception and design of the work and analysis of the data and contributed to the interpretation of data and the preparation of the manuscript. G.E., M.E., and D.G. contributed to the interpretation of the data and the preparation of the manuscript.
Declaration of Conflicting Interests
The author(s) declared the following potential conflicts of interest with respect to the research, authorship, and/or publication of this article: A.B., G.E., M.E., and D.G. are all employees of PPD, part of Thermo Fisher Scientific.
Funding
The author(s) disclosed receipt of the following financial support for the research, authorship, and/or publication of this article: This work was funded by PPD, part of Thermo Fisher Scientific.
Statement of Ethics
An ethics statement is not applicable as the research was based exclusively on an analysis of metadata from a publicly available clinical trial register.