
Abstract
Background:
Effective glucose management of hospitalized individuals is essential for improving outcomes such as wound healing and reducing complications including hypoglycemia. There are many models of effective management, including a Virtual Glucose Management Service (VGMS), where a team of diabetes specialists reviews patient data remotely and recommends interventions to optimize glucose management in hospitalized individuals. The objective of our study was to assess the effectiveness of VGMS for glycemic management in hospitalized individuals in a large academic medical center in New York City.
Methods:
We conducted a prospective, quality improvement intervention-control study on individuals ≥ 18 years old with at least one inpatient point-of-care blood glucose (POC BG) value <70 mg/dL and/or > 200 mg/dL admitted to the hospital from January 1, 2022, to December 31, 2023. VGMS was implemented across four intervention units and differences in glycemic outcomes were measured against two control units.
Results:
A total of 1338 individuals were included in the intervention and 1019 individuals were included in the control group. Average glucose values in the control and intervention groups were similar [Mean mg/dL: 174.1 (CI: 172.0, 176.7) vs Mean mg/dL: 175.9 (CI: 173.8, 178.0), P = .1798], however the proportion of individuals with hyperglycemia (POC BG >180 mg/dL) was significantly higher in the control group [72.2% (69.5%, 74.9%) vs 65.5% (63.5%, 67.7%), P ≤ .0001].
Conclusion:
The implementation of a VGMS team significantly reduced hyperglycemia in hospitalized individuals. This study shows that VGMS is an effective and efficient process to implement in hospital settings to improve inpatient glycemic management.
Keywords
Introduction
The prevalence and burden of diabetes has increased significantly in recent years. According to the Centers for Disease Control and Prevention (CDC) (2021), there are 38.4 million people in the U.S. living with diabetes, who incurred an estimated US$15.36 billion in hospital costs in 2022. 1 Around 30% to 40% of hospitalized individuals have diabetes or hyperglycemia, and most of them meet the threshold for treatment with insulin. 2 Hospitalized individuals can experience hyperglycemia for many complex reasons. Some circumstances include but are not limited to surgery, trauma, infection, glucocorticoid therapy, enteral and parenteral nutrition, poor diabetes management at baseline or undiagnosed diabetes. Conversely, the treatment of hyperglycemia can lead to hypoglycemia, a preventable hospital harm, making therapy a delicate balance for a large majority of hospitalized individuals. 3 Hypoglycemia is the most common adverse effect of treatment of diabetes and stress hyperglycemia in the hospital setting. The development of hypoglycemia due to treatment of hyperglycemia in these settings is associated with poor hospital outcomes, including increased length of stay and greater hospital mortality, especially for those who experience more than one episode of hypoglycemia.1,2
According to the American Diabetes Association (ADA) 2025 Standards of Medical Care in Diabetes, hyperglycemia in hospitalized individuals is defined as blood glucose (BG) levels > 140 mg/dL.
4
Insulin therapy should be initiated for treatment of persistent hyperglycemia starting at a threshold of
Guideline directed medical therapy (GDMT) for individuals with diabetes is designed with the goal to improve clinical outcomes. The ADA outlines the recommended treatment for diabetes in the inpatient setting as follows. First, insulin therapy should be initiated for treatment of persistent hyperglycemia starting at a threshold of 180 mg/dL checked on at least two occasions within 24 hours. Second, basal insulin or a basal plus correction insulin regimen is the preferred treatment for noncritically ill hospitalized individuals with poor oral intake or those who are taking nothing by mouth. And finally, an insulin regimen with basal, prandial, and correction components is the preferred treatment for noncritically ill hospitalized individuals with good nutritional intake. 4
The ADA specifically recommends consulting with a specialized diabetes or glucose management team for hospitalized individuals with diabetes. 8 A glucose management team can be comprised of a multitude of different specialty roles that vary depending on the organization’s structure. 9 When directly comparing virtual or in-person consults by a glucose management team it has been proven that either model can result in equivalent quality of care and patient outcomes.10,11 A Virtual Glucose Management Service (VGMS) is a team of specialists in diabetes that monitors BG remotely and makes recommendations in real time to facilitate achievement of BG goals for individuals while hospitalized. This kind of intervention can reduce length of stay, readmission rates, medical errors, and costs.12-14 A few other medical centers in the United States have published data showing significant improvement in their inpatient glycemic metrics with the creation of a VGMs.15-23
Starting in January 2022, our team at New York-Presbyterian/Weill Cornell Medicine (NYP/WC) implemented a quality improvement initiative to improve glucose management in the inpatient setting by utilizing a VGMS and to decrease the frequency of hyper- and hypoglycemia in four general medicine inpatient units. Two units were designated as control units where no VGMS was implemented. This quality improvement study had two main aims. One was to determine if the implementation of VGMS resulted in improved glucose levels in the intervention units compared with the control units overall, accompanied by lower levels of hyperglycemia and hypoglycemia. Second, to determine the change in glycemic outcomes prior to and after VGMS consults among the subpopulation specifically receiving written VGMS consult notes within the intervention units. An exploratory aim was to document the VGMS actions taken and improvements in overall care that resulted from it.
Methods
Population
The eligibility criteria included individuals ≥18 years old who had at least one BG value <70 mg/dL and/or >200 mg/dL in a 24-hour period from January 1, 2022, to December 31, 2023. The four intervention sites included individuals admitted to four general medicine units at NYP/WCM in New York City, and the two control sites included individuals admitted to two other medicine units (geriatrics and telemetry). Children and pregnant individuals were excluded from the analysis.
Data Collection and Management
Data were captured in REDCap. For the individuals who required a written VGMS consult note, data was manually entered immediately after the completion of the consult. For all other individuals in the intervention and control units, some data were entered into REDCap manually, while other data were automatically loaded into a REDCap database via a programmable SUPER REDCap process directly from the electronic health record (EHR) databases. Age, gender, and admission medications were part of the automated process. Additional information such as past medical history and type of insurance were manually entered after abstraction of information from the electronic health records.
Intervention Process
The intervention team (VGMS team) consisted of an endocrinologist and a clinical pharmacist.
Every weekday the endocrinologist generated a report in the EHR of individuals on the intervention units with at least one BG level <70 mg/dL and/or > 200 mg/dL in the past 24 hours. Chart review was completed including the current treatment regimen, point-of-care fingerstick glucose data, current diet order, and any glucocorticoid administration. The endocrinologist would contact the first contact provider (house staff or physician assistant) on the primary team via Epic chat if insulin regimen adjustments were recommended and not already ordered by the team. Formal treatment recommendations would follow in a full written consult note. Treatment recommendations included basal, bolus, and correction insulin with BG targets for hospitalized individuals guided by the ADA Standards of Care. The endocrinologist continued to follow the individual 7 days per week (on-call 24 hours per day) until discharge documenting daily recommendations as needed. Occasionally, primary teams would feel that a formal written consult was not needed and would just request advice from the endocrinologist; in these cases, the endocrinologist would give recommendations via Epic chat, continue to follow the individual via chart review daily, and then request formal written consult again later if deemed necessary. In some cases, primary teams contacted the endocrinologist on the VGMS team directly for a formal written consult. This process is illustrated in the process map in Supplemental Figure 1a.
In addition, the clinical pharmacist would meet with the individual in-person for diabetes, insulin, and glucometer teaching. Standardized written education resources were provided to each individual in multiple languages including Spanish, Chinese, Russian, and Arabic. Prior to discharge, the VGMS team would work with the individual and primary team to develop a maintenance diabetes plan based on GDMT, considering both individual preferences and cost considerations. As the VGMS service became more widely known, primary teams began requesting consults regardless of inpatient location. If those inpatients were located on one of the four general medicine floor units covered by the VGMS, then those individuals were added to the VGMS consult workflow as above. If any of those individuals were not located on the general medicine floor units covered by VGMS, then the consult was referred to the on-call endocrinology team and not followed by VGMS. The intervention process map is illustrated in Supplemental Figure 1b and the “Plan, Do, Study, Act” (PDSA) cyclical process is illustrated in Supplemental Figure 1c.
Review of Actions
At time of initial written consultation, the VGMS recorded whether the individual’s current regimen was consistent or not with GDMT as recommended by the ADA inpatient guidelines. Insulin initiation and/or dose adjustments were recommended as appropriate. Each adjustment recommended by VGMS was recorded in REDCap for each individual, including the initiation or discontinuation of or an increase or decrease in basal insulin, prandial insulin, correction insulin, neutral protamine Hagedorn (NPH) insulin, or oral hypoglycemic agents.
Statistical Analysis
To determine differences in glucose values between the control and intervention units we used two slightly different methods; one at the level of the patient day and the second method at the level of the hospitalization. The patient day method summarizes the mean glucose value (mg/dL) for all point-of-care blood glucose (POC BG) tests during each day of hospitalization. Using this measure, the differences in glucose values between the control and intervention groups were modeled using a generalized linear mixed effects model (GLMM) with a gamma distribution and a log-link due to the skewed nature of the distribution of glucose values. It also included a random intercept to allow individuals to have different starting baseline values and accommodated repeated glucose values per individual. These models also adjusted for number of days with POC BG testing, which was a sequential counter starting with the first day of testing for each hospitalization, and ending with the last.
We also computed differences in the proportion of hyper- and hypoglycemic patient-days defined at different cut-offs of POC BG as follows: one or more that were >180 mg/dL or >250 mg/dL for hyperglycemia and <70 mg/dL or <54 mg/dL for hypoglycemia. For this analysis we used Poisson models with log-link and robust standard errors that accounted for repeated measures. In addition, we added days since baseline POC BG into the model. The outcome of these models was reported as incident risk ratios.
For the second method, at the level of the hospitalization, we utilized a mixed effects model that included a random intercept and adjusted for repeated measures due to multiple hospitalizations per individual. To accommodate the intervention and control clustered at the site-level we added site and individuals clustered within site as random intercepts to the model. In addition, we adjusted for gender, insurance type, history of heart failure, coronary artery disease, stroke, chronic kidney disease, end-stage renal disease, need for total parenteral nutrition (TPN) and glucocorticoid use. We reported mean estimates of glucose by group with 95% confidence intervals.
Within the intervention group receiving written consult notes, we determined if each individual referred was receiving GDMT as per ADA inpatient guidelines prior to referral. This proportion was plotted using a control chart (P-chart) with the mean and 3 standard deviations around the mean to determine if there was any special cause variation in GDMT over the time-period of the study. All analyses were performed using SAS 9.4.
Results
There were 1217 hospitalizations (including readmissions) among 1019 individuals in the control units and 1590 (N = 1338 individuals) in the intervention units who met the eligibility criteria. Of the intervention unit hospitalizations, 171 (10.8%) were referred for written VGMS consult notes between January 1, 2022, and December 31, 2023.
Overall, the control unit individuals were slightly older [Mean: 73 (SD: 12.5)] than intervention unit individuals [Mean: 67 (SD: 15.5)] and had more documented diagnoses of type 2 diabetes (85.5% vs 76.4%), though the intervention group had more cases of hyperglycemia (13.7% vs 8.5%). The control group also had higher levels of heart failure (51.7% vs 17.4%), coronary artery disease (61.3% vs 26.6%) and chronic kidney disease (47.6% vs 29.8%) and shorter length of stay in the hospital [Mean days: 11.2 (SD: 12.6) vs Mean days: 15.2 (SD: 19.4)]. They had slightly lower levels of HbA1c (latest available value) [Mean: 7.2% (SD: 1.7%) vs Mean: 7.4% (SD: 2.0%)] and less frequent use of bolus insulin at home (rapid/short acting: 12.3% vs 23.5%) compared with the intervention group. Those individuals in the intervention units requiring formal written VGMS consults had the highest levels of HbA1c [Mean: 8.2% (SD: 2.0%)] and the longest length of stay in the hospital [(Mean days: 16.9 (SD: 22.3)]. (Table 1)
Profile of Individuals Hospitalized With Hyper- or Hypoglycemia From January 1, 2022, to December 31, 2023 in the Intervention and Control Units.
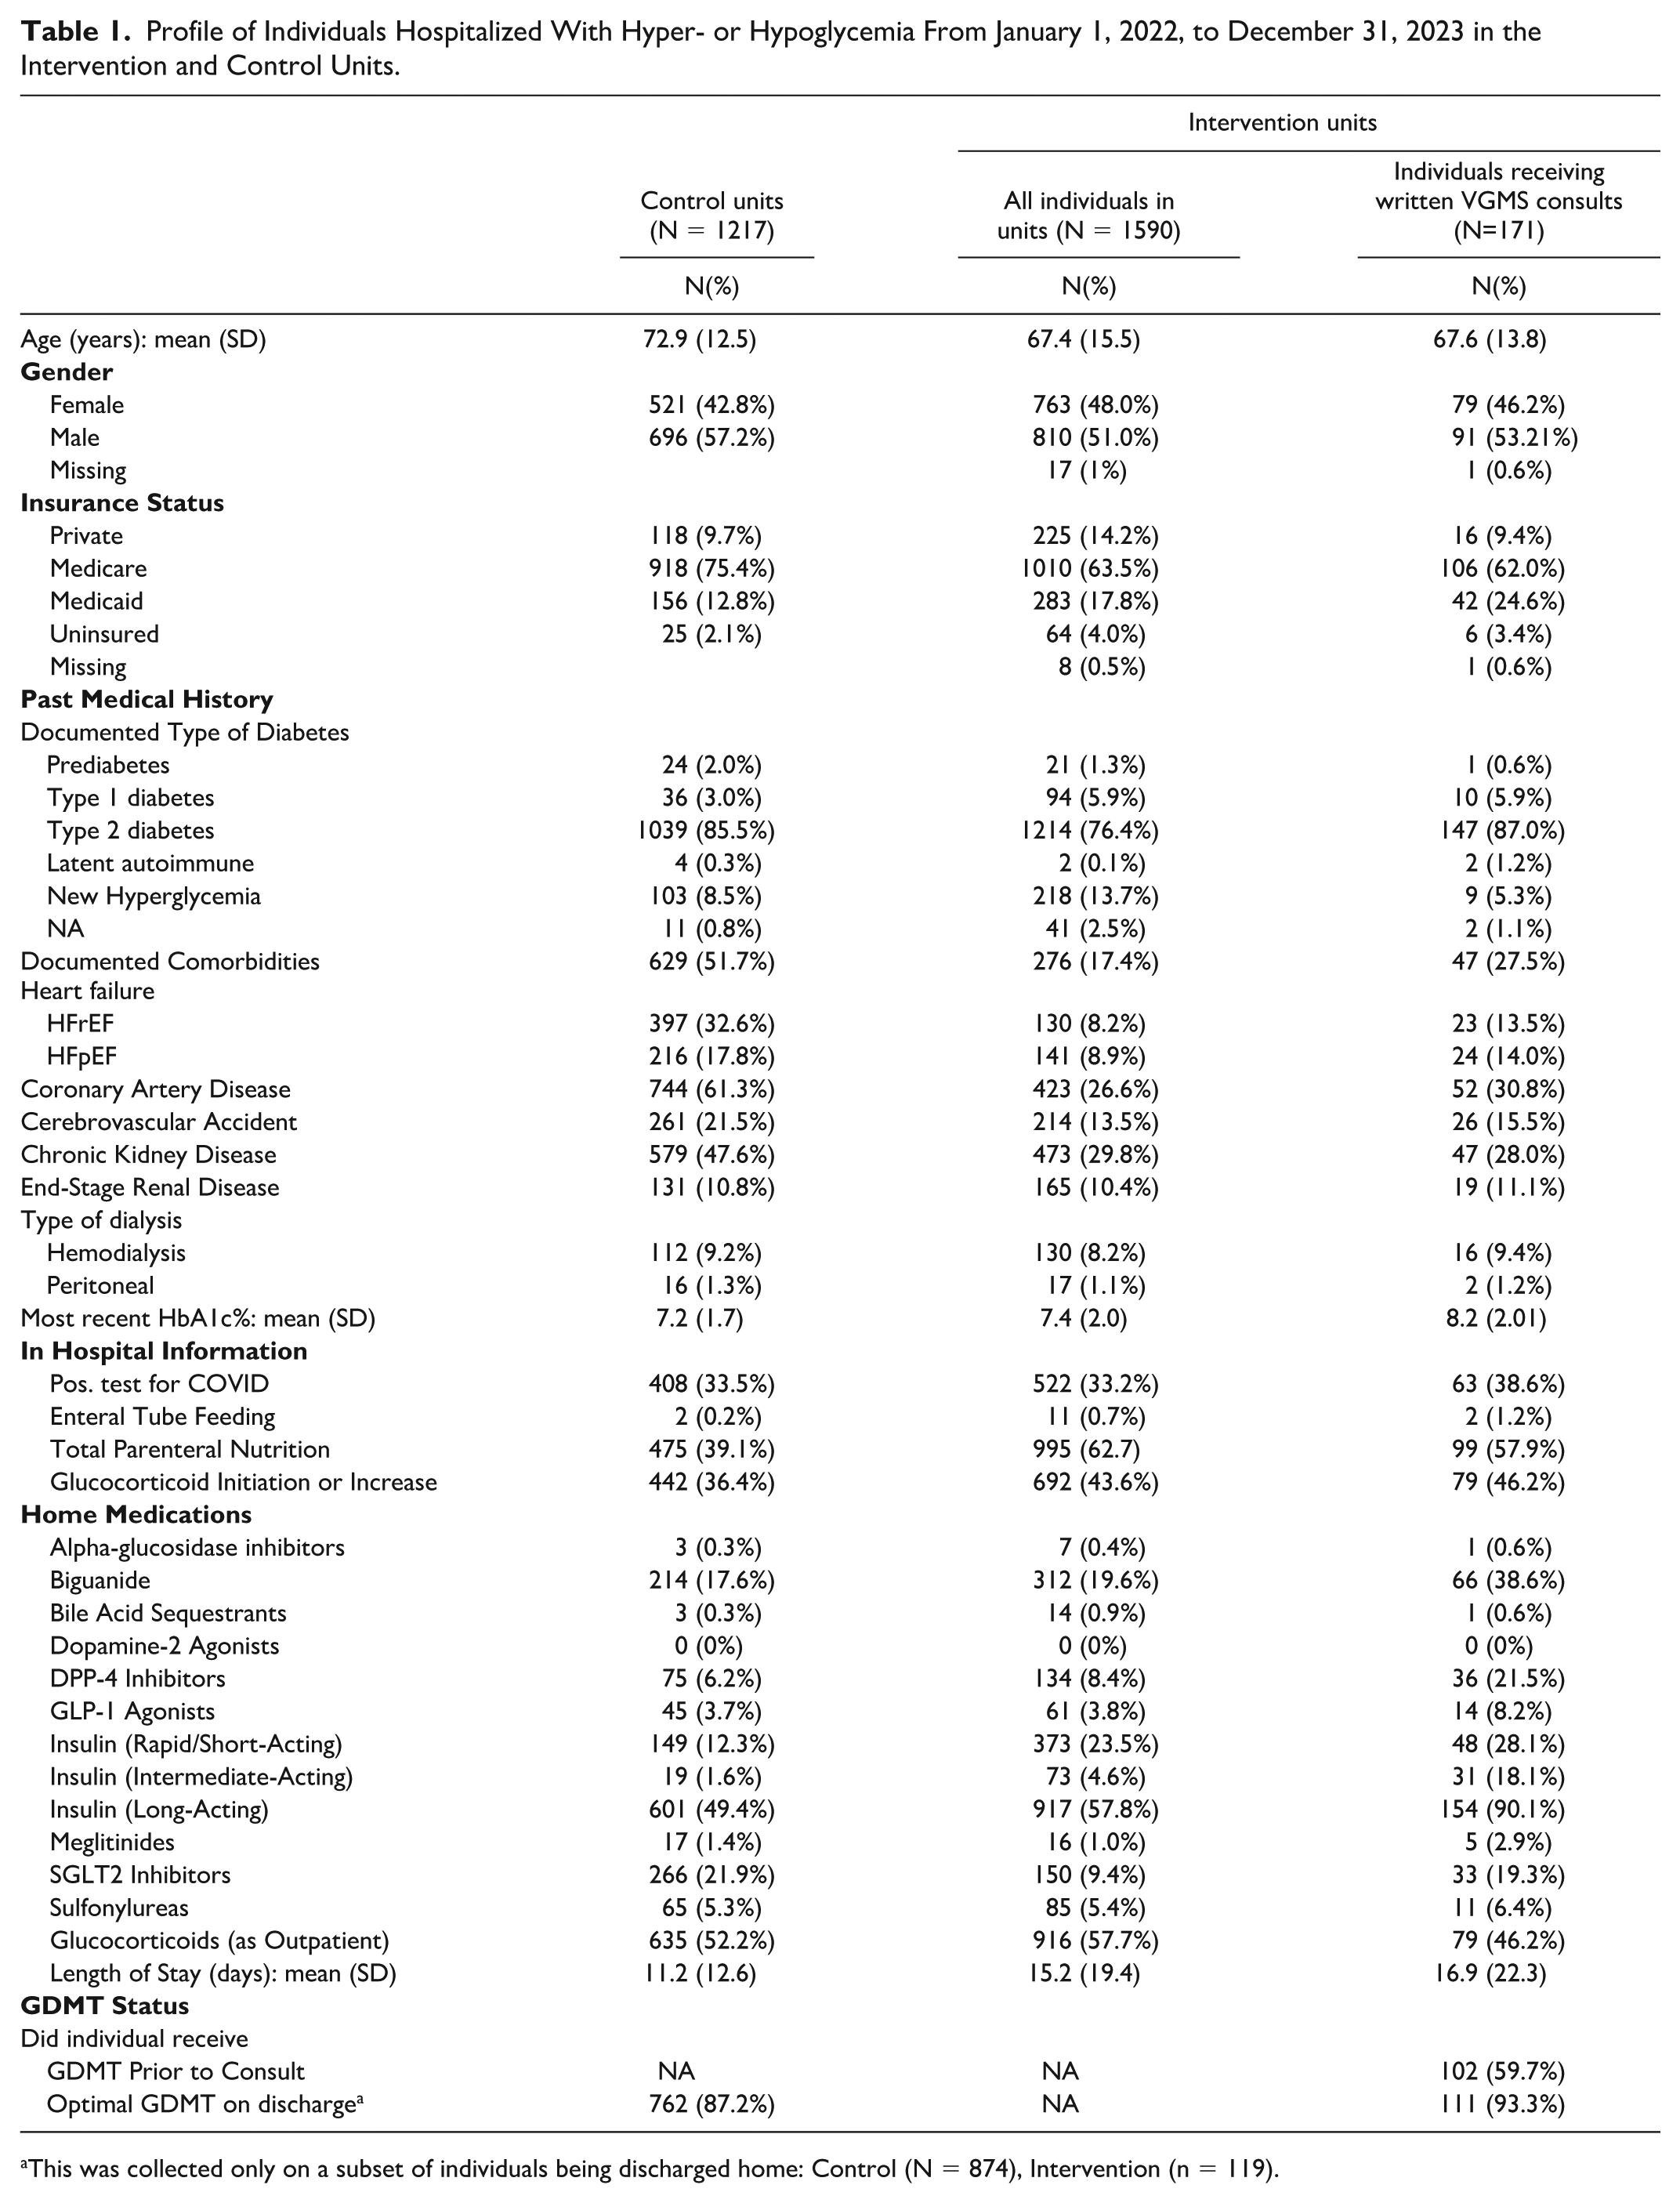
This was collected only on a subset of individuals being discharged home: Control (N = 874), Intervention (n = 119).
Results of Glucose Measures
Average glucose values between the control and intervention groups were nearly identical [Mean mg/dL: 174.1 (CI: 172.0, 176.7) vs Mean mg/dL: 175.9 (CI: 173.8, 178.0), P = .1798], as was the proportion of individuals with hypoglycemia [4.3% (3.7%, 5.1%) vs 5.2% (4.5%, 6.0%), P = .0905], however the proportion of individuals with hyperglycemia (POC BG >180 mg/dL) was significantly higher in the control group [72.2% (69.5%, 74.9%) vs 65.5% (63.5%, 67.7%), P ≤ .0001]. For level 2 hyperglycemia (POC BG > 250 mg/dL), the differences were still significantly different [32.9% (30.3%, 35.8%) vs 29.0% (27.0%, 31.2%), P = .0061]. (Table 2)
Differences in Average Daily Patient Glucose Metrics by Intervention and Control Groups.
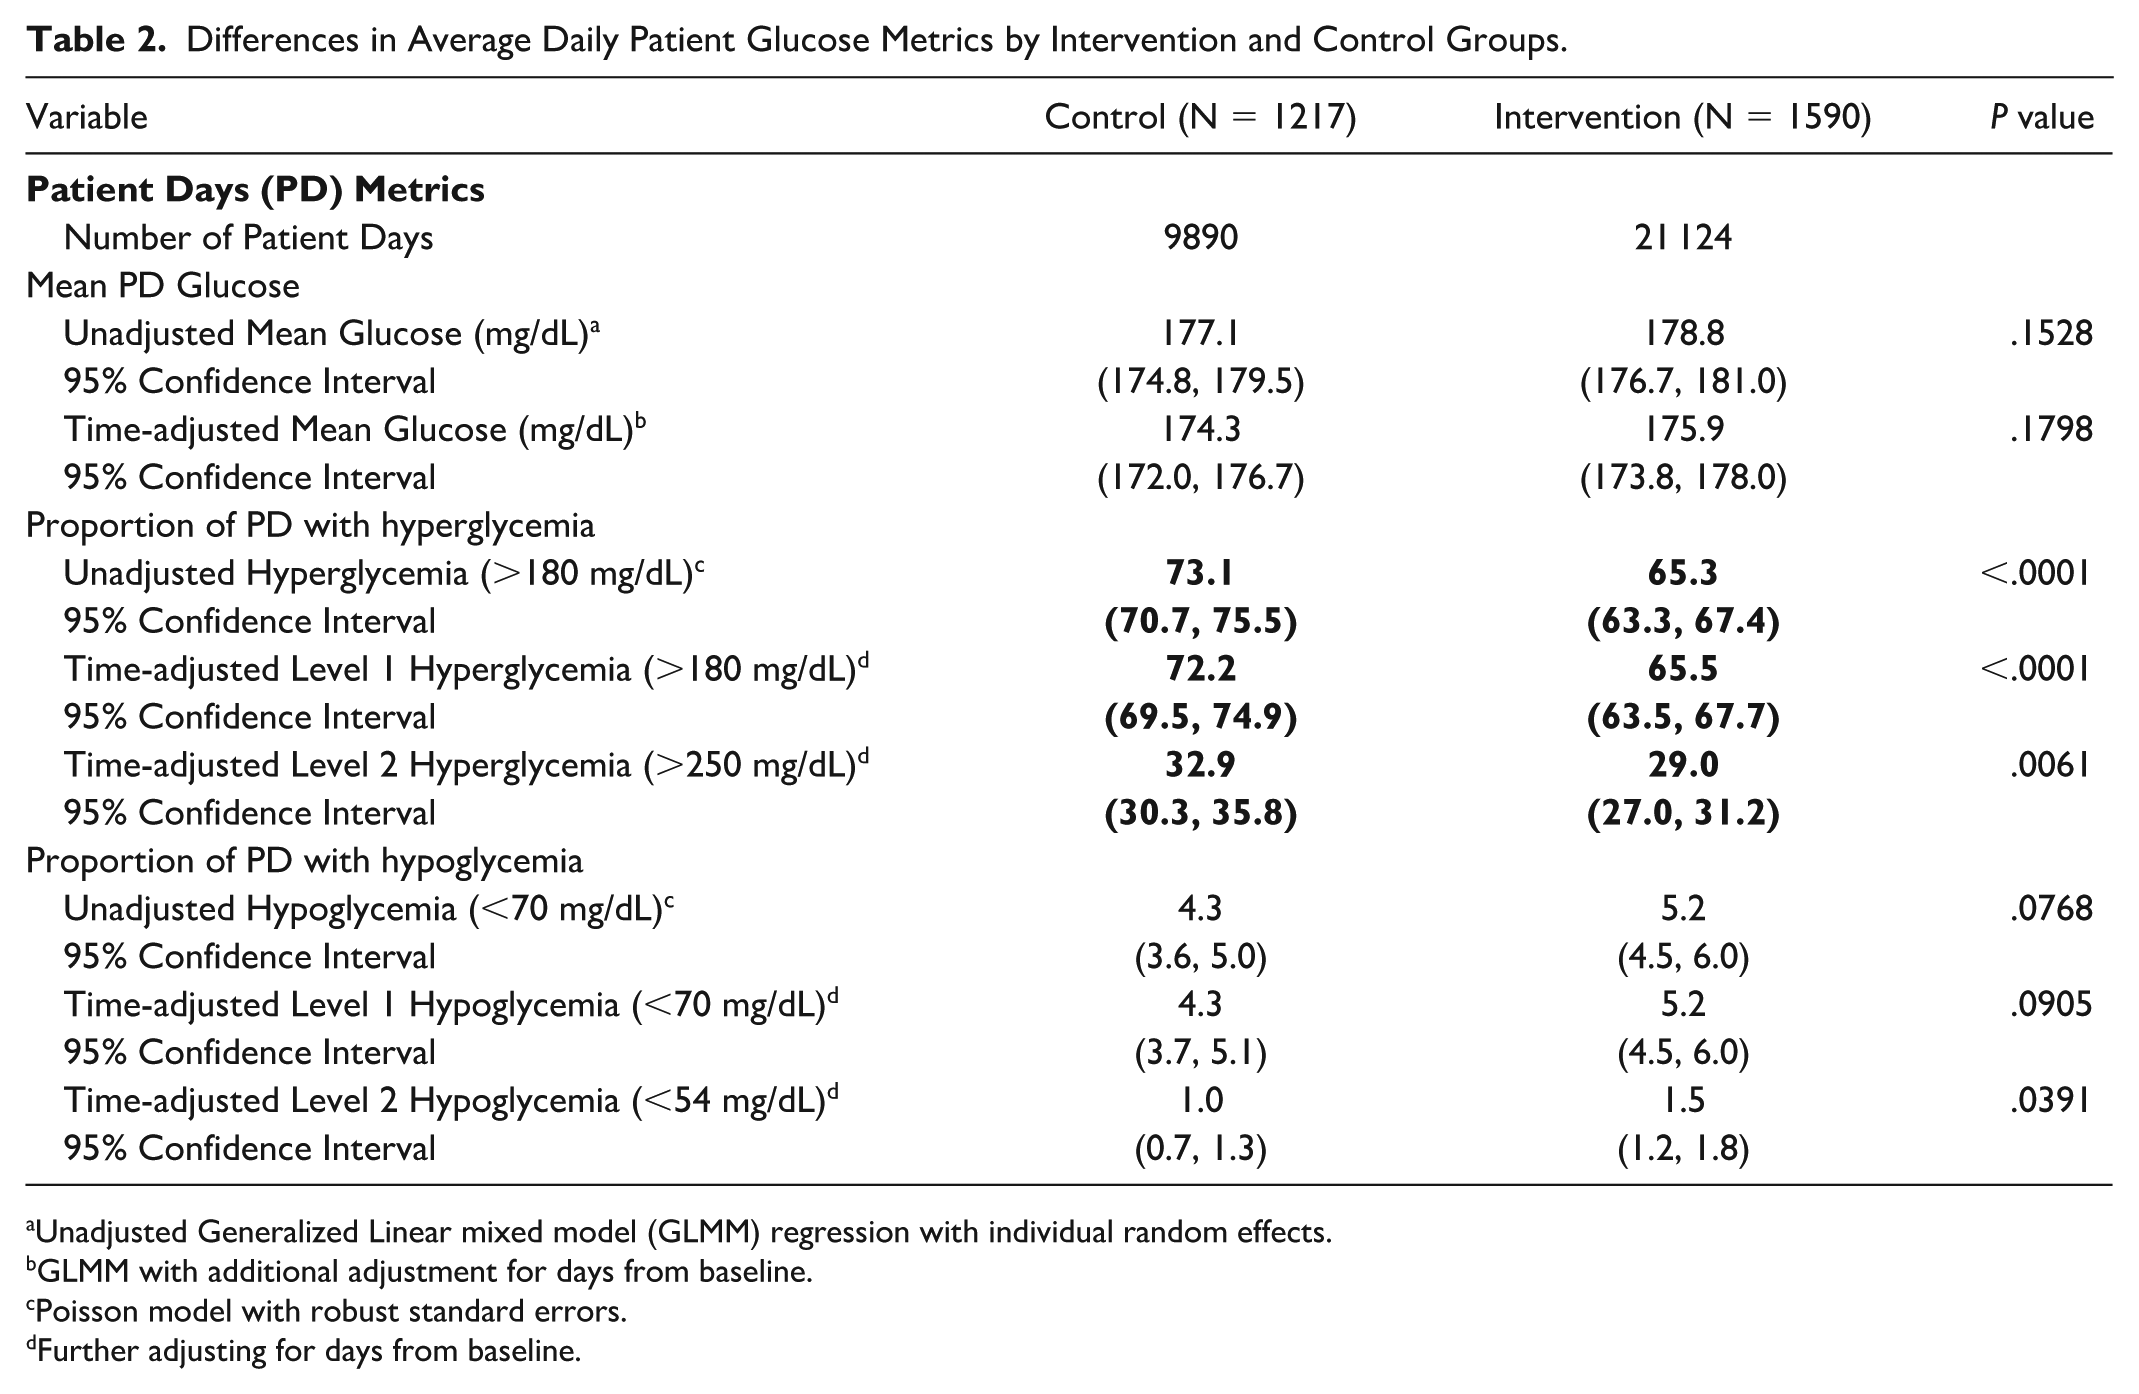
Unadjusted Generalized Linear mixed model (GLMM) regression with individual random effects.
GLMM with additional adjustment for days from baseline.
Poisson model with robust standard errors.
Further adjusting for days from baseline.
At the level of the hospitalization, mean BG levels were not statistically different between the intervention and control groups [178.45 mg/dL (173.18, 183.71) vs 176.45 mg/dL (171.46, 181.45), P = .3977]. (Table 3)
Differences in Hospitalization Level Glucose Metrics by Intervention and Control Groups.
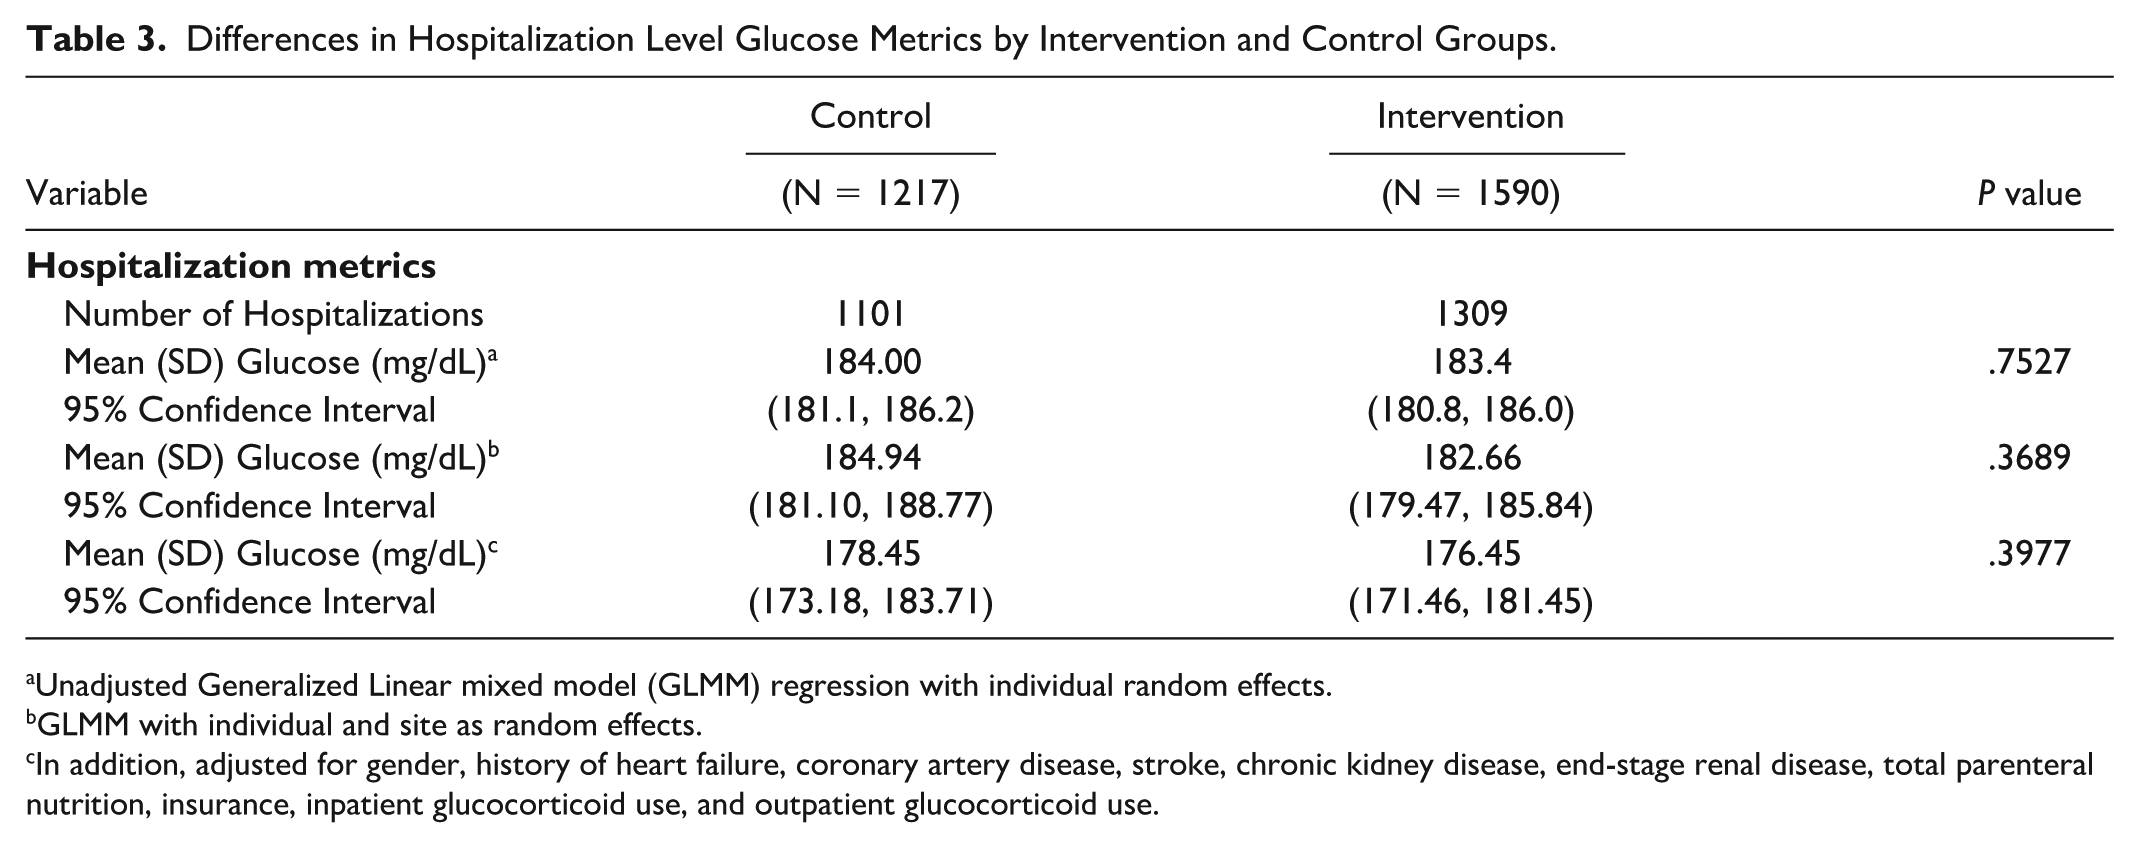
Unadjusted Generalized Linear mixed model (GLMM) regression with individual random effects.
GLMM with individual and site as random effects.
In addition, adjusted for gender, history of heart failure, coronary artery disease, stroke, chronic kidney disease, end-stage renal disease, total parenteral nutrition, insurance, inpatient glucocorticoid use, and outpatient glucocorticoid use.
Intervention Actions
The most common actions recommended by the VGMS team were an increase in prandial insulin (44.8%), followed by an increase in basal insulin (30.5%). Any changes involving correction insulin, NPH insulin, or oral agents were much less frequent. Figure 1 shows the list of VGMS-directed actions taken by the primary teams.
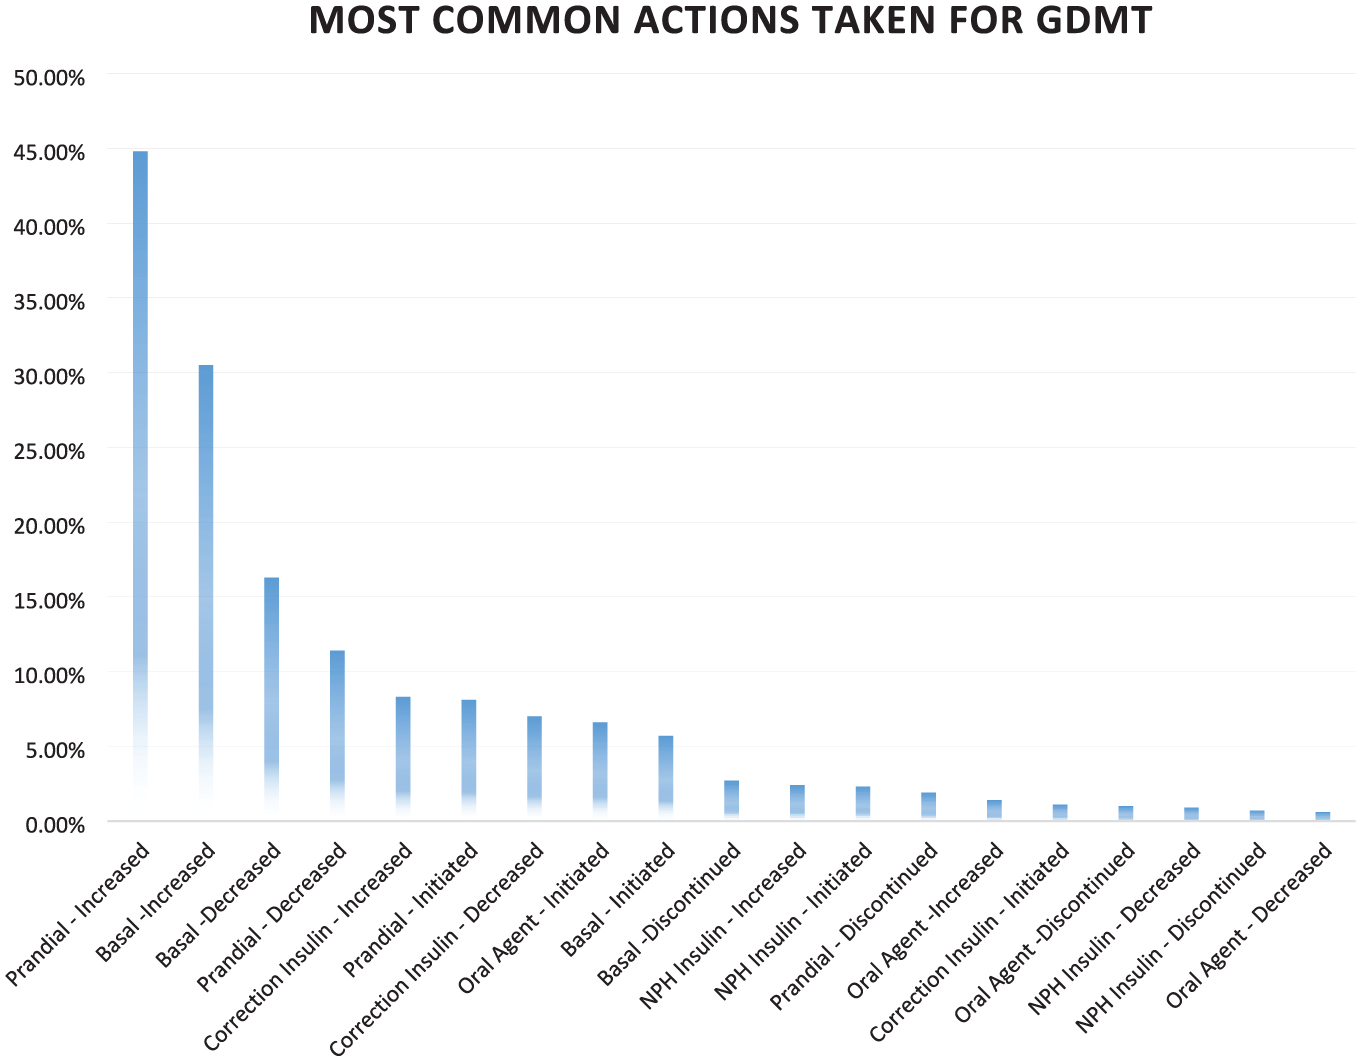
VGMS-directed improvements to glycemic management.
“Special Cause” Variation in GDMT
At the start of the project in the beginning of 2022, about 20% of the individuals were receiving GDMT from the primary teams prior to a VGMS consult. In October 2022, the 3-month moving totals of GDMT prescribed by the primary teams prior to a VGMS written consult had increased to about 60%, as seen in Figure 2. This special cause variation resulted from “spillover” of education and reinforcement received by VGMS around GDMT in glycemic management by the house staff on the four intervention units during the first 6 months of the project. As more house staff and physician assistants learned about inpatient GDMT, they incorporated and sustained this into their ongoing practice.
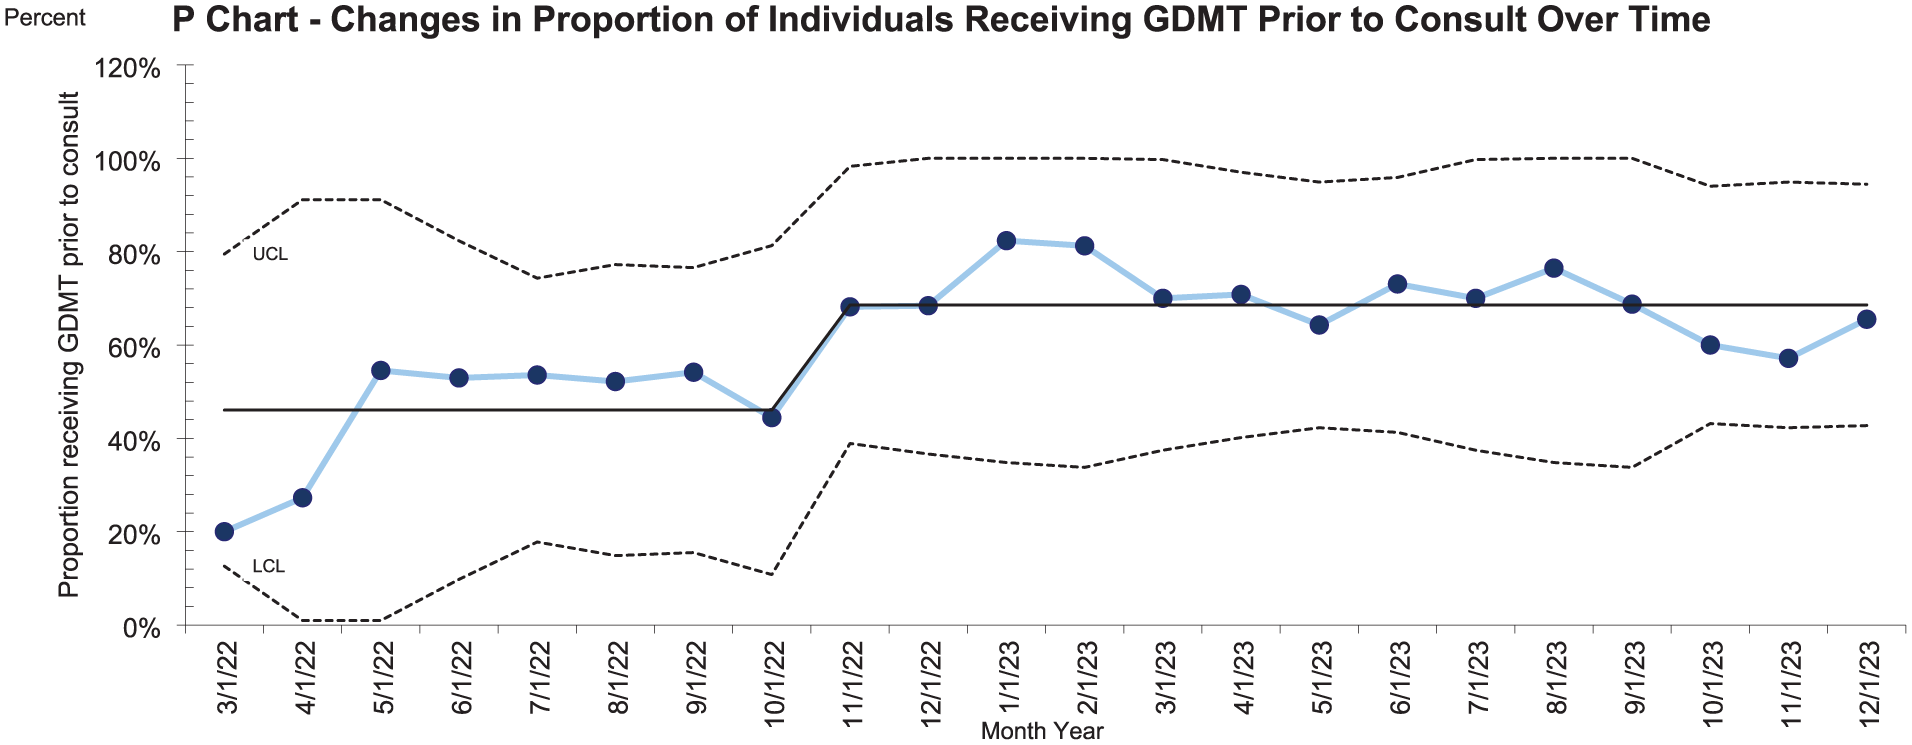
Special cause variation showing the improvement in the proportion of individuals who were already receiving GDMT prior to VGMS written consult.
Discussion
This study found that although individuals on the intervention units had higher baseline HbA1c levels either prior to or upon admission than individuals on the control units, there was virtually no difference in average glucose levels overall during hospitalization. Furthermore, the intervention units showed a lower proportion of individuals per day with hyperglycemia accompanied by no increase in episodes of hypoglycemia. This was accomplished by the intervention team monitoring all individuals on the intervention units and also providing written VGMS consultation notes in the EHR for approximately 11% of individuals on the intervention units.
The study also showed significant improvement in post- compared with pre-VGMS mean glucose values among those who had VGMS written consultation notes. The most recommended treatment adjustments were increasing prandial insulin lispro, followed by adjusting basal insulin glargine. We hypothesize that the need for an increase in prandial insulin likely reflects the primary teams’ overuse of either correction insulin or basal insulin to compensate for hyperglycemia due to carbohydrate consumption. The least common recommended actions were adjustments to NPH insulin or oral hypoglycemic agents, as these agents are less frequently used in the inpatient setting.
One unexpected benefit is the special cause variation in inpatient GDMT. As the VGMS service became more embedded into our general medicine services, the individuals placed on inpatient GDMT by the primary team prior to VGMS consultation increased from 20% to 60%. We hypothesize that as VGMS was adopted, there was a growth in the clinical skillset of primary teams to place individuals on optimized regimens in the hospital. At one point during our study period, 76% of all individuals consulted were already on inpatient GDMT prior to VGMS consultation. There may also have been some improvement in use of GDMT on control units (though we did not collect this data) as medicine house staff at our medical center do rotate onto other units on a month-to-month basis. At our academic medical center, medicine house staff receive lectures on inpatient glycemic management both during the first 2 months of internship as well as during noon conferences during second and third years of residency. However, additional learning occurred during interaction with the VGMS team throughout the course of this quality improvement project.
There have been a few recent studies demonstrating that VGMSs reduce both hyper- and hypoglycemia in hospitalized individuals and more effectively result in glycemic goals being achieved than without a VGMS team.17-19, 21 Many of the VGMSs were created from necessity during the global COVID-19 pandemic11,20 and have shown that it is just as or more effective than prior standard of care in-person glycemic management services. This project demonstrates that leveraging both a VGMS with an inpatient diabetes education team results in overall better glycemic management during hospitalization and increased uptake of GDMT prescribing at discharge. This process also maximizes staffing of endocrinology needs in the hospital, by leveraging both an in-person consult team as well as a remote consult team.
This project design strengthens the existing literature by including both control and intervention units, demonstrating the effect in real time of a virtual glucose management team. Prior studies showed a difference in glycemic management in the same group of individuals before and after the implementation of a VGMS.16,17 Having a control group gives us the ability to see differences in glycemic management and the effect of having a VGMS offered on one unit in the hospital versus another.
This project had several limitations. Individuals in the intervention group included a population of general medicine patients. One unit in the control group included individuals on a cardiac telemetry unit that may have led to the decreased length of stay in the control group among those admitted for planned cardiovascular interventions. Also, use of GDMT over time and glycemic outcomes on the control units may have been impacted by month-to-month rotation of the medicine house staff. Another limitation is the promptness of the uptake of recommendations from the VGMS team by the primary team. While the VGMS team actively made recommendations to the primary team, it was up to the primary team to implement the recommendations. While all VGMS recommendations were eventually followed, the VGMS team would contact the primary team via Epic chat if medication orders were not promptly updated by end of day. When they did not implement the recommendations in a timely manner, the optimized impact on glycemic management may have been blunted. In addition, while our study utilized the current standard of care for inpatient monitoring of BG levels with POC testing, other studies have shown that utilizing continuous glucose monitoring (CGM) can result in significant improvements in percent glucose time in range (TIR). 24 However, the current EHR, financial restrictions, and lack of U.S. Food and Drug Administration (FDA) approval for inpatient use, can potentially limit the ability of hospitals to utilize CGM. Finally, this study was unable to capture clinical outcomes such as reduced length of stay, fewer infections, ICU admissions, or readmissions.
Despite these limitations, this quality improvement project showed that VGMS consults in a subset of individuals can significantly improve glycemic outcomes without any significant increase in hypoglycemia. These results along with an improvement in the adoption of GDMT on the medicine services show the benefits of dispersed knowledge of GDMT among primary care hospitalists, internal medicine house staff, and physician assistants.
Conclusions
In conclusion, this article has added to the literature on VGMS by incorporating a control group rather than solely comparing the effect of VGMS before and after implementation. These findings highlight the complexity of hospitalized individuals with diabetes and the necessity for individualized care from a specialized diabetes team for best patient outcomes. This study also underscores that utilizing a VGMS in an academic medical center can lead to an incremental “spillover effect” in primary teams’ growth in their clinical ability to prescribe evidence-based insulin regimens that are both safe and effective in hospitalized individuals.
Supplemental Material
sj-docx-1-dst-10.1177_19322968261417369 – Supplemental material for Delivery of Guideline Directed Care for Inpatient Glycemic Management: Quality Improvement Implementation
Supplemental material, sj-docx-1-dst-10.1177_19322968261417369 for Delivery of Guideline Directed Care for Inpatient Glycemic Management: Quality Improvement Implementation by Felicia A. Mendelsohn Curanaj, Mangala Rajan, Jessica Snead, Paige McCullough and Jennifer Inhae Lee in Journal of Diabetes Science and Technology
Footnotes
Acknowledgements
We gratefully acknowledge the efforts of: Jane Jeffrie Seley, DNP, MPH; Alison Schur, PA-C, RD; Melina Manolas, MD, MPH; Architecture for Research Computing in Health (ARCH), particularly: Evan Sholle, MS; Shantelle Pryce, MSHI; Christopher Panlasigui, BA; Weill Cornell Medical Students, particularly: Gabrielle Ramirez; Briana Liu; Karla Kim; Tiffany Lam; Gabriel Raab; Leah Yao; Jacob Thomas; Quality Improvement Academy Interns particularly: Kaitlyn Lee; Seher Ali; Anjali Singh.
Abbreviations
ADA, American Diabetes Association; BG, blood glucose; EHR, electronic health record; GDMT, guideline directed medical therapy; GLMM, generalized linear mixed effects model; NPH, neutral protamine Hagedorn; PDSA, “Plan, Do, Study, Act”; POC, point of care; VGMS, virtual glucose management service.
Declaration of Conflicting Interests
The authors declared no potential conflicts of interest with respect to the research, authorship, and/or publication of this article.
Funding
The authors received no financial support for the research, authorship, and/or publication of this article.
Supplemental Material
Supplemental material for this article is available online.