
Abstract

In a recent Scientific Reports article, Matabuena et al introduced a multivariate glucodensity representation of continuous glucose monitoring (CGM) data and examined its ability to predict glycemic outcomes based on functional data methods.
The authors present an analysis showing that models incorporating the full CGM glucose distribution and glucose dynamics (eg, speed and acceleration of glucose changes) outperform baseline models that rely on traditional summary CGM metrics (eg, measures of glycemic variability as MAGE) for predicting future HbA1c and fasting plasma glucose (FPG) at five and eight years. 1
In the article, Model 2 is their baseline CGM-based reference model, which combines age, baseline HbA1c, and baseline FPG with standard simple CGM summary measures. In their analysis, the authors showed that Models 4 to 6, the glucodensity-based models, outperformed Model 2. We were curious whether modifying the CGM summary metrics within Model 2 could meaningfully alter its predictive performance.
Specifically, we explored whether incorporating the Glycemia Risk Index (GRI), a composite CGM metric that incorporates glycemic variability, 2 would improve the performance of Model 2. As time in range (TIR) is one of the most commonly used CGM metrics, we introduced TIR as a comparator within Model 2 to assess whether using GRI instead of TIR would improve model prediction. Using the same methods outlined in the paper, we evaluated three variants of Model 2: Model 2 + TIR, Model 2 + GRI, and Model 2 + TIR + GRI and their ability to predict FPG and HbA1c at both five- and eight-year follow-ups.
Across most outcomes, incorporation of the GRI did not substantially alter the predictive performance of Model 2. For glucose at five and eight years and for HbA1c at five years, adjusted R 2 values were similar across the three model variants, with differences between 0.001 and 0.004 (see Table 1). This suggests that the addition of the GRI does not contribute enough independent information beyond what is already captured by Model 2. Although the differences were small, the adjusted R 2 values were more noticeably different for HbA1c at eight years, as the combined model including both TIR and GRI achieved a numerically higher adjusted R 2 (0.600) than models with either TIR alone (0.582) or GRI alone (0.577).
Adjusted R 2 Values for Model 2 Variants That Incorporate Time in Range (TIR) and the Glycemia Risk Index (GRI).
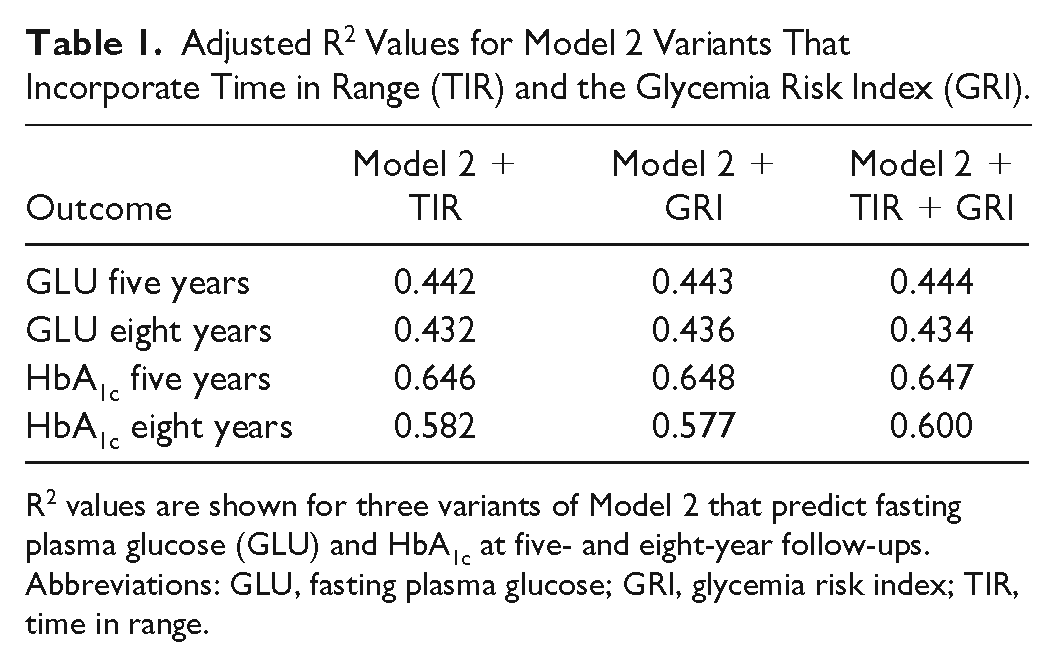
R 2 values are shown for three variants of Model 2 that predict fasting plasma glucose (GLU) and HbA1c at five- and eight-year follow-ups.
Abbreviations: GLU, fasting plasma glucose; GRI, glycemia risk index; TIR, time in range.
Functional data analysis based on glucodensity, compared with models based on simple statistics, has been shown to be a better predictor of future glycemia. Incorporating TIR and GRI into simple statistics prediction models did not improve the performance of these models in our analysis. In the future, clear advantages of the glucodensity-based methodology will be tested in other cohort as the human phenotyping project (HPP).
Footnotes
Abbreviations
CGM, continuous glucose monitoring; FPG, fasting plasma glucose; GLU, fasting plasma glucose; GRI, glycemia risk index; HPP, human phenotyping project; TIR, time in range.
Declaration of Conflicting Interests
The authors declared the following potential conflicts of interest with respect to the research, authorship, and/or publication of this article: DCK is a consultant for Afon, Atropos Health, Embecta, Glooko, Glucotrack, Lifecare, Novo, Nordisk, SynchNeuro, and Thirdwayv. MM, FG, AFS, and MMS have nothing to disclose.
Funding
The authors received no financial support for the research, authorship, and/or publication of this article.