






Abstract
Background:
Although continuous glucose monitoring (CGM)-derived summary metrics are widely used, they may obscure the intraday temporal organization and potentially overlook clinically relevant differences in daily glucose patterning across time. We aimed to identify distinct daily glycemic phenotypes using time-resolved clustering and to examine whether the diversity of these patterns is independently associated with glycated hemoglobin (HbA1c).
Methods:
We analyzed 5902 days of CGM data from 103 participants with type 1 (n = 19) and type 2 (n = 84) diabetes. Daily waveforms were clustered using k-means with dynamic time warping (DTW) to capture temporal features independent of phase shifts. A “Phenotype Diversity Score” (Shannon entropy of each individual’s cluster-label distribution) quantified the variety of phenotypes expressed per participant. Multivariable regression assessed its association with HbA1c, adjusting for established variability metrics, insulin use, and estimated glomerular filtration rate (eGFR).
Results:
Eight distinct daily glycemic phenotypes were identified. The Phenotype Diversity Score strongly correlated with HbA1c (r = 0.600, P < .0001). In a fully adjusted model, including mean of daily differences, coefficient of variation, insulin use, and eGFR, the Phenotype Diversity Score remained independently associated with HbA1c (β = 0.322, P = .004).
Conclusions:
Time-resolved CGM clustering reveals clinically meaningful daily glycemic phenotypes and demonstrates that phenotype diversity is independently associated with HbA1c. This pattern-based perspective complements conventional summary metrics and may help explain glycemic heterogeneity among individuals with similar average glucose levels.
Keywords
Introduction
Continuous glucose monitoring (CGM) has become an essential tool in the management of diabetes, providing high-resolution data on daily glucose fluctuations. In clinical practice, CGM-derived summary metrics, such as time in range (TIR), mean glucose, and coefficient of variation (CV) are widely used to assess glycemic control and guide therapeutic decision-making. Crucially, these metrics correlate with diabetes-related complications independently of glycated hemoglobin (HbA1c),1,2 leading to their integration into global clinical guidelines. 3
Despite their utility, conventional metrics typically collapse the temporal dimension of CGM data. By aggregating glucose values into static indices, the specific timing and morphology of daily fluctuations—such as circadian peaks of hyperglycemia or the precise kinetics of postprandial excursions—are often obscured. From a chronobiological perspective, the timing and regularity of daily behaviors (eg, meal timing and sleep-wake cycles) are critical determinants of circadian rhythm integrity. 4 Disruption of these rhythms, or circadian misalignment, is a known driver of impaired glucose metabolism and heightened cardiometabolic risk. 5
To address these limitations, data-driven approaches like dynamic time warping (DTW)-based clustering have emerged, enabling the classification of glycemic patterns based on waveform shape rather than mere averages.6,7 While these methods have enhanced our understanding of glycemic phenotypes in various contexts,8,9 most studies have focused on identifying dominant or representative patterns at a population level. Consequently, a significant gap remains: existing research has largely overlooked intra-individual variability in these patterns. The degree to which an individual’s daily glycemic waveform fluctuates or recurs from day to day—reflecting the “diversity” of their glucose phenotypes—remains poorly characterized, as does its clinical relevance to HbA1c.
Therefore, this study aimed to: (1) identify distinct daily glycemic phenotypes using DTW-based clustering; (2) characterize the clinical features associated with these phenotypes; and (3) develop a novel metric to quantify the diversity of daily glycemic phenotypes and evaluate its association with HbA1c.
Methods
Subjects
This was a single-center, retrospective observational study conducted at Osaka Kaisei Hospital. We included participants with type 1 (n = 19) or type 2 (n = 84) diabetes who visited our department and had available CGM data between August 1, 2025, and October 31, 2025.
CGM data processing and quality control
Raw CGM data were exported from the FreeStyle Libre system (Abbott Diabetes Care, Alameda, CA). To ensure that the analyzed glycemic profiles corresponded to the period reflected by HbA1c, CGM data were extracted for the 90-day period preceding the date of HbA1c measurement for each participant. Each participant contributed a single HbA1c value and one corresponding CGM observation window; no repeated measures were included.
Raw glucose readings were resampled into 15-minute intervals by calculating the mean glucose value for each interval. Minor within-day data gaps were addressed using forward and backward filling along the time axis. Strict quality control criteria were applied to ensure the reliability of waveform analysis. Specifically, daily CGM profiles with more than 30% missing data (ie, fewer than 67 valid 15-minute data points out of 96 per day) were excluded from the analysis. The distribution of analyzable days per participant is reported in Table 1.
Baseline Clinical Characteristics of the Study Participants.
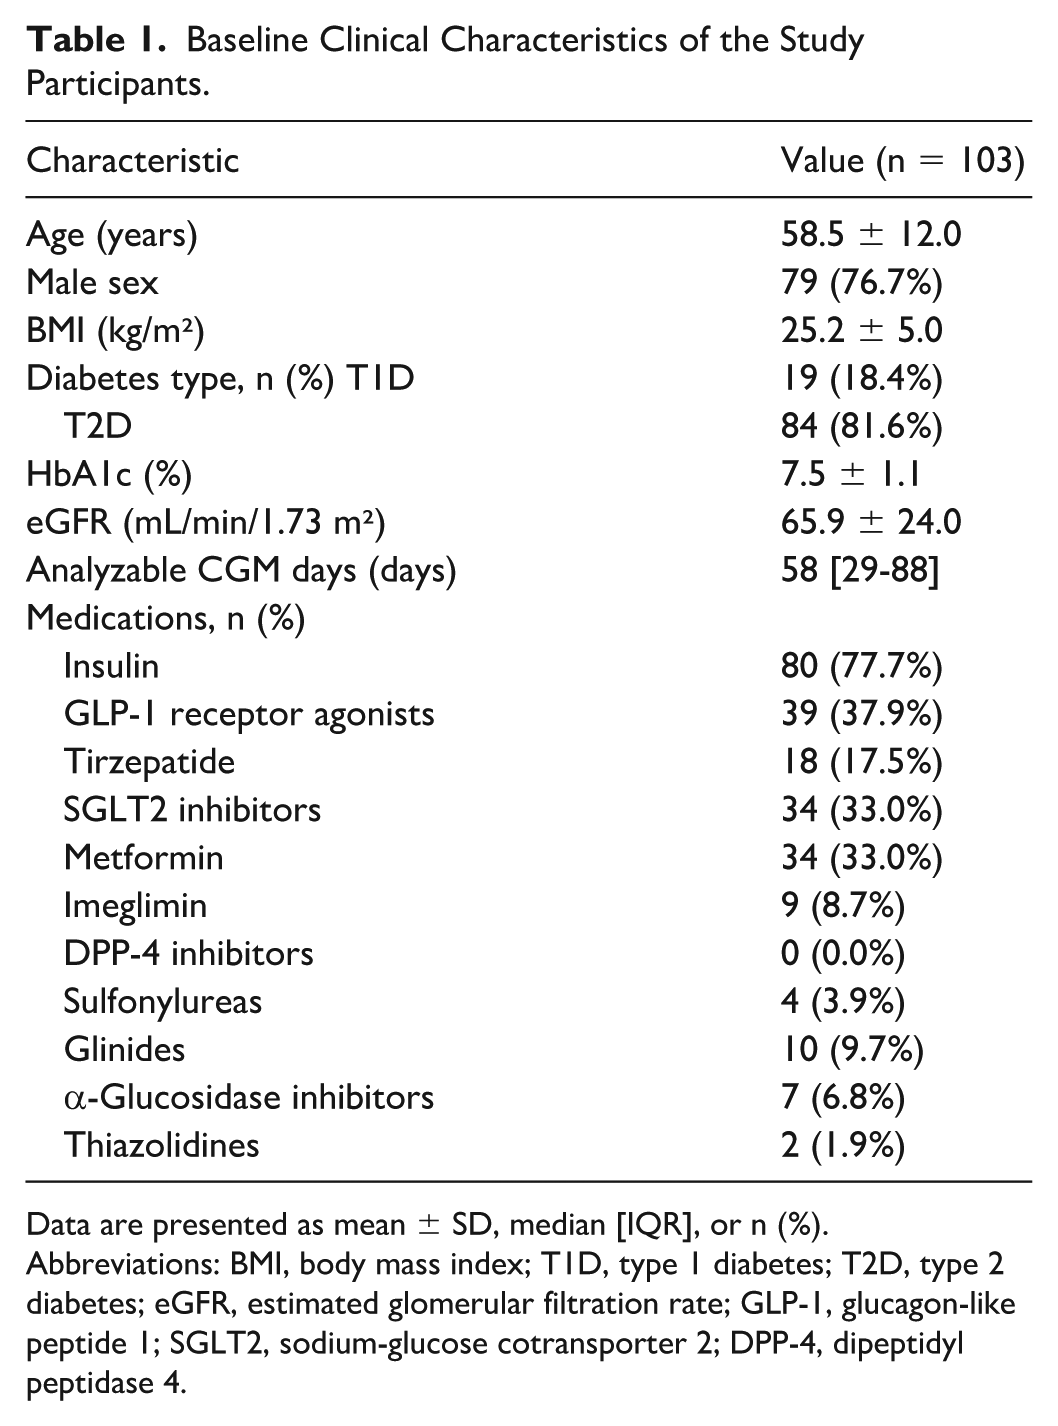
Data are presented as mean ± SD, median [IQR], or n (%).
Abbreviations: BMI, body mass index; T1D, type 1 diabetes; T2D, type 2 diabetes; eGFR, estimated glomerular filtration rate; GLP-1, glucagon-like peptide 1; SGLT2, sodium-glucose cotransporter 2; DPP-4, dipeptidyl peptidase 4.
For participants with multiple CGM sensor sessions during the 90-day window, all qualifying daily profiles were pooled and analyzed on a day-by-day basis. The Phenotype Diversity Score and regression analyses were conducted at the participant level (one value per participant).
Clinical Data and Ethical Considerations
Clinical data, including age, sex, body mass index (BMI), HbA1c, estimated glomerular filtration rate (eGFR), insulin use, and diabetes treatment regimens, were extracted from electronic medical records at the time of HbA1c measurement.
The study protocol was approved by the Institutional Review Board of Osaka Kaisei Hospital (Approval No. 24-13). Due to the retrospective nature of the study and the use of anonymized data, the requirement for written informed consent was waived, and an opt-out method was employed in accordance with institutional ethical guidelines.
DTW-Based Clustering of Daily Waveforms
Daily CGM waveforms were clustered using time-series k-means with DTW as the distance metric. The input data set consisted of daily glucose profiles resampled at 15-minute intervals (96 time points per day), with each daily profile represented as a univariate time series (shape: 96 × 1). No z-normalization or scaling was applied prior to clustering; absolute glucose levels were retained to preserve clinically meaningful differences in glycemic exposure across individuals. Occasional within-day missing values were imputed using forward and backward filling along the time axis, consistent with the preprocessing described above.
Clustering was performed using the TimeSeriesKMeans implementation (tslearn) with DTW distance and a Sakoe-Chiba global constraint to limit excessive temporal warping, with a radius of 4 time points (corresponding to ±1 hour).
The optimal number of clusters was determined using an exploratory approach combining inertia (elbow method) and silhouette analysis. To reduce the computational burden associated with DTW-based clustering, the evaluation for cluster number selection was conducted on a randomly selected subset of daily CGM profiles (n = 500). Based on the combined assessment of inertia reduction, silhouette scores, and interpretability of the resulting cluster patterns, k = 8 was selected for subsequent analyses. The clustering algorithm was run with a maximum of 10 iterations and a fixed random seed (random_state = 42). Cluster assignments were saved for each daily profile and used in subsequent analyses.
Definition of the Phenotype Diversity Score
To quantify the diversity of daily glycemic phenotype expression within individuals, we developed the Phenotype Diversity Score based on Shannon entropy. For each participant, the distribution of daily cluster assignments across the eight clusters was calculated as the proportion of days assigned to each cluster.
The Phenotype Diversity Score was defined as follows:

where
Calculation of Glycemic Metrics
For each daily CGM profile, a comprehensive set of CGM-derived metrics was calculated to characterize glycemic status. Standard metrics included mean glucose, CV, TIR (70-180 mg/dL), and time in tight range (TITR = 70-140 mg/dL). Risk indices for hypoglycemia and hyperglycemia were assessed using the low blood glucose index and high blood glucose index (HBGI), respectively.
To quantify the magnitude of day-to-day glycemic variability, the mean of daily differences (MODDs) was calculated as the mean absolute difference between glucose values at matched time points on consecutive days.
Statistical Analysis
Continuous variables are presented as mean ± standard deviation (SD) or median (interquartile range), as appropriate based on their distribution. Categorical variables are presented as numbers and percentages.
Differences in clinical characteristics and CGM-derived metrics across the eight glycemic phenotypes were evaluated using the Kruskal-Wallis test for continuous variables and the chi-square test for categorical variables. Pearson’s correlation coefficients (r) were calculated between HbA1c and variability metrics, including the Phenotype Diversity Score and MODD.
Multivariable linear regression analyses were performed with HbA1c as the dependent variable to evaluate the independent association of the Phenotype Diversity Score with HbA1c. We constructed four sequential models: model 1 adjusted for age, sex, BMI, and the Phenotype Diversity Score; model 2 adjusted for age, sex, BMI, and MODD; model 3 (the combined model) included age, sex, BMI, CV, MODD, and the Phenotype Diversity Score; and model 4 further included insulin use (yes/no) and eGFR to assess robustness after adjustment for treatment intensity and renal function (the fully adjusted model). Both unstandardized (B) and standardized (β) regression coefficients were calculated to assess the clinical impact and relative importance of each predictor, respectively. Multicollinearity was assessed using the variance inflation factor (VIF), with a value >10 considered indicative of significant multicollinearity.
Sensitivity analyses were performed to assess the robustness of the primary findings. First, analyses were repeated restricting to participants with ≥14 and ≥28 analyzable CGM days to address potential bias from unequal sampling duration. Second, analyses were repeated restricting to participants with type 2 diabetes only (n = 84) to confirm that the inclusion of type 1 diabetes did not confound the results. In addition, two transition-sensitive metrics were computed using consecutive-day pairs to complement the Phenotype Diversity Score. The switching rate was defined as the proportion of consecutive-day pairs in which the cluster assignment changed. Transition entropy was calculated as the Shannon entropy of the empirical transition probability matrix, quantifying the unpredictability of day-to-day phenotype transitions. These metrics and their associations with HbA1c are reported in the Supplementary Materials.
All statistical analyses were performed using Python (version 3.13.7 Python Software Foundation, Wilmington, DE).
Results
Baseline Characteristics of Study Participants
A total of 103 participants with diabetes (type 1, n = 19; type 2, n = 84) who visited the outpatient clinic at our hospital between August and October 2025 were included in this analysis. The baseline clinical characteristics of the study population are summarized in Table 1. The mean age was 58.5 ± 12.0 years, the mean HbA1c was 7.5 ± 1.1%, and the mean BMI was 25.2 ± 5.0 kg/m². From these participants, we analyzed a total of 5902 daily CGM profiles that met the data sufficiency criterion of >70% active monitoring time per day. The median number of analyzable days per participant was 58 (interquartile range = 29-88; range = 5-176).
Using DTW-based k-means clustering, we identified eight distinct daily glycemic phenotypes based on CGM waveform patterns (Figure 1a). These phenotypes differed in overall glycemic level, temporal glucose distribution across the day, and degree of glycemic variability.
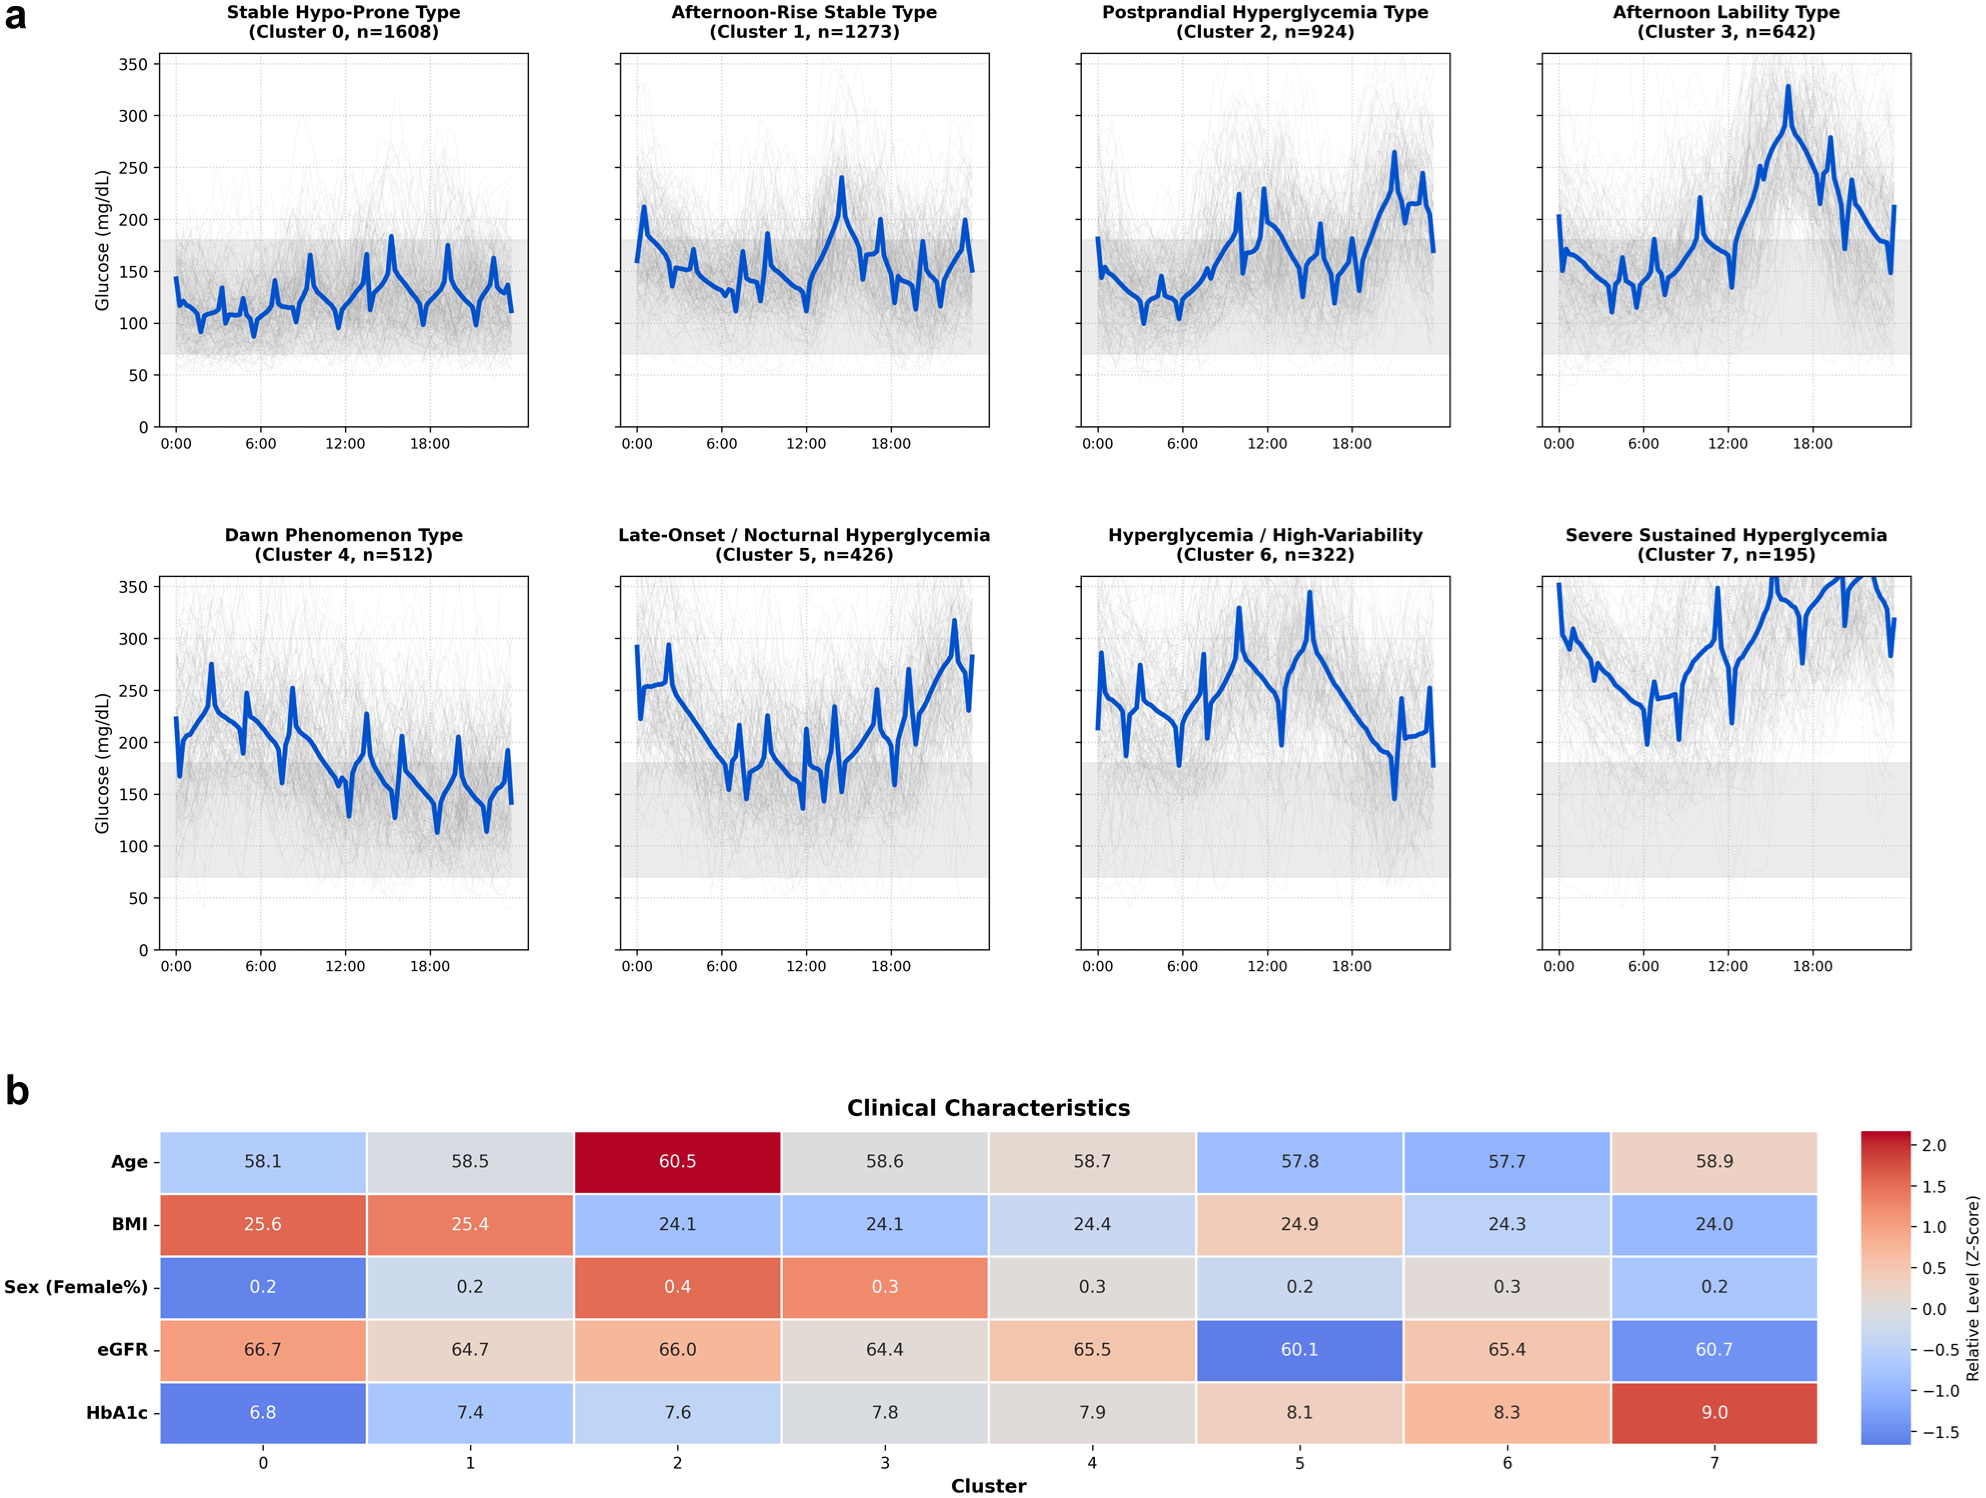
Identification and clinical characterization of daily glycemic phenotypes based on CGM waveform patterns. (a) Daily glycemic waveforms classified into eight distinct clusters using dynamic time warping (DTW)-based k-means clustering. Bold blue lines indicate cluster centroids (representative waveforms), while thin gray lines represent individual daily CGM traces (n = 200 randomly sampled per cluster for visualization). The gray shaded area indicates the target glucose range (70-180 mg/dL). (b) Heatmap summarizing key clinical characteristics across glycemic clusters. Values within cells represent cluster-wise mean values of each parameter. Colors indicate Z-scores relative to the overall population mean (red, higher and blue, lower), providing a descriptive overview of clinical differences among clusters. For sex, values indicate the proportion of female participants.
Clusters 0 and 1 were characterized by relatively stable glycemic profiles largely confined within the target range, whereas other clusters exhibited distinct temporal features, including postprandial glucose excursions, nocturnal hyperglycemia, and early-morning glucose rises (Figure 1a).
In particular, on one hand, cluster 4 showed a characteristic early-morning increase in glucose levels followed by a gradual decline throughout the day, consistent with a dawn phenomenon-like pattern. On the other hand, cluster 5 exhibited a progressive increase in glucose levels during the afternoon with sustained nocturnal hyperglycemia.
Clusters 6 and 7 were characterized by persistently elevated glucose levels, with cluster 6 showing marked glycemic variability and cluster 7 demonstrating sustained hyperglycemia with relatively low variability.
Quantitative CGM metrics and clinical characteristics for each cluster are summarized in Table 2. The distribution of diabetes type did not differ significantly across clusters (P = .937, chi-square test).
Quantitative CGM Metrics and Clinical Characteristics Across Eight Daily Glycemic Phenotype Clusters.
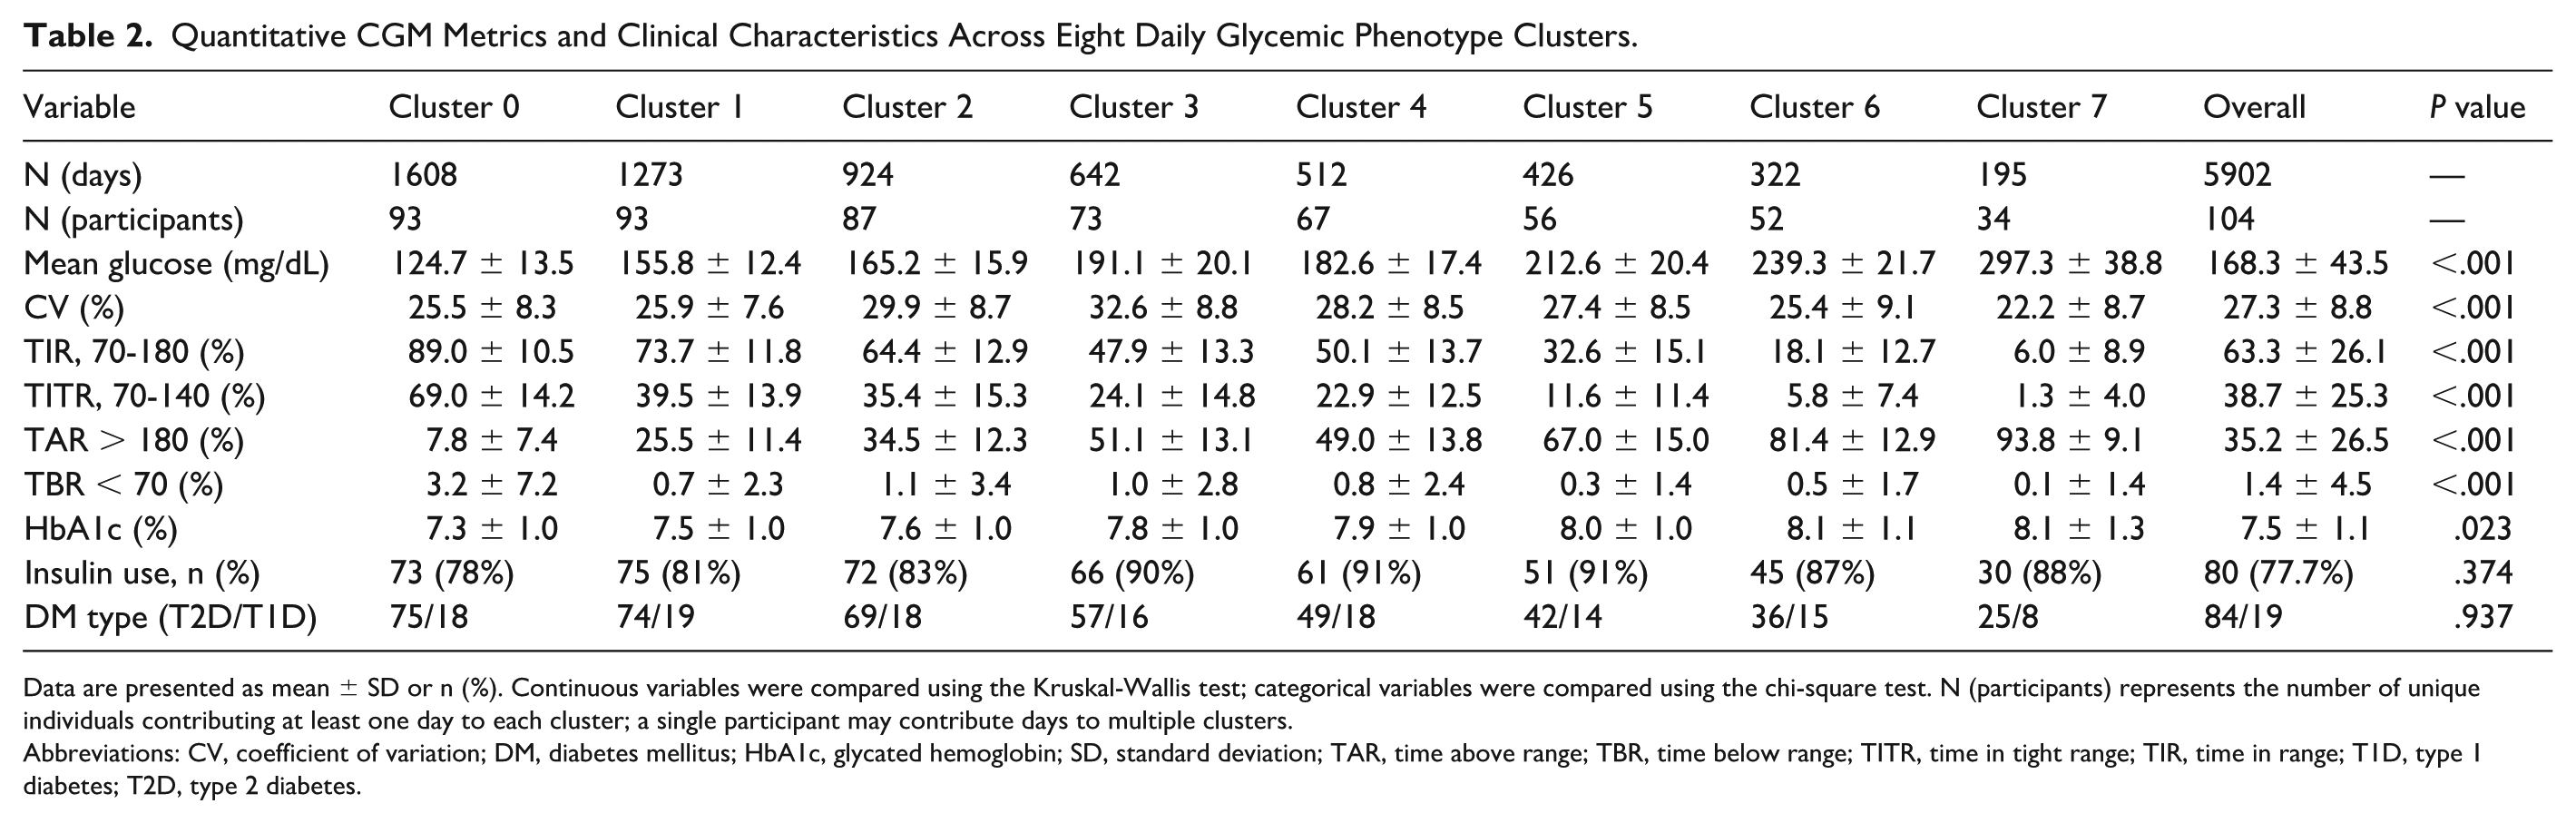
Data are presented as mean ± SD or n (%). Continuous variables were compared using the Kruskal-Wallis test; categorical variables were compared using the chi-square test. N (participants) represents the number of unique individuals contributing at least one day to each cluster; a single participant may contribute days to multiple clusters.
Abbreviations: CV, coefficient of variation; DM, diabetes mellitus; HbA1c, glycated hemoglobin; SD, standard deviation; TAR, time above range; TBR, time below range; TITR, time in tight range; TIR, time in range; T1D, type 1 diabetes; T2D, type 2 diabetes.
Details of glycemic profiles by time zone were described in Supplemental Figure 1.
Clinical characteristics across the eight glycemic clusters are summarized descriptively in Figure 1b, illustrating heterogeneity in glycemic burden and participant profiles among the identified phenotypes. Clusters were ordered according to mean HbA1c levels. The distribution of diabetes medications across clusters is provided in Supplementary Figure 2.
Clusters 0 and 1 were characterized by higher BMI compared with other clusters, while the proportion of participants treated with insulin was relatively low. In contrast, the use of incretin-based therapies, including GLP-1 receptor agonists and tirzepatide, was more frequent in these clusters.
Cluster 3 comprised the oldest participants on average and showed a relatively lower BMI compared with several other clusters. In this cluster, the proportion of insulin use was among the highest, comparable with that observed in cluster 7. Cluster 5 was notable for having the lowest eGFR among all clusters.
Mean HbA1c levels differed substantially across clusters, with cluster 7 exhibiting the highest mean HbA1c (9.5%).
Overall, these findings demonstrate substantial heterogeneity in clinical characteristics and treatment profiles across the identified daily glycemic phenotypes.
Although the clustering analysis classified glycemic waveform shapes on a daily basis, individual participants did not necessarily exhibit a single fixed phenotype but often expressed different clusters from day to day. To quantify this diversity in glycemic phenotype expression, we calculated the Phenotype Diversity Score.
Figure 2 illustrates the associations between HbA1c levels and two metrics of glycemic variability. The Phenotype Diversity Score showed a significant positive correlation with HbA1c (r = 0.600, P < .001; Figure 2b). A similar positive correlation was observed between HbA1c and the MODDs, a conventional metric reflecting the amplitude of day-to-day glycemic variability (r = 0.622, P < .001; Figure 2a).
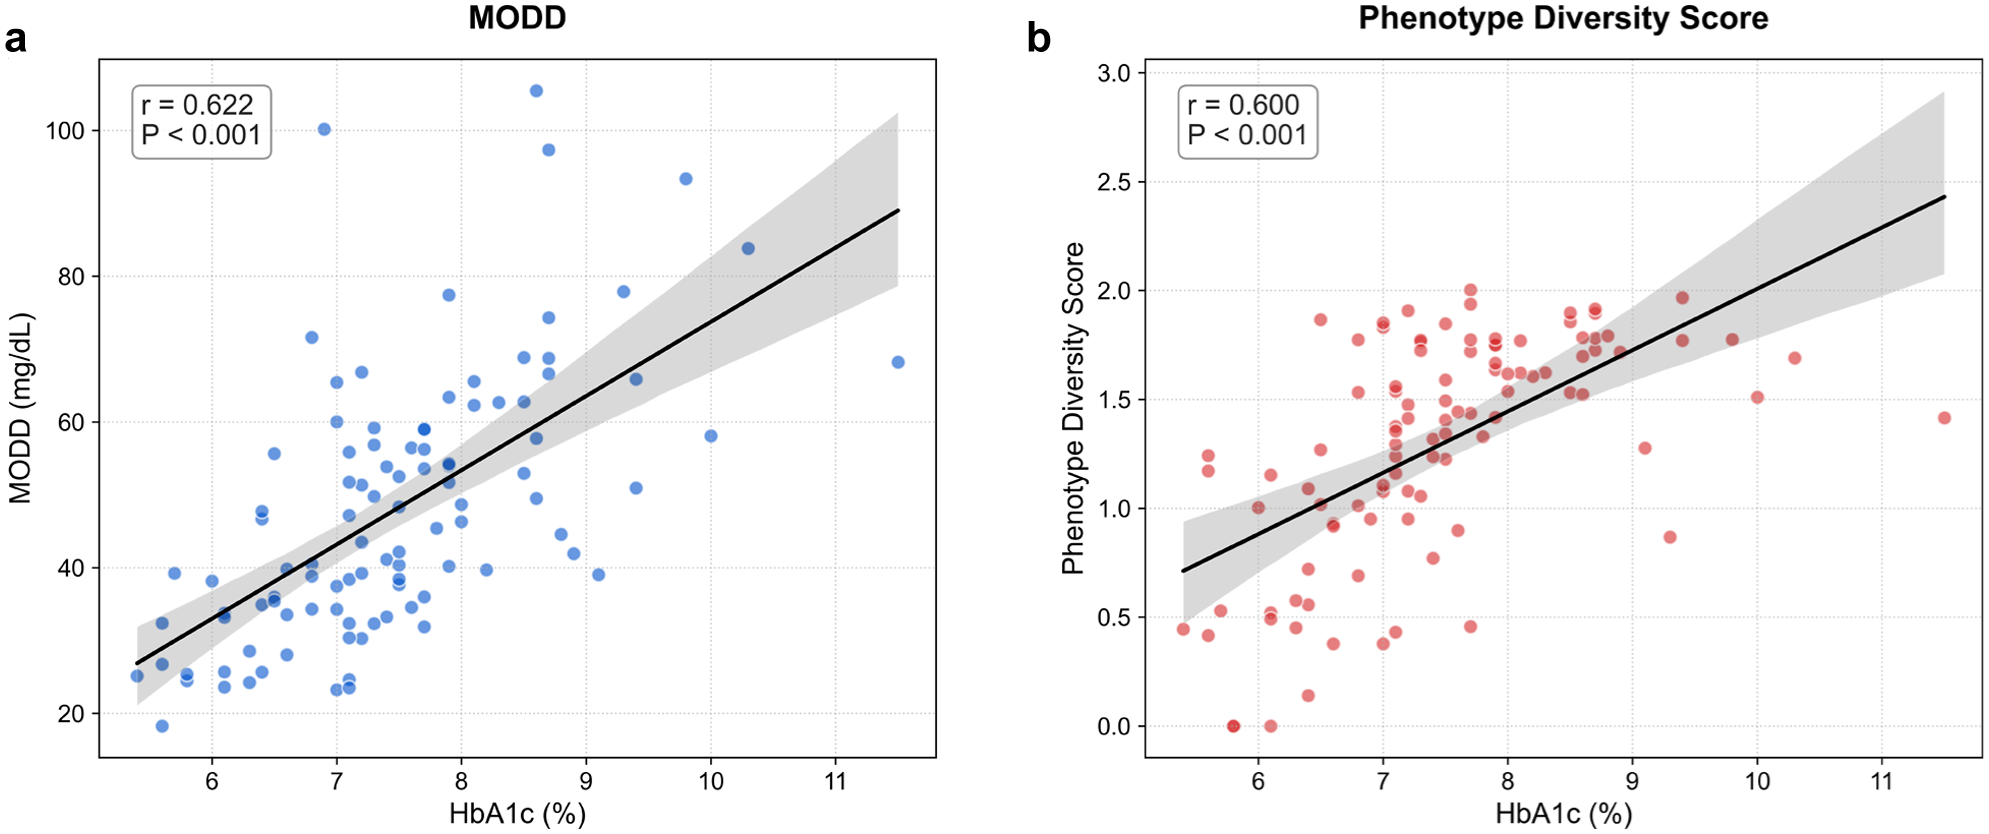
Association of day-to-day glycemic variability and phenotype diversity with HbA1c levels. Scatter plots showing the relationship between HbA1c and two distinct metrics of day-to-day glycemic variability. (a) Correlation between HbA1c and MODD, a conventional metric of day-to-day glycemic variability. A significant positive correlation was observed (r = 0.622, P < .001). (b) Correlation between HbA1c and the Phenotype Diversity Score, a novel metric quantifying the variety of daily glycemic phenotypes expressed per individual. A significant positive correlation was also observed (r = 0.600, P < .001), indicating that greater phenotype diversity was associated with higher HbA1c levels. Regression lines are shown in black with 95% confidence intervals (shaded areas).
To examine whether the association between the Phenotype Diversity Score and HbA1c was independent of other clinical and CGM-derived factors, multivariable linear regression analyses were performed (Table 3). In model 1, the Phenotype Diversity Score was significantly associated with HbA1c after adjustment for age, sex, and BMI (β = 0.599, P < .001). Importantly, in the combined model (model 3), which included MODD and CV in addition to base covariates, the Phenotype Diversity Score remained significantly associated with HbA1c (β = 0.354, P < .001). Model 4 further adjusted for insulin use and eGFR; the Phenotype Diversity Score remained significant (β = 0.322, P = .004), while neither insulin use (P = .601) nor eGFR (P = .568) was independently associated with HbA1c (Table 3).
Multivariate Linear Regression Analysis of Factors Associated With HbA1c Levels.
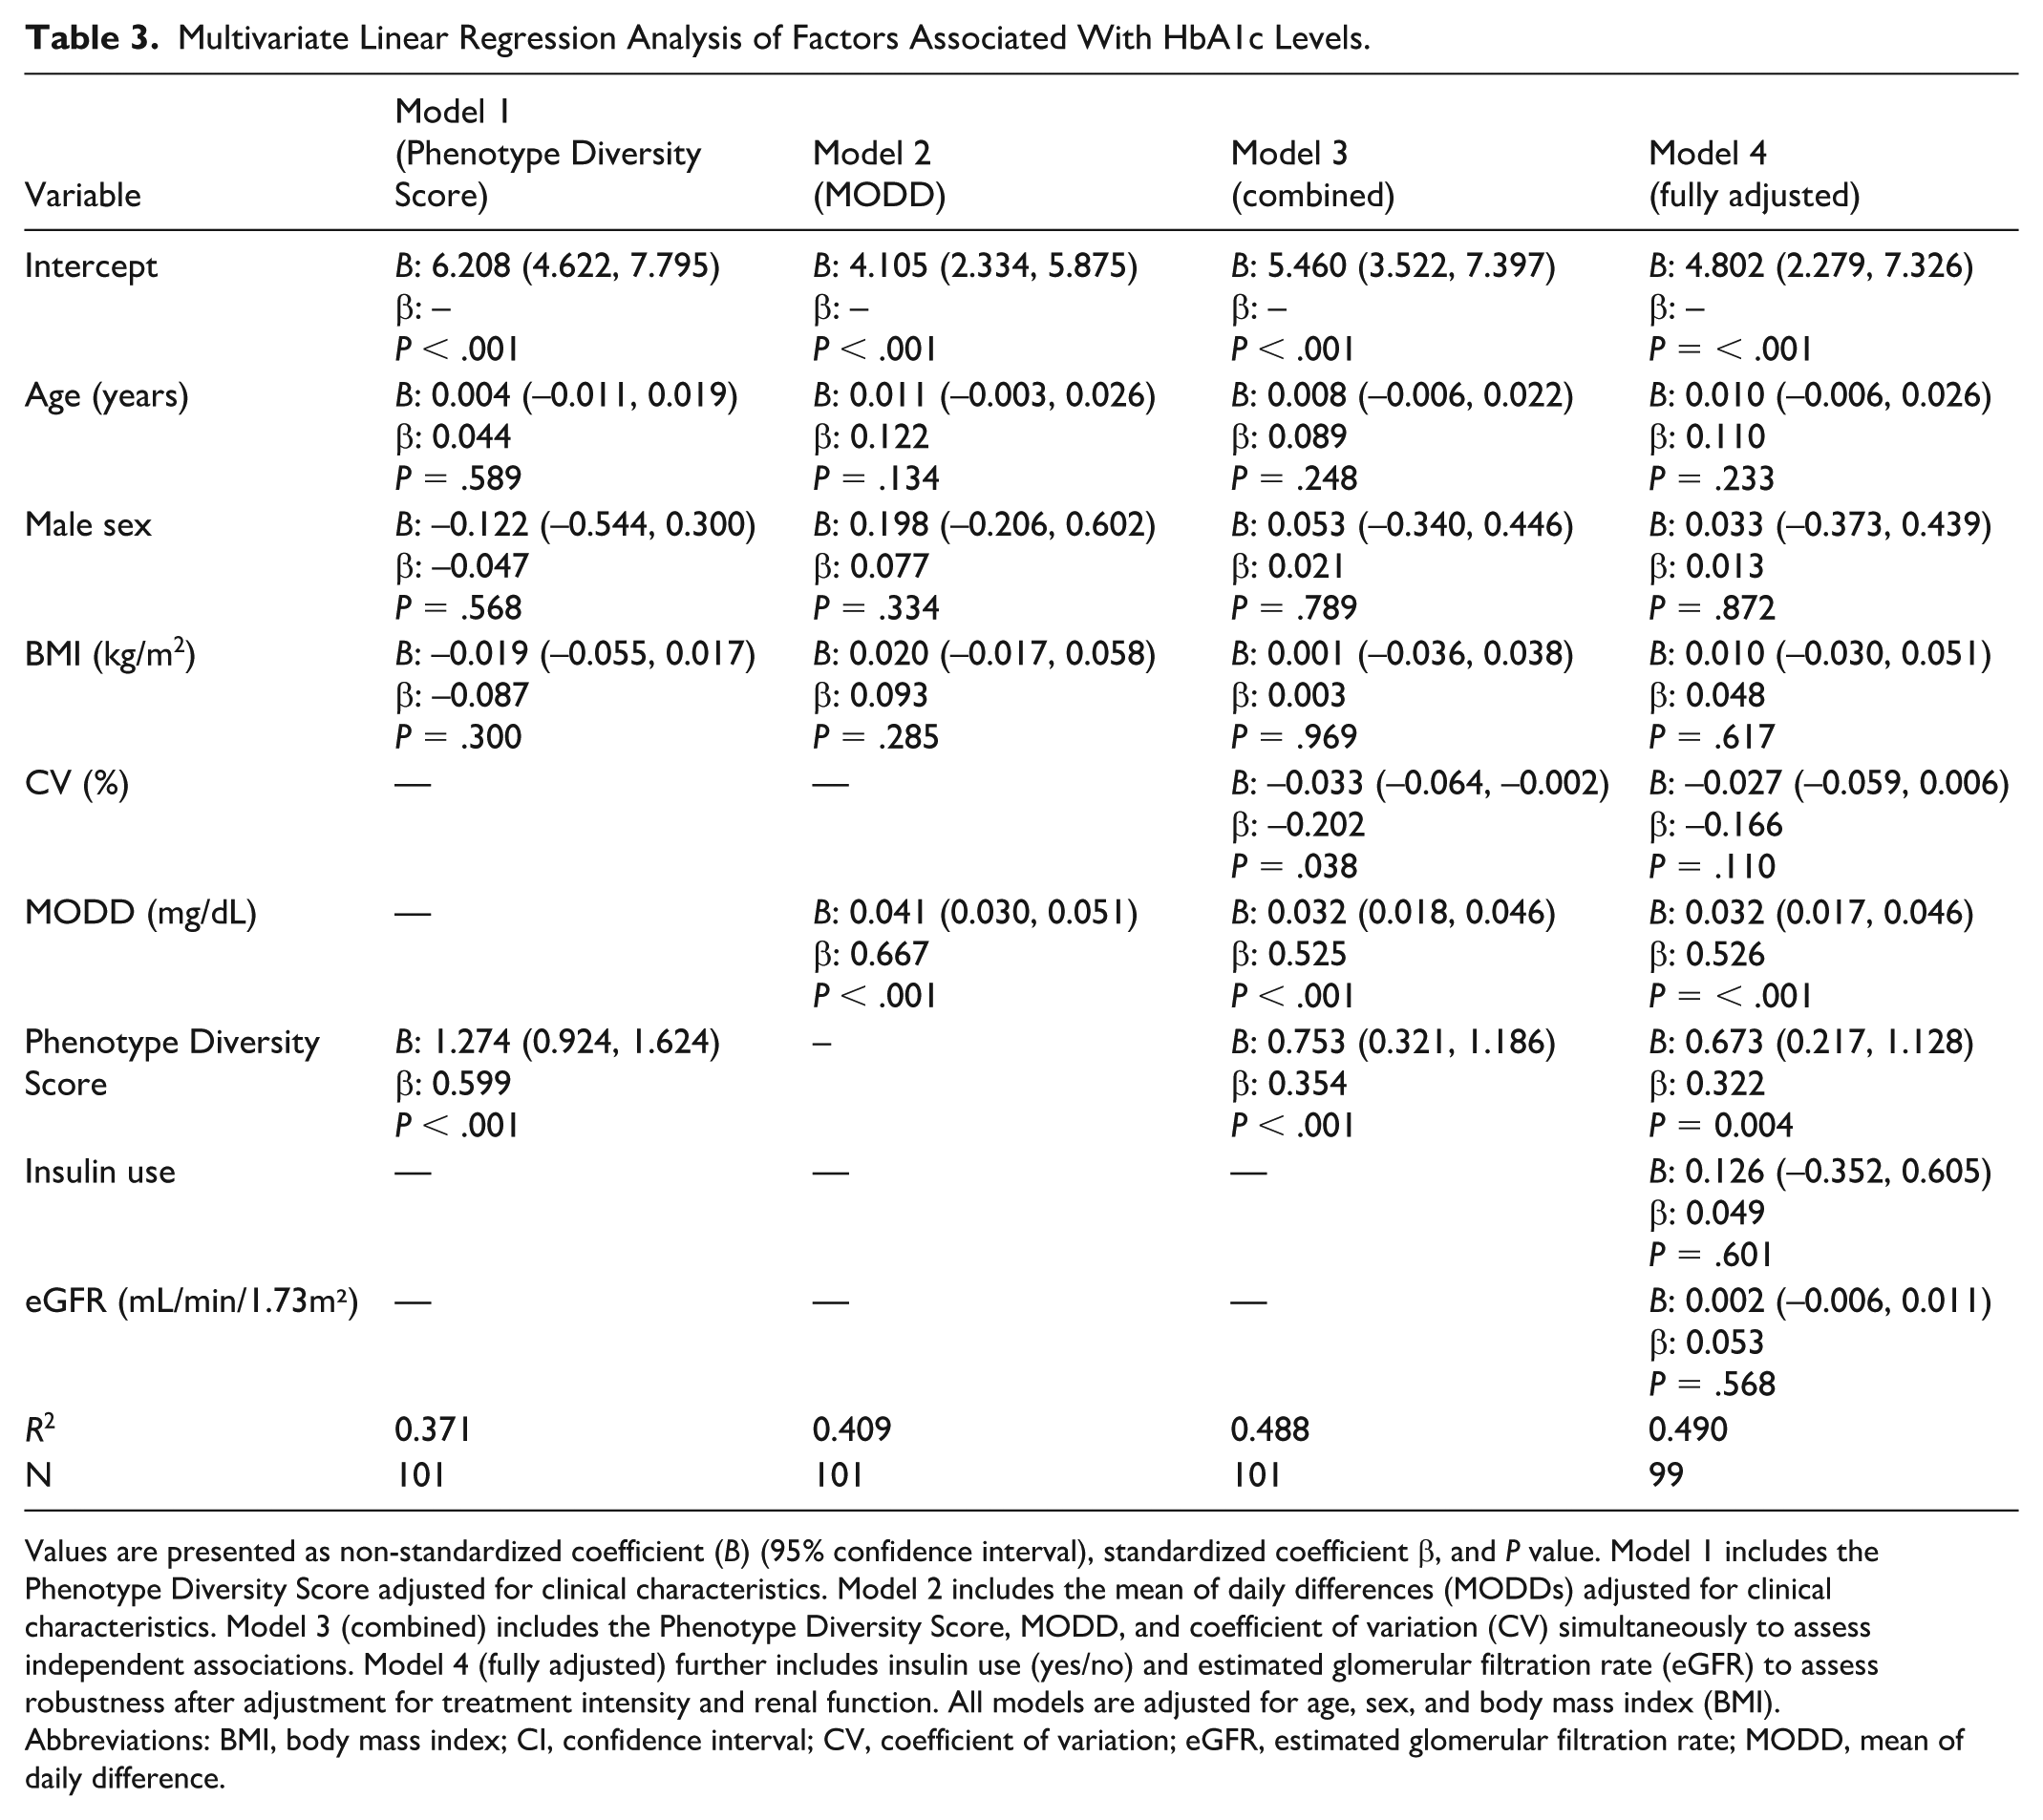
Values are presented as non-standardized coefficient (B) (95% confidence interval), standardized coefficient β, and P value. Model 1 includes the Phenotype Diversity Score adjusted for clinical characteristics. Model 2 includes the mean of daily differences (MODDs) adjusted for clinical characteristics. Model 3 (combined) includes the Phenotype Diversity Score, MODD, and coefficient of variation (CV) simultaneously to assess independent associations. Model 4 (fully adjusted) further includes insulin use (yes/no) and estimated glomerular filtration rate (eGFR) to assess robustness after adjustment for treatment intensity and renal function. All models are adjusted for age, sex, and body mass index (BMI).
Abbreviations: BMI, body mass index; CI, confidence interval; CV, coefficient of variation; eGFR, estimated glomerular filtration rate; MODD, mean of daily difference.
Variance inflation factors for all variables in the final model were low (<2.5), indicating no substantial multicollinearity.
Sensitivity analyses confirmed the robustness of these findings. Restricting to participants with ≥14 analyzable days (n = 87) yielded consistent results, with the Phenotype Diversity Score remaining significantly associated with HbA1c in the fully adjusted model (β = 0.252, P = .038). When restricted to ≥28 days (n = 75), the direction of the association was consistent but did not reach statistical significance (β = 0.132, P = .316), likely reflecting reduced statistical power. (Supplementary Table 1) Analyses restricted to participants with type 2 diabetes only (n = 80) also showed a comparable association (β = 0.339, P = .006, R² = 0.480; Supplementary Table 2). Transition-sensitive metrics (switching rate and transition entropy) were significantly correlated with HbA1c in base-adjusted models, but their independent associations were attenuated after inclusion of MODD in the fully adjusted model, suggesting that day-to-day transitions are largely captured by conventional variability metrics, whereas phenotype diversity captures additional information (Supplementary Table 3).
Together, these results suggest that the diversity of daily glycemic phenotypes represents information associated with HbA1c that is not fully captured by conventional measures of glycemic variability.
Discussion
In this study, we characterized daily glycemic patterns through the lens of intraday glucose dynamics and demonstrated that the diversity of these patterns is significantly associated with HbA1c. By employing DTW-based clustering, we moved beyond conventional summary metrics to capture the morphological complexity of glucose fluctuations. Our findings identify phenotype diversity as a distinct clinical construct, providing a novel framework for assessing glycemic regulation in individuals with diabetes.
Recent advances in CGM data analysis have shifted the focus from simple longitudinal averages toward the recognition of complex, time-resolved glycemic patterns.10-12 While conventional metrics, such as TIR and CV, are indispensable, they inherently aggregate data and frequently obscure critical intraday temporal structures—specifically, the precise timing and morphology of glycemic excursions. 13 To address this limitation, we employed DTW to preserve the temporal integrity of CGM waveforms. Unlike traditional Euclidean-based methods, DTW accounts for variations in physiological phase, such as shifts in meal-related or nocturnal fluctuations, allowing for a more accurate identification of glycemic phenotypes based on their intrinsic morphology.6-8 Furthermore, while non-linear complexity metrics, such as sample entropy, provide valuable insights into the mathematical randomness of glucose fluctuations, clustering CGM waveforms offers a more clinically intuitive framework by defining recognizable templates of daily glycemic life. 9 By expanding the granularity of our classification to eight distinct phenotypes, our analysis offers the resolution to capture the metabolic diversity of a heterogeneous population, extending the three or four broad “glucotypes” identified in earlier studies.6,14,15 This detailed characterization of daily templates served as the foundation for quantifying phenotype diversity— a dimension of glycemic assessment that is not captured by existing metrics.
The hallmark of this study is the shift in focus from static population-level phenotyping to the quantification of intra-individual phenotype diversity. Crucially, our findings demonstrate that individuals with similar average glucose levels may possess markedly different degrees of phenotype diversity, suggesting that the variety of glycemic phenotypes carries clinical information fundamentally distinct from the magnitude of glucose excursions. While our work aligns with prior research in recognizing glycemic heterogeneity, 16 it diverges by centering on the diversity with which these phenotypes are expressed across days. Unlike the framework proposed by Kovatchev and Lobo, which utilizes fixed clusters primarily for longitudinal tracking, 17 our Phenotype Diversity Score characterizes the overall variety of glycemic phenotypes expressed per individual as a complementary dimension of glycemic assessment. Notably, the I Phenotype Diversity Score is distinct from conventional inter-day variability metrics, such as the MODDs. While MODD quantifies the magnitude of point-by-point glucose deviations, the Phenotype Diversity Score captures the breadth of distinct waveform patterns exhibited by each individual. This distinction was further supported by our supplementary analyses: transition-sensitive metrics (switching rate and transition entropy), which explicitly capture day-to-day sequential changes, lost their independent association with HbA1c after adjustment for MODD, whereas the Phenotype Diversity Score remained significant. This suggests that the clinically relevant information captured by our score reflects not short-term sequential fluctuations but rather the cumulative repertoire of glycemic phenotypes expressed over longer time horizons.
From a mechanistic standpoint, phenotype diversity is conceptually consistent with disruptions in the temporal organization of daily behaviors and endogenous biological rhythms. Even when average glucose remains constant, variations in the timing of meals, sleep, and physical activity can alter the morphology of intraday excursions. Notably, such temporal inconsistency itself may act as a potent metabolic stressor.4,18 Accumulating evidence indicates that irregular meal and sleep timing are associated with impaired insulin sensitivity and higher HbA1c, independent of total caloric intake or sleep duration. 5 ,19-21 A particularly relevant example is social jetlag—the discrepancy between weekday and weekend sleep-activity schedules—which has been associated with higher HbA1c in a meta-analysis of 12 studies 22 and with reduced TIR in individuals with type 1 diabetes. 23 Individuals experiencing social jetlag may exhibit distinct glycemic phenotypes on workdays versus free days (eg, a stable, well-controlled pattern during structured weekdays shifting to a pattern with delayed postprandial excursions or nocturnal hyperglycemia on weekends), resulting in increased phenotype diversity as captured by our score. Thus, the Phenotype Diversity Score may serve as a CGM-derived surrogate marker of circadian misalignment—a state where the lack of synchronization between internal biological clocks and external behaviors impairs glucose metabolism. Our finding that phenotype diversity, but not day-to-day transition metrics, remained independently associated with HbA1c after adjustment for MODD is consistent with this interpretation, as social jetlag operates on a weekly rather than daily time scale.
Clinically, these findings provide a rationale for distinguishing two distinct participant profiles: those requiring pharmacological intensification and those who might benefit more from interventions targeting lifestyle regularity. For example, an individual whose Phenotype Diversity Score is high despite adequate mean glucose may benefit less from medication adjustment and more from stabilizing meal timing, sleep schedules, or weekend routines—an actionable insight that conventional CGM metrics alone would not reveal. By reframing CGM analysis from static categorization to the quantification of phenotype diversity, our approach provides a novel framework for capturing the “temporal quality” of glucose regulation, offering a potential pathway toward more personalized and chronobiological diabetes management.
Several limitations of this study warrant consideration. First, as a single-center, retrospective observational study, our findings demonstrate association rather than causality between phenotype diversity and HbA1c. Second, HbA1c reflects glycemic exposure over approximately three months and should not be interpreted as a comprehensive measure of long-term glycemic control. Our findings are therefore limited to the association between phenotype diversity and this medium-term marker, and longitudinal studies with repeated HbA1c measurements are needed to establish its relationship with longer-term outcomes. Third, although the Phenotype Diversity Score likely reflects irregularities in daily routines, we did not directly measure behavioral factors, such as the precise timing of meals, sleep, physical activity, or medication adherence. In particular, the hypothesis that social jetlag contributes to phenotype diversity remains to be tested through integrated sleep-activity and CGM data collection. Fourth, because CGM data were obtained under non-blinded conditions, a “Hawthorne effect” or real-time behavioral adjustments by participants cannot be excluded. However, this reflects the real-world clinical context in which CGM-based feedback is actively used. Fifth, our study included participants with both type 1 and type 2 diabetes receiving heterogeneous antihyperglycemic therapies, which could potentially confound the analysis of glycemic phenotypes. However, our results suggest that this heterogeneity did not substantially bias the findings: diabetes type was evenly distributed across clusters, insulin use was not independently associated with HbA1c in the fully adjusted model, and sensitivity analyses restricted to type 2 diabetes yielded comparable results. Moreover, although we did not adjust for all individual antihyperglycemic agents, the CGM waveforms analyzed in this study inherently reflect each participant’s glycemic state under their current, physician-directed treatment regimen. From a real-world clinical perspective, it is precisely this “treated phenotype” that clinicians observe and act upon, and demonstrating that phenotype diversity carries independent information within this context may have its own clinical significance. Nonetheless, the relatively small number of participants with type 1 diabetes (n = 19) limits our ability to draw definitive conclusions about this subgroup, and future studies with larger, type-specific cohorts are warranted. Finally, while the eight phenotypes were optimized for this cohort, clustering outcomes are inherently sensitive to methodological choices. Nonetheless, the performance of DTW in preserving temporal structure underscores its utility for shape-based glycemic analysis.
Conclusions
In conclusion, our study underscores that evaluating glycemic control solely through static averages or fluctuation magnitude is insufficient. By introducing the Phenotype Diversity Score as a novel dimension of CGM assessment, we demonstrate that the diversity of daily glycemic phenotypes is independently associated with HbA1c. These findings suggest that for many individuals, the key to improved glycemic outcomes may lie not only in reducing the amplitude of fluctuations but also in promoting regularity in daily behavioral rhythms. This pattern-based framework offers a potential pathway for more personalized, chronobiological interventions—such as stabilizing meal timing and sleep-wake schedules—that complement traditional pharmacological intensification. Future prospective studies incorporating behavioral and circadian data are essential to determine whether reducing phenotype diversity can directly improve clinical outcomes in diabetes management.
Supplemental Material
sj-docx-1-dst-10.1177_19322968261436429 – Supplemental material for Diversity of Daily Glycemic Phenotypes Is Independently Associated With HbA1c: A Time-Resolved CGM Clustering Analysis
Supplemental material, sj-docx-1-dst-10.1177_19322968261436429 for Diversity of Daily Glycemic Phenotypes Is Independently Associated With HbA1c: A Time-Resolved CGM Clustering Analysis by Saeko Osawa, Emi Kuroiwa and Naohiko Ito in Journal of Diabetes Science and Technology
Supplemental Material
sj-tif-2-dst-10.1177_19322968261436429 – Supplemental material for Diversity of Daily Glycemic Phenotypes Is Independently Associated With HbA1c: A Time-Resolved CGM Clustering Analysis
Supplemental material, sj-tif-2-dst-10.1177_19322968261436429 for Diversity of Daily Glycemic Phenotypes Is Independently Associated With HbA1c: A Time-Resolved CGM Clustering Analysis by Saeko Osawa, Emi Kuroiwa and Naohiko Ito in Journal of Diabetes Science and Technology
Supplemental Material
sj-tif-3-dst-10.1177_19322968261436429 – Supplemental material for Diversity of Daily Glycemic Phenotypes Is Independently Associated With HbA1c: A Time-Resolved CGM Clustering Analysis
Supplemental material, sj-tif-3-dst-10.1177_19322968261436429 for Diversity of Daily Glycemic Phenotypes Is Independently Associated With HbA1c: A Time-Resolved CGM Clustering Analysis by Saeko Osawa, Emi Kuroiwa and Naohiko Ito in Journal of Diabetes Science and Technology
Footnotes
Acknowledgements
The authors thank the participants for their valuable contribution to this study.
Abbreviations
BMI, body mass index; CGM, continuous glucose monitoring; CV, coefficient of variation; DTW, dynamic time warping; eGFR, estimated glomerular filtration rate; HbA1c, glycated hemoglobin; MODD, mean of daily difference; TIR, time in range; VIF, variance inflation factor.

Author Contributions
S.O. researched data and wrote the manuscript. E.K. and N.I contributed to the discussion and reviewed/edited the manuscript. S.O. is the guarantor of this work and, as such, had full access to all the data in the study and takes responsibility for the integrity of the data and the accuracy of the data analysis.
Funding
The authors received no financial support for the research, authorship, and/or publication of this article.
Declaration of Conflicting Interests
The authors declared no potential conflicts of interest with respect to the research, authorship, and/or publication of this article.
Use of Artificial Intelligence
During the course of preparing this work, the authors used Gemini (Google LLC, Mountain View, CA) for the purpose of assisting with English language editing and formatting of the manuscript. Following the use of this tool/service, the authors formally reviewed the content for its accuracy and edited it as necessary. The authors take full responsibility for all the content of this publication.
Supplemental Material
Supplemental material for this article is available online.
References
Supplementary Material
Please find the following supplemental material available below.
For Open Access articles published under a Creative Commons License, all supplemental material carries the same license as the article it is associated with.
For non-Open Access articles published, all supplemental material carries a non-exclusive license, and permission requests for re-use of supplemental material or any part of supplemental material shall be sent directly to the copyright owner as specified in the copyright notice associated with the article.
