
Abstract
Background:
Glucagon-like peptide-1 receptor agonists (GLP-1 RAs) and continuous glucose monitors (CGMs) can each improve glycemic control. This retrospective cohort study evaluates the effect of a CGM in patients with type 2 diabetes (T2D) already receiving GLP-1 RAs.
Methods:
This study analyzed IQVIA’s US medical and pharmacy claims data between January 2019 and December 2023. Two distinct cohorts of patients with T2D were included. The first comprised patients initiating a GLP-1 RA (GLP-1 RA cohort). The second comprised patients on a GLP-1 RA who subsequently started using a CGM (GLP-1 RA + CGM cohort). Propensity score matching of clinical and demographic factors was used to control confounding between groups. Changes in glycated hemoglobin (HbA1c) were assessed quarterly over 12 months; mixed-effects logistic regression was used to assess the impact of time and CGM use. A subgroup analysis was performed based on the duration of GLP-1 RA exposure prior to CGM initiation.
Results:
The final matched sample included 13 221 patients. Both cohorts showed HbA1c reduction, but the GLP-1 RA + CGM cohort demonstrated a faster and more substantial decrease. At 12 months, 31% of GLP-1 RA + CGM patients versus 44% of GLP-1 RA-only patients had HbA1c >9%, while 23% versus 20% achieved HbA1c <7%, respectively. Regression modeling confirmed significantly greater odds for HbA1c reduction with CGM use, which held true across subgroups.
Conclusions:
Adding CGM to GLP-1 RA therapy accelerates and enhances glycemic improvement compared with GLP-1 RA alone, regardless of prior GLP-1 RA duration. These findings support combined use to optimize T2D management and reduce time with poor glycemic control.
Keywords
Introduction
Glucagon-like peptide-1 receptor agonists (GLP-1 RAs) and continuous glucose monitors (CGMs) have both seen increasing utilization in type 2 diabetes (T2D) due to their well-documented abilities to improve glycemic control.1,2
GLP-1 RAs are a cornerstone in T2D management due to their many benefits. These agents lead to improved glycemic control and weight loss through several mechanisms.3,4 Their glucose-dependent mechanism results in a low risk of hypoglycemia, making them a safer alternative to insulin in many cases. 5 GLP-1 RAs are now recommended not only as second-line therapy after metformin but also as first-line agents in patients with T2D who have established atherosclerotic cardiovascular disease, chronic kidney disease, or high cardiovascular risk. 6
CGMs are the standard of care in type 1 diabetes and their recommended use has expanded in the T2D population to include those using insulin or at risk for hypoglycemia. 7 Unlike traditional finger-stick monitoring, CGMs provide glucose values every one to five minutes, viewable on a user’s smartphone and allowing for data capture and automated alerts. Recent studies including both prospective randomized controlled trials and real-world studies highlight the benefits of CGMs in T2D, and a recent meta-analysis suggested that two to four months of CGM use can reduce glycated hemoglobin (HbA1c) levels by 0.55%. 8
While the benefits of CGMs and GLP-1 RAs independently have been shown in numerous studies, there has been limited investigation on their combined use in T2D. This study uses a large administrative healthcare claims and prescriptions database to prepare two matched cohorts of patients with T2D: patients receiving GLP-1 RAs only and patients receiving GLP-1 RAs who subsequently initiated CGM use. Changes in HbA1c were evaluated longitudinally, and statistical modeling was applied to estimate the incremental impact of CGM initiation on glycemic outcomes.
Methods
Study Design and Population
This retrospective, observational cohort study used IQVIA’s US open-source longitudinal medical and prescription claims databases from 2019 to 2023. These databases include unadjudicated institutional and professional medical claims and pharmacy transactions, covering approximately 191 million patients and over 4 billion annual prescriptions. All data were de-identified and linked at the patient level using anonymized identifiers.
Eligible individuals were adults aged ≥18 years with a diagnosis of T2D, identified using International Classification of Diseases, 10th Revision (ICD-10) codes (E11.x), who had at least one prescription for a GLP-1 RA, one recorded HbA1c measurement within the 12 months prior to the index date (defined as the date of first GLP-1 RA prescription), and at least one additional HbA1c measurement within the 12-month follow-up. The follow-up period began on the index date for GLP-1 patients, and 90 days post-CGM initiation for GLP-1 RA + CGM patients. Comorbidities were identified using ICD-10 diagnosis codes.
HbA1c values were identified using CPT Category II codes reported in percentage‑based categorical ranges: 3044F (HbA1c <7.0% or <53 mmol/mol), 3051F (HbA1c ≥7.0% and <8.0% or ≥53 mmol/mol and <64 mmol/mol), 3052F (HbA1c ≥8.0% and ≤9.0% or ≥64 mmol/mol and ≤75 mmol/mol), and 3046F (HbA1c >9.0% or >75 mmol/mol), with outcomes presented according to these predefined categorical groupings. Patients with <75% GLP-1 RA stability, defined as days of supply between first and last GLP-1 RA prescription, were excluded. Stability was assessed over 12 months from GLP-1 RA initiation (GLP-1 cohort) or 90 days post-CGM start (GLP-1 RA + CGM cohort).
CGM Definition and Cohort Assignment
Patients were stratified into two mutually exclusive cohorts based on CGM use. The GLP-1 RA + CGM cohort included individuals with ≥1 claim for CGM use after initiation of GLP-1 RA therapy; individuals with CGM exposure prior to GLP‑1 RA initiation were not included to enable assessment of CGM as an add‑on to GLP‑1 RA therapy. The GLP-1 RA cohort included individuals with no evidence of CGM use throughout the observation period. CGM use was identified using CPT/HCPCS codes and National Drug Codes (Full Code List in Supplemental Table 1) corresponding to CGM sensors, transmitters, receivers, monitors, and related supplies.
Figure 1 summarizes the timelines from GLP-1 RA start to follow-up HbA1c measurements for both cohorts. In the GLP-1 RA cohort, follow up began at GLP-1 RA initiation, with a 12-month pre-index period used to assess baseline characteristics. HbA1c values were assessed at baseline and at three, six, nine, and 12 months post-initiation.
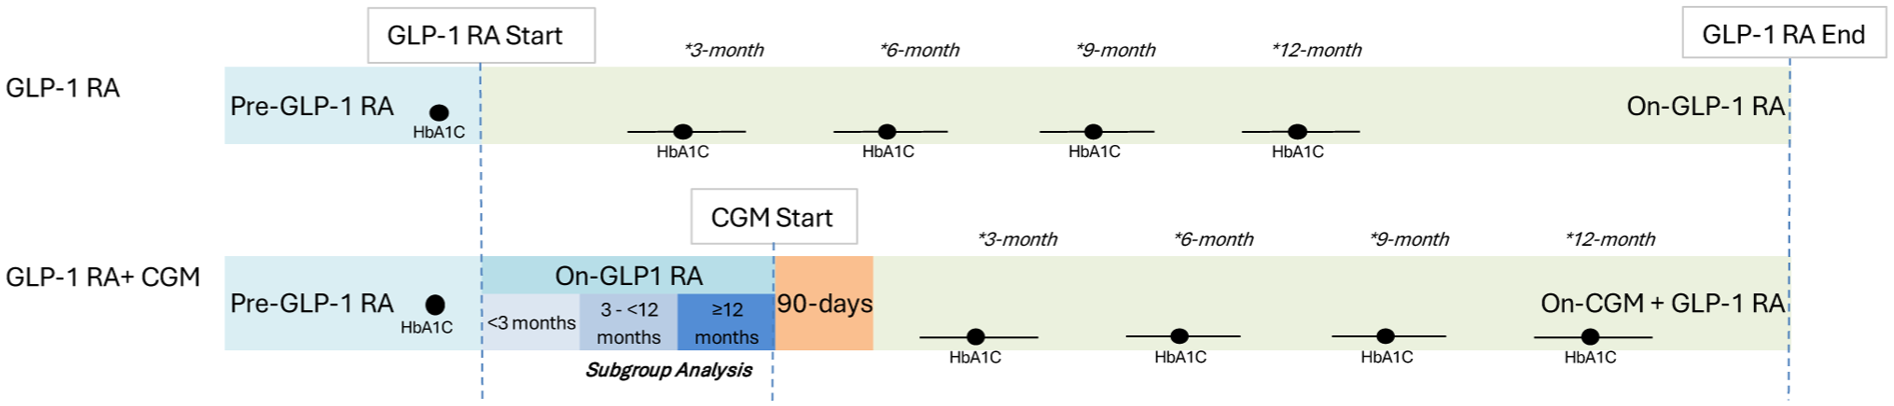
Illustration of study timelines including data from matched populations.
For the GLP-1 RA + CGM cohort, follow up began 90 days after the first CGM claim to allow for treatment stabilization. HbA1c assessments were conducted at three, six, nine, and 12 months after this start point. For each interval, a single HbA1c measurement closest to the prespecified time point was selected within a ±1.5‑month window for analysis, such that the actual range of included time points spans from 1.5 to 13.5 months. Subgroups were created based on GLP-1 RA duration prior to CGM initiation (less than three months, three to <12 months, ≥12 months), with matched GLP-1 RA comparator cohorts prepared for each subgroup.
Outcomes and Covariates
The primary outcome was the change in HbA1c during the year post-index. Baseline HbA1c was defined as the single value closest to and including the index date.
Demographic and clinical features included age, sex, GLP-1 RA formulation, and duration based on medical and prescription claims. Binary indicators captured insulin use, other antidiabetic medications, statin therapy, and comorbidities during the 12 months preceding GLP-1 RA initiation. Comorbidities were defined using ICD-10 codes as described in Supplemental Table 1. They included cardiovascular disease, ischemic heart disease, hypertensive disease, atrial fibrillation, heart failure, obesity, chronic kidney disease, sleep apnea, and diabetic ketoacidosis.
Statistical Analysis
Descriptive analysis summarized categorical variables as frequencies and percentages and continuous variables as means, standard deviations, medians, and interquartile ranges. Propensity score (PS) matching was performed to minimize confounding between treatment groups. The PS, defined as the conditional probability of receiving GLP-1 RA therapy with CGM versus without CGM, was estimated using logistic multivariable regression models including baseline covariates associated with both treatment assignment and outcomes (eg, age, sex, baseline HbA1c, insulin use, and other antidiabetic medications). Each GLP-1 RA + CGM patient was matched with up to four GLP-1 RA only patients using a greedy nearest-neighbor matching algorithm without replacement and a caliper width of 0.2 standard deviations of the PS logit. Covariate balance after matching was assessed using standardized mean differences (SMDs), with values <0.1 considered acceptable, and visual inspection of covariate distributions. Unmatched patients were excluded.
Associations between CGM initiation and changes in HbA1c were assessed using mixed-effects logistic regression models. Two models were constructed: one comparing HbA1c decreases versus stable/increased values, and another comparing increases versus stable/decreased values. Fixed effects included CGM exposure, time, and their interaction; random effects accounted for within-patient correlation arising from repeated measures within PS-matched sets. No additional covariates were included, as baseline characteristics were balanced through PS matching.
Subgroup analyses further stratified the GLP-1 RA + CGM cohort by the interval between GLP-1 RA initiation and CGM initiation (less than three months, three to <12 months, and ≥12 months), with matching and outcome analyses repeated using the same methodology for each subgroup.
All statistical analyses were performed using R version 4.1.
Results
Baseline Patient Characteristics
A total of 87 701 patients were assessed for inclusion, with 18 617 patients receiving GLP-1 RAs and a CGM and 69 084 receiving only GLP-1 RA. After sequential application of inclusion and exclusion criteria (Supplemental Table 2), including CGM initiation timing, HbA1c availability, age, and GLP-1 RA stability, there was a final analytic cohort of 29 940 patients including 2 934 GLP-1 RA + CGM patients and 27 006 GLP-1 RA-only patients. Low HbA1c data availability and GLP-1 RA stability requirements were the primary reasons for exclusion.
Table 1 shows the demographic and clinical characteristics before and after PS matching. Prior to PS matching, significant differences (absolute value of SMD > 0.1) were noted in seven categories. The largest differences prior to matching were baseline HbA1c levels and insulin usage, which were both higher in the GLP-1 RA + CGM group (69.8% vs 55.7% with baseline HbA1c > 9% and 60.5% vs 41.2% using insulin). Continuous glucose monitor patients also had a longer observed duration of GLP-1 usage and a lower average age. Dulaglutide and semaglutide were the most common GLP-1 RAs, and GLP-1 RA + CGM patients were more likely to have used more than one type of GLP-1 RA.
Patient Demographic and Clinical Characteristics Before and After PS Matching (GLP-1 RA+CGM and GLP-1 RA Patients).
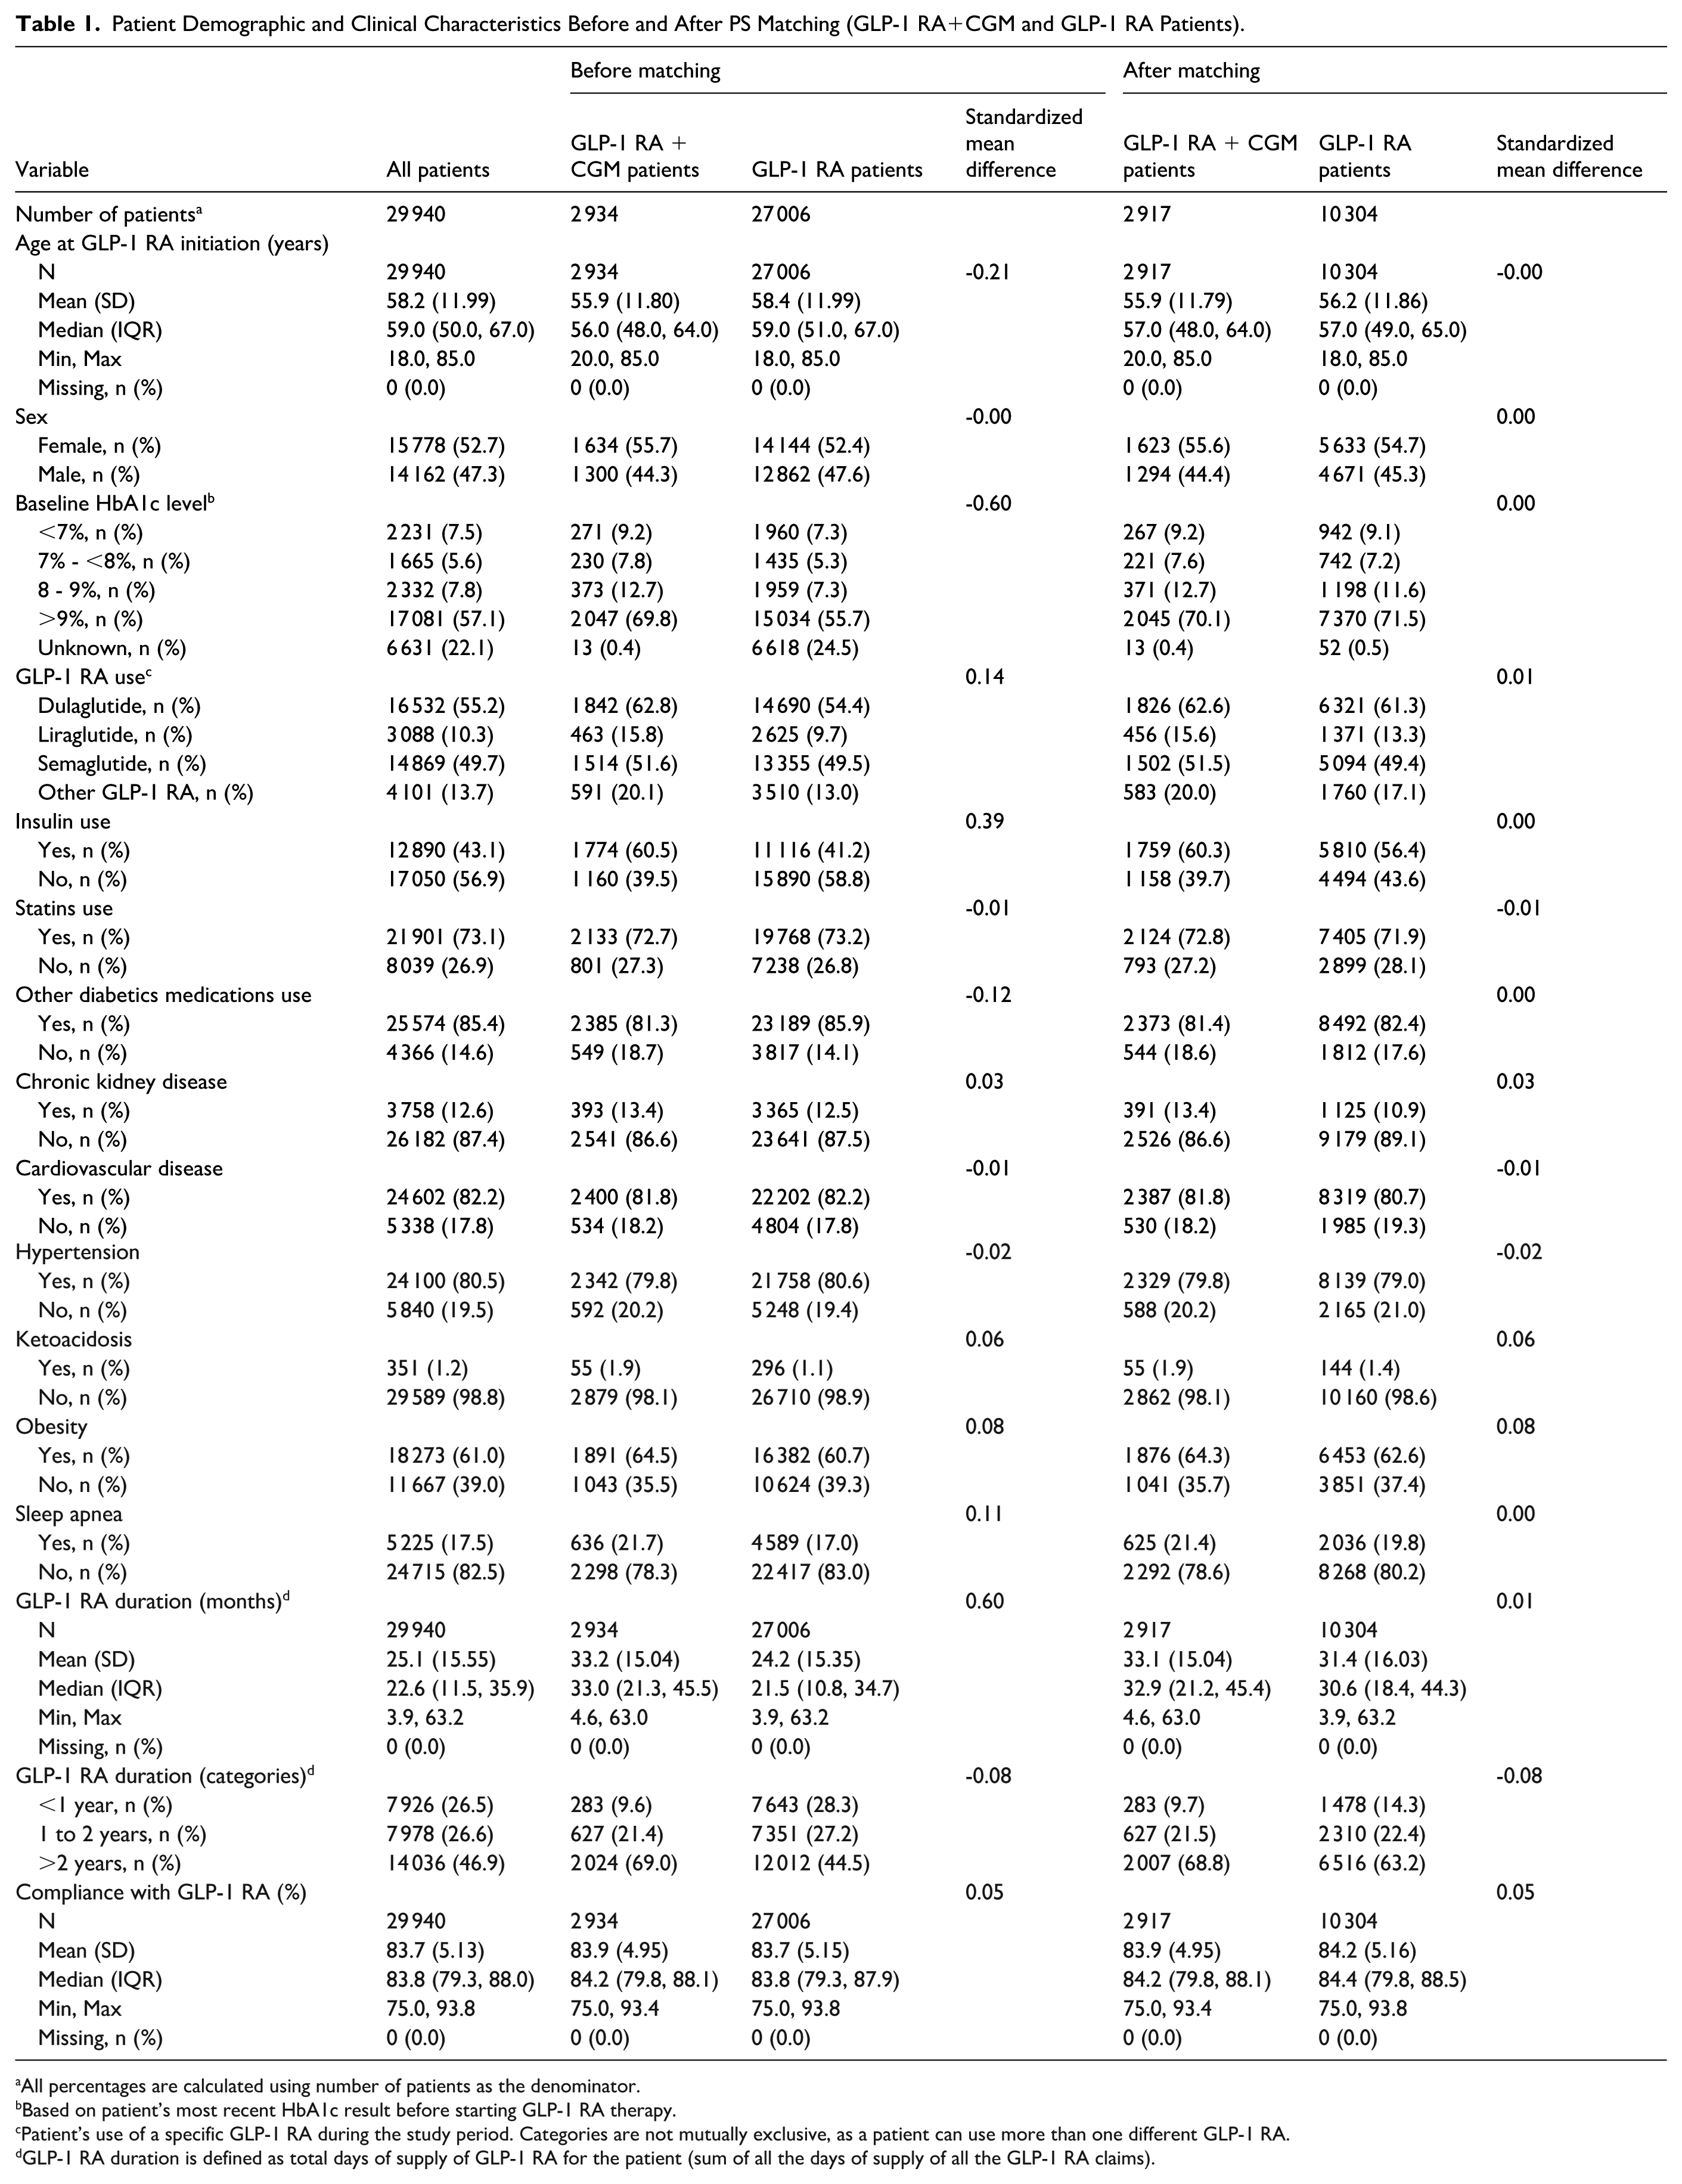
All percentages are calculated using number of patients as the denominator.
Based on patient’s most recent HbA1c result before starting GLP-1 RA therapy.
Patient’s use of a specific GLP-1 RA during the study period. Categories are not mutually exclusive, as a patient can use more than one different GLP-1 RA.
GLP-1 RA duration is defined as total days of supply of GLP-1 RA for the patient (sum of all the days of supply of all the GLP-1 RA claims).
After PS matching, all SMDs were within an absolute value of 0.09 or less. Most of the adjustments came from removing patients in the GLP-1 RA cohort. After matching, 2917 patients remained in GLP-1 RA + CGM and 10 304 patients remained in GLP-1 RA.
HbA1c Distribution by Timepoint
The distribution of HbA1c levels by cohort at each follow-up timepoint is shown in Figure 2. At baseline, the distributions were similar with approximately 70% of patients having HbA1c greater than 9%. The distribution of HbA1c levels shifted downward over time for both groups such that the percentage of patients with HbA1c levels greater than 9% was only 31% for the GLP-1 RA + CGM group and 44% for the GLP-1 RA-only group by 12 months. At this timepoint, 23% of GLP-1 RA + CGM patients and 20% of GLP-1 RA-only patients had levels below 7%.
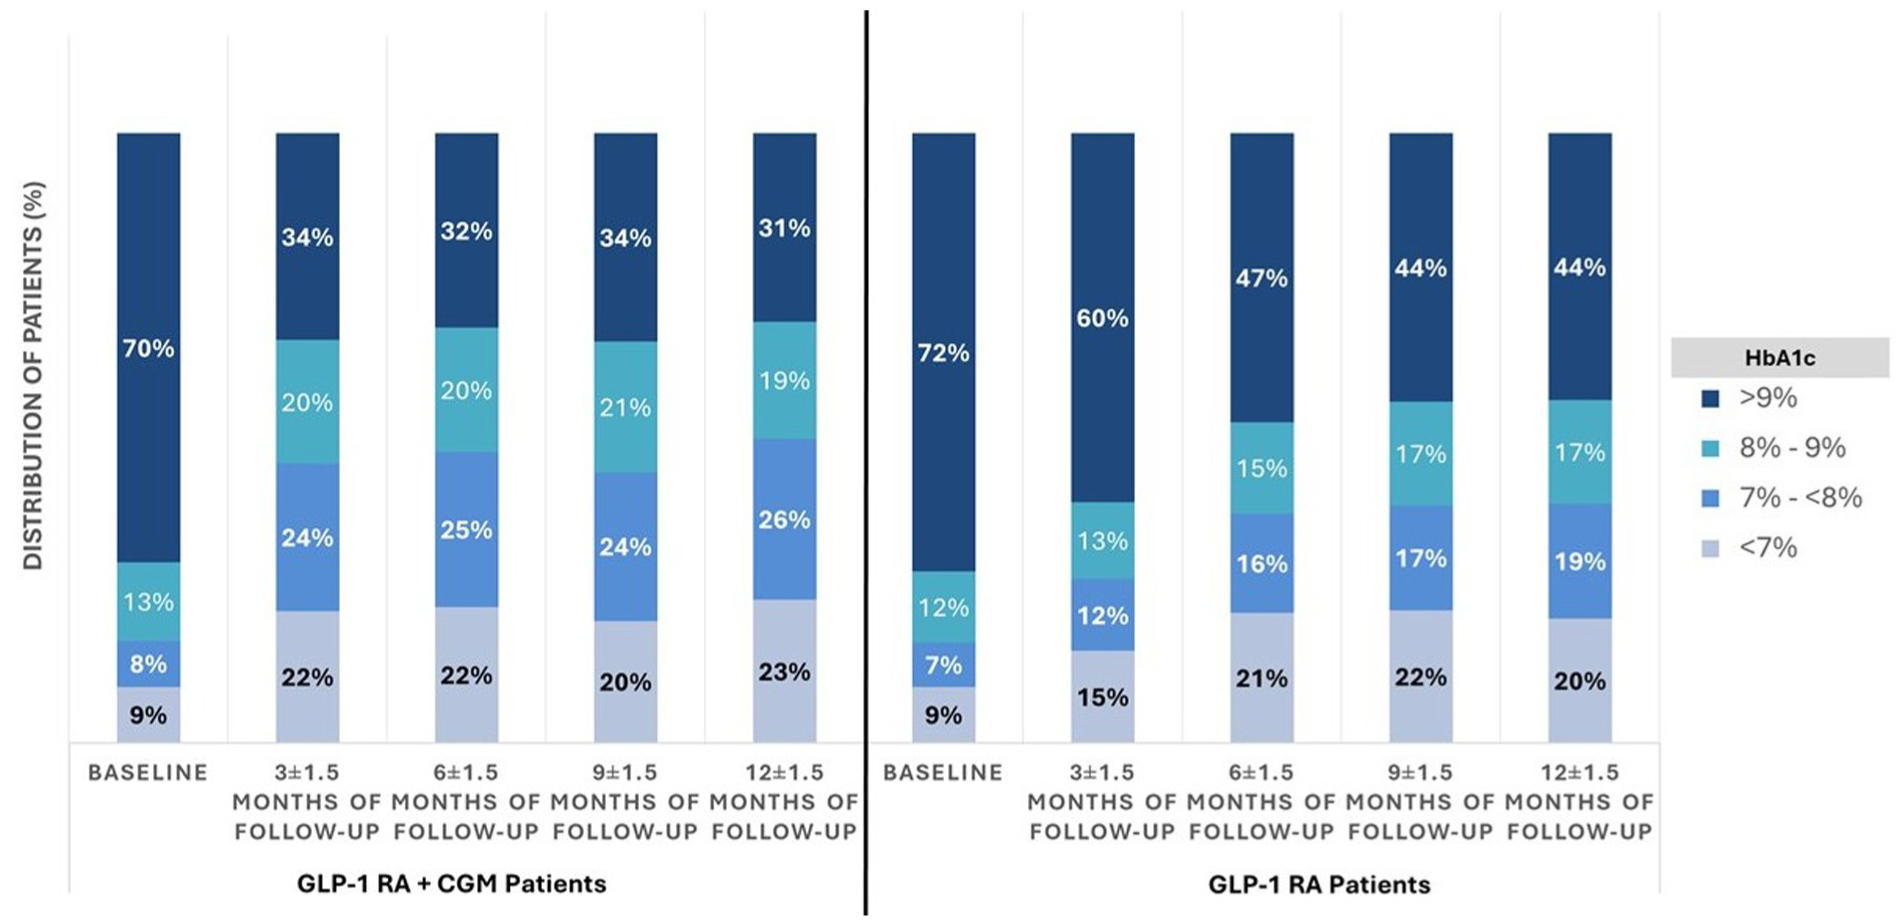
Distribution of HbA1c levels by timepoint for GLP-1 RA and GLP-1 RA + CGM matched patients.
Subgroup Analysis of HbA1c Changes
An important aspect of the study design was to assess the effect of adding CGMs to a population of patients already receiving GLP-1 RA drugs. Time points for evaluating HbA1c changes in the CGM group were based on follow-up starting 90 days after CGM initiation and did not include additional time on GLP-1 RA alone prior to CGM initiation. It is known (and shown in our data) that duration of GLP-1 RA exposure correlates with decreasing HbA1c levels. To address this, a subgroup analysis based on duration of treatment with GLP-1 RA prior to CGM initiation was performed with results shown in Figure 3. For GLP-1 RA + CGM patients, the percentage that decreased was 50% or higher after CGM initiation regardless of the prior duration of GLP-1 RA usage. In contrast, only 28% and 42% of the GLP-1 RA patients showed a decrease at three and 12 months, respectively (Figures 3a and b).
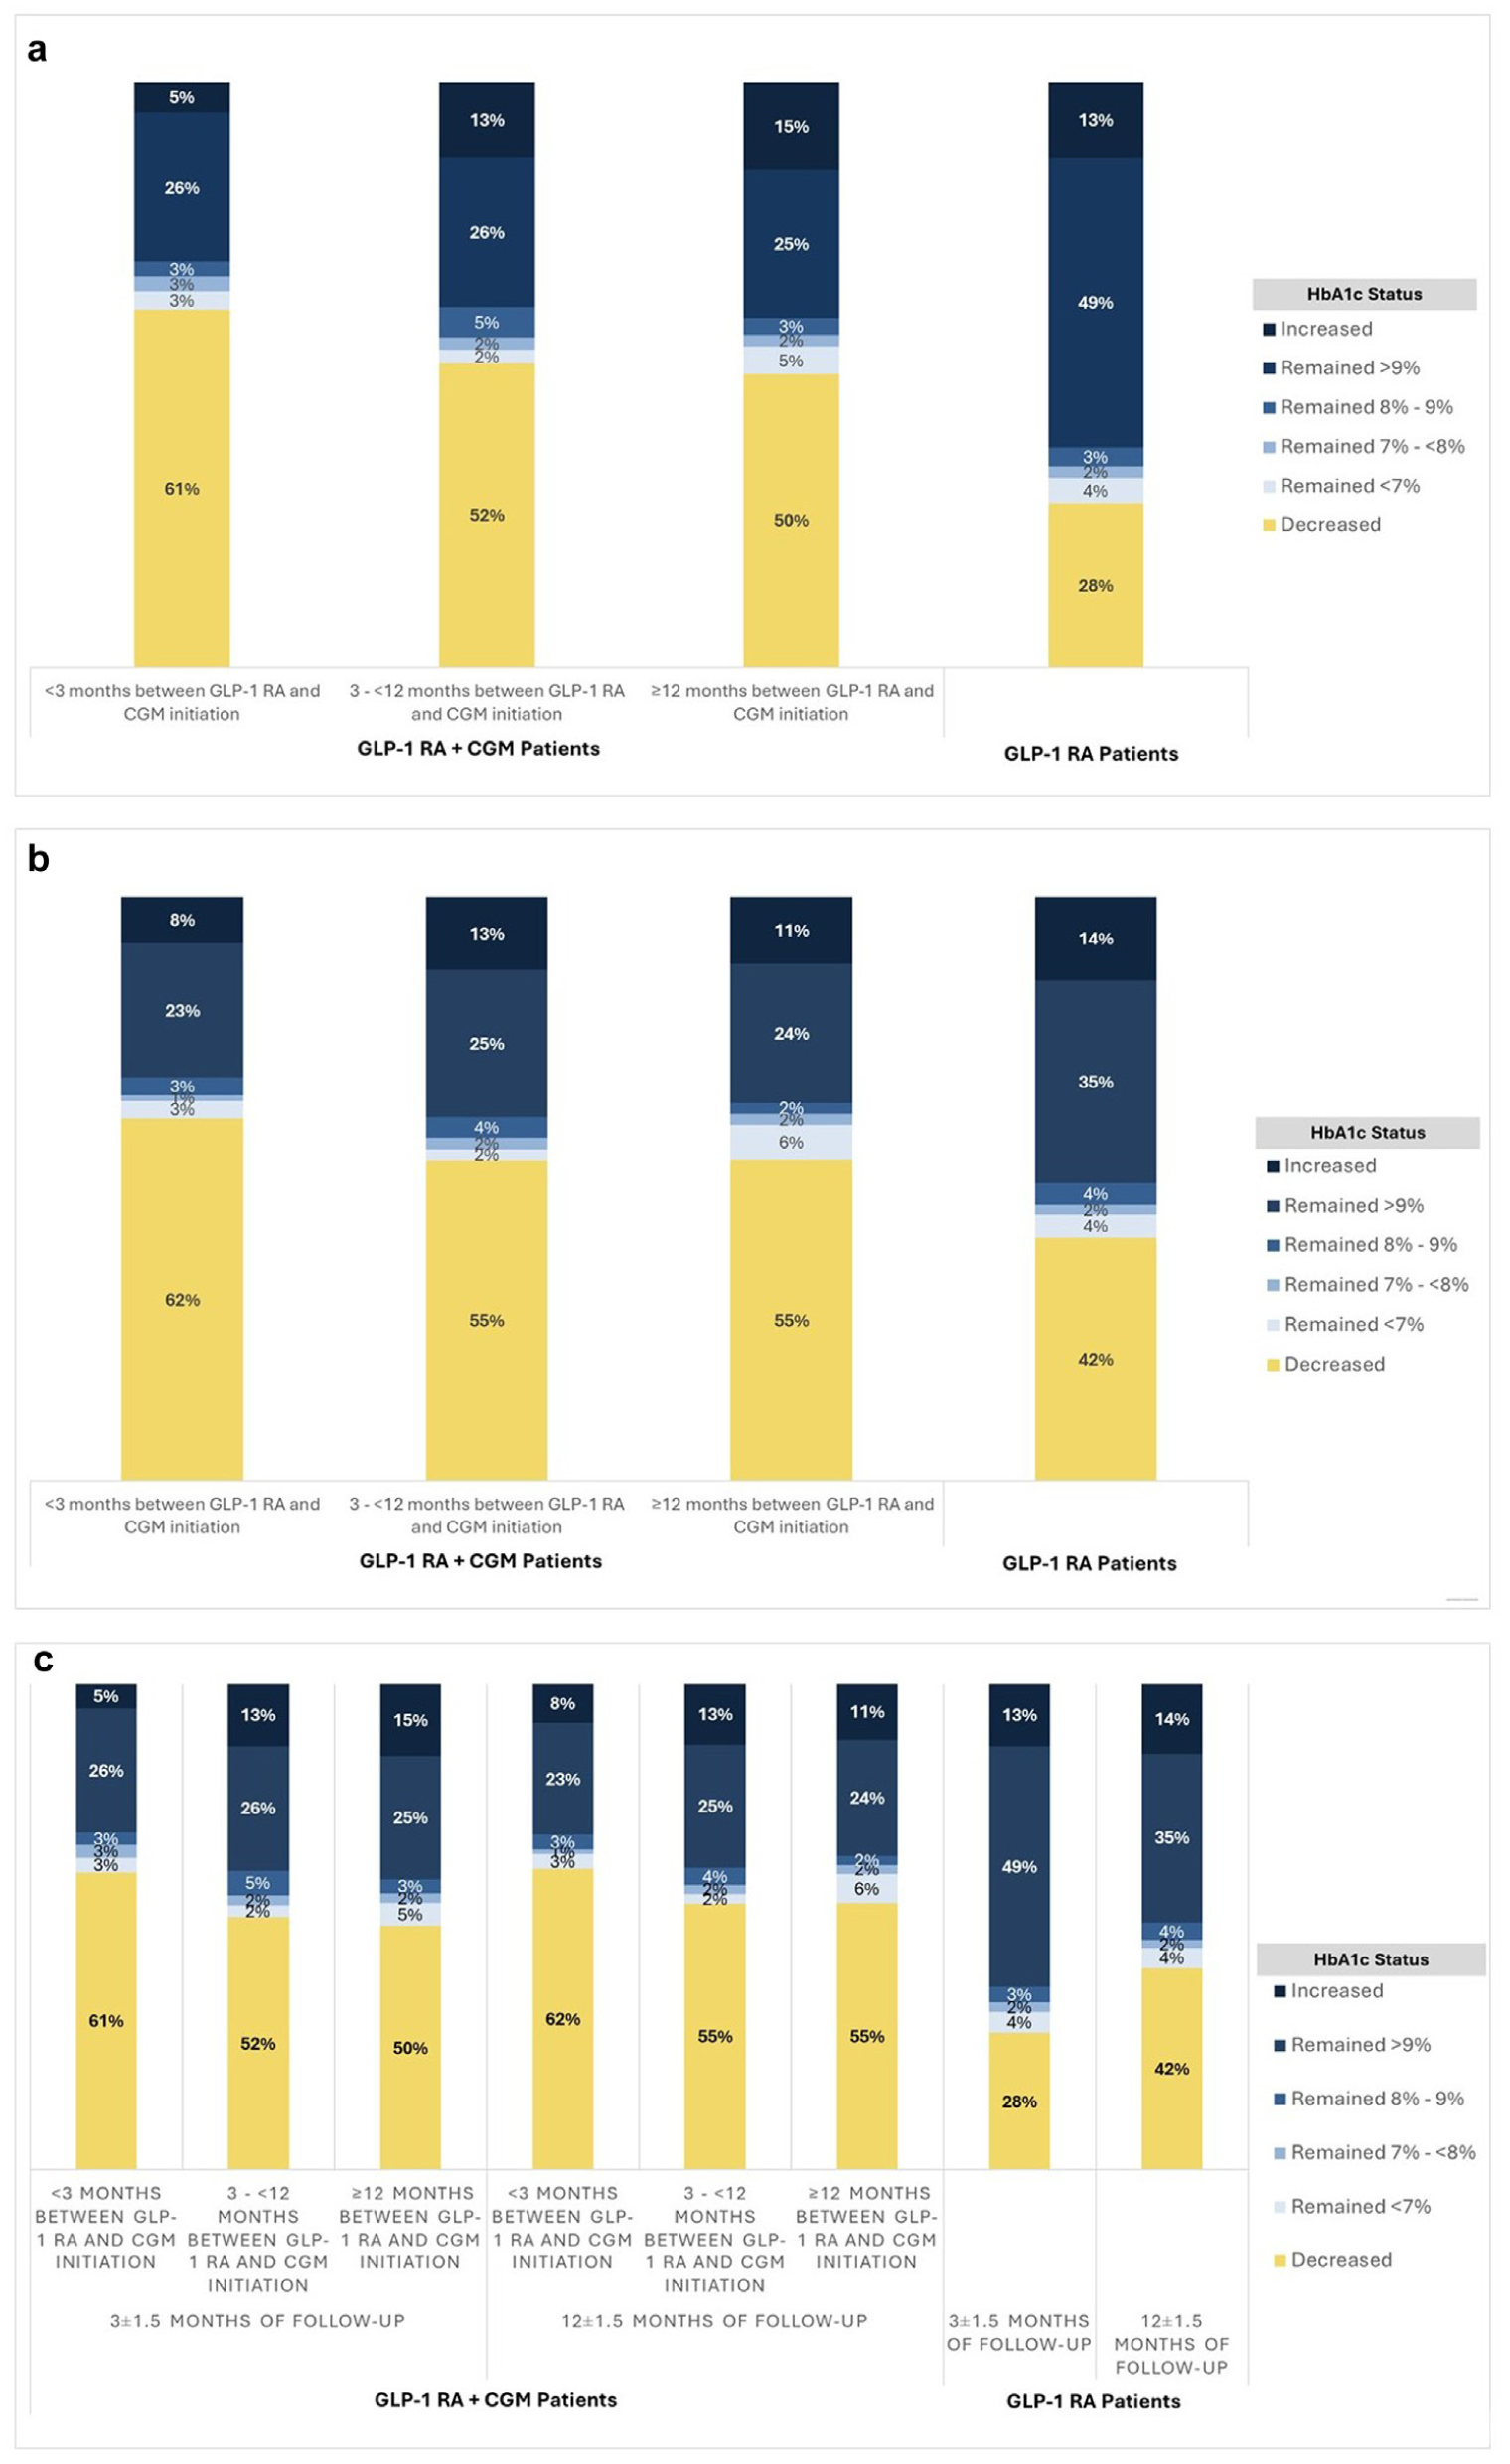
Comparison of change in HbA1c levels based on subgroups of time on GLP-1 RA before CGM initiation. (a) Distribution of change from baseline HbA1c by timepoint (matched GLP-1 RA + CGM and GLP-1 RA patients) at 3 ± 1.5 months of follow-up. (b) Distribution of change from baseline HbA1c by timepoint (matched GLP-1 RA + CGM and GLP-1 RA patients) at 12 ± 1.5 months of follow-up. (c) Distribution of change from baseline HbA1c by timepoint (matched GLP-1 RA + CGM and GLP-1 RA patients).
Regression Modeling
Mixed effects regression modeling was performed to determine the effect of time and CGM exposure on decreasing versus increasing/stable HbA1c or increasing versus decreasing/stable HbA1c. Results for decreasing versus increasing/stable HbA1c for the subgroups (for both less than three and ≥12 months between GLP-1 RA and CGM initiation) are shown in Figure 4. Results for the same subgroups for increasing versus decreasing/stable are shown in Supplemental Figure 1. Time, CGM exposure, and the combination were all found to be significantly associated with greater odds for decreasing HbA1c (Figure 4a and d). This was true regardless of the time spent on GLP-1 RA prior to CGM initiation. The odds ratio (OR) of decreasing HbA1c for GLP-1 RA + CGM patients versus GLP-1 RA patients was calculated for each subgroup (Figure 4b and e). The ORs favored GLP-1 RA + CGM for all timepoints across all subgroups. The OR was higher for GLP-1 RA + CGM with shorter exposure to GLP-1 RA prior to CGM (27.82 [95% CI: 15.49-49.99] for less than three months exposure vs 19.77 [95% CI: 15.13-25.82] for ≥12 months exposure). The OR declined with follow-up time in all subgroups. The predicted probabilities of decreasing HbA1c levels were also calculated across timepoints for each subgroup (Figure 4c and f) and again confirmed higher probability of decreasing HbA1c for CGM utilization with the difference decreasing over exposure time.
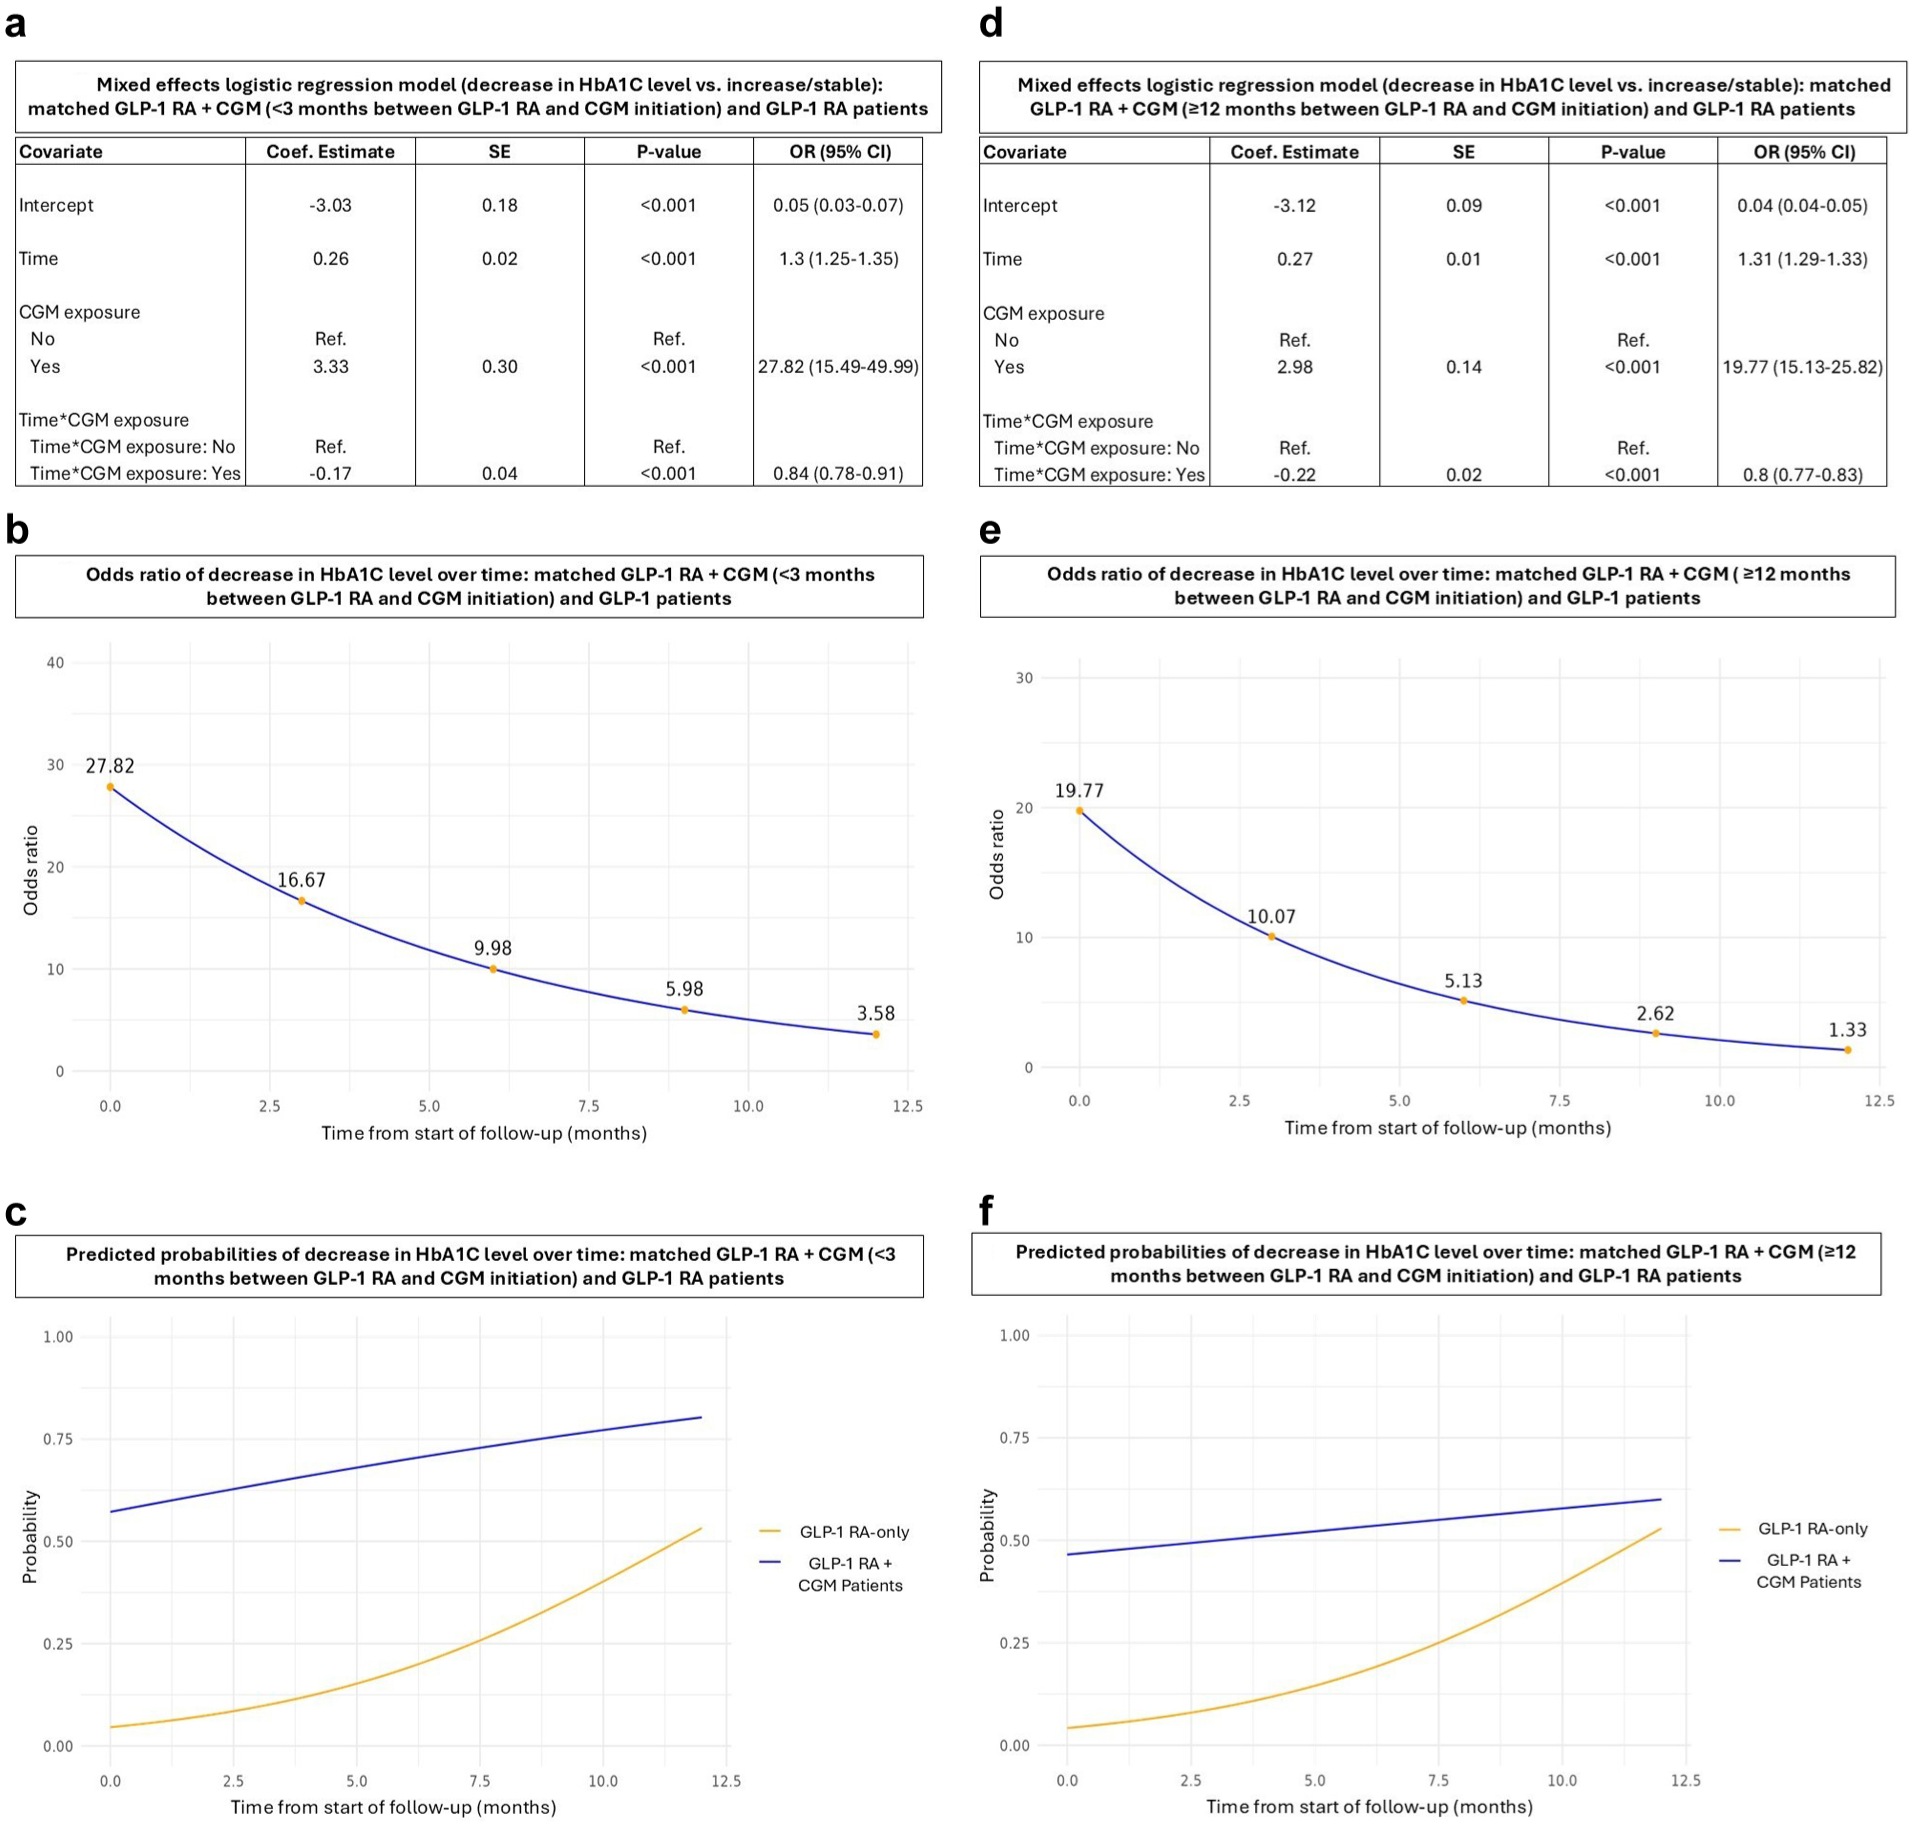
Regression model, odds ratio and predicted probabilities of decrease versus increase/stable HbA1c levels over time by subgroups.
Discussion
This study contributes meaningfully to diabetes care by demonstrating the additive benefit of combining CGM use with GLP-1 RA therapy. Our approach allowed assessment of the incremental effect of CGM independent of the effect of GLP-1 RA therapy. Strengths of this study include the broad inclusion of CGM brands and GLP-1 RA classes, the evaluation of time on each therapy, and the use of PS matching on a wide array of patient demographic and clinical factors.
This analysis shows that both CGMs and GLP-1 RAs improve glucose management in diabetes. Continuous glucose monitor use resulted in a greater proportion of patients achieving HbA1c reductions and accelerated the rate of improvement. Glucagon-like peptide-1 receptor agonist therapy alone effectively lowered HbA1c, but the effect was time-dependent.
Among matched GLP-1 RA-only patients, the proportion with HbA1c >9% decreased from 73% at baseline to 62% at three months, 50% at six months, and stabilized at 46% to 47% from nine months onward. In contrast, among GLP-1 RA + CGM users, the proportion with HbA1c >9% fell to 34% at three months after CGM initiation and further to 31% by 12 months. Regression analysis confirmed significant effects for both time and CGM exposure on HbA1c reduction, with ORs indicating significantly higher likelihood of HbA1c improvement among patients initiating CGM.
The finding that CGMs accelerate the response to GLP-1 RAs has meaningful clinical implications. By reducing the time spent with poorly controlled blood glucose, the risk of T2D complications is mitigated. Glucagon-like peptide-1 receptor agonists have side effects and associated costs which can limit duration of treatment. A recent study estimated that close to 50% of patients with T2D discontinue these drugs within one year. 9 Adding a CGM ensures that a patient is more likely to achieve sustained glucose control.
This study aligns with and extends recent evidence from publications using retrospective claims and EMR data examining combined CGM and GLP-1 RA use. Nemlekar et al 6 assessed the change in lab A1C values for patients receiving semaglutide with and without CGM usage. Using a difference-in-differences analysis, they showed that each approach reduced HbA1c but that CGM led to an incremental 0.55% decrease over semaglutide alone. Using exact matching on gender, age, payer, and baseline HbA1c, the difference-in-differences effect was mitigated but still significant at 0.19%. The Nemlekar study also found that the percentage of patients with HbA1c <7.0% was 87% for CGM users compared with only 20.7% for the control group. Notably, the study only matched on a limited number of patient factors and did not report on the timeframe for semaglutide or CGM usage.
A 2024 publication from Abbott researchers analyzed the changes in HbA1c at six months for patients on GLP-1 RAs who received a CGM. 10 They showed a reduction in HbA1c levels of 1.5% and that 29% more patients had HbA1c levels below 7% after CGM use. This study did not include a control cohort, making it difficult to isolate the effect of the CGM. Another publication from this team compared matched cohorts of patients who started on CGM and GLP-1 RAs simultaneously (±30 days) with those on GLP-1 RA-only. 11 A difference-in-differences analysis showed a 0.37% incremental reduction in HbA1c levels for the group using CGM and GLP-1 RA compared with GLP-1 RA-only. A follow-up study evaluated cost effectiveness of combined CGM and GLP-1 RA usage. 12 This study used the DEDUCE (Determination of Diabetes Utilities, Costs and Effects) model that considers treatment costs for CGM and GLP-1 RA and the resulting improved utility and reduced complications. The researchers found that the combined therapy cost $40,968 per quality adjusted life year (QALY) gained, which is below typical willingness-to-pay thresholds of $100,000 per QALY or more. Outside of claims-based analysis, there is additional evidence on the combination benefits, including a recent study that showed a greater 12‑month HbA1c reduction when CGM was added to GLP‑1 RA therapy (−0.58%) compared with GLP‑1 RA alone (−0.35%). 13
Compared with previous studies, this analysis used a propensity score-matched control that incorporates a wide range of patient factors known to influence diabetes management.14-18 This study also explored the effect of duration of GLP-1 RA and CGM usage compared with other studies which either did not report time or looked only at a six-month interval.
There are some limitations to this study. It is retrospective and relies on health care claims data, which does not include all the data types and outcomes available through more traditional trial approach. There can be incorrect or missing data as a result of coding practices, in addition to other limitations in real-world data sources. 19 Importantly, there may be differences in patients that choose to manage their diabetes using a CGM versus GLP-1 RA alone that are not accounted for. These may reflect factors such as better compliance with disease management, better access to care, socioeconomic status, or a more engaged diabetes health care practitioner.
Another limitation of this work is that the HbA1c levels are based on ICD-10 codes for ranges rather than actual laboratory values. While the codes assign patients into groups segmented by 1% range of HbA1c, the data did not include specific readings. Using the ICD-10 codes may also miss meaningful changes in HbA1c if they do not result in movement into a new diagnostic group. For example, a change from 7.9% to 7.1%, which is clinically meaningful, would not be detected.
Another consideration in this study was that the follow-up timeframe was different between cohorts. This was necessary to ensure matched baseline patients in each cohort and that the impact of the CGM could be measured starting at time zero (90-day washout after CGM initiation). Consequently, the follow-up timepoints in the initial analysis do not represent a head-to-head comparison. To address this, we conducted a subgroup analysis stratifying GLP-1 RA + CGM patients by the duration of GLP-1 RA use prior to CGM initiation. Across all subgroups, HbA1c reductions after CGM initiation were similar, indicating that the observed improvements are attributable to CGM use rather than an artifact of longer GLP-1 RA exposure in the CGM cohort.
Conclusions
This retrospective health care claims study suggests that adding CGM to GLP-1 RA therapy accelerates and enhances glycemic improvement compared with GLP-1 RA alone. These findings support combined use to optimize T2D management.
Future research should explore these findings and assess the long-term economic and clinical outcomes of combined approaches. Studies incorporating continuous laboratory HbA1c values could increase statistical precision, while randomized, prospective studies could eliminate potential for bias. Additional research should also evaluate alternative treatment‑sequencing strategies, including in individuals with established CGM use prior to GLP‑1 RA initiation, to better characterize the incremental benefit of GLP‑1 RA therapy among patients already using CGM.
Further exploration of differential effects by GLP-1 RA class and CGM device type may also identify subgroups that derive the greatest benefit.
Supplemental Material
sj-docx-1-dst-10.1177_19322968261450596 – Supplemental material for Changes in HbA1c With Glucagon-Like Peptide-1 Receptor Agonist Therapy Alone and Followed by Initiation of Continuous Glucose Monitoring: A Retrospective Analysis of U.S. Medical Claims Data
Supplemental material, sj-docx-1-dst-10.1177_19322968261450596 for Changes in HbA1c With Glucagon-Like Peptide-1 Receptor Agonist Therapy Alone and Followed by Initiation of Continuous Glucose Monitoring: A Retrospective Analysis of U.S. Medical Claims Data by Joe McGonigle, Maria Castro, Yulia Shilyaeva, Doneal Thomas and Michelle Edwards in Journal of Diabetes Science and Technology
Supplemental Material
sj-docx-2-dst-10.1177_19322968261450596 – Supplemental material for Changes in HbA1c With Glucagon-Like Peptide-1 Receptor Agonist Therapy Alone and Followed by Initiation of Continuous Glucose Monitoring: A Retrospective Analysis of U.S. Medical Claims Data
Supplemental material, sj-docx-2-dst-10.1177_19322968261450596 for Changes in HbA1c With Glucagon-Like Peptide-1 Receptor Agonist Therapy Alone and Followed by Initiation of Continuous Glucose Monitoring: A Retrospective Analysis of U.S. Medical Claims Data by Joe McGonigle, Maria Castro, Yulia Shilyaeva, Doneal Thomas and Michelle Edwards in Journal of Diabetes Science and Technology
Footnotes
Acknowledgements
The authors thank Jill Dawson, PhD, for writing support.
Abbreviations
CGMs, continuous glucose monitors; GLP-1 RAs, glucagon-like peptide-1 receptor agonists; HbA1c, glycated hemoglobin; ICD-10, International Classification of Diseases, 10th Revision; OR, odds ratio; PS, propensity scoring; SMD, standardized mean difference; T2D, type 2 diabetes.
Funding
The authors received no financial support for the research, authorship, and/or publication of this article.
Declaration of Conflicting Interests
The authors declared the following potential conflicts of interest with respect to the research, authorship, and/or publication of this article: All authors are full-time employees of IQVIA.
Supplemental Material
Supplemental material for this article is available online.
References
Supplementary Material
Please find the following supplemental material available below.
For Open Access articles published under a Creative Commons License, all supplemental material carries the same license as the article it is associated with.
For non-Open Access articles published, all supplemental material carries a non-exclusive license, and permission requests for re-use of supplemental material or any part of supplemental material shall be sent directly to the copyright owner as specified in the copyright notice associated with the article.